
Every business uses some kind of analytic tool to help them analyze business data and extract commercially relevant information that they can use to improve and increase performance. Analytic tools were originally made to evaluate and discover areas of the business that are actually doing what they are being paid for—and some not living up to their hype.
Analytic tools produce a lot of differing information that need to be processed carefully lest one goes inferring about data which may or may not at all be affecting the current state of your business. Therefore, choosing the right tool to use and when to use them may prove a bit daunting of a task with the wide variety of tools available today.
This article is written to serve as a guide to aid your decision in choosing the right tools that works for your business. Another section of the article deals mostly with Web analytic tools to help you stay competitive amidst the fast and ever-changing world of technology and, more importantly, the Internet.
What Are Analytic Tools?
Stripping it down to basics, analytic tools are business application software used in measuring and improving business operations performance. They are applications used to collect data regarding the factors involved in the operation of the business, allowing business owners to make informed decisions based on information obtained from data miners.
Basic Analytic Tools Every Business Should Know
Only a handful of business owners ever take time to use analytic tools in their daily business operations, much less apply their results to improve their businesses. It is undeniable to say that analytic tools are undervalued at this point in time. However, an emerging and growing number of businesses have adopted different types of models to analyze data, proving successful in applying the results of their findings.
There are various ways of processing data, and we will be discussing a few traditional means and a few newer methods that provide us a great deal of information needed to keep a business in stride and even stay ahead of the competition.
Note these categories of tools are in no way arranged via importance or chronology, but should be taken into consideration in relevance to its application to your business.
1. Visual Analytics

Us humans are visual creatures by nature and primarily rely on our senses, particularly sight, which takes precedence over all other senses. (The speed of light travels the fastest, which almost always instantly serves as basis for any perceived information.) Therefore, by creating a visual display such as a graph or Gantt chart to represent data, it becomes easier to analyze the data and spot patterns. This way, we are able to see the big picture rather than focus on the individual sets of data, making it particularly effective in analyzing huge volumes of data or information.
2. Experimental Design
Business experiments, A/B testing, and experimental design techniques are used in validity testing. It is simply an application of the experiments we usually conduct at school. A two-group setup, where one group is the control group (doing everything the usual way) and the other will be the experimental group (the group where any experimental changes are applied). Data is gathered from both and compared. This technique is extensively used where you are trying to decide between two or more possible options.
3. Regression Analysis
Regression analysis aims to establish the cause and effect between data variables. It is useful in determining if a known variable has a direct effect on the other. This technique is used in testing inferences or hypotheses connecting two or more variables that may or may not have a cause-effect relationship.

4. Correlation Analysis
This is one of many statistical techniques used to find a relation between two separate variables and gauging the strength of that relationship. This technique is quite useful in establishing a relationship between variables assumed to be having effects with each other.
5. Time Series Analysis or Forecasting
Data collected over uniformly spaced intervals is called “time series data.” This technique of time series analysis or forecasting primarily deals with such data. It explores the collected data to determine particular characteristics that may affect changes over a time period and predict effects based on collected history data.

6. Data Mining
Data mining is often used in connection to extensive amounts of data sets (commonly referred as “big data”). Such data sets are analyzed for commercial relevance suggestions, patterns and relationships to improve performance of a business.
7. Scenario Analysis
Also called as total return analysis is a process of analyzing the possibility of future events giving consideration to alternate possible results. This is often used when having uncertainty in taking a decision or course of action.
8. Text Analytics
Text analytics is extracting value from large quantities of text data. It helps you get information, recognize patterns, tag and annotate information, assess sentiment and for predictive analytics.
9. Image Analytics
Image analytics is a technique that uses information and understanding from images or photographs. It relies on pattern recognition, signal processing, and digital geometry. This technique is commonly used for facial recognition in relation to security purposes.

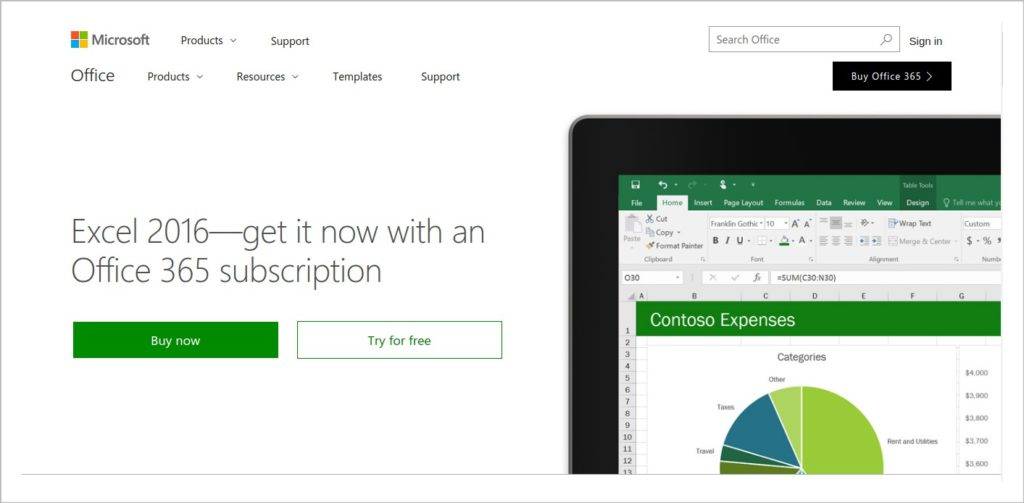
MS Excel
Who on this planet—barring the Apple purists—does not use Excel? Any individual in the business of analytics surely has used and is familiar with Excel or at the least Google Spreadsheets. Excel is heavy duty yet basic. Simply put, it is for the ambitious masses.
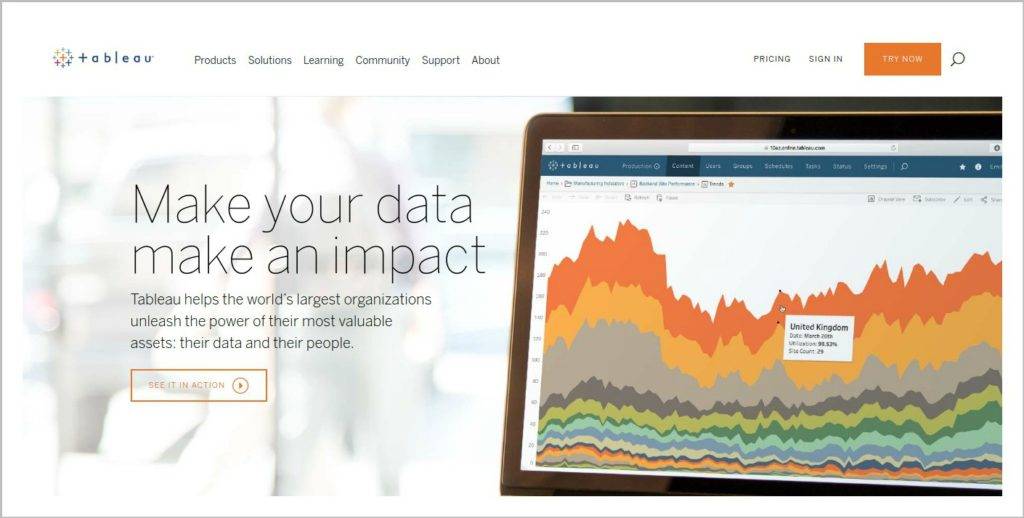
Tableau
Tableau users specially like its great visualizations and dashboards. Tableau is effectively better than Excel in terms of visualization and data handling. It is specially useful in making interactivity with the data and visuals.
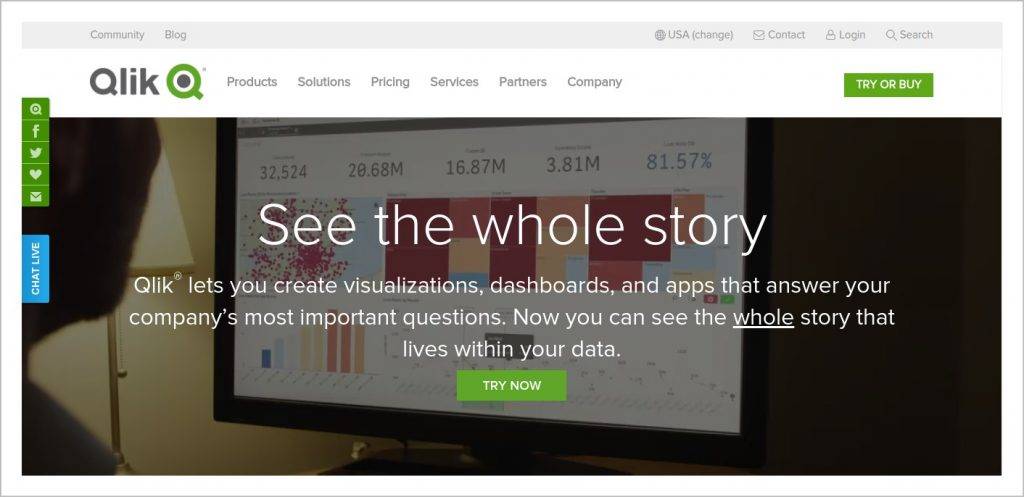
Qlikview
Much like Tableau, Qlikview is great when it comes to data visualization. It is reported to be slightly faster than Tableau and provides better flexibility for more advanced users as compared to Tableau’s slightly user friendly interface.
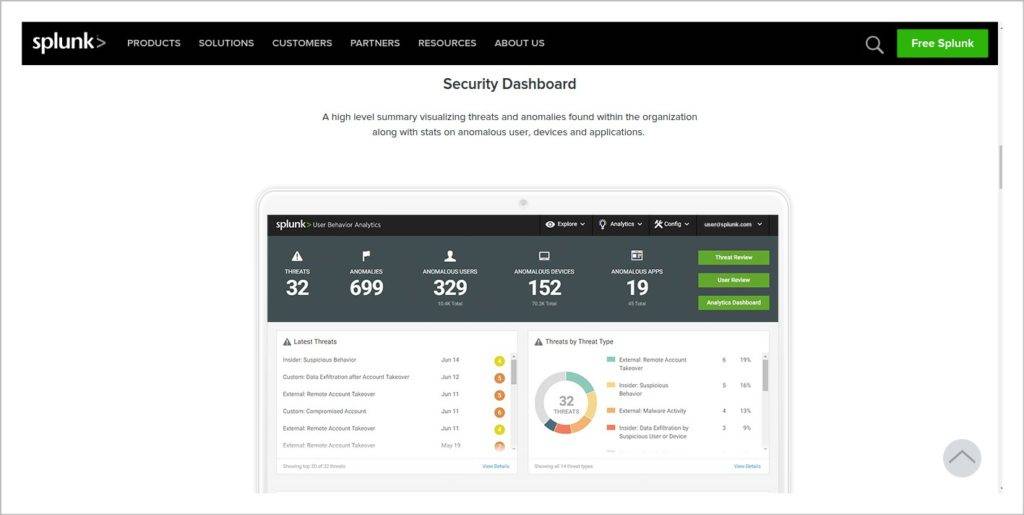
Splunk
Splunk started off use as processor of data machine log files which in recent times has become more than just that. It also boasts of better visualization options along with a Web interface making it easier to use.
What Is an Open Source Analytic Tool?
An open source analytic tool refers to analytic software using a source code that anyone can inspect, modify, and improve. The source code refers to the part of the software that most users do not get to see. It is the code used by programmers in changing pieces of a software that controls how a program or application works. Open source allows programmers to access the program’s source code and can make improvements by either adding features or fixing parts of the program.
Open Source Analytic Tools
With more and more businesses switching over to open source software due to the growing price of commercially available tools along with the flexibility that an open source software offers, demand has been steadily increasing for open source analytic tools in use for business.
Commercially available analytic tools are still viable and very much usable tools in the business. However, most businesses cannot utilize all the functions that a commercial analytic tool has to offer. In this regard, it would just mean as a waste of money on their part. Due largely to this, open source analytic tools have been steadily gaining support with all major businesses which gave optimal use of the software and most come for free.
R. Probably the most popular analytics tool today, R has marginally gained more users for companies as compared to SAS. R is more robust and flexible and handles data sets a lot better, topping the industry due to versatility in applications. Much of R’s success is mainly due to the fact that it seamlessly integrates to most big data platforms.
Python. Python is a favorite among programmers due to the language being easy to learn. And with advancements and developments to analytical and statistical libraries, Python is becoming the tool of choice for many, offering a wide coverage of statistical and mathematical functions. Quite a deadly combo if anyone should ask.
Apache Storm. When moving data or channeling data in via continuous stream, Apache Storm is the big data tool of choice.
Apache Spark. Spark is specially targeted on working with large volumes of unstructured data. Spark is best used for static data and provides easy integration with a lot of platforms. Spark also features its own learning library best used in analytics.
PIG and HIVE. PIG and HIVE make integral tools for writing specific queries. PIG and HIVE behave like SQL, which is a language used in communicating with databases or largely used for database management. Most companies working with big data use specific platforms that both PIG and HIVE easily integrate into.
Who Are the Top Companies Using Open Source Tools?
The demand for open source tools has only been going up as more and more platforms are switching to open source programming via the open source initiative.
- Who uses R — Accenture, Cognizant, Google, Facebook, Genpact, MuSigma, Fractal Analytis
- Who uses Python – Alibaba, Google, Cognizant, Genpact
- Who uses Apache Storm – Groupon, Twitter, Yahoo, Spotify, Flipboard
- Who uses Apache Spark – Uber, Pinterest, Ola, Facebook, Wipro, Netlix
- Who uses PIG & HIVE – Yahoo, FB, Twitter, Baidu, Uber, Flipkart
Web Analytic Tools
For most companies, it is essential to have Web presence to measure up to the level of any competition. Web analytic tools exist to understand website performance, customer service levels, and in understanding competition. The following list accounts for some of the most popular and easy-to-use tools among Web tools. They are in no way the definitive best, but should rack up points to ease of use and integration ease into multiple platforms available.
- Google Analytics. The go-to platform for most marketers largely due to being free, and because of the Google branding that comes with it. Google Analytics provide data most relevant for retail sites and marketers—a way to track visitor activities to the site up until the whole sales process. Google analytics logs every visitor and all actions they take in your page.
- Bitly. Bitly is mainly known being a free link-shortener for your website. It also provides the tools that Google analytics offers and helpful reports that aid in analyzing activity over your site. It may generally not be able to provide you with as much information as Google analytics does but is a great option to have in case you are already using their link-shortener.
- Piwik. Piwik is another software program that offers similar features to other analytic programs. It also offers automatic email reports to keep you updated with the activities in your website so optimizing your site becomes easier.
- Clicky. Clicky offers very much the same things Google analytics does and more. Clicky’s interface is at best much cleaner looking and presents up to the minute results. Clicky also presents seamless integration to your Twitter account. The downside however is that Clicky does not come with a price.