A bowtie diagram is a tool that can help you visualize the risks that you are dealing with in just one comprehensible picture. The diagram is shaped like a bowtie, thus the name, which is the perfect shape for creating a distinct differentiation between proactive and reactive risk management. You may also see sales analysis examples.
A bowtie diagram boasts of its ability to give an overview of multiple plausible scenarios, each one more different yet just as possible as the last, in just one picture. It summarizes and simplifies what is originally difficult to explain and understand by explaining risks through a visual presentation. You may also see data analysis report.
Bow Tie Risk Analysis Example
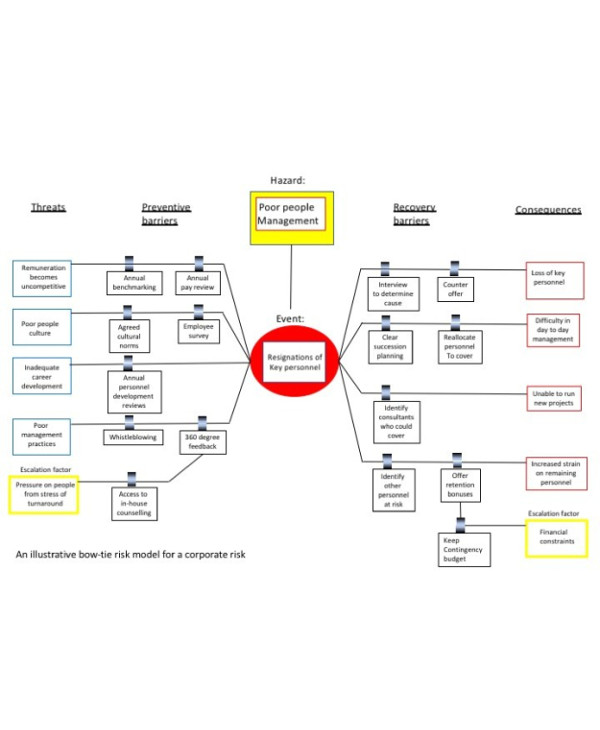
Corporate Risk as Shown in a Bowtie Model
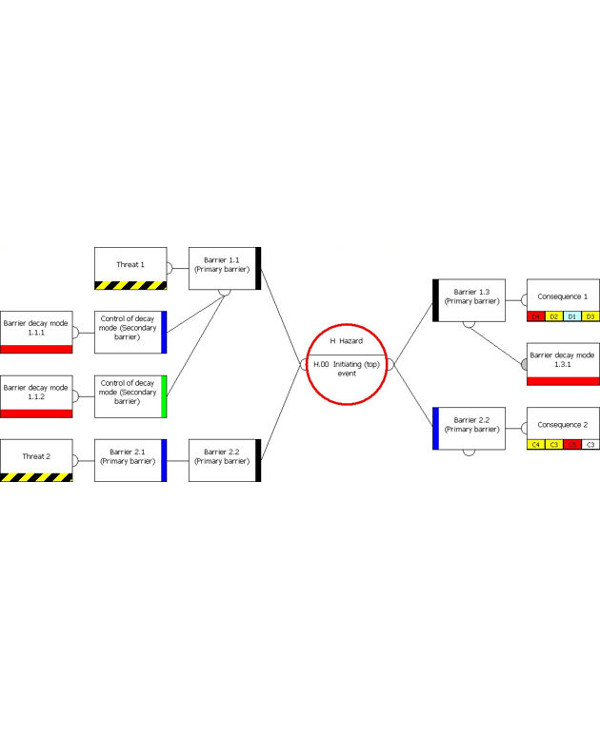
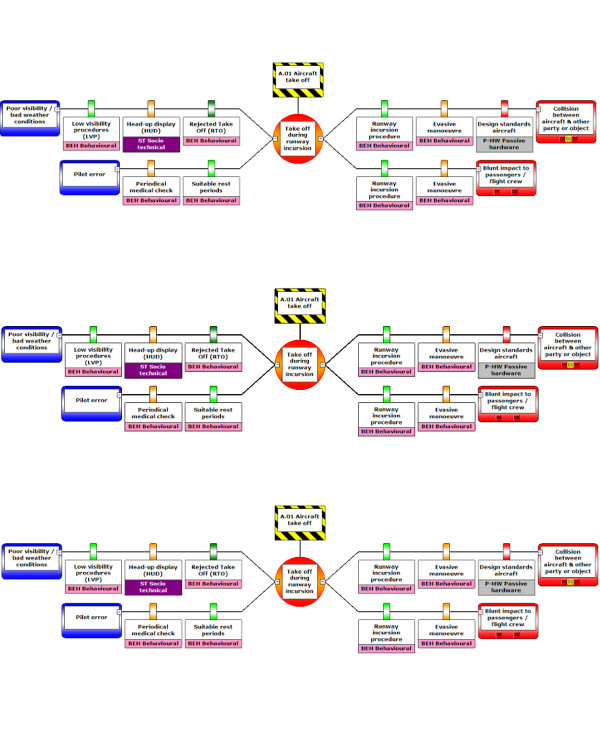
Active Bowtie Approach
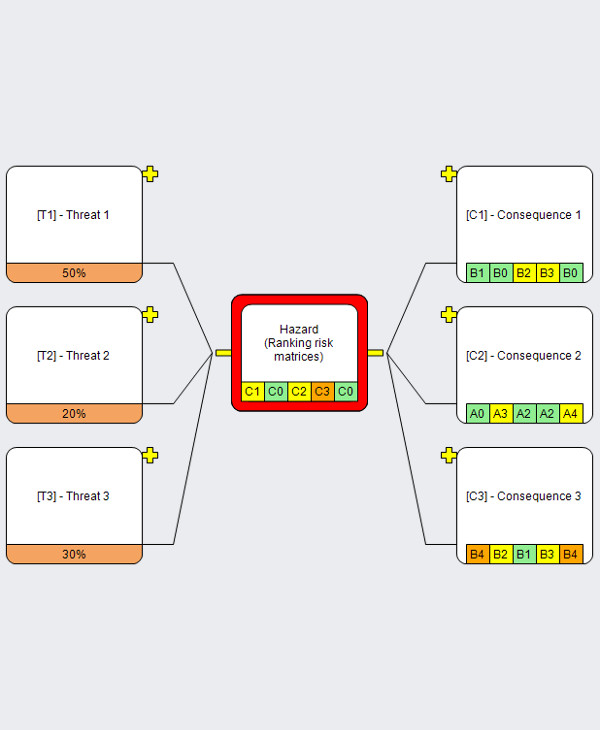
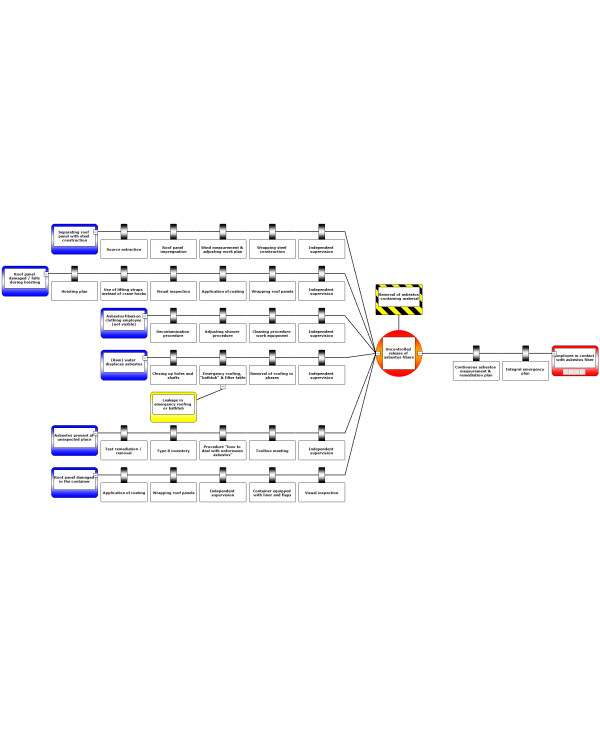
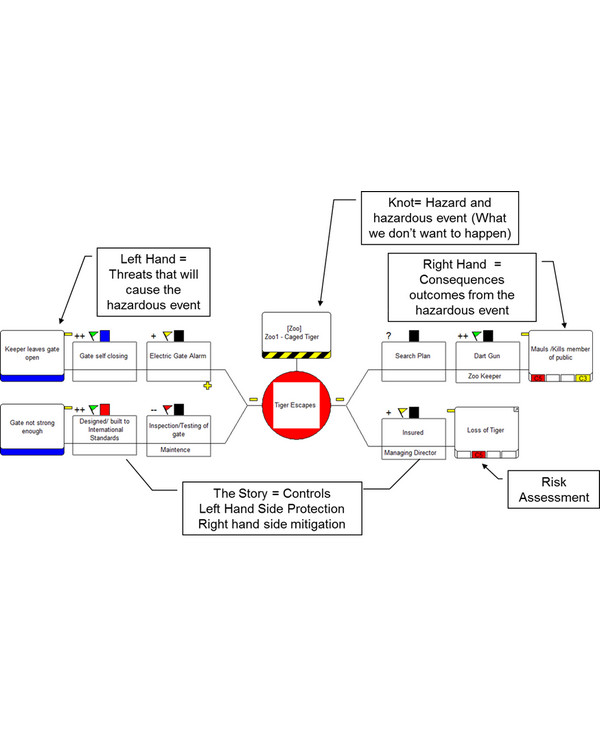
Bowtie Risk Analysis Visualization
The Bowtie Method
The bowtie method is a method for risk evaluation that can be used to analyze and demonstrate high-risk scenarios. The diagram helps achieve two things: first, it provides a visual summary of all plausible accident scenarios that may exist along with a potential hazard; second, it serves as a tool for a company to brainstorm for certain control measures that can be used to manage the scenarios. Once these two main points are settled, the bowtie method continues to be of use by identifying the ways in which the control measures my fail. You may also see requirement analysis examples.
The factors or conditions that may cause the failure of the control measures that have already been prepared are known as escalation factors. For this one, there is also another special type of barrier called an escalation factor barrier, which has an indirect yet crucial factor on the identified hazards. You may also see analysis examples.
Methodological Parents of the Bowtie Method
The direct origins of the bowtie method is quite unclear. However, there are other methods that were either the source for the concept, or which were developed later but can still be used to explain the type of thinking. So although the genealogy is quite unclear, we will have an idea about what logic preceded it. You may also see regression analysis examples.
1. Fault tree analysis
The fault tree was created back in 1962 and quickly became popular in the nuclear and aviation industry. It uses gates to model causal relationship between events, and the method is often used to model the causality of unwanted events. The original fault tree was often quantified with failure probabilities. The left side of the bowtie diagram is a simplified Fault Tree. You may also see free analysis examples.
One of the most unique of all bowtie method items is the Escalation Factor which is used to identify and demonstrate the weaknesses in controls which can open the vulnerabilities of the system as a whole. These potential failures are neglected in a Fault Tree Analysis, although it does paint a very specific picture. If the goal is to thoroughly analyze all possible interactions between forces in an organization, a fault tree is perfectly capable of doing that. You may also see critical analysis examples.
2. Event tree analysis
The right side of the bowtie diagram resembles an Event Tree. But where the event tree looks for probabilities and frequency information, a bowtie aims at making sure that the controls are working properly while continually asking the question, “Are we doing enough, or should we implement more safety measures?”
The bowtie method is most often used for analyzing scenarios where major hazards are present, and where consequences might be so bad that keeping control of them is of the utmost importance, regardless of the actual possibility of the consequences. You may also see event cost analysis.
3. Causal factors charting
In the bowtie method, causality mapping is found in the relationship between threats, the top event, and its consequences. It can also be found between controls and its escalation factors. Causal factors charting is mainly used for analyzing incidents, while the bowtie method is more appropriate for proactive risk analysis. It does not only look at one causal factors chain but at all possible causal paths associated with the hazard. You may also see company analysis examples.
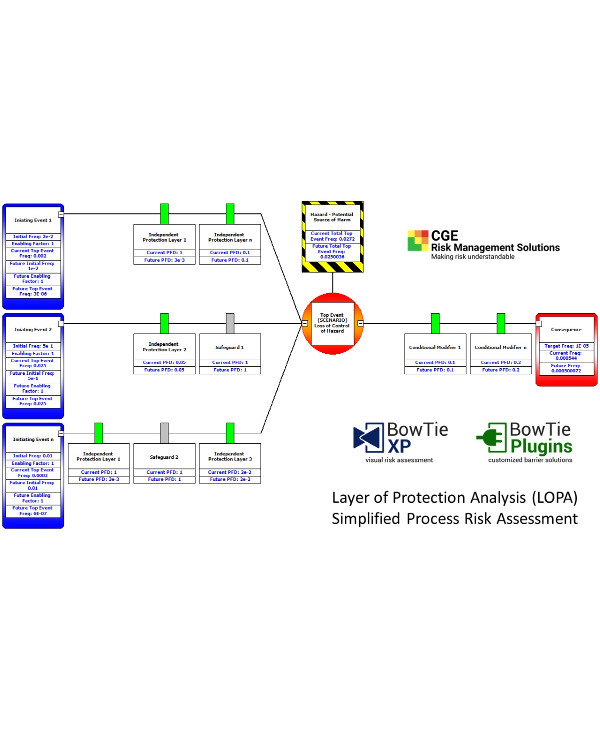
Protection Analysis Using the Bowtie Method
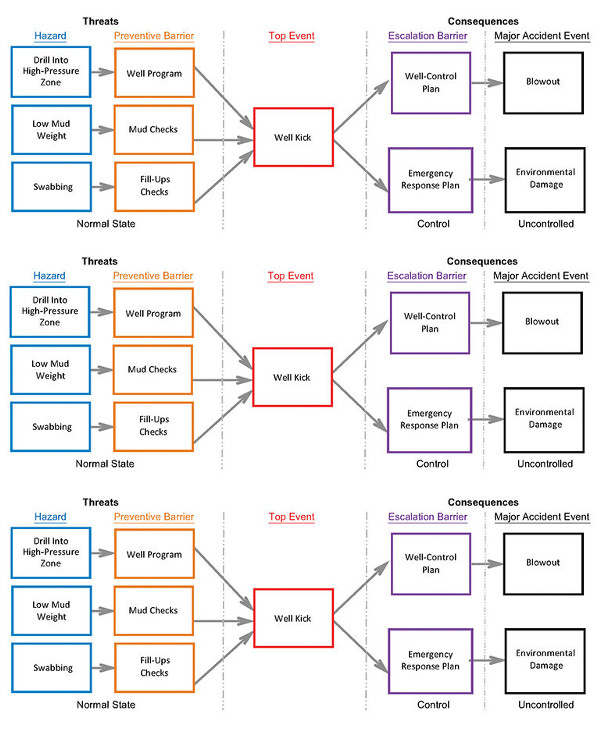
Bowtie Qualitative Risk Analysis Method Example
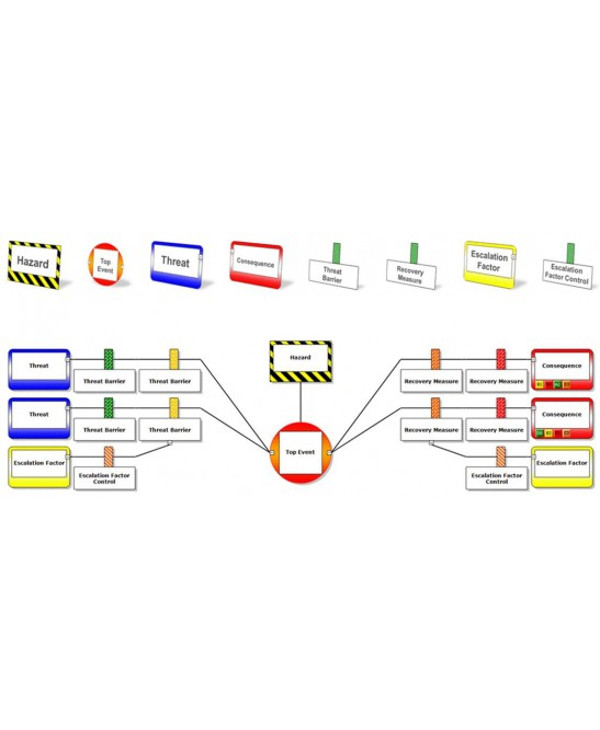
The Elements of a Bowtie Diagram
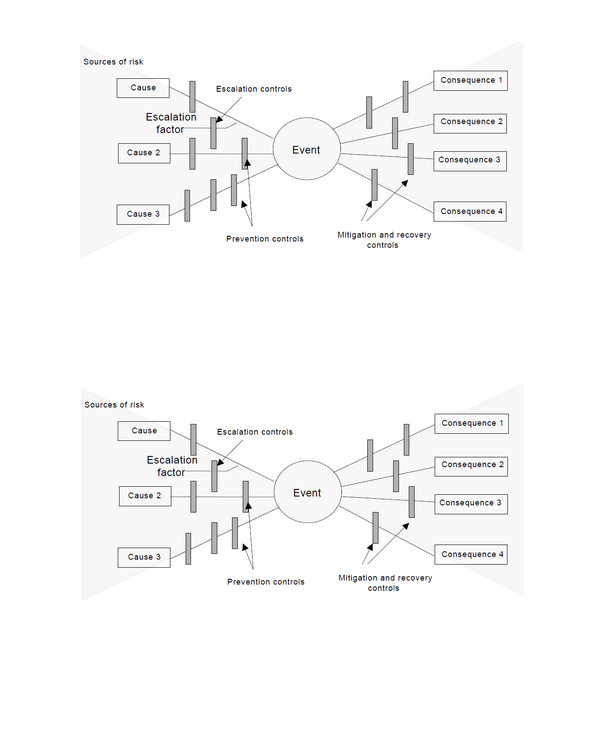
The bowtie diagram has eight elements: hazard, top event, threats, consequences, preventive barriers, recovery barriers, escalation factors, and escalation factor barriers.
1. Hazard
For building or interpreting a bowtie diagram, the best place to start is always with the hazard. The hazard will describe the potential source of harm that everyone will be facing should it be left untended. But this aspect doesn’t necessarily enumerate each danger directly present in the working environment. Instead, it creates a description of the environment in questions to set the context and scope for the bowtie. You may also see factor analysis examples.
For example, instead of stating that there are risks of vehicular accidents and pedestrian victims, it will describe how the office driveway is directly connected to a public highway. The rest will be silently filled in by whoever reads the analysis.
Hazards are, unfortunately, a natural part of every working environment. With that being said, avoiding or eliminating them isn’t always as easy as identifying them. Sometimes, doing so would alter the whole company’s momentum. Also, these hazards are often interconnected, which means that the direct danger you can see may not be the most pressing problem. You should instead focus on the ripples it will cause. You may also see organizational analysis examples.
Hazards are defined as a condition, object, or activity that has the potential to cause injuries to staff, damage to equipment and structures, loss of material, or reduction of ability to perform a responsibility. It is part of the bowtie analysis’s job to define the basic parameters within which the threats may take place.
The scope of the bowtie on the hazard may be as broad or as specific as it wants to be. However, the logical place to start is always with the bigger picture. From there, you can zoom in to details should the need arise. The level of detail you need to capture for your purpose is up to you. You may also see competitor analysis examples.
2. Top Event
The top event will describe the point where none of us no longer have enough control over the hazard, which makes it an unsafe state although it still can’t be considered an accident. Top events are not disasters, but they have the ability to become one. In other words, they are just accidents waiting for the right moment to happen unless you can find a way to put them under your control.
The top event is often described as a loss of control event and an undesired safety state. By taking this into consideration, we are able to consider multiple potential causes for losing control over the hazard and the possible outcomes. You may also see boundary value analysis examples.
3. Threats
Threats can be found in the left section of the bowtie diagram. These describe events that may cause an unsafe state or may make the environment dangerous if not managed with preventive measures. The threat and the top event often has a direct cause-and-effect relationship with each other, and it is important for the reader to understand this relationship based on how the threat is described. You may also see job task analysis examples.
It’s most helpful if you describe the cause of a particular event that may set off the subsequent scenario which can then result in the top event and other potential consequences. The threats to be discussed here must also be plausible enough. The bowtie’s usefulness will be maximized if it focuses on cases that have a high tendency of actually happening, rather than focusing on too extreme possibilities. You may also see business swot analysis examples.
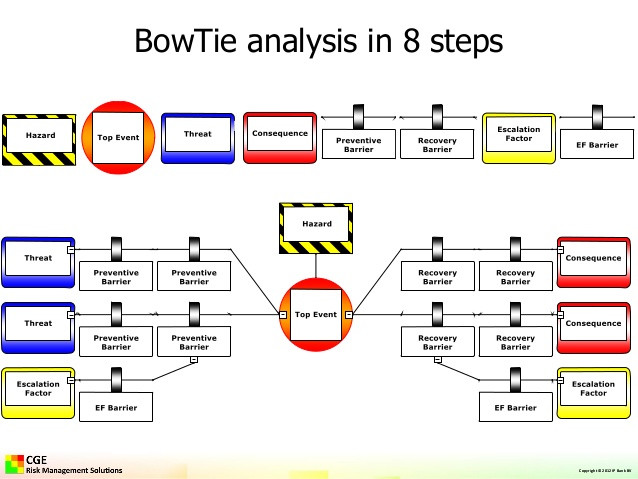
Bowtie Risk Analysis in 8 Steps
Bowtie Risk Analysis in the Construction Industry
Bowtie Risk Management Analysis
4. Consequences
If threats can be found on the left side of a bowtie diagram, consequences can be found on the right. It will describe whatever undesirable event can happen as a result of the top event that is not managed well. Consequences are the result of hazards being released. These can directly result in loss or damage. You may also see pest analysis examples.
When dealing with expressing consequences, operational terms must be used so that the scenario is clear to the reader. Consequences are events, they refer to the actual situations and happenings that are the result of the top results which have gone too out of control. They do not refer to the injuries or damages caused, but by the situation that lead up to them. You may also see customer analysis examples.
5. Prevention Controls
Prevention controls are defined as any measure taken that acts against any and all undesirable force or intention in order to maintain the desired peaceful state. It tries to look at two aspects of threat management: eliminating the threat completely and making sure that the threat is no longer present, and preventing the threat from developing into a top event if the threat does continue to exist. You may also see failure analysis examples.
In the bowtie analysis, what the control actually does must be clearly discussed with the reader’s comprehension as the main objective. The diagram must also include sufficient detail that can make the reader understand what the author is trying to say without the need for additional explanatory material.
6. Recovery Controls
Recovery controls’ job is similar to prevention controls: it will show how the scenario will be managed in order to stop an accident from occurring. Aside from mitigating the severity of the consequences, it will also reduce the likelihood of the top event developing into something worse than it already is.
Parallel versus sequential controls
Controls are always considered sequential, which means that if one fails, the next one would automatically come into play. However, parallel controls also exist. These have an either/or type of relationship. They exist simply to remind us that it is not safe to assume that controls are always sequential. There are several considerations that need to be examined. You may also see risk assessment examples.
Basic Bowtie Analysis Method Example
Bowtie Analysis Example
Bowtie Risk Analysis Template
7. Escalation Factors
The bowtie method also excels at adding information that can help examine how the controls may be degraded in a specific area. This will allow for an inclusion of a level of detail that is entirely appropriate to the management of controls. This is known as escalation factors. You may also see cluster analysis examples.
Escalation factors are defined as any condition that leads to increased risk by defeating or reducing the effectiveness of controls. It can’t directly cause the top event or the consequence, but it will make sure that the scenario in question will increase or progress because the associated control will be degraded. You may also see impact analysis examples.
Escalation factors need to be both credible and significant. Lessons from prior incidents and accidents must be understood and learned. Escalation factors that are too generic will not work. And, although it can be very helpful, an excessive use of escalation factors can make the size of the diagram explode, and this can affect your model’s readability. You may also see project analysis examples.
8. Escalation Factor Controls
This is the final step in terms of the bowtie method’s main elements: the addition of information that will describe how the escalation factors will be managed. It is defined as a control that manages the conditions which reduces the effectiveness of other controls. They don’t act on threats or controls directly, instead, they are acting to manage a particular escalation factor. You may also see decision tree analysis examples.