
People have different levels of perception–some comprehend immediately upon reading information presented in text, others understand better with pictures and graphic elements aiding texts. Still, many humans find it easier to understand information quickly through visual representations, such as chart examples.
Charts convey information through the aid of graphic symbols, images, and diagrams. There are several types of charts that we’re almost too familiar of, like flowcharts, pie charts, bar charts, etc., since we have been learning from them for quite a long time. One of such charts is a control chart, which we will be discussing in this post. You might want to refer to a few downloadable control chart examples below.
Basic Control Chart
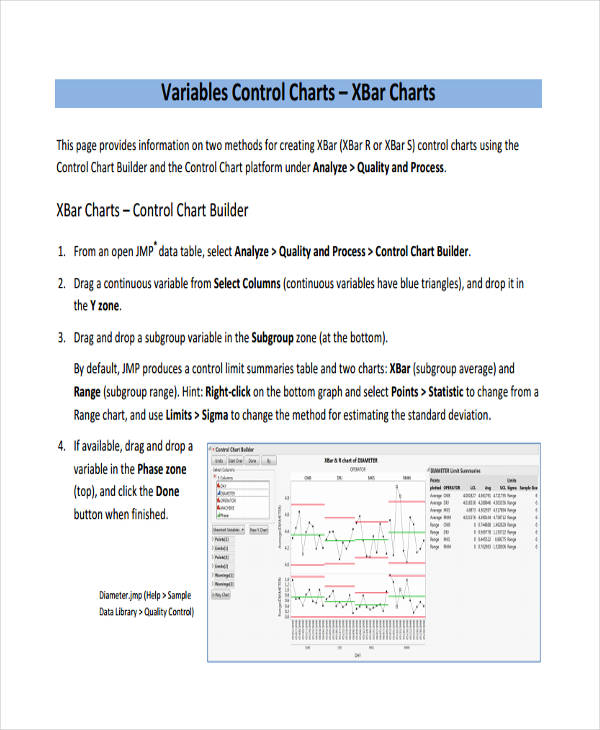
Variables Control Example
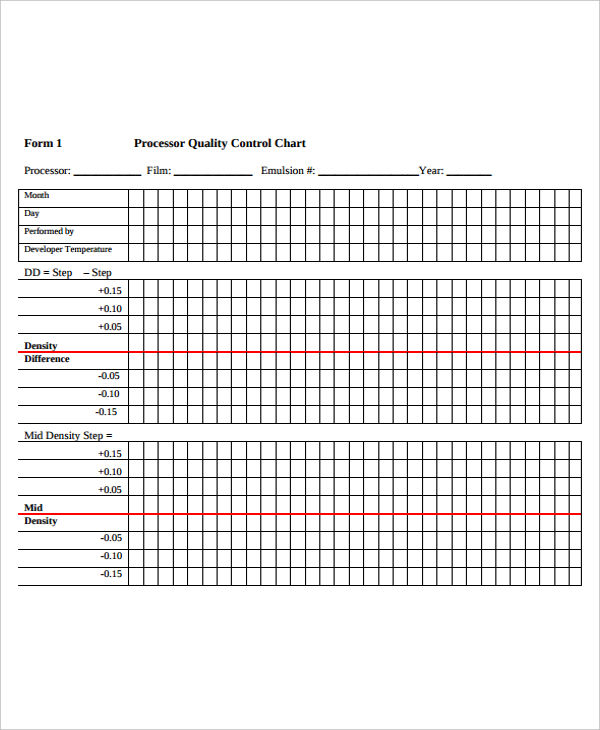
Quality Control Chart

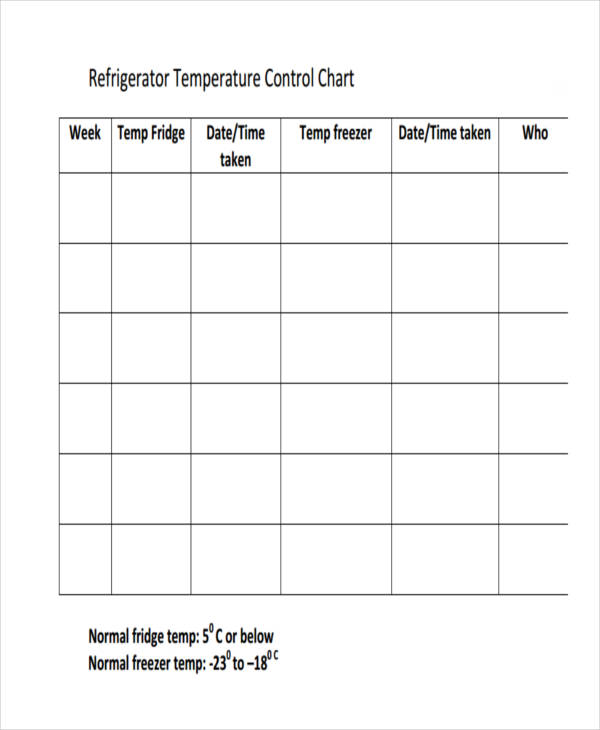
Temperature Control Chart
What Is a Control Chart?
A control chart (also referred to as Shew hart chart) is a tool which plots data regarding a specific process. Such data can be used to predict the future outcomes or performance of a process. Control charts are most commonly used to monitor whether a process is stable and is under control. Aside from that, control charts are also used to understand the variables or factors involved in a process, and/or a process as a whole, among with other tools. If a process is deemed unstable or out of control, data on the chart can be analyzed in order to identify the cause of such instability.
When to Use a Control Chart
Control charts are important especially if you want to ensure the success of an ongoing process, and ensure that everything is under control and according to plan. An organization uses a control chart for several reasons. Here are some of them:
- When monitoring stability and control of a process.
- When ensuring that an ongoing process is under control.
- When targeting problems affecting the process.
- When detecting any variable causing changes in the process.
- When analyzing what data and changes in data mean.
- When predicting outcomes of a certain process.
Blank Control Chart
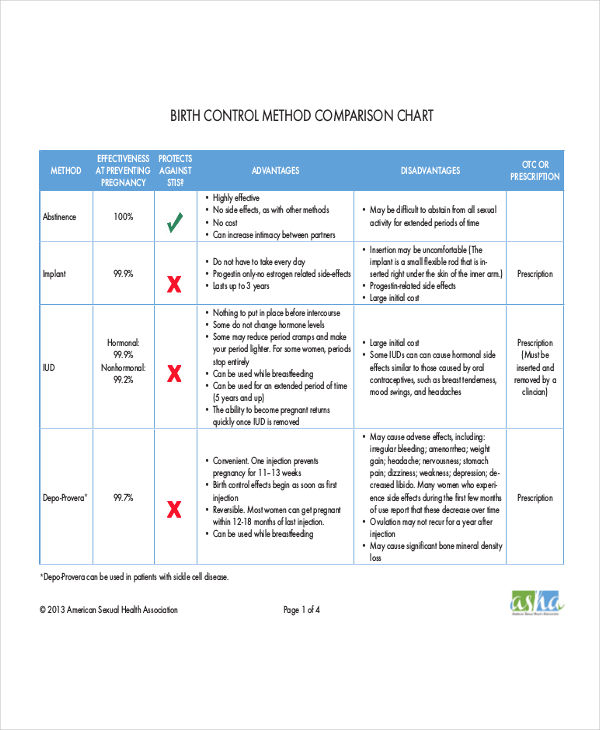
Birth Control Chart
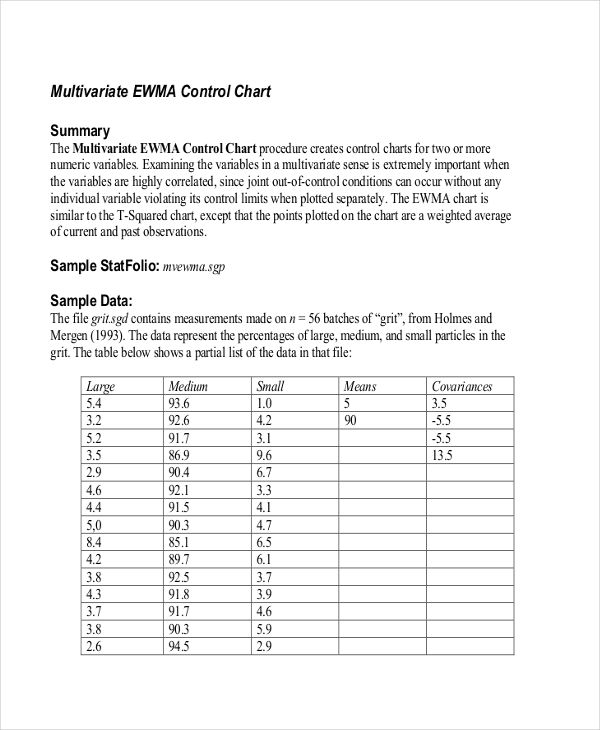
Multivariate Control Sample
How to Make a Control Chart
Creating a control chart can be easy since there are many available tools and applications which specialize in the creation of a control chart. Here are a few things which might be helpful in making one.
- Learn the basics of using a tool in making a control chart.
- Know everything you must know about control charts.
- Collect the needed data for your control chart.
- Choose which control chart would be appropriate for the data you have gathered.
- Organize your data into your chart.
- Make sure all the data presented is correct and accurate.
- Know what the data presented in your chart means.
- If your chart presents changes in the process or signs of being unstable or out of control, know how to determine the cause.
Control charts present various data which can be useful in conducting a business process. One needs to study the data presented in a control chart carefully since such data is considered a crucial tool in identifying process stability. Thus, it is a must for a person who monitors an organizational process to know the basics of creating and interpreting a control chart.