12+ Gantt Chart Examples & Templates in

gantt chart examples templates

In our daily lives, we are following a certain schedule, may it be written in paper or just written in our minds. We have a lot of chores to do, meetings to attend to, work in our respective offices, and a lot more things needed to accomplish for that day, week, month, and so on. In order to arrange our tasks, we need to create a schedule and be organized. One useful tool in scheduling is the Gantt chart.

Gantt charts are not only for an individual’s personal schedule but also for company projects and even long-term engagements. Through Gantt charts, the project’s start date, end date, specific tasks and jobs, as well as their respective duration can be scheduled in order to arrive at an organized and planned project. In this article, provided are the different examples and templates of Gantt charts that may be useful for you and your business company.

Elements of a Gantt Chart

A Gantt chart may vary from one organization to another, but there are key features of a Gantt chart that are the same throughout all Gantt charts. These important features are the elements of a Gantt chart which must be present in every Gantt chart created. Here are the elements that must be incorporated in your Gantt chart.

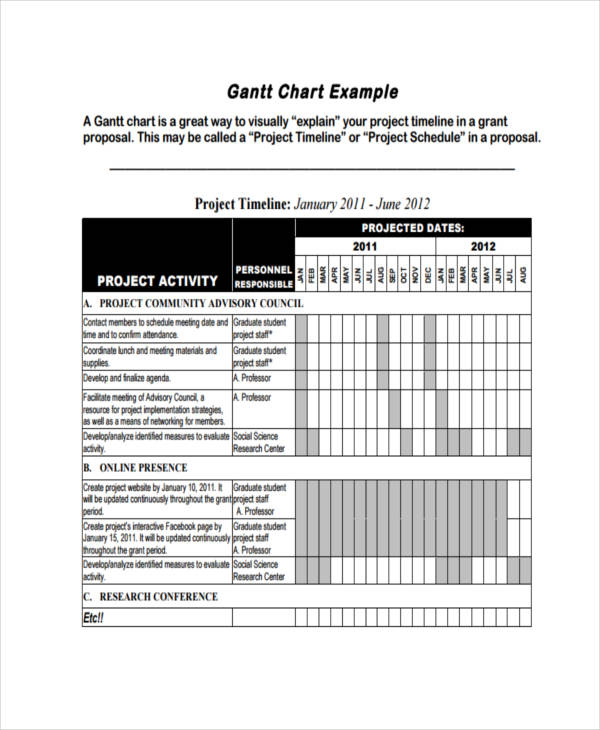
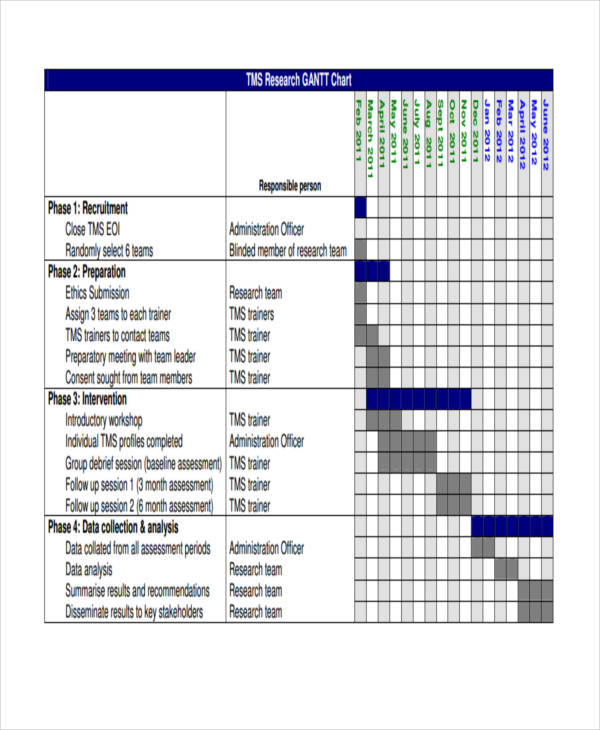
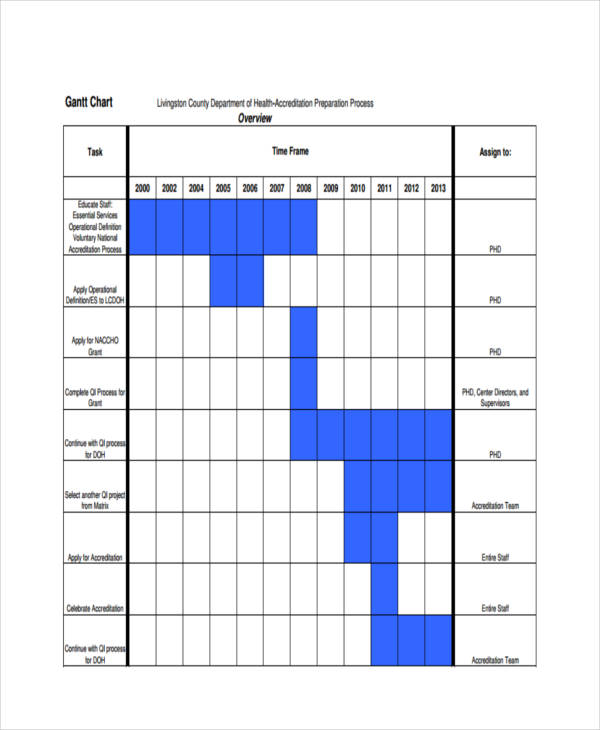
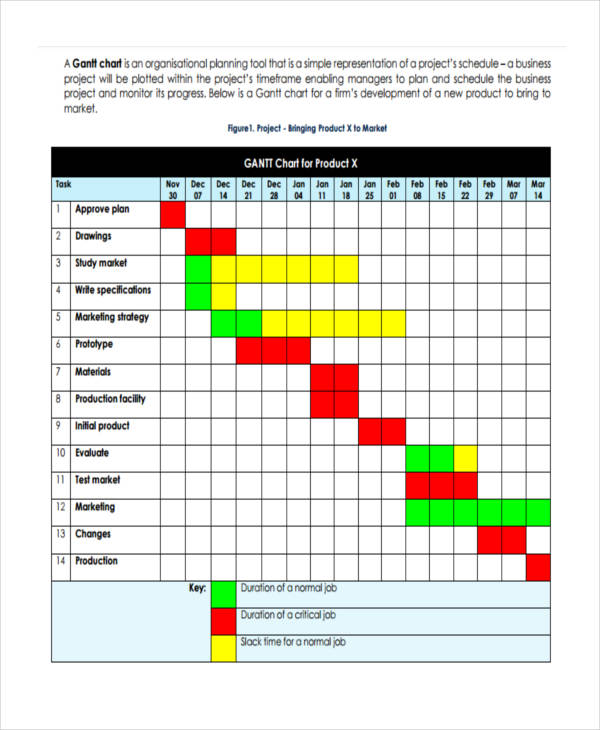
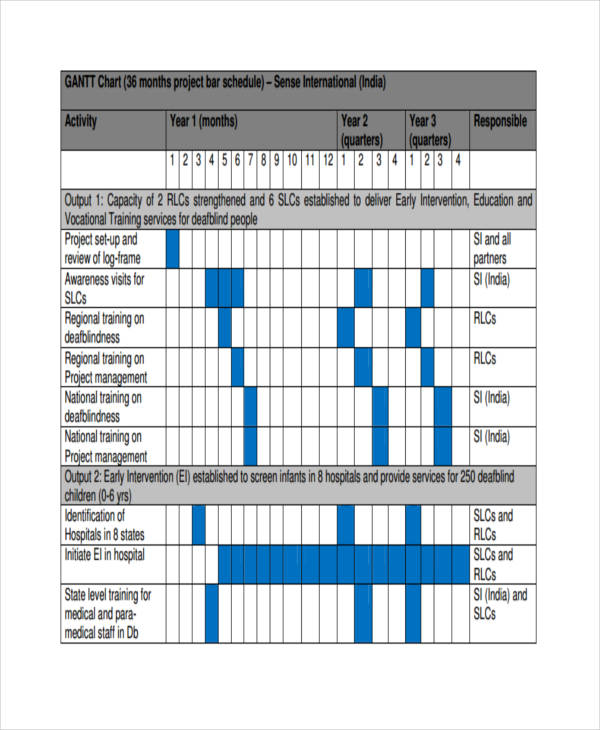
  1. Date or hour (period): One of the main components of a Gantt chart is the date or hour which is usually displayed along the top. It allows project managers to see the duration of each task, the start of each task, as well as the start and end date of the entire project. Primarily, it is the main component of a Gantt chart because dates help keep track of the different tasks for the day or a certain period of time. You might also be interested in daily charts.
  2. Tasks: A project is normally composed of numerous tasks and sub-tasks. It is important that the project is broken down into specific tasks in order to determine the specific activity and number of hours needed to be spent for that specified task. Normally, in a Gantt chart, the tasks are listed down the left side. This will ensure that the tasks are in the correct order and that no task is forgotten.
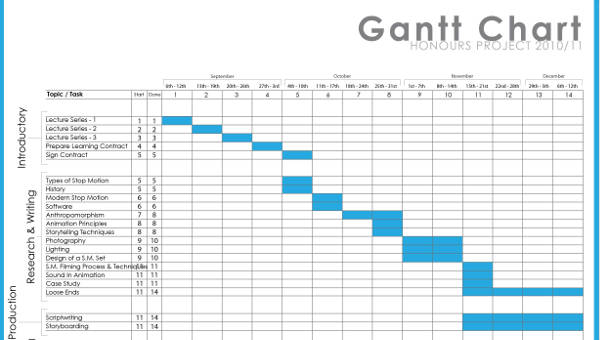
  3. Bars: To display the duration or the time it would take to finish a certain task, bars are used to represent such duration. It usually follows the task or sub-task and it is placed below the dates or certain time period. These are used as indicators which will help in ensuring that the certain task or sub-task is done on time and not behind its scheduled date.
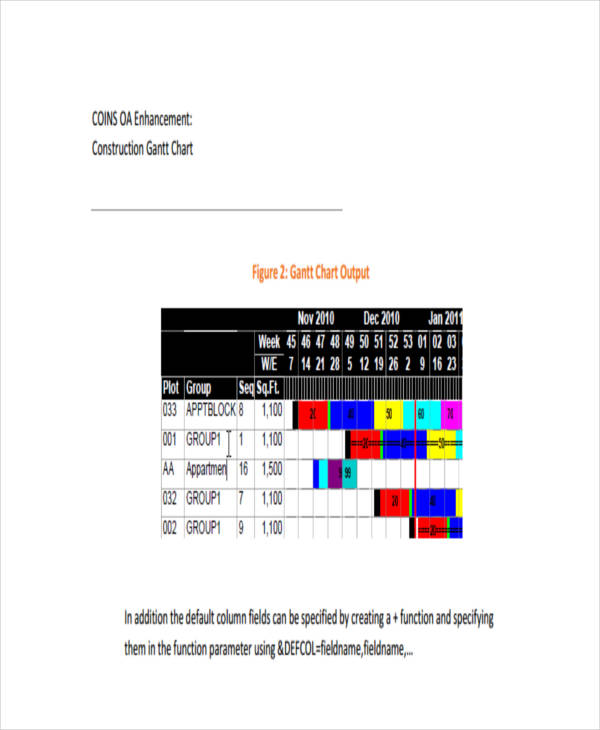
  4. Milestones: The milestones of a certain job or project must also be monitored through the Gantt chart. In a typical Gantt chart, milestones are displayed as diamonds. Milestones pertain to tiny successes of the jobs that you are working for a certain week or month. This would give you proof that you have completed a certain portion of the job, which would give you hope and encouragement in continuing the project. Usually, milestones are placed at the end of its corresponding taskbar.
  5. Dependencies: These pertain to the tasks that are directly interconnected, one of which is dependent on the completion of the other task. It cannot be started unless the other task is completed. It is important that these tasks are placed with an indicator in order not to overlook or forget their dependencies. Commonly, dependencies are indicated by small arrows between taskbars. The indicators will prompt the reader of the dependencies, hence an important part of the Gantt chart.
  6. Resources: Apart from the tasks, durations, dates or period, and indicators, you may also include in your Gantt chart the resources that are assigned to specific persons especially when your project is needed to be worked and completed by a number of persons working together. They can simply take a look at the Gantt chart whenever they needed to confirm their assigned resources as well as to identify other assigned personnel of other resources. An organizational chart is an example.

14+ Gantt Chart Templates

Monthly Gantt Chart

monthly gantt chart template

Template Details

Available File Formats
  •  
  •  
  •  
  •  
Size: A4 & US Sizes

Get This Template

Project Management Gantt Chart

project management gantt chart template

Template Details

Available File Formats
  •  
  •  
  •  
  •  
Size: A4 & US Sizes

Get This Template

Sample Gantt Chart Template

sample gantt chart template

Template Details

Available File Formats
  •  
  •  
  •  
  •  
Size: A4 & US Sizes

Get This Template

Weekly Gantt Chart Template

weekly gantt chart template

Template Details

Available File Formats
  •  
  •  
  •  
  •  
Size: A4 & US Sizes

Get This Template

Basic Gantt Chart Template

basic gantt chart template

Template Details

Available File Formats
  •  
  •  
  •  
  •  
Size: A4 & US Sizes

Get This Template

Monthly Task Gantt Chart Template

monthly task gantt chart template

Template Details

Available File Formats
  •  
  •  
  •  
  •  
Size: A4 & US Sizes

Get This Template

Sales Activity Gantt Chart Template

sales activity gantt chart template

Template Details

Available File Formats
  •  
  •  
  •  
  •  
Size: A4 & US Sizes

Get This Template

Excel Gantt Chart Template

excel gantt chart template

Template Details

Available File Formats
  •  
  •  
  •  
  •  
Size: A4 & US Sizes

Get This Template

Progress Gantt Chart with Events

progress gantt chart with events template

Template Details

Available File Formats
  •  
  •  
  •  
  •  
Size: A4 & US Sizes

Get This Template

Yearly Project Management Gantt Chart

yearly project management gantt chart template

Template Details

Available File Formats
  •  
  •  
  •  
  •  
Size: A4 & US Sizes

Get This Template

Project Gantt Chart PowerPoint Template

Details
File Format
  • PDF

Size: 103 KB

Download

Gantt Chart Template

Details
File Format
  • PDF

Size: 48 KB

Download

Gantt Chart Example

Details
File Format
  • PDF

Size: 19 KB

Download

How to Create a Gantt Chart

Creating a Gantt chart is not really difficult. No matter what tools you will use in creating a Gantt chart, the steps in creating it typically involves that following steps:

  1. List all the tasks: Having a list of all the tasks needed in order to complete the project is a vital step in achieving an effective Gantt chart. It is important that there is no single task that is missing or forgotten because this will cause you hassle in the later part of your Gantt chart creation. The list will provide an overall overview of what needs to be done, who is in charge of a certain task, as well as the time it takes for each task. Usually, the project manager is responsible in drafting the list of task, but asking help from the team members is also important since they are the ones that know better about their respective tasks.
  2. Determine task dependencies: It has been stated above that there are certain tasks that are dependent on the completion of another task, and these are called dependencies. This is not uncommon for every project because it naturally has tasks that precede or succeed another task. You have to determine beforehand the task dependencies so it would be easier for you to plot your tasks in your Gantt chart later.
  3. Build a timeline: Another vital step that you must carefully take is the building of a timeline for your project. Firstly, you must determine, assess, and estimate how long it would take to complete your project. You must think about how much granularity you want in the chart. There are charts that would accommodate a long-term project, which can be completed in quarters or years, while there are also those that are designed for short-term projects that can be completed in just weeks or months. There are even smaller projects in which hourly timelines are appropriate and effective. Hence, understand your project well in order to determine the timeline that fits well for your project.
  4. Plot the tasks and their corresponding duration: After listing the different tasks and the time it would take to complete each task and building a timeline, you can now plot the tasks on the left side of the chart, the date or hour on the top portion, and the duration which follows the tasks right below their corresponding date or hour. This will keep your tasks needed to be completed in order, and you can now visualize on how you complete your project.
  5. Allocate tasks to resources: Finally, allocate the tasks to specific persons or groups who will be in charge to take on their respective jobs. In assigning people, you have to make sure that they are capable of doing the task or they already gained experience in a related task in order to efficiently perform their assigned task. They must be well acquainted with the task as well as their personal strengths and weaknesses.

Tips for an Effective Gantt Chart

A Gantt chart would seem easy to create but creating an effective one is challenging. How then will you create a Gantt chart that is effective for your planning and scheduling needs? The above section discussed how to create a Gantt chart, but the following discussion will give you tips for it to be effective.

  • Determine your project goals: It is important that you perfectly understand what your chart will be for in order to perfectly cater your needs. You must know your intentions and the ultimate goal of your project. What is your primary purpose? What is the main goal of your Gantt chart? Those are just some of the questions that would lead you in creating a foundation for your Gantt chart.
  • Specify the project timeline: In specifying the timeline for your project, you must be realistic about it. Note that your chart will be used in managing and maximizing the time you have to complete a project, so it is important that you decide on how to divide the increments of the time for the whole duration of the project that you will be working on. You must consider the weekdays and holidays, and ensure that the deadlines are not impossible to meet.
  • Break down into sub-tasks: One huge project, when taken as a whole, may be overwhelming, but dividing it into tasks and sub-tasks will make it easier to accomplish. This would also be easier to allocate the sub-tasks into different individuals or groups. Break them down until they become more straightforward tasks and their duration can be easily and accurately determined and estimated.
  • Define the critical path: To compute the critical path, you can calculate the hours or days needed to complete all the tasks, but take note that there are tasks that can be overlapped with other tasks. This will help you have an overall view of all the tasks to complete the project so you can consider the timing and dependent relationships of the different tasks. Through this, you can also determine the longest path from the beginning to the end of the project you are working on. Moreover, this would also help you identify which steps are critical and which tasks can be delayed without any risks.

Gantt Chart FAQs

What is the importance of a Gantt chart?

A lot of entities would want to use a Gantt chart especially in planning and scheduling as it can help them assess the duration of the project, break it down into manageable tasks, determine the start of each task, determine the tasks that are dependent on the completion of the other tasks, assign the tasks to appropriate persons, among others. Through this tool, their schedule would be organized and they can easily monitor the small milestones of the project. Additionally, this is very helpful for project managers to see to it that the tasks or activities are completed in time so that the project will be completed as planned and scheduled.

What are the disadvantages of a Gantt chart?

Although a Gantt chart is extremely helpful, it has also several disadvantages, and these are as follows:

  • A Gantt chart can become complex when dealing with a huge number of tasks and resources.
  • The bar representing the duration does not indicate the amount of work needed to complete a certain task. Instead, it only indicates the time period over which a task will be completed.
  • Changes on schedule may happen along the way, so Gantt charts need to be updated constantly to keep up with the changes.
  • It may be difficult to show all the details of your plan to other concerned parties because Gantt charts can be long and cannot be viewed on one sheet of paper. Yes, you may save and view your Gantt chart on a computer but just in segments.

More Business