When a company dwells on making a new project, it’s important for management to know how to carry out the project plan. Basic charts are not enough to manage a project. Projects require thorough plans that doesn’t only cover the present but can, as accurate as possible, foresee the future.
With respect to that, one person made a great chart that can help companies in managing a project. Using a gantt chart maker allows teams to visualize timelines and dependencies with greater precision. This type of chart helps in foreseeing the possible time a project task can take and when tasks can possibly be finished. Professionally designed gantt chart templates also make it easier to get started quickly and maintain consistency across projects. This chart type is commonly known as the Gantt chart examples.
Free Gantt Chart

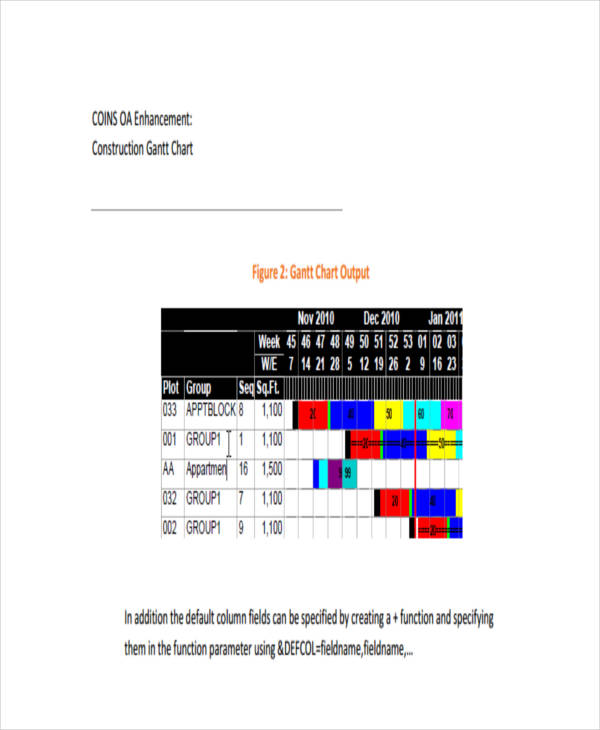
Construction Gantt
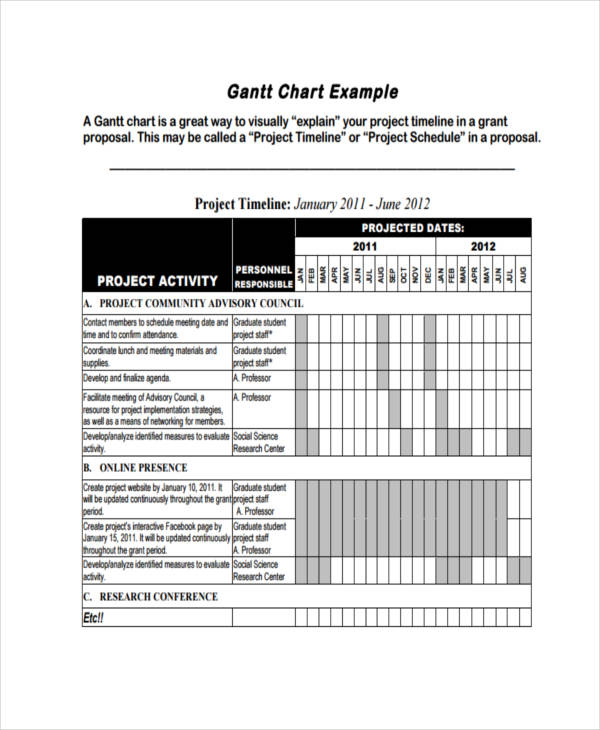
Sample Gantt Chart
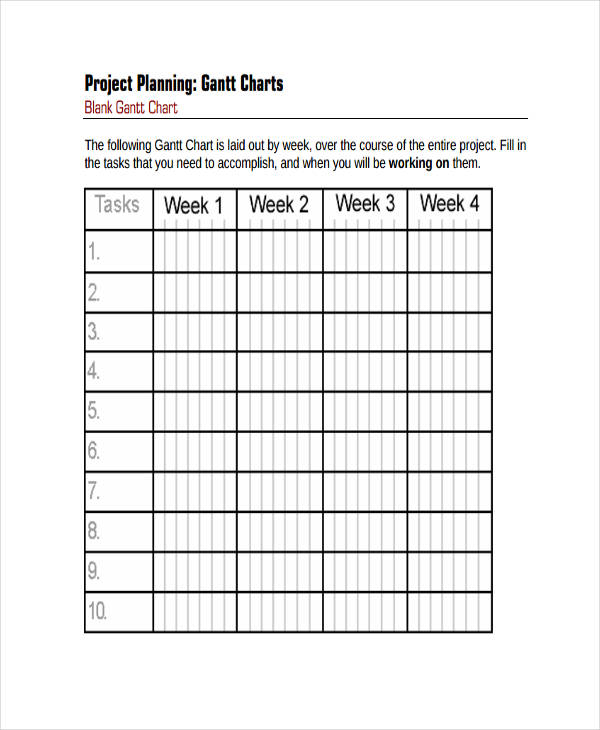
Blank Project Chart
What Is a Gantt Chart?
Sample Charts are commonly used for values involving financial stability and performance. But for a Gantt chart, it is a different case. Gantt chart originated from the maker of this chart, named Henry L. Gantt.
This type of chart was developed mainly for a tool to control production. Gantt charts are usually used in management that usually deals with projects. Gantt charts graphically represents the schedule of a task in a project. This type of chart helps in planning, coordinating and tracking specific tasks of a project as to when it starts and when it finishes.
The Pros and Cons of a Gantt Chart
With the use of Gantt charts, there is a clear picture or visual of when a task can be finished. Using this chart, it is easy to understand what you are doing and where you are in what you do. It also set time frames that are realistic making it easy to track productivity.
Although it helps to use Gantt chart as much as possible, there are also disadvantages when using this chart. Because not all projects are short term, long term projects will be difficult to present and update. Understanding this chart would also be challenging.
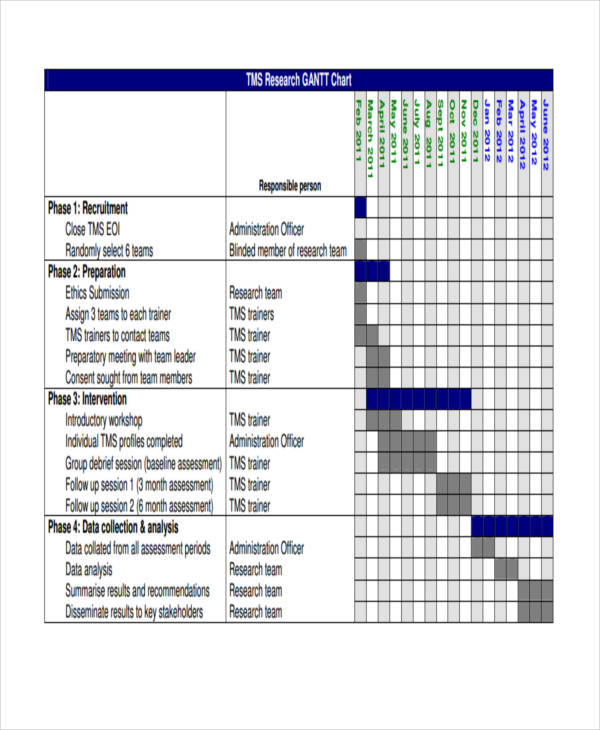
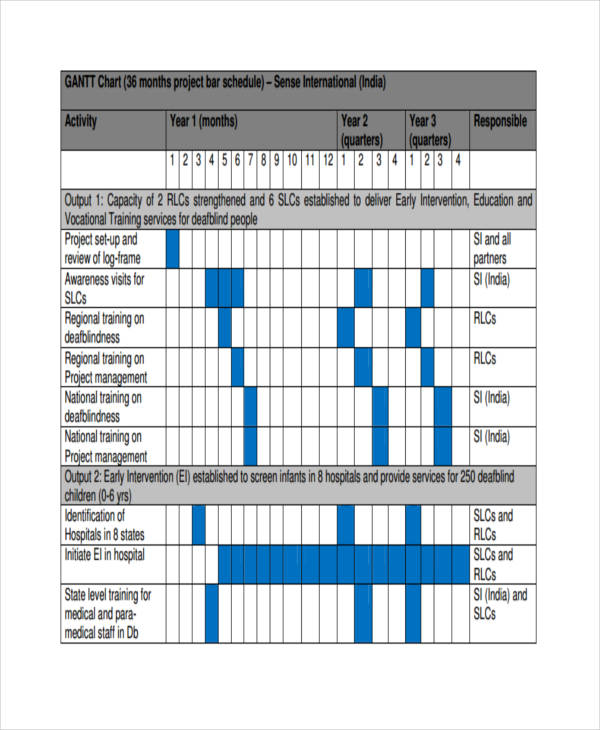
Research Gantt
Basic Gantt Chart
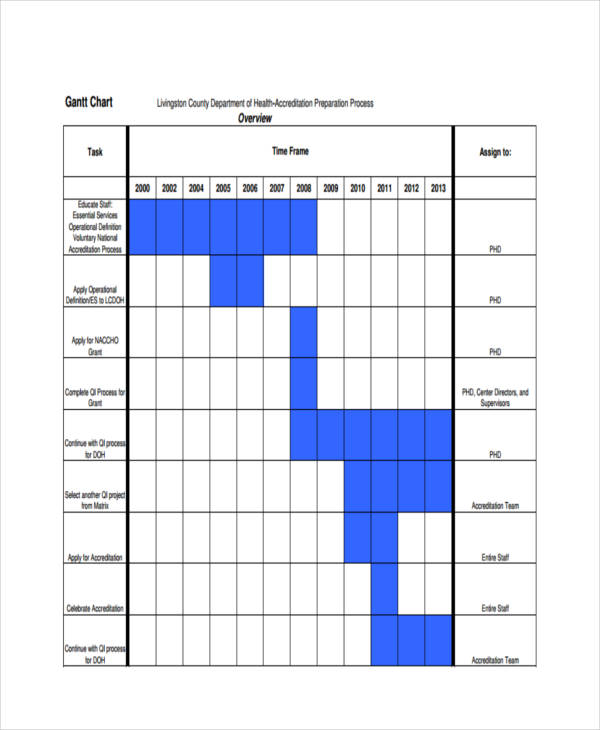
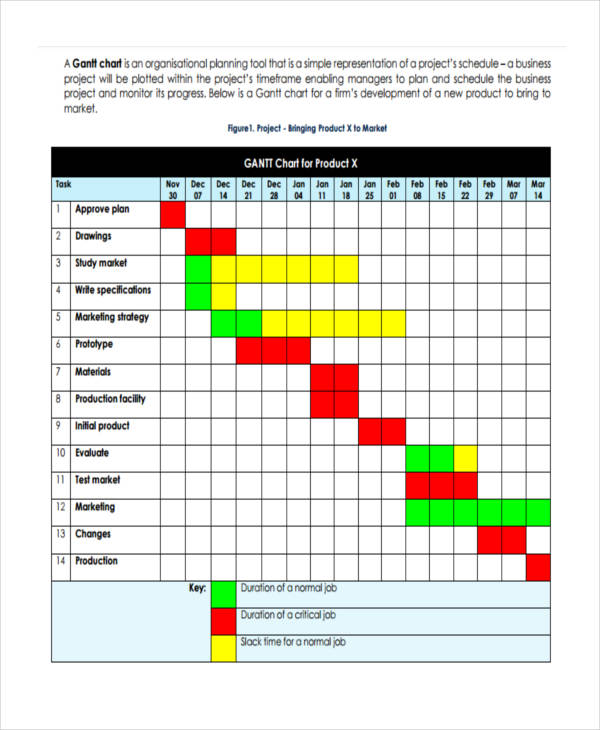
Business Gantt
Gantt Chart Example
Why Make a Gantt Chart?
There are possibilities that Gantt charts are not used by companies when managing a project. Although there are lots of techniques and tools that project managers can use, it is always best to use the Gantt chart.
The reason for that is, Gantt chart are not that easy to make at first but it surely gives a better look in the schedule of tasks. Other management tools cannot present what a Gantt chart can, which is a graphical display of the time frame a task can be done and what task can be done simultaneously.
Guidelines in Making a Gantt Chart
With internet being highly accessible in this generation, it is easy to look for chart examples that can be used as reference in making a Gantt chart. For some, Gantt chart would seem difficult and confusing.
To get rid of that confusion, all you need is to know how it should be made.
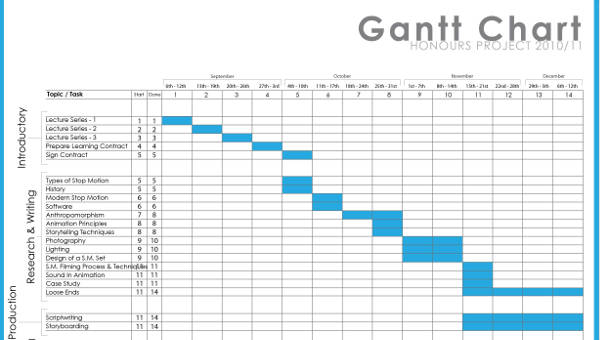
- In making a Gantt chart, the left side must contain a list of all task in an order.
- At the right side is the time or schedule when the task is performed.
- To indicate the schedule, you can use boxes and align them with the task.
There you will have a Gantt chart.