Time is of the essence when it comes to project management. Knowing this, you wouldn’t want to waste precious time keeping tabs on an important project using a bunch of complicated spreadsheets.
One of the best ways to monitor your progress and observe proper scheduling is through a popular project management tool known as the Gantt chart. But before you can create a Gantt chart, you need to make sure you know exactly how it functions.
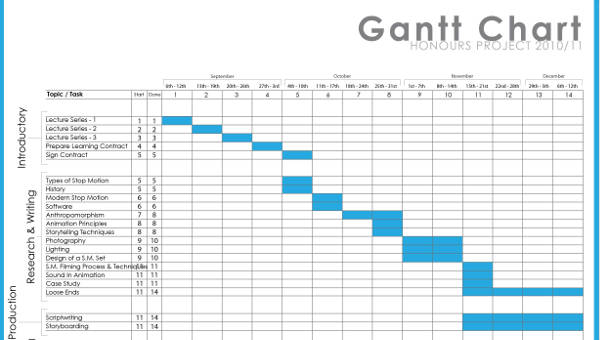
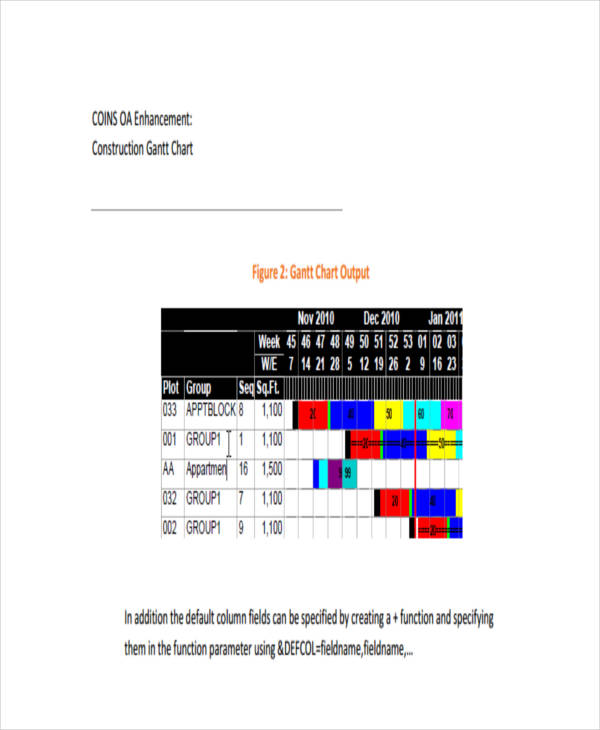
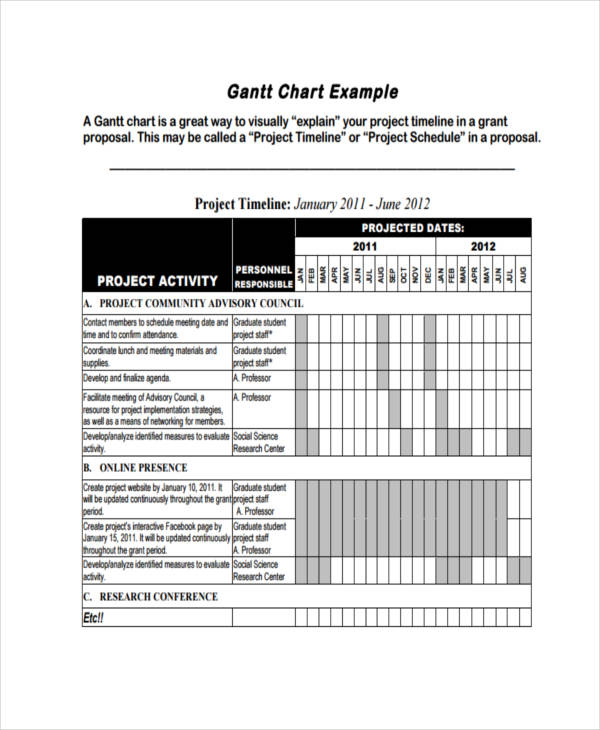
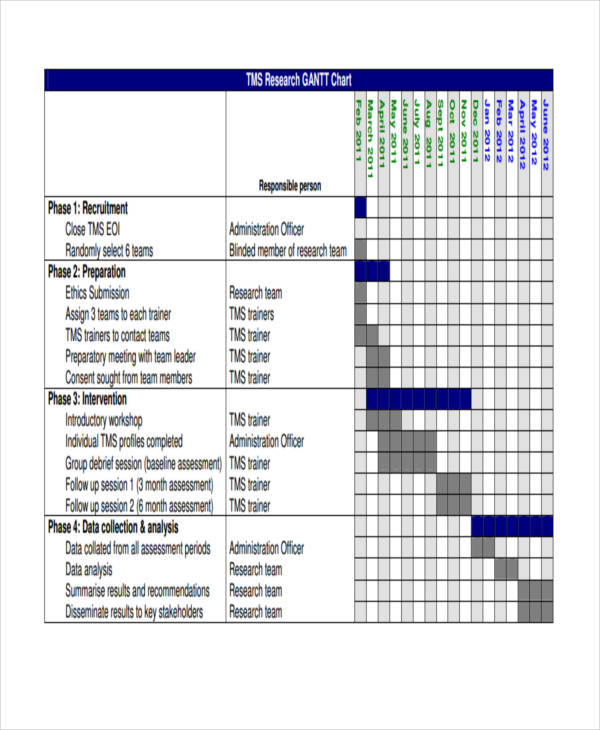
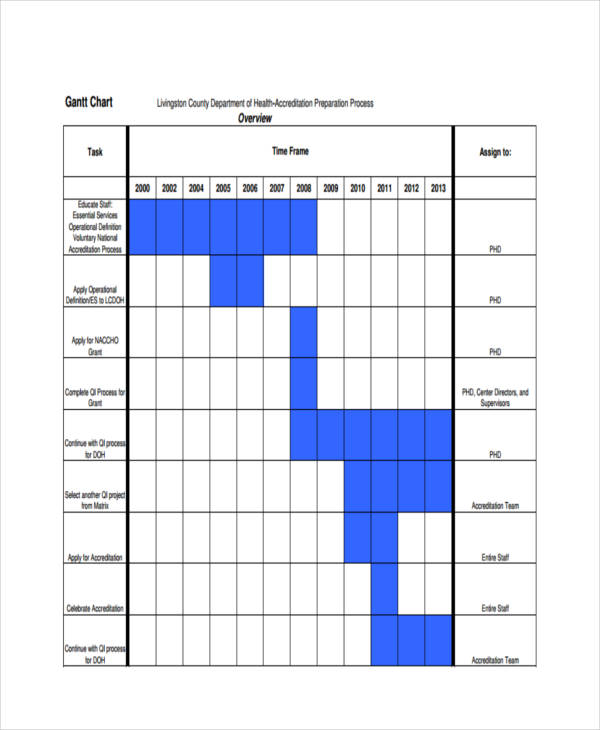
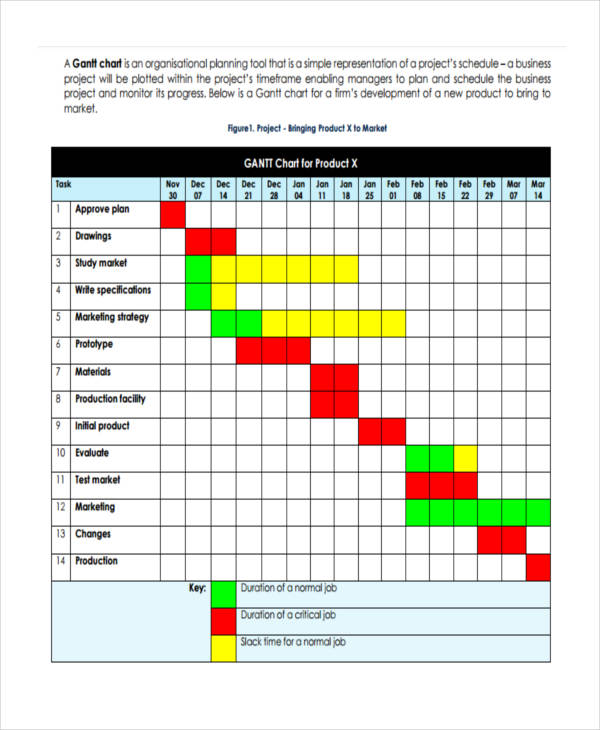
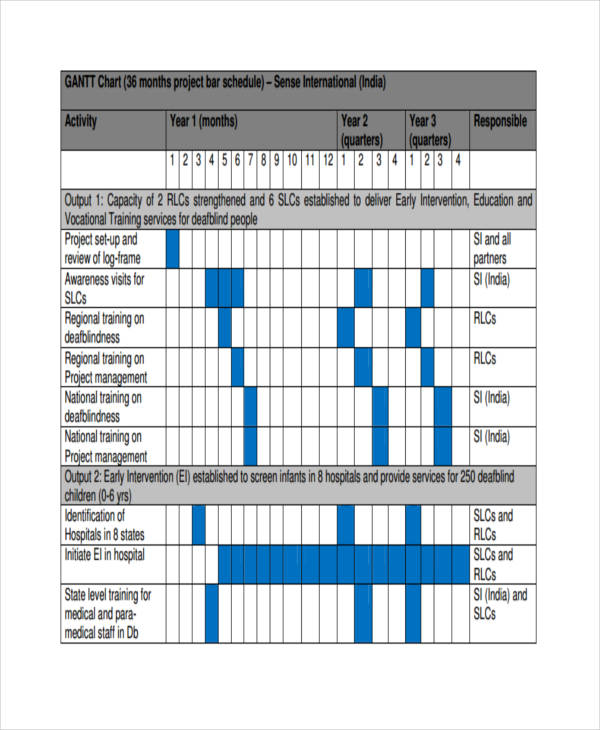
A Gantt chart is a horizontal bar graph used to illustrate the tasks and schedules involved in a project plan. Modern Gantt charts typically represent the status of a task, along with those responsible for completing each task, in a project. Generally speaking, the chart is considered to be a project management tool that managers and team leaders can use to monitor the progress of a given project.
There are many elements of a Gantt chart that can benefit its users. For instance, the general Gantt chart features the start and end dates of a particular task, project milestones, dependencies between each task, and the person assigned to accomplish each task. Most project scheduling applications enable users to organize these components into groups and subgroups for effective management as well.
The tasks listed in the Gantt chart are then represented by a horizontal bar that shows the overall duration of a task, along with its start and end dates.
In other words, Gantt charts offer an efficient means of project management to help you avoid preventable errors during the process of developing a project.
Imagine if you were hired by a big-shot client to complete a relatively complex computer software in the span of two months. Your company accepts the offer as a challenge to complete the project despite the limited time period given, mostly because the deal would open brighter opportunities for the company to prosper in a competitive market. You may also see measurement chart examples.
However, in spite of having a team of highly skilled developers, the scope of the project demands full attention and proper management to steer clear of any potential downfalls that can slow the team’s progress.
Oftentimes, it can be difficult to manage a large project even with the participation of an entire workforce. This is because some projects can be a lot more complicated than others.
With that being said, it’s important to break down the structure of a project by displaying the duration of each task, as well as the various relationships shared between project activities. This way, managers may easily track each task against their scheduled time and/or predefined milestones. You may also like food chart examples & samples.
A Gantt chart serves as a timeline of events that illustrates how a project will run. Here, project managers can view the individual tasks assigned to each remember, along with their respective duration and sequence. Users may also view the overall timetable of a project and its expected completion date. You may also check out daily chart examples.
As the project moves forward with regular performance updates, the general chart will simultaneously adjust according to what has been accomplished so far, with an up-to-date schedule of the new start and finish dates for uncompleted tasks. This will warn managers of any tasks that need to be attended to immediately, before it affects other aspects of the project.
Though a Gantt chart does have its own share of advantages that users can make the most of, if not used correctly, it can build a critical path for businesses in general, and project managers in particular.
Creating a Gantt chart that simply displays tasks in an organized manner is good for quick and easy project control. But what if you’re faced with a complex project structure, won’t it be difficult to recognize the dependency of tasks to each other as well as those that are considered as critical to finishing the project as scheduled? You may also see comparison chart examples.
This is where the Critical Path Method comes to play. In this approach, a sequence of tasks must be completed before the project may be finalized. At the same time, users can also determine which tasks must be finished first, before the next dependent task can begin. So if a particular task cannot be completed on time, then it’s possible that the project will take longer to the same extent. You may also like behavior chart examples.
During the process of developing a project, it’s likely that you will encounter several obstacles that will hinder you from your end goal. Say for example, one of your senior software developers calls in sick for the next five days or so. This can affect the project team’s overall productivity in which certain tasks may not be completed as scheduled.
While the Critical Path Method can’t prevent these circumstances, it can help you recognize them. This allows you to take the correct measures at the right time to put a stop to any further delays.
So before you design your Gantt chart, make sure you have identified the critical paths of your project. You can do so by creating a table that contains a list of all the activities involved in a project.
Next, you can illustrate your tasks with a circle (also referred to as a “node”) and arrow diagram. Each node must be labelled with a number starting with 1 to show the chronological order of tasks. The arrow found between each node represents the activity that needs to be accomplished before you can carry on to the next task. You may also check out price chart examples.
By the time you’re finished, you can then use a spreadsheet to illustrate the critical path in a Gantt chart.
The Gantt chart is a popular diagram that has been used for over a hundred years. It was first devised in the 1890s by a Polish engineer named Karol Adamiecki, who initially called it a harmonogram.
Adamiecki ran steelworks in southern Poland and was deeply interested in various management techniques and ideas. But because he did not publish the chart until 1931, and since it was only in Polish, the adoption and recognition of his authorship were fairly limited. You may also see temperature chart examples.
In 1912, a man named Hermann Schürch published his own version of the chart while discussing a construction project to his colleagues.
However, it was said that Schürch’s charts were merely a routine in Germany rather than a notable tool at the time they were published. The only thing that made Schürch’s chart different from later Gantt charts was that it did not present interdependencies, forcing readers to interpret them themselves. These charts appeared to be static representations of a planned schedule. You may also like music chart examples.
Around the 1910s, an American engineer and project consultant named Henry Gantt designed his own version of the chart, which later became widely popular in western countries. Because of the recognition surrounding his device, Gantt’s name soon became associated with simple charts of this type.
But since technology was extremely limited back then, charts had to be prepared by hand. The earliest Gantt charts were drawn on paper, and were redrawn entirely to make room for any changes in the schedule. Over the next couple of years, project managers would even use pieces of paper or blocks to indicate the necessary adjustments. You may also check out chart note examples.
Fortunately, with the advent of personal computers and project management software toward the end of the 20th century, users could easily create complex and elaborate Gantt charts using various Web-based applications. These days, almost all Gantt charts are made by software which has made it easier to adjust the chart based on sudden schedule changes.
Now that we’re saved from the burden of creating Gantt charts by hand, it’s time that we make the ultimate decision between making a Gantt chart in Excel or online.
Let’s face it. Although Excel is a multipurpose application that allows users to collect data and design various tables and charts instantly with the help of advanced features and tools, creating a Gantt chart in Excel is still a tedious and time-consuming task for anyone. Sure, you could easily access your data, but updating any changes can be quite difficult. It’s almost as if you’re doing everything from scratch. You may also see medical chart examples.
But what if you could make the same type of chart in mere minutes?
Thanks to the advancements in technology, you can make Gantt charts online with the help of various software programs that enable you to share and collaborate your plans with the rest of the team.
An online Gantt chart offers a wide variety of tools that allow you to add or import tasks on the spreadsheet. A timeline automatically appears on the right side of each item to show your task duration for every due date added. Plus, when you use an online Gantt chart, you can enjoy additional features such as shareable and easy-to-update spreadsheets, as well as email alerts and one-click reports. You may also like metric conversion chart examples.
With a stable Internet connection, you can easily access your files and share it with clients, superior managers, and team members through a simple click of a button.
The best part is, with an online Gantt chart, you don’t have to worry about installing a new software to your desktop due to the numerous Web-based project management applications available online.
You might have the perfect plan in place, but without proper management, your team could face serious risks along the way. Project management involves a series of duties that requires your utmost attention. This includes monitoring your project as it progresses over time. You may also see monthly chart examples.
There are instances when it can be difficult to predict how much time and effort it will take to accomplish your project tasks. Sometimes, a traditional checklist of to-dos cannot provide you with enough insight to manage a project effectively. When this happens, you might want to consider using a Gantt chart to record tasks and schedule activities. You may also like wedding chart examples.
From adequately allotting resources to ensuring project tasks are completed on the dot, here are ten specific benefits of using a Gantt chart:
Communication ensures transparency; without it, there would be chaos within a group. So imagine running a team of professionals who each need to concentrate on a task assigned to them. There are many internal and external factors that can affect different aspects of a project, and in case one of these factors impacts the output of one member, then the rest of the team should be aware of the possible changes. You may also check out exercise chart examples.
Instead of gathering the whole team together for status updates, these changes may be reflected in the chart itself. Anyone who can access the Gantt chart will be reminded of deadlines, task dates, and important project milestones. Not only can this keep everyone on the same page, but it also provides a visual representation of a general plan so that each member stays informed of their individual positions and responsibilities.
There are many steps and procedures involved in project making. Because of this, it’s common for project managers, team members, and stakeholders to lose track of their main professional goal along with the direction needed to get there. Hence, using a Gantt chart is one of the best responses for such problem.
A Gantt chart provides a total overview of a project from start to finish. This gives a manager a full look at the project’s timeline, including the members involved in each step and the tasks needed to achieve a project. This boils down an entire project consisting of multiple tasks and timelines into a single, comprehensible document. You may also see size chart examples.
Developing a project of any kind can be a long, daunting process for leaders and their team. The seemingly endless cycle of trial and errors, do-overs, and quality improvement, just to meet the needs and demands of a client, are bound to make a person feel unmotivated along the way. Some teams or team members simply need a hint of motivation to increase their drive. You may also like color chart examples.
A Gantt chart offers the team the ability to focus on specific tasks required to reach a particular milestone. If you think about it, crossing out every task completed in a list is sure to inspire you to carry on with your duties. It allows members to see if future tasks depend on them as well. This will change your work habits and make you feel all the more accomplished as you continue on with the project. You may also check out height and weight chart examples.
As a project manager, it’s your responsibility to make sure that your members are treated fairly. This means that each member should be given a set of tasks that complement his or her expertise. This will prevent the possibility of overburdening team members with tasks that are impossible to accomplish all at once, within a specified time period. You might be interested in chore chart examples.
Let’s say for example: you’re given less than two weeks to fix all the bugs in a software application. But due to the complexity of the system, you need to break down the project into manageable chunks. This will make it easier for members to focus on specific functionalities in the system for successful results. You may also see control chart examples.
By using a Gantt chart, managers can sequence events and ensure that every single aspect of the project is covered before the scheduled deadline. Keep in mind that teamwork can go a long way in a group with the help of proper management and participation of team members. You may also like flow chart examples.
Looking for creative solutions whenever there is a lack of time or resources can help a team obtain a desired output. With a Gantt chart, managers can view how individual tasks intertwine to encourage new partnerships and collaborations that can possibly bring you to your destination a lot faster. You may also check out weekly chart examples.
Think of it as a map that consists of multiple shortcuts you never knew existed with a traditional task assignment system. Simple changes like these can produce big results, which can probably cut a week or month off a project.
Other than making you seem like a clever leader of a group, this serves as a great way to keep the rest of your team happy.
Change is inevitable. No matter how hard you try, there are some events that cannot be avoided. These events may cause a minor or major effect to your project, forcing you to make some adjustments in the project schedule of your Gantt chart as well. Luckily, Gantt charts make it easier for you to adapt to unexpected changes in your project scope or timeline. You might be interested in sales flow chart examples.
While revising your project schedule a little too much can make you vulnerable to potential risks, having a realistic view of the project can help your team recover from possible setbacks and adjust to other changes.
You could have five months to complete a project, but somehow, without proper management, you could end up doing everything at the last minute. Not only is this a risky move to follow, but it can also lead to a sloppy output that could bring your team to shame. You may also see project flow chart examples.
One of the primary functions of a Gantt chart is project scheduling. This enables managers to develop a timeline of events, consisting of start and end dates for each task. This will serve as a guide to remind team members of the deadlines that should be met to avoid project delays. You may also like pie chart examples.
Task dependencies are extremely common in many projects. Here, one team member has to wait for the outcome of another team member before he or she may start with a crucial piece of the assignment. Rather than wasting precious time sitting idly, he or she can perform other project tasks that do not involve dependencies. This gives managers the opportunity to make the most out of human and material resources. You may also check out management flow chart examples.
Handling complex projects is a huge challenge for managers. This is why it’s important for the team to visualize every piece of the project puzzle to allow better focus, which can then lead to better decisions in regards to timetables and resources. You might be interested in nursing flowchart examples.
Being a hands-on manager may seem irritating to some team members, but when it comes to project management, it pays to know what your members are up to.
But instead of reading individual reports that might take a good amount of your time and energy to sort through, you can opt for a simple Gantt chart for a much easier approach. A few simple clicks and you’ll see the tasks assigned to each member, who has some extra time on their hands, and who might need some additional assignments to help finish the project on time.
Gantt charts are widely used in the fields of business and academics. This can help managers describe and monitor all kinds of projects for effective project management.
But before you can set up a Gantt chart, you would need a detailed project plan to work with. A project plan involves a series of interdependent tasks that must be performed in a logical order. Every project plan has a specific start and end dates for the assignment. Since some projects can be pretty complicated than others, using a work breakdown structure to split major tasks into subtasks is necessary to creating a task hierarchy.
This hierarchy can then be translated into the Gantt chart for effectual management.
Once your project plan is complete, you can now enter the data into your chart generator through the following steps:
This includes the start date, the end date, and the scheduling mode. In this step, you want to make sure that tasks begin as soon as the proposed start date is established. Since there are many prospective obstacles that can hinder you from your professional goals, you need to make sure you can finish the project right on time, or possibly before the expected end date.
You need to set the number of working days in the week, along with the number of working hours in the day, and so on.
For example, if your team is required to report at the office six days a week and eight hours per day, then this should be reflected in the Gantt chart. This will help you examine whether deadlines are realistically set according to the capacity of your team members. This can also guide you in assessing whether members have been maximizing their time wisely based on their productivity for the day or week. You may also see organizational chart examples.
Labeling is one of the most important steps in creating a Gantt chart.
Why?
Simply because this serves as a guide to inform users what they’re required to accomplish. Managers have the liberty to name these tasks anything they wish, as long as it’s relevant and clear enough for readers to grasp. Keep in mind that you want to be as specific and concise as possible with your task names to avoid confusion. You also need to set the proposed duration for each task to be accomplished. You may also like reward chart examples.
Although you could always define your resources whenever you need them, setting up a global resources list during the initial steps of the development process will save you the time and effort. All you would need to do is to select the resources available in the global resources list to assign to various project tasks. Consider this as a master list of resources that you can use whenever you’re asked to create similar types of projects. You may also check out recruitment flow chart examples.
Since tasks are often required to be performed in a specific order, it’s best to have these tasks linked automatically through your Gantt chart.
By default, these tasks are linked based on a “Finish to Start” relationship which represents the task dependencies in a project. This means that a predecessor task must end before its successor can start. This is usually displayed on the Gantt chart by lines with arrowheads connecting one task to the other. The arrowheads indicate the direction from the predecessor to the successor in the project. You might be interested in process flowchart examples.
Take note that a task may have more than just one predecessor. In cases like this, the start date is determined in accordance to the predecessor link with the latest start date. If changes occur during the course of the project, these links may also be affected. You may also see flow chart examples.
There are strict rules to follow when dealing with urgent projects where the start and/or finish date of a task should be no later than, no earlier than, or on a specific date. These are only enforced when the situation you are in calls for it. Task constraints may be set or edited in the Constraints section of New and Edit Task. You may also like marketing flow chart examples.
Before introducing the Gantt chart to your team, make sure you have gone over it at least a dozen times. You need to ensure that the basic chart effectively communicates each task and their respective duration for the individuals accountable to understand. Names and other labels should be indicated clearly, and activities must follow what has been indicated in your project plan.
Although Gantt charts are completely flexible, you don’t want to go through the hassle of starting over, or making sudden adjustments after your team has already seen the chart.
Even with your Gantt chart in place, remember to inspect it at regular intervals to verify whether your progress is going as planned. This will also help you detect any issues or concerns that need to be corrected as soon as possible. You may also check out pareto chart examples.
If you find yourself in need of a project management tool, consider using a basic Gantt chart. With the help of these guidelines, you’re sure to create a Gantt chart in no time!