Lines are illustrations of the relationship between two points in a given plane. This means that the make and the direction are directly affected by the location of the two points. You can easily illustrate this relationship through linear equations and lines.
What is Linear Equations?
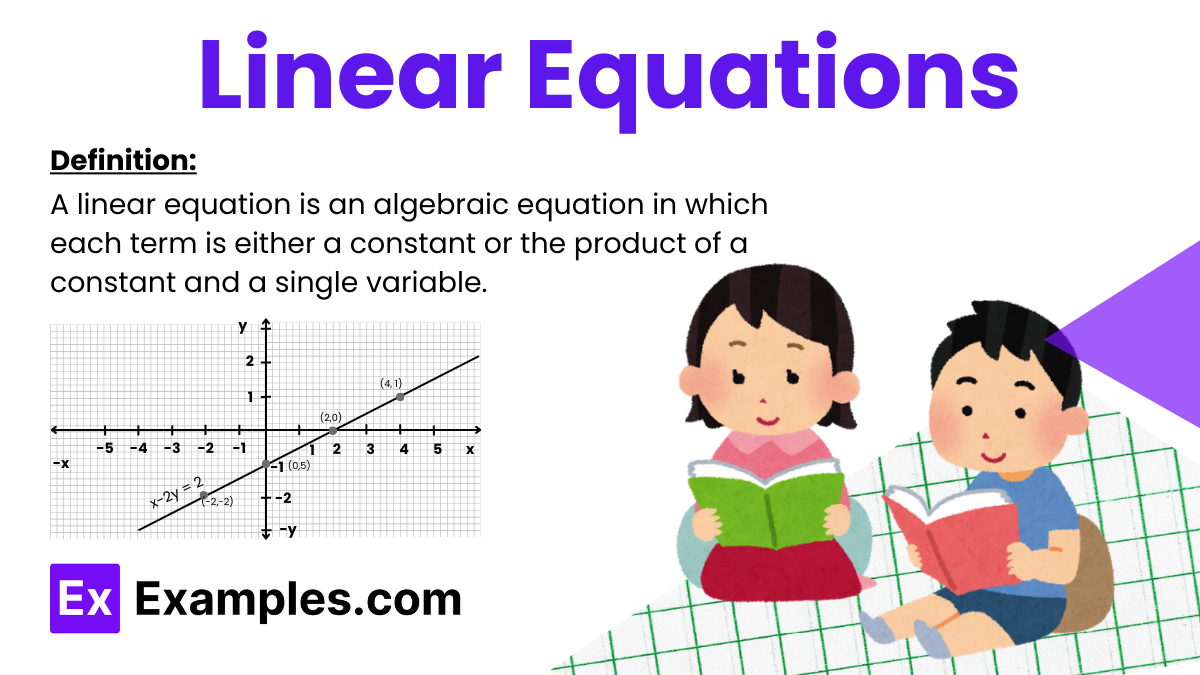
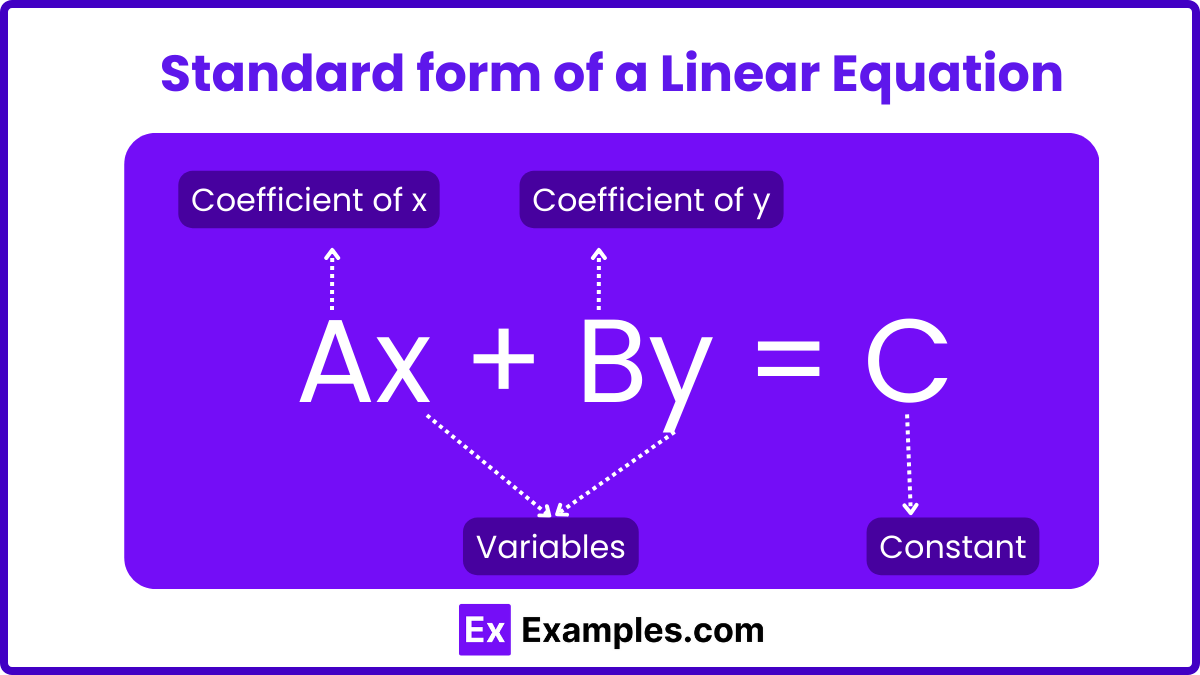
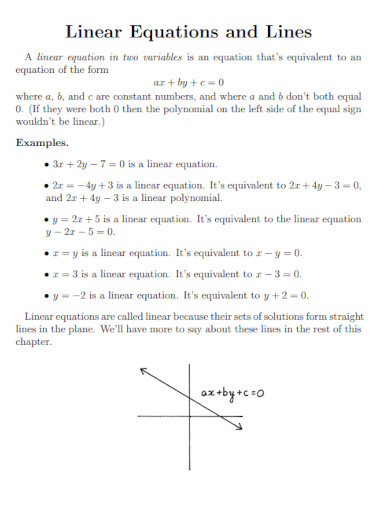
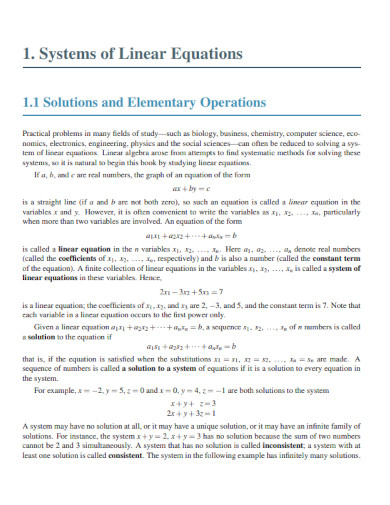
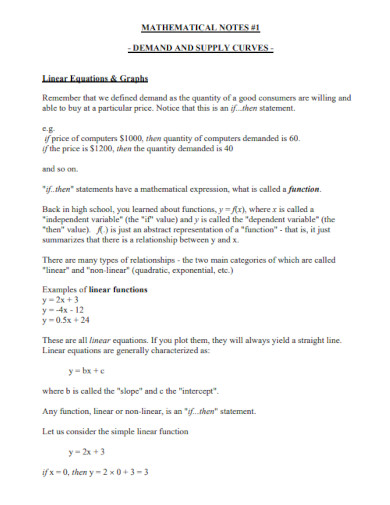
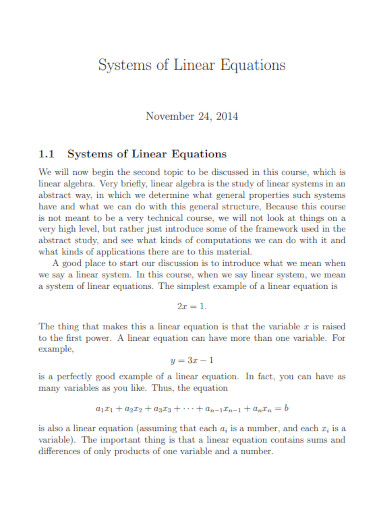
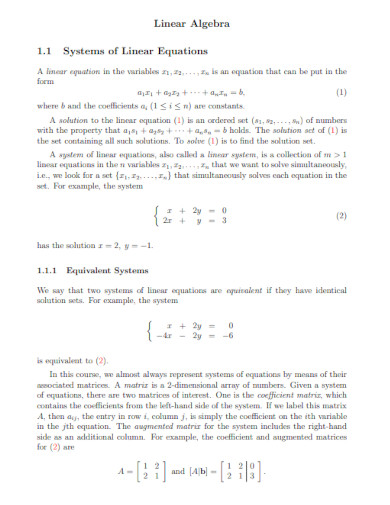
A linear equation is an algebraic equation in which each term is either a constant or the product of a constant and a single variable. Linear equations can be represented in various forms, but the most common is the standard form:
| Equations | Linear or Non-Linear |
|---|---|
| y = 8x – 10 | Linear |
| y = x² – 22 | Non-Linear, the power of the variable x is 2 |
| √y + x = 4 | Non-Linear, the power of the variable y is 1/2 |
| y + 8x – 1 = 0 | Linear |
| y² – x = 7 | Non-Linear, the power of the variable y is 2 |
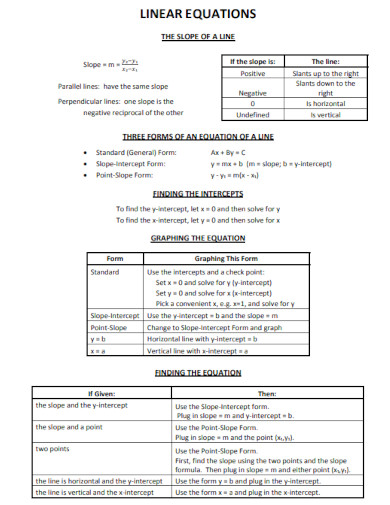
Linear Equation Formula
Standard Form:
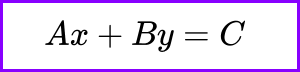
In this form, A, B, and C are constants. The equation describes a line in two-dimensional space, and neither variable is isolated on one side of the equation.
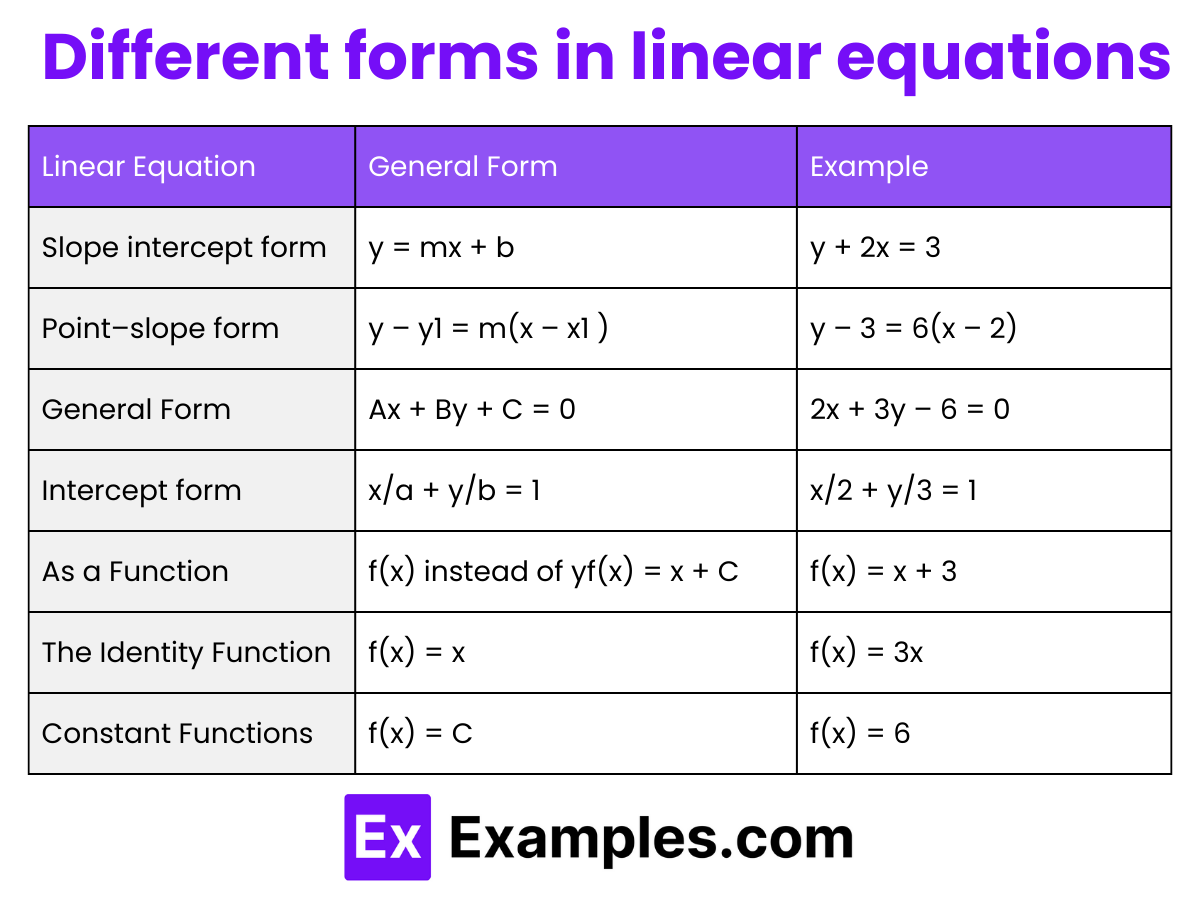
Slope-Intercept Form:
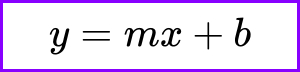
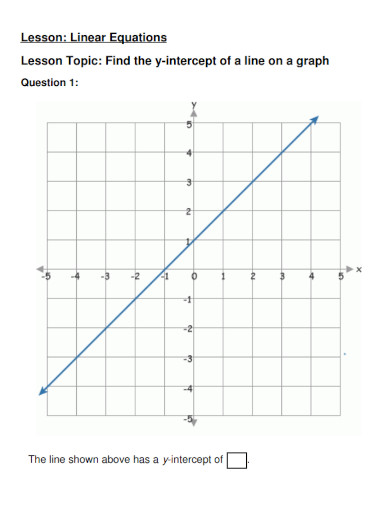
This is perhaps the most frequently used form when dealing with linear equations in basic algebra. Here, m represents the slope of the line, and b represents the y-intercept, which is the point where the line crosses the y-axis. This form makes it easy to graph the equation and to understand how changes in x affect y.
Point-Slope Form:
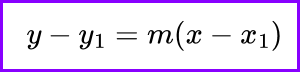
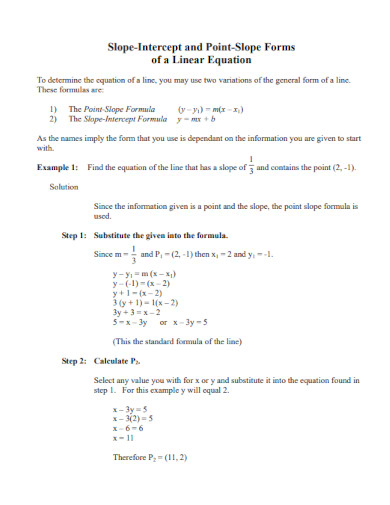
This form is useful when you know a point on the line (x₁,y₁) and the slope m. It’s particularly handy for writing the equation of a line when given a point and the slope without having to calculate the y-intercept.
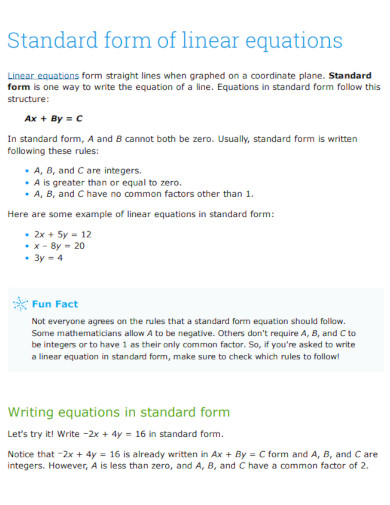
Linear Equations in Standard Form
- A, B, and C are real numbers, and A and B are not both zero.
- x and y are variables representing the coordinates on a Cartesian plane.
Key Characteristics of Standard Form:
- Coefficients are Integers: Typically, the coefficients A, B, and C are written as integers. If they are not integers, they can usually be converted to integers by multiplying the entire equation by an appropriate factor.
- Coefficient of x is Non-negative: It’s common practice, though not mandatory, to write the equation with A≥0 . If A is negative, the entire equation can be multiplied by -1 to make A positive.
- Intercepts: This form is particularly useful for easily finding the intercepts of the line with the x-axis and y-axis. To find the x-intercept, set y=0 and solve for x. To find the y-intercept, set x=0 and solve for y.
Linear Equation Graph
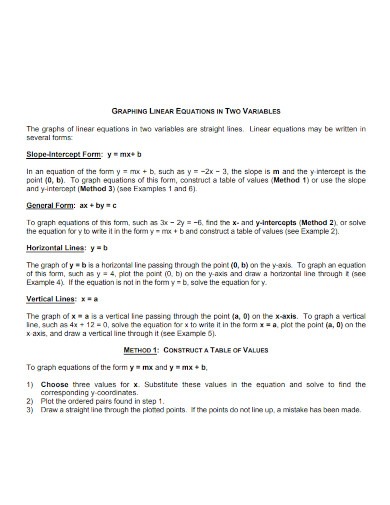
The graph of a linear equation involving one variable, such as x, forms a vertical line that is parallel to the y-axis. Conversely, if the equation involves only the variable y, the graph will be a horizontal line parallel to the x-axis. On the other hand, the graph of a linear equation involving two variables, x and y, forms a straight line. This allows us to visually interpret the relationship between the variables. Let’s explore how to graph a linear equation with two variables through the following example:
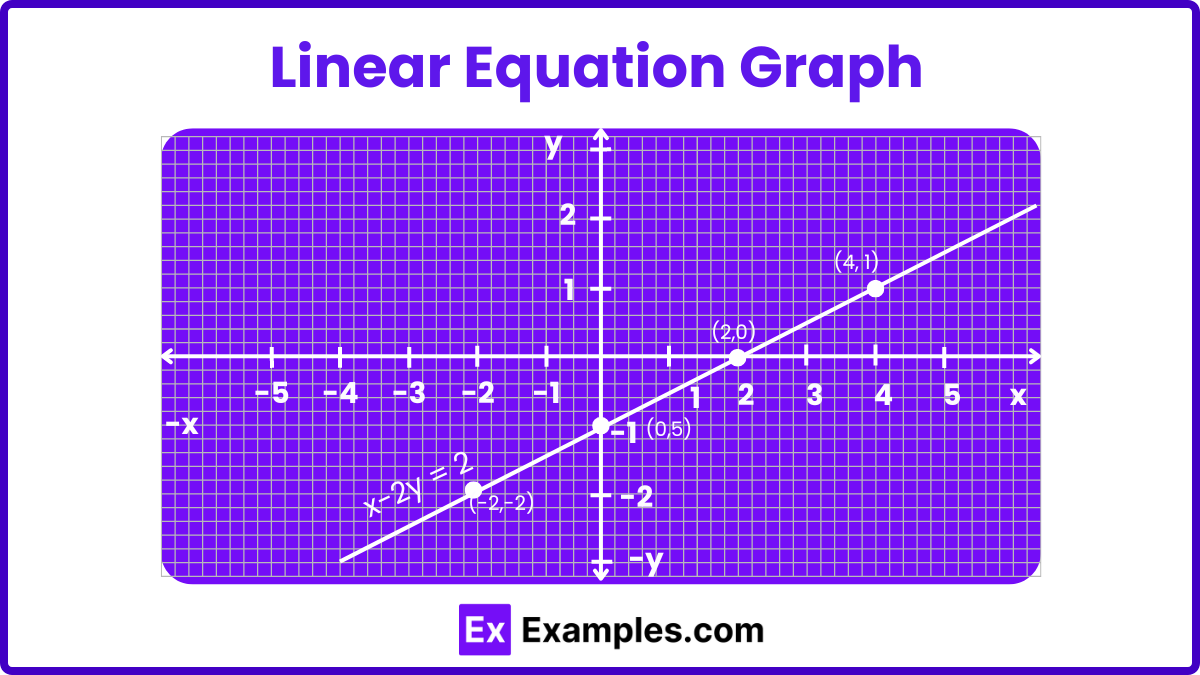
Example: Graphing the Linear Equation x−2y=2
To plot the graph of the linear equation in two variables, follow these steps:
Step 1: Identify the equation. The given equation is x−2y=2
Step 2: Convert the equation to slope-intercept form (y = mx + b). Rearrange x−2y=2 to express y in terms of x: y=(x/2)−1
This puts the equation in the form where m (slope) is 1/2 and b (y-intercept) is −1.
Step 3: Calculate coordinates by substituting different values of x.
- For x=0:
- y=2/0−1=−1
- This gives the point (0, -1).
- For x=2:
- y=2/2−1=0
- This gives the point (2, 0).
- For x=4:
- y=4/2 -1 = 1
- This gives the point (4, 1).
- For x=−2:
- y=-2/2−1=−2
- This gives the point (-2, -2).
Step 4: Plot these points and draw the line. List the coordinates and plot them on a Cartesian plane:
- (0, -1)
- (2, 0)
- (4, 1)
- (-2, -2)
| x | 0 | 2 | 4 | -2 |
|---|---|---|---|---|
| y | -1 | 0 | 1 | -2 |
Connect these points with a straight line to visualize the relationship defined by the equation y=x/2−1. Each pair of (x, y) values satisfies the equation, illustrating the linear relationship between x and y.
Linear equations in one variable and two variables:
Linear Equations in One Variable
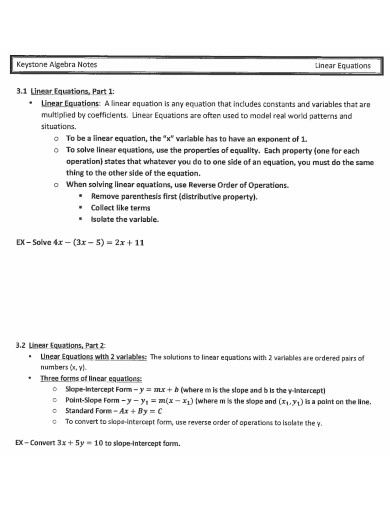
Definition: A linear equation in one variable is an equation that can be written in the form ax+b=0, where aaa and bbb are constants and x is the variable. The goal is to find the value of x that makes the equation true.
Standard Form: ax+b=0
Steps to Solve:
- Isolate the variable: Move all terms involving x to one side of the equation and constants to the other side.
- Simplify the equation: Combine like terms if necessary.
- Solve for the variable: Divide or multiply to get x by itself.
Example: Solve 3x+5=11
- Subtract 5 from both sides: 3x=6
- Divide by 3: x=2
Applications:
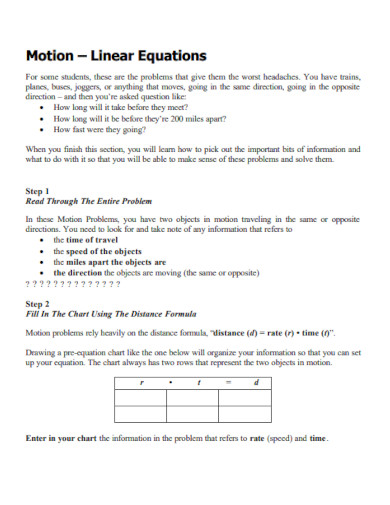
- Solving problems related to distance, speed, and time.
- Finding unknown quantities in financial problems.
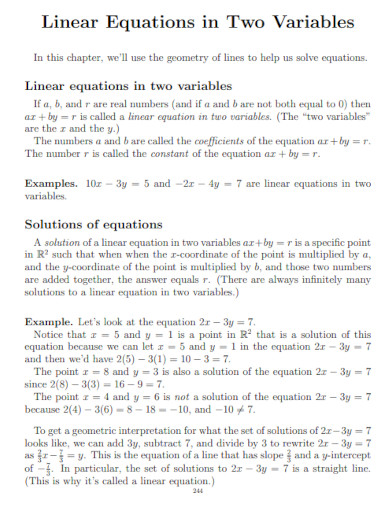
Linear Equations in Two Variables
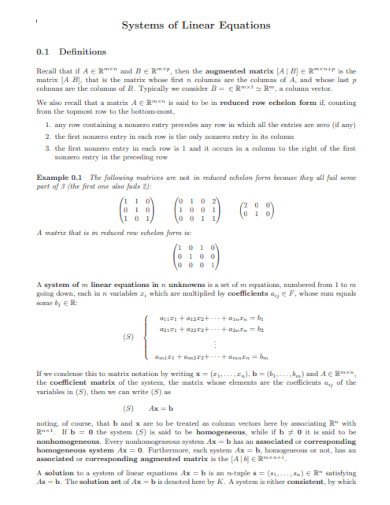
Definition: A linear equation in two variables is an equation that can be written in the form ax+by+c=0, where a, b, and c are constants, and x and y are variables. This type of equation represents a straight line when graphed on a coordinate plane.
Standard Form: ax+by+c=0
General Form: y=mx+b Where m is the slope and b is the y-intercept.
Methods to Solve:
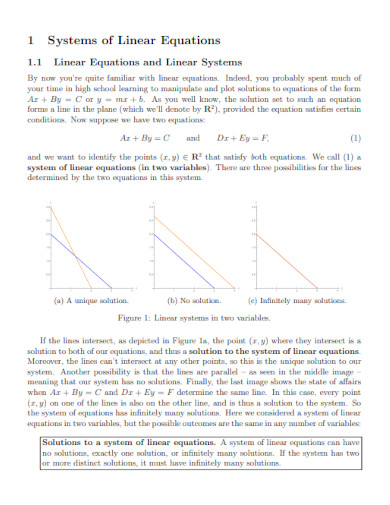
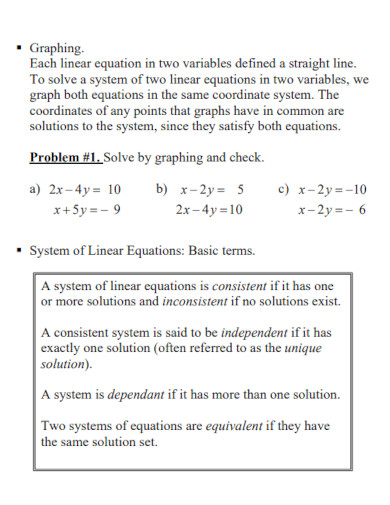
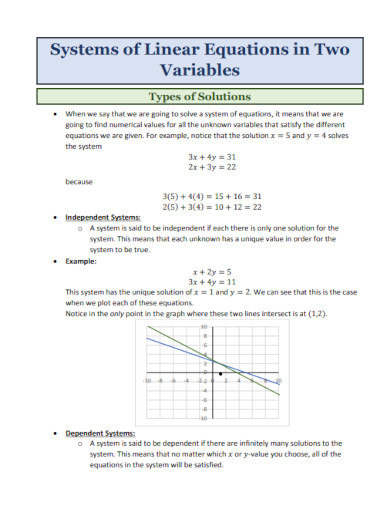
- Graphing:
- Plot the equation on a coordinate plane and identify the points where the line intersects the axes.
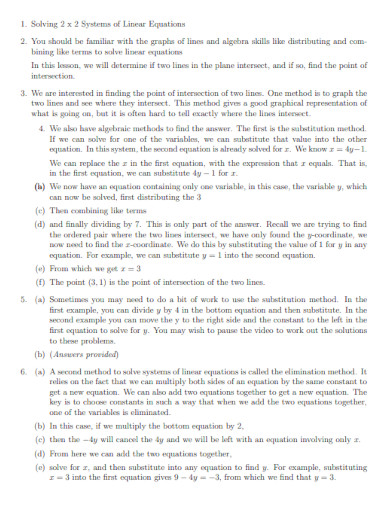
- Substitution Method:
- Solve one of the equations for one variable and substitute this value into the other equation.
- Elimination Method:
- Add or subtract equations to eliminate one variable, making it easier to solve for the remaining variable.
Different forms in linear equations
How to Solve Linear Equations
Solving Linear Equations in One Variable
Steps to Solve:
- Simplify Both Sides: If necessary, use the distributive property and combine like terms on each side of the equation.
- Isolate the Variable: Move all terms involving the variable to one side of the equation and constant terms to the other side.
- Solve for the Variable: Divide or multiply to isolate the variable and solve the equation.
Solving Linear Equations in Two Variables
Methods to Solve:
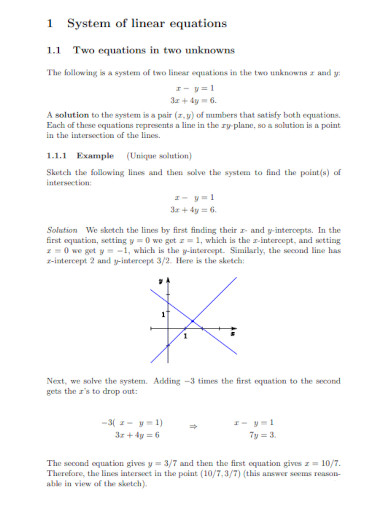
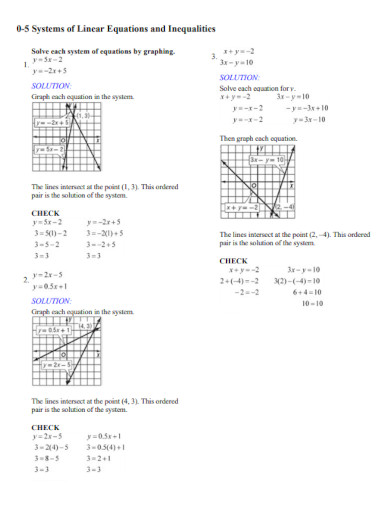
1. Graphing Method:
- Rewrite Equations: Put each equation in the slope-intercept form y=mx+b
- Graph Both Equations: Plot the lines on the same coordinate plane.
- Find Intersection: The point where the lines intersect is the solution
2. Substitution Method:
- Solve One Equation for One Variable: Express one variable in terms of the other.
- Substitute: Plug this expression into the other equation.
- Solve the Resulting Equation: Solve for the remaining variable.
- Back-Substitute: Use this value to find the other variable.
3. Elimination Method:
- Align Equations: Write both equations in standard form.
- Eliminate One Variable: Add or subtract equations to cancel out one variable.
- Solve for Remaining Variable: Solve the resulting single-variable equation.
- Back-Substitute: Use the found value to solve for the other variable.
Table of Contents
1. Graphing Linear Equations
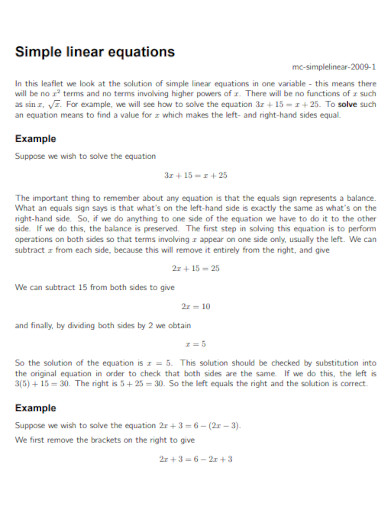
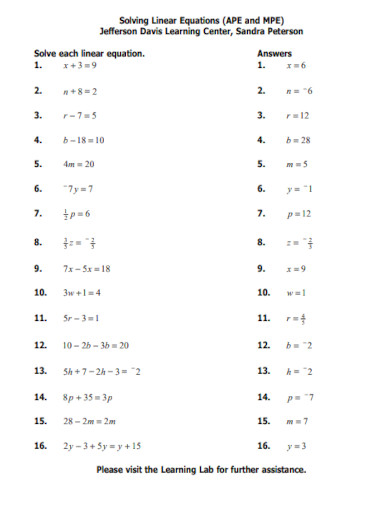
2. Simple Linear Equations
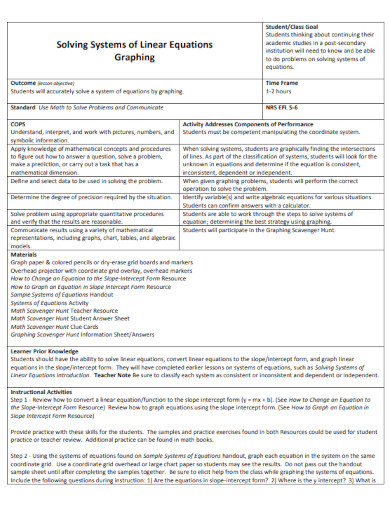
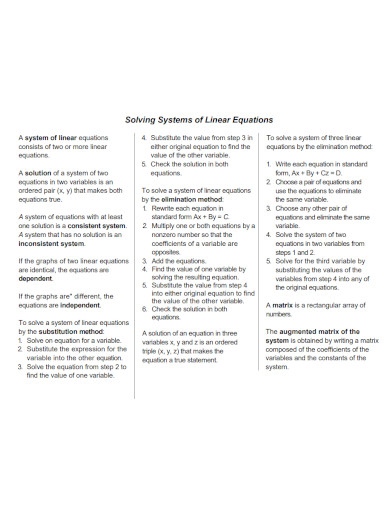
3. Solving Systems of Linear Equations
4. Point-Slope Forms of a Linear Equation
5. Linear Equations and Lines
6. Linear Equations in Two Variables
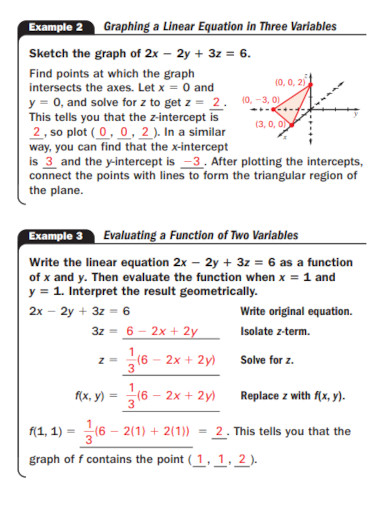
7. Linear Equations in Three Variables
8. Linear Equations
9. Systems of Linear Equations
10. Building and Solving Linear Equations
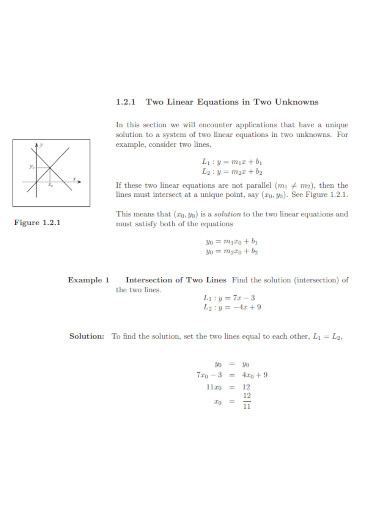
11. Two Linear Equations in Two Unknowns
12. Solving Linear Equations PDF
13. Linear Equations Example
14. Linear Equations Basic Terms
15. Linear Equations Sample
16. Linear Equations PDF
17. Linear Equations and Inequalities
18. Linear Equations Chapter
19. Linear Equations Format
20. Standard Linear Equations
21. Basic Linear Equations
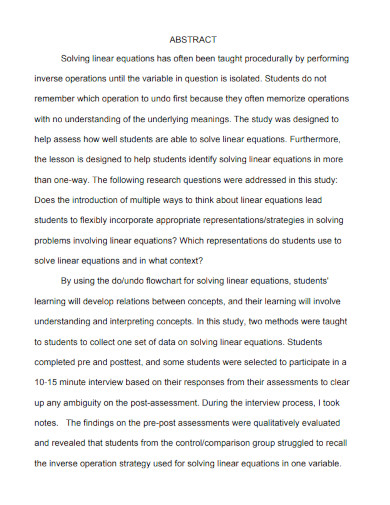
22. Linear Equations Abstract
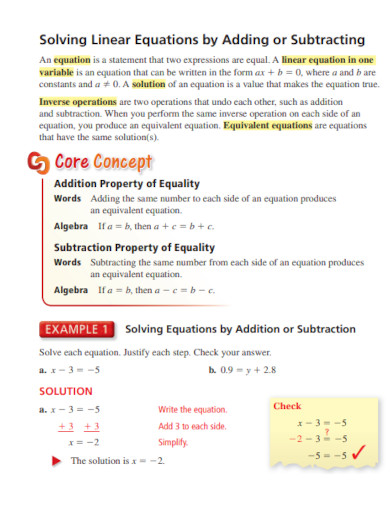
23. Linear Equations by Adding or Subtracting
24. Printable Linear Equations
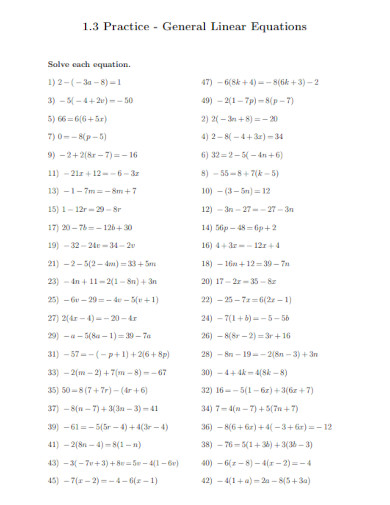
25. General Linear Equations
26. Solving Linear Equations in PDF
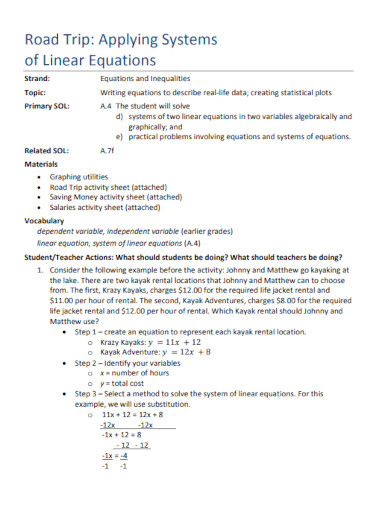
27. Applying Systems of Linear Equations
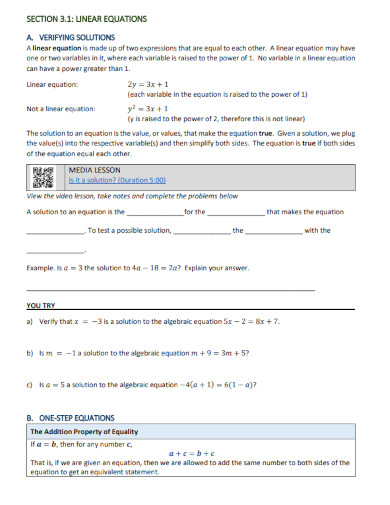
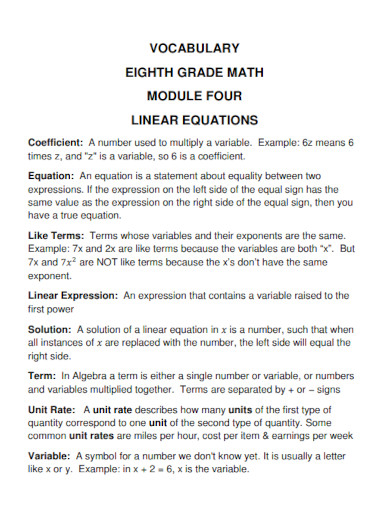
28. Linear Equations Vocabulary
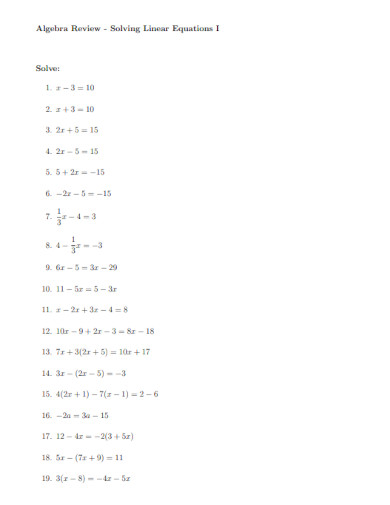
29. Algebra Linear Equations
30. Formal Linear Equations
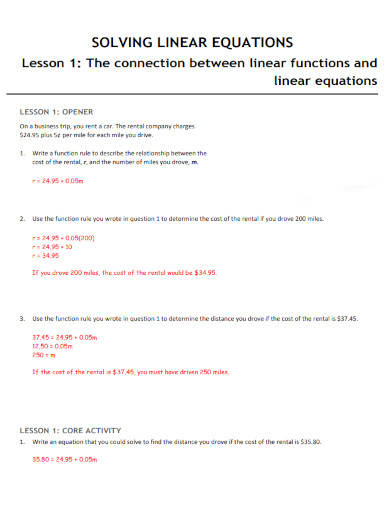
31. Linear Functions and Linear Equations
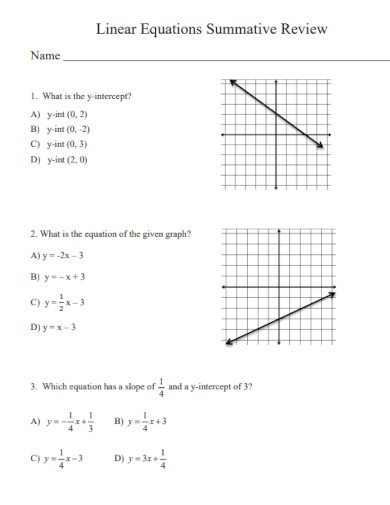
32. Linear Equations Summative Review
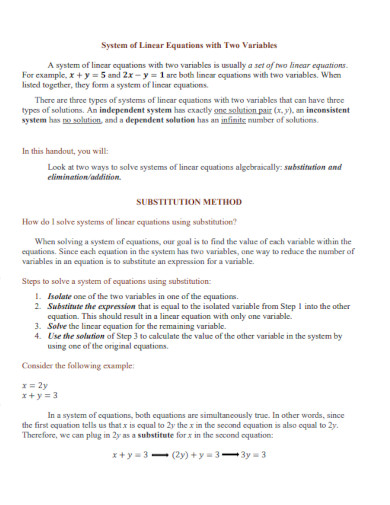
33. System of Linear Equations with Two Variables
34. Linear Equations Spring
35. Linear Equations for Maths
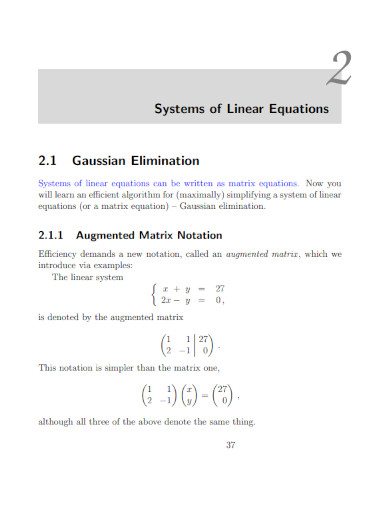
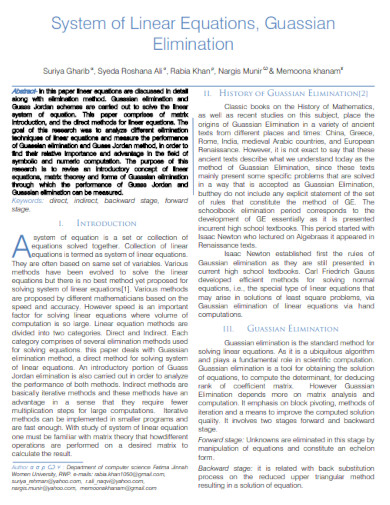
36. Linear Equations Guassian Elimination
37. Draft Linear Equations
38. About Linear Equations
39. Problems Leading to Linear Equations
40. A Linear Equations
41. Maths Linear Equations
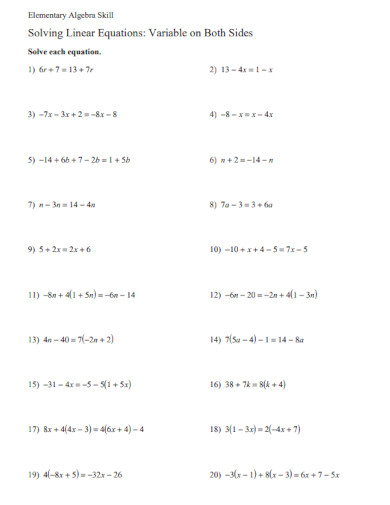
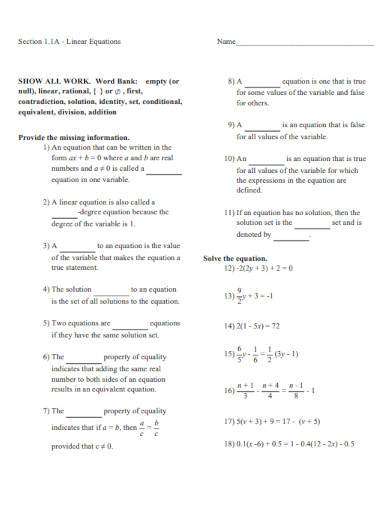
42. Elementary Algebra Linear Equations
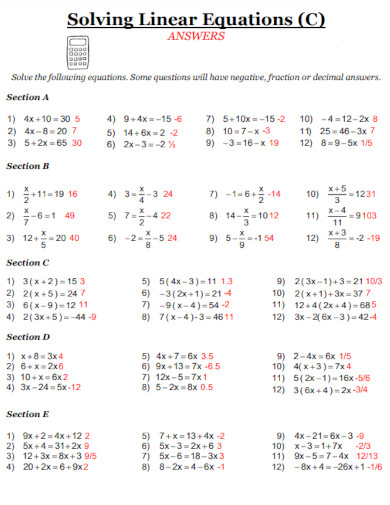
43. Linear Equations Sloving Sheet
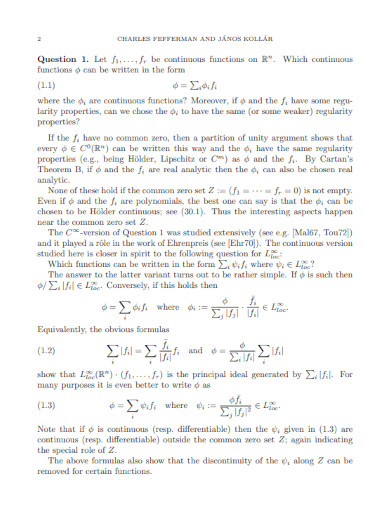
44. Continuous Solutions of Linear Equations
45. Short Linear Equations
46. Order of Operations and Linear Equations
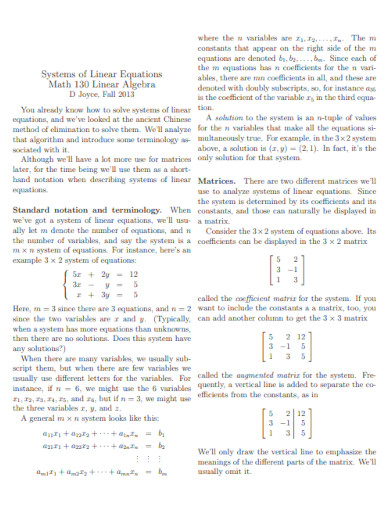
47. Linear Equations and Matrices
48. Linear Equations With Real Numbers
49. Linear Equations Using Chinese Methods
50. Standardising Linear Equations
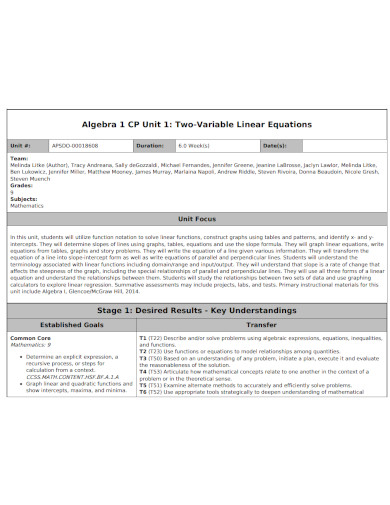
51. Two-Variable Linear Equations
52. Linear Equations Topic
53. Linear Algebra Equations
54. Linear Equations Overview
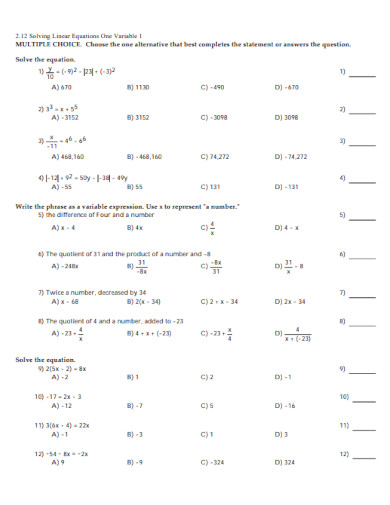
55. Linear Equations One Variable
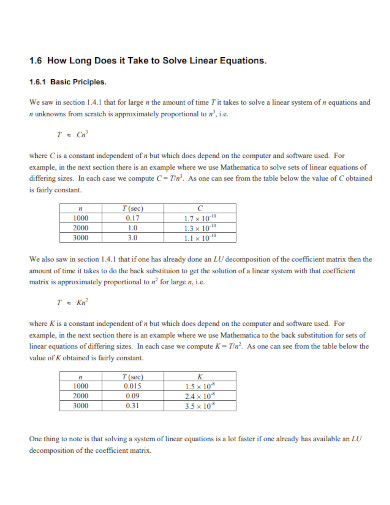
56. Linear Equations Basic Priciples
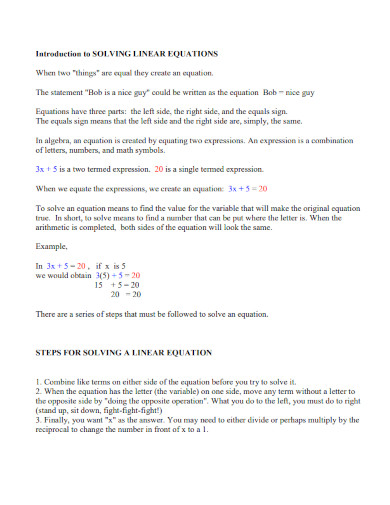
57. Introductions to Linear Equations
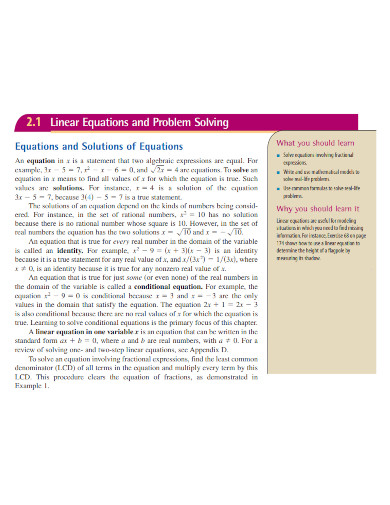
58. Linear Equations and Problem Solving
59. Basic Linear Equations in PDF
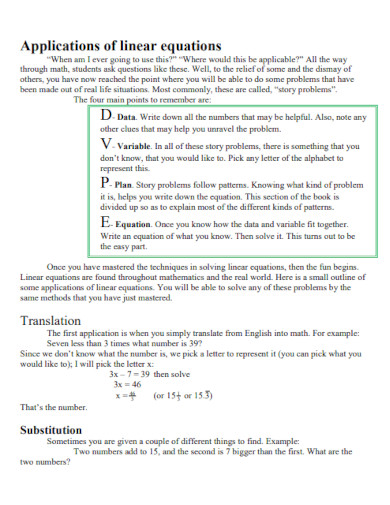
60. Applications of Linear Equations
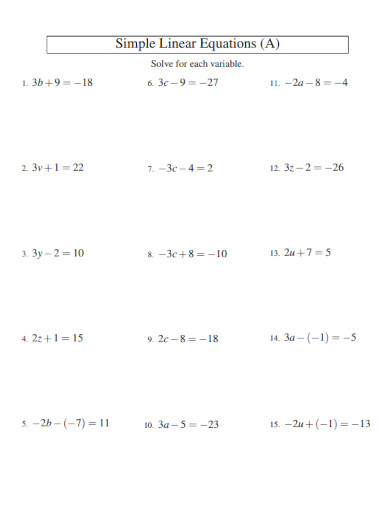
61. Simple Linear Equations Example
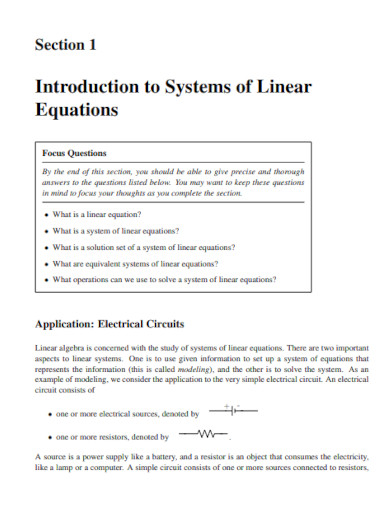
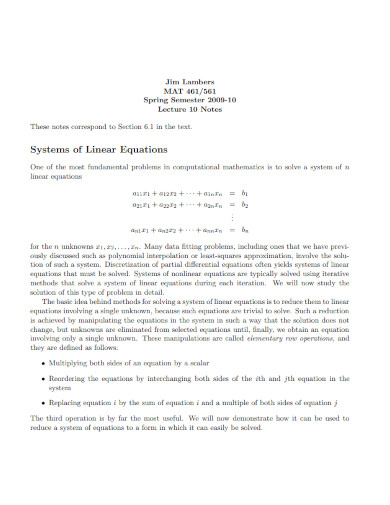
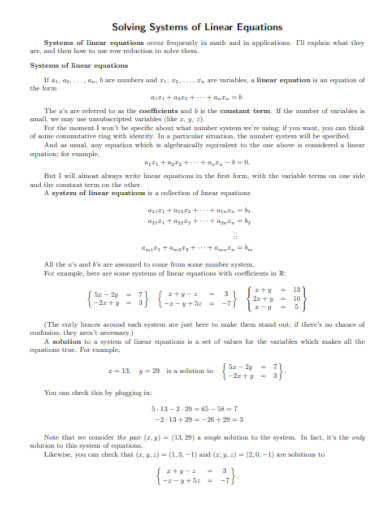
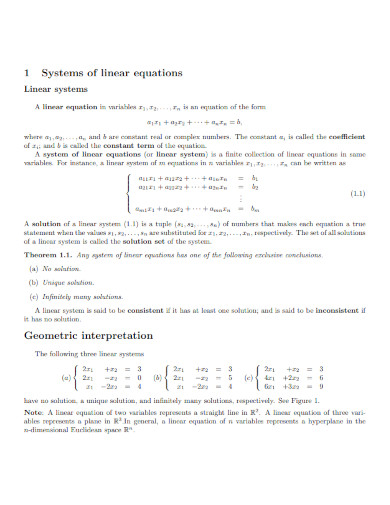
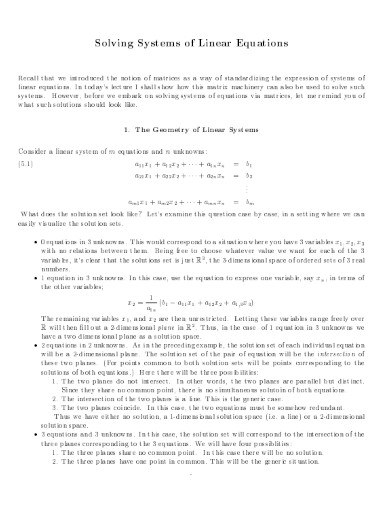
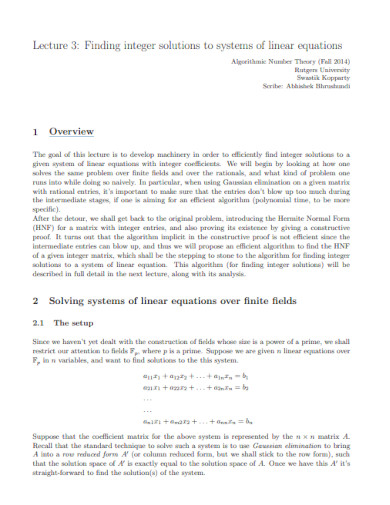
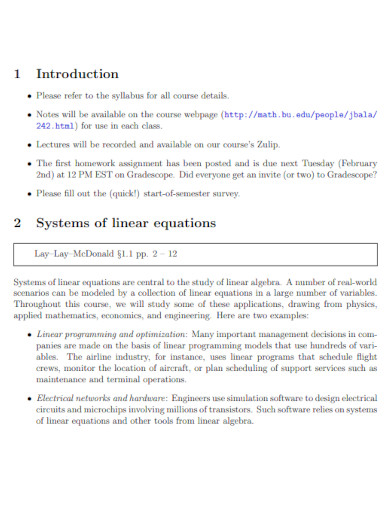
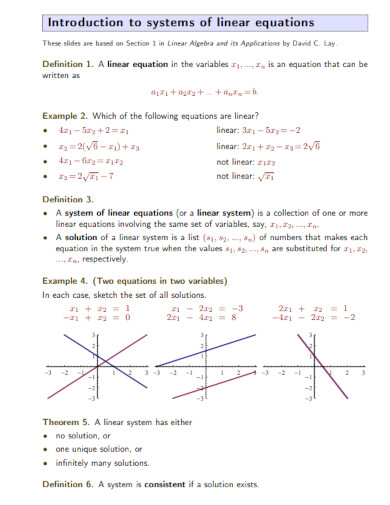
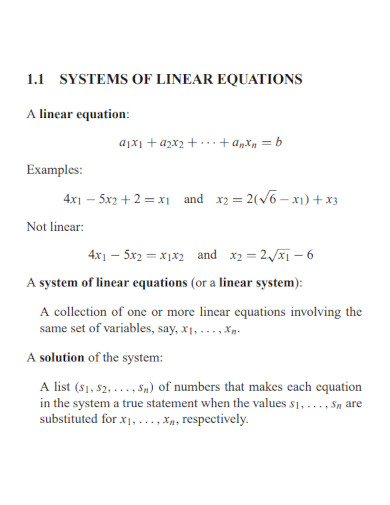
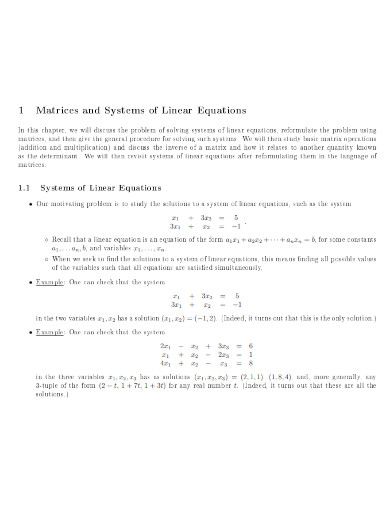
62. Introduction to Systems of Linear Equations
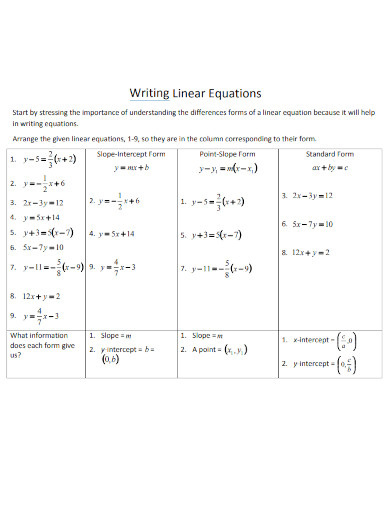
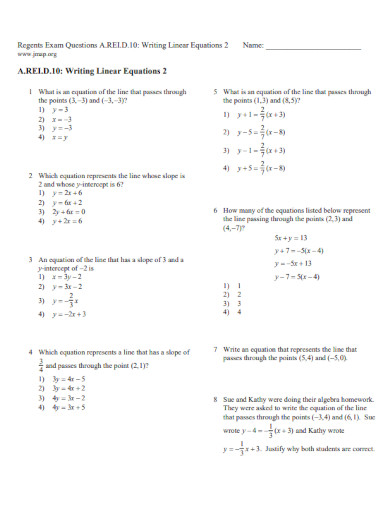
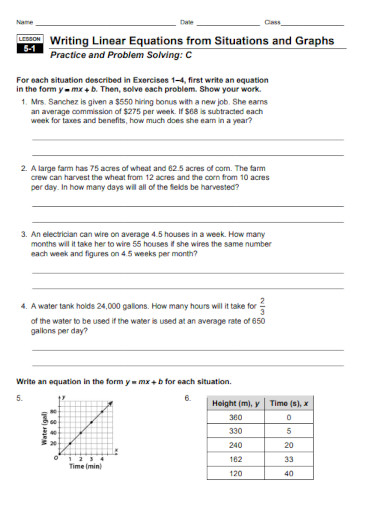
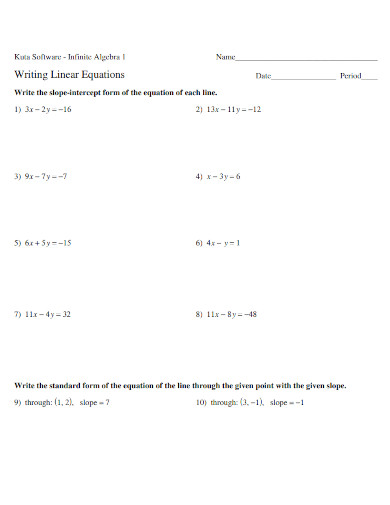
63. Writing Linear Equations
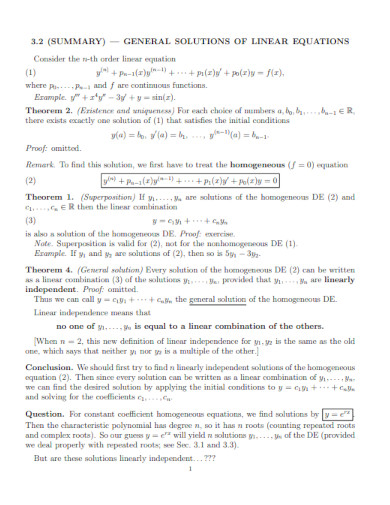
64. General Solutions of Linear Equations
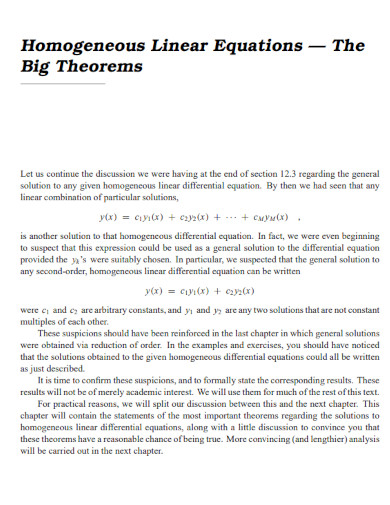
65. Homogeneous Linear Equations
66. Linear Equations Notes Example
67. Linear Equations Concept
68. Linear Equations and Functions
69. Solving Systems of Linear Equations PDF
70. Systems of Linear Equations Template
71. Linear Equations Unit
72. Linear Equations with Objectives
73. Linear Equations Mathematics
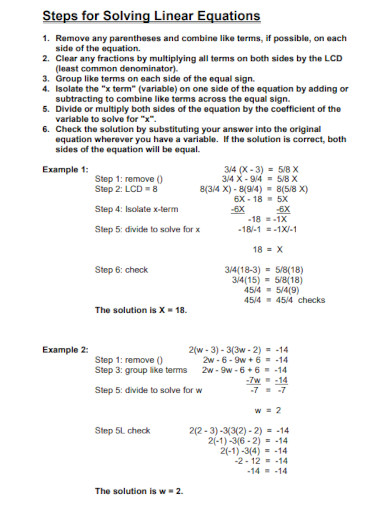
74. Steps for Solving Linear Equations
75. Linear Equations for Students
76. Algebra Linear Equations in PDF
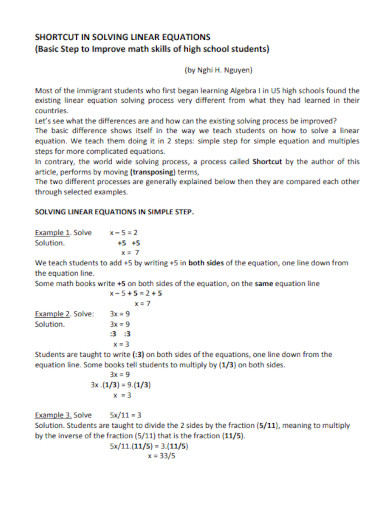
77. Shortcut in S0lving Linear Equations
78. Standard Form of Linear Equations
79. Linear Equations and Graphs
80. Linear Equations Writing in PDF
81. Solutions of Linear Equations
82. Linear Equations PDF Template
83. Professional Linear Equations
84. Linear Equations Lesson Example
85. Determining Linear Equations
86. Motion Linear Equations
87. Linear Equations for Class Students
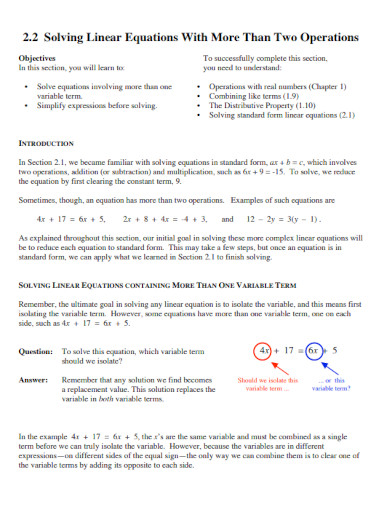
88. Linear Equations With More Than Two Operations
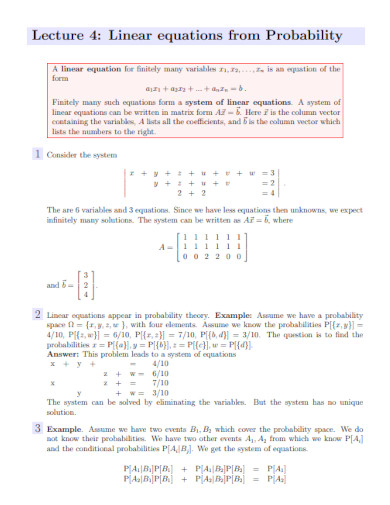
89. Linear Equations from Probability
90. Linear Equations from Situations and Graphs
91. Linear Equations in Graph
92. Linear Equations Notes PDF
93. Solving 2 x 2 Systems of Linear Equations
94. Linear Algebra Linear Equations
95. University Linear Equations
96. Linear Equations Inequalities and Absolute Values
97. Linear Equations Sheet in PDF
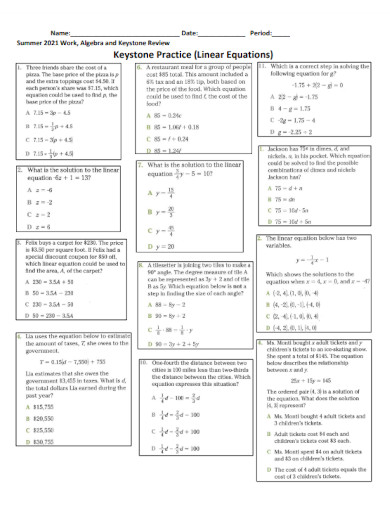
98. Linear Equations Keystone Practice
99. Writing Linear Equations in Algebra
100. Linear Equations Simple Notes
What Are Linear Equations
Linear equations are equations that illustrate the proportional relationship between two variables and points. Simple linear equations are equations with a single variable, while there are linear equations with two variables, and even linear equations with three variables. All of which have their systems of linear equations and ways of solving said linear equations.
How to Graph Linear Equations
A can come in many different forms. The standard form of a linear equation with two variables is Ax + By = C where x is the X coordinate, y is the Y coordinate, and C is the constant number. One variable linear equation will come in the form of Ax + B = C.
1.) Write Down the Equation
Begin by writing down the equation in a physical note, or digital note-taking software. This will help you visualize the equation without needing to backread the question.
2.) Discern Whether the Equation has One Point or Two Points
When you have finished writing down the equation, check whether the equation has one point or two points. You will be able to know this by the presence of X and Y coordinates in the equation. If the equation follows the Ax + By + C = 0 formats, it will require specific X and Y values that you can obtain from a different formula. Only use this how-to with equations that use the standard form of the linear equation or the standard one-variable linear equation.
3.) Simplify the Equation
When you have finished discerning the equation, you must simplify the equation to its simplest form. This means if there is a common denominator between the three variables, then you must divide them by said common denominator.
4.) Isolate One of the Points in the Equation
After you have simplified the equation, you must isolate and move one of the variables to the equals sign. The equation would either come in the form of x = C – B, Ax = C – By, or By = C – Ax.
5.) Equate the Isolated Point to a Specific Number, and Solve for the Second Point
After isolating one of the points, you must now substitute the isolated variable with specific points. For example, if 2x = 2 – Y is the linear equation, we can substitute the x value to be x = 0. The equation will then become 2(0) = 2 – Y, which will equal to Y = 2.
6.) Repeat Step Five at least Four Times, and Graph the Coordinates
Repeat these steps until you have up to four sets of X and Y coordinates, note that each set will be a pair. Following the example above, the set of X and Y coordinates will be (0,2). Once you have four sets of these coordinates, graph the linear equation into the cartesian plane using these coordinates as your reference points. Afterward, you will connect all the reference points to create a straight line.
FAQs
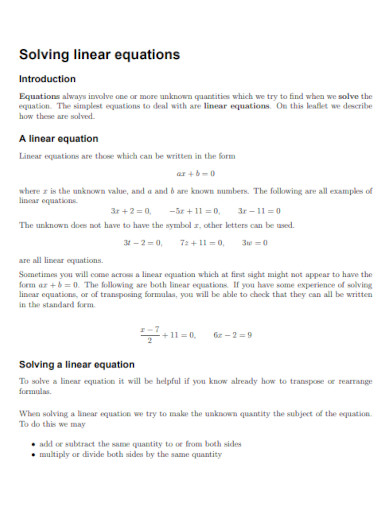
To solve linear equations, isolate the variable by performing inverse operations. Simplify the equation step-by-step, combining like terms and balancing both sides until the variable is isolated.
A linear equation has variables with an exponent of 1 and graphs as a straight line. It typically appears in the form ax+b=c Where a, b, and c are constants.
Linear equations represent relationships where the change between variables is constant. They are expressed in the form ax+by=c, producing straight-line graphs.
A linear equation is an algebraic equation with a constant rate of change between variables, represented as a straight line. Examples: y= 4x+2, 2x+3y = 6
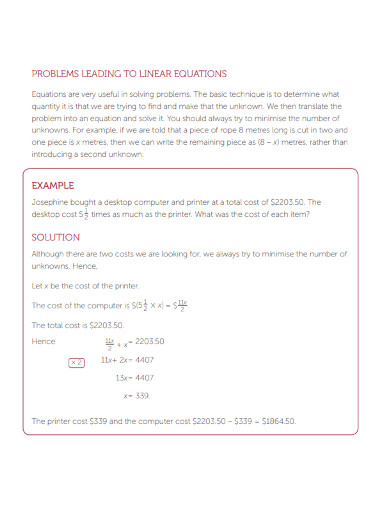
A real-life example of a linear equation is calculating the total cost (C) of items given a fixed price per item (p) and quantity (q): C=pq.
A linear equation is like a simple rule that tells you how to get from one number to another using addition, subtraction, multiplication, or division. For example, if you have 2x+3=7, you find out what number makes it true.
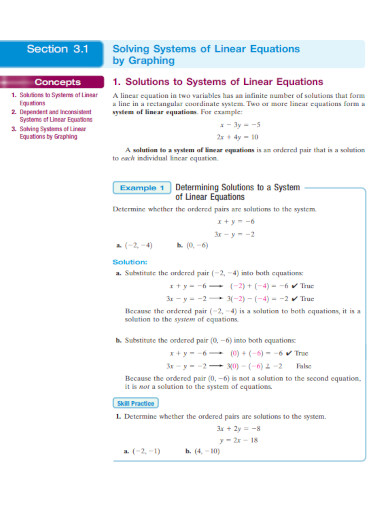
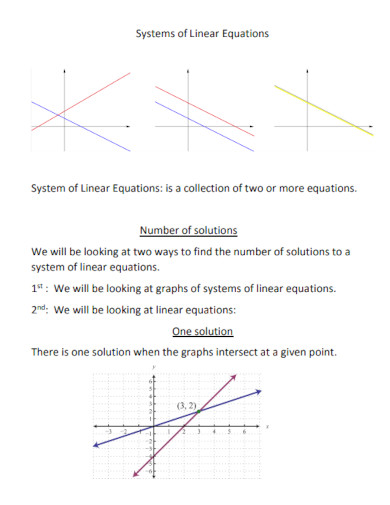
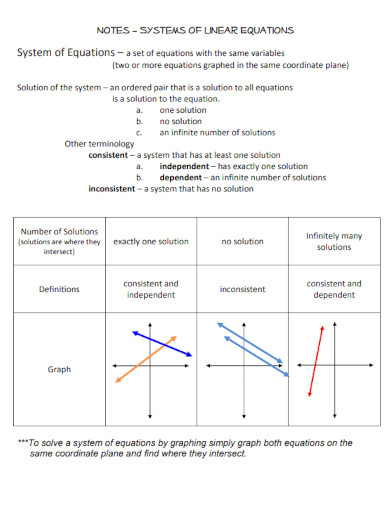
Two linear equations form a system that can be solved together to find the values of variables that satisfy both equations. This can be done through methods like substitution or elimination.
Linear equations are equations and solutions that describe the direct relationship between two variables or values. These two values are often represented by the letters X and Y, which can be solved to obtain four points that will create a straight line.