Vol.
43,
No.
1,
January–February
2013,
pp.
48–61
ISSN
0092-2102
(print)
ISSN
1526-551X
(online)
http://dx.doi.org/10.1287/inte.1120.0661
© 2013
INFORMS
THE FRANZ EDELMAN AWARD
Achievement in Operations Research
Hewlett
Packard:
Delivering
Profitable
Growth
for
HPDirect.com
Using
Operations
Research
Rohit
Tandon,
Arnab
Chakraborty,
Girish
Srinivasan,
Manav
Shroff,
Ahmar
Abdullah,
Bharathan
Shamasundar,
Ritwik
Sinha
Hewlett
Packard
Global
Analytics,
Bangalore-560093,
India
{rohit.tandon@hp.com,
arnab.chakraborty@hp.com,
girish.srinivasan@hp.com,
manav.shroff@hp.com,
ahmar.abdullah@hp.com,
bharathan.shamasundar@hp.com,
ritwik.sinha@hp.com}
Suresh
Subramanian,
Dave
Hill
Hewlett
Packard,
HPDirect.com,
Cupertino,
California
95014
{suresh.subramanian@hp.com,
david.w.hill@hp.com}
Prasanna
Dhore
Hewlett
Packard
Corporate
Marketing–Customer
Intelligence,
Palo
Alto,
California
94304,
prasanna.dhore@hp.com
Hewlett
Packard
(HP)
entered
the
online
consumer
sales
business
with
its
launch
of
HPDirect.com,
a
portal
that
allows
consumers
to
purchase
HP
products
(e.g.,
desktop
and
notebook
computers,
printers,
accessories,
supplies)
online.
This
paper
describes
operations
research
solutions
to
a
variety
of
problems
in
the
e-commerce
value
chain.
HP’s
objective
was
to
use
these
solutions
to
grow
its
share
in
the
online
sales
market.
First,
we
identify
and
quantify
the
impact
of
key
drivers
of
online
traffic
to
enhance
our
market
planning
and
budget
allocation
process.
Next,
we
apply
Bayesian
modeling
and
Markov
chain
methods
to
predict
which
customers
are
most
likely
to
buy
which
product,
and
when
and
through
which
marketing
channel
they
are
likely
to
make
a
purchase.
Finally,
we
use
a
hybrid
forecasting
approach
combining
time-series
and
regression
modeling
to
predict
customer
orders
for
optimizing
warehouse
inventory
holding
and
ensuring
timely
fulfillment
of
customer
orders.
Since
2009,
the
integration
of
these
solutions
into
HP’s
marketing
planning
and
warehouse
operations
processes
has
helped
to
generate
an
additional
$117
million
in
revenue
for
HPDirect.com.
Key
words
:
HP;
online
sales;
e-commerce;
demand
modeling;
customer
targeting;
marketing
spend
optimization;
forecasting;
time
series;
Bayesian
modeling;
linear
discriminant
analysis;
Markov
analysis;
linear
programming;
analytics.
H
ewlett
Packard
(HP)
is
the
world’s
largest
provider
of
information
technology
infrastruc-
ture, software, services, and solutions. It caters to indi-
viduals, businesses, and nonprofit organizations of all
sizes
in
170
countries.
Traditionally,
the
company
has
marketed
its
products
and
services
through
an
indi-
rect
channel
(i.e.,
third
parties),
which
comprised
its
sales networks and strong retail partnerships. Follow-
ing
the
Internet
revolution
of
the
1990s,
HP
revisited
its marketing strategy; as a result, it entered the online
consumer
sales
business
to
seize
opportunities
from
the
worldwide
boom
in
e-commerce
and
to
comple-
ment
its
strengths
in
retail
selling.
In January 1998, HP launched HPDirect.com (http://
www.HPDirect.com),
its
online
sales
channel
in
the
United
States,
to
allow
consumers
to
purchase
prod-
ucts online from HP and have them delivered to their
homes. These products include desktop and notebook
48
Tandon
et
al.:
Delivering
Profitable
Growth
for
HPDirect.com
Using
OR
Interfaces
43(1),
pp.
48–61,
© 2013
INFORMS
49
computers,
printers,
accessories
(e.g.,
mice,
adapters),
and
supplies
(e.g.,
ink,
paper,
toner).
Given
its
pri-
mary
dependence
on
the
indirect
channel
(i.e.,
brick
and
mortar
retail
stores),
establishing
HPDirect.com
as
a
successful
route
to
market
became
a
core
chal-
lenge
for
HP,
because
the
company
had
to
be
care-
ful
not
to
alienate
key
retail
partners
such
as
Best
Buy
and
Walmart.
Moreover,
HP
was
facing
stiff
competition
from
Dell,
the
first
company
to
build
a
major
online
personal
computer
(PC)
sales
base
in
the
United
States.
By
2002,
more
than
50
percent
of
PC-related
sales
were
direct,
with
Dell
established
as
the leading player in the Internet-based direct channel
(Rosenthal 2003). Clearly, HP had to enhance its direct
marketing
strategy
to
retain
its
overall
leadership
in
the
PC
market.
In
2008
HPDirect.com
management
was
given
the
mandate to grow its online sales by 150 percent over a
three-year
period,
within
limited
marketing
budgets.
To improve sales, HPDirect.com marketing teams had
to first increase traffic (i.e., attract a greater number of
visitors
to
the
online
portal).
To
convert
these
visitors
into
customers,
the
team
had
to
develop
a
suitable
targeting
strategy—a
way
to
focus
marketing
efforts
on visitors most
likely to
buy.
It
evaluated
the buying
potential of each visitor based on that visitor’s brows-
ing
behavior.
For
visitors
who
had
previously
bought
from HP, their demand for the products had to be esti-
mated,
based
on
their
past
purchasing
patterns.
Mak-
ing
these
estimations
was
a
complex
task,
given
the
broad
portfolio
of
HP
product
categories.
The
mar-
keting
teams
had
to
estimate
demand
for
each
prod-
uct
category
and
assess
which
product
category
each
potential
customer
would
be
likely
to
buy.
Furthermore,
HP
had
to
ensure
that
it
could
meet
the
generated
demand
adequately
and
on
time.
This
required highly accurate order forecasts to ensure that
the third-party warehouses, which house and ship the
products
on
behalf
of
HP,
could
efficiently
manage
inventory.
Inaccurate
order
forecasts
could
result
in
understaffing,
leading
to
order
cancellations
and
cus-
tomer dissatisfaction, or overstaffing, leading to ware-
house
penalties
and
increased
costs.
Determining
which
marketing
channel
to
adopt
to
reach
different
customers
for
different
products
was
also
a
challenge.
A
number
of
marketing
channel
options
are
available,
including
emails
and
news-
letters,
comparison-shopping
sites
(e.g.,
cnet.com,
zdnet.com), affiliate sites (e.g., fatwallet.com, commis-
sionjunction.com), paid search results (e.g., sponsored
links
in
google.com,
yahoo.com,
and
bing.com),
and
HP’s
corporate
website
(HP.com).
This
entire
effort
had to be executed on an optimized marketing budget.
Summarily,
the
HPDirect.com
team
was
faced
with
the
threefold
task
of
acquiring
new
customers,
devel-
oping
recently
acquired
customers
into
loyalists
by
offering
them
the
right
product
choices
at
the
right
time
and
through
the
right
marketing
channels,
and
retaining
loyalists
by
ensuring
a
satisfying
and
seam-
less
user
experience
through
cost-efficient
strategies.
To
meet
these
challenges,
HP
had
to
gain
a
bet-
ter understanding of its customer base, including cus-
tomer
purchase
preferences
and
expected
purchase
behavior.
It
had
traditionally
relied
on
ad
hoc
busi-
ness rules, framed by marketers’ perceptions, for driv-
ing
marketing
decisions.
These
decisions
were
not
backed
by
robust
data;
because
they
were
primar-
ily
based
on
judgment,
they
were
not
optimal.
Thus,
HP
had
an
immediate
need
to
reengineer
its
exist-
ing
processes,
to
equip
them
with
objective
insights
into
customers’
purchase
preferences,
using
more
sci-
entific
methods.
As
Suresh
Subramanian,
then
vice
president
and
general
manager
of
HPDirect.com,
acknowledged,
“HP’s
ability
to
launch
and
drive
an
e-commerce
business
profitably
within
a
multichan-
nel
environment
depends
heavily
on
the
application
of
OR
techniques
and
advanced
analytics
to
optimize
daily
business
decisions.”
Solutions
The
data
scientists
in
HP
Global
Analytics
(GA)
addressed
this
need
for
a
reliable
and
data-driven
analytical
approach.
They
used
mathematical
pro-
gramming,
Bayesian
modeling,
regression
modeling,
and
time-series
forecasting
techniques
to
develop
a
set
of
data-driven
solutions
for
customer
acquisition,
development,
and
retention.
The
first
set
of
solutions,
Solution
A,
enables
the
HPDirect.com
team
to
understand
the
impact
of
key
marketing
activities
on
online
traffic.
A
multiple
lin-
ear
regression
(MLR)
model
helps
identify
the
key
drivers
of
online
traffic
and
quantifies
their
relative
impact.
In
addition,
traffic
(i.e.,
number
of
visitors
to
the
online
portal)
to
each
product
category
Web
Tandon
et
al.:
Delivering
Profitable
Growth
for
HPDirect.com
Using
OR
50
Interfaces
43(1),
pp.
48–61,
© 2013
INFORMS
page
is
predicted
using
time-series
forecasting
tech-
niques.
A
budget
optimization
framework,
based
on
linear programming (LP), further helps the marketing
teams
in
allocating
their
budgets
across
the
various
marketing
channels.
This
framework
seeks
to
maxi-
mize
total
revenue,
based
on
the
return
on
marketing
spend
of
each
marketing
channel
and
product
cate-
gory
combination.
The
second
set
of
solutions,
Solution
B,
helps
the
marketing
teams
to
identify
which
customers
are
most likely to purchase, and when. It provides a thor-
ough
understanding
of
the
technology
needs
of
these
customers,
enabling
the
teams
to
target
them
with
differentiated
messaging,
through
the
most
suitable
channel
(e.g.,
email,
printed
mail).
It
also
provides
product
recommendations
based
on
the
customers’
historical
purchases
with
HP.
The
third
set
of
solutions,
Solution
C,
helps
to
increase
efficiency
of
downstream
warehouse
oper-
ations
by
improving
the
accuracy
of
customer
order
forecasts,
using
a
hybrid
forecasting
approach
that
combines
time-series
modeling
with
MLR.
We
describe
each
solution
in
detail
below.
Solution
A
Solution
A
comprises
demand-generation
models
for
traffic
and
optimizing
return
on
investment.
Cus-
tomers
can
choose
to
buy
technology
products
from
either
the
online
channel
or
retail
stores.
HP
mar-
keters must choose which products to promote, which
customer
segments
to
target,
and
which
marketing
channels
to
use.
The
variety
of
such
choices
and
lim-
ited
marketing
budgets
make
developing
an
opti-
mal
marketing
strategy
a
challenge.
Solution
A
helps
address
these
challenges
by
(1)
identifying
the
key
drivers
of
online
traffic
and
quantifying
their
contri-
butions,
and
(2)
optimally
allocating
the
marketing
budget
to
different
marketing
channels.
Identifying
Key
Drivers
of
Online
Traffic
and
Quantifying
Their
Contributions
Customer
visits
to
HPDirect.com
originate
from
both
paid
and
unpaid
traffic
sources.
Unpaid
sources
include search results from websites (e.g., google.com,
bing.com,
yahoo.com)
and
redirects
from
HP’s
corporate
website
(HP.com).
Paid
sources
include
affiliate websites (e.g., fatwallet.com, commissionjunc-
tion.com),
paid
search
results
(e.g.,
sponsored
links
in
google.com,
yahoo.com,
bing.com),
comparison
shopping sites (e.g., cnet.com, zdnet.com), emails, and
newsletters.
To
identify
the
key
drivers
of
traffic
to
HPDirect
.com,
we
developed
traffic
forecast
models—one
for
each
of
the
four
main
product
category
Web
pages:
notebooks,
desktops,
printers,
and
accessories.
Each
product
category
has
multiple
Web
pages
associated
with it. The objective of the models is to forecast visits
across
the
set
of
all
Web
pages
associated
with
each
product
category.
The
models
are
based
on
a
combi-
nation
of
time-series
forecasting
and
regression
tech-
niques,
and
are
developed
using
statistical
software,
such
as
SAS
Enterprise
Guide,
Oracle’s
Crystal
Ball,
and
JMP.
We
list
below
the
major
steps
adopted
in
this
new
methodology.
Step
1.
Visualization.
We
first
visualize
the
histor-
ical
traffic
data
(i.e.,
the
number
of
online
visits)
consolidated
at
a
weekly
level,
over
two
years,
to
detect
seasonality
and
trends.
We
observe
that
traffic
peaks
during
major
sale
seasons
(Black
Friday,
Cyber
Monday,
Christmas
holidays)
and
troughs
before
the
start
of
the
back-to-school
season.
Step
2.
Data
codification.
To
relate
the
seasonality
and
trends
observed
to
specific
marketing
activities
and
sale
seasons,
we
codify
all
the
marketing
activ-
ities
and
sale
seasons
over
the
two-year
time
frame.
For
example,
the
presence
of
a
specific
marketing
activity
or
a
major
sale
season,
such
as
back-to-
school
or
Christmas,
during
a
given
week
is
codified
as
a
binary
variable
with
a
value
of
0
(absent)
or
1
(present),
and
the
number
of
HP
notebook
promo-
tions in a given week is codified as an ordinal variable
with
values
1
1
2
1
3
10001n
.
This
is
done
to
enable
the
inclusion
of
these
variables
in
an
operations
research
(OR)
statistical
modeling
exercise
later.
Step
3.
Time-series
modeling.
Time-series
models,
autoregressive
integrated
moving
average
(ARIMA),
are
used
to
generate
traffic
forecasts
for
each
of
HPDirect.com’s
main
product
category
Web
pages.
The
basic
principle
is
to
identify
the
main
compo-
nents
of
Web
traffic—trend
and
seasonality—and
to
then
model
the
two
components
based
on
historical
values
of
Web
traffic.
Tandon
et
al.:
Delivering
Profitable
Growth
for
HPDirect.com
Using
OR
Interfaces
43(1),
pp.
48–61,
© 2013
INFORMS
51
Step
4.
MLR
models.
Parallel
to
the
time-series
modeling
effort,
we
develop
regression
models
for
each
product
category
Web
page
to
understand
the
influence
of
key
drivers
on
traffic.
The
data
from
the
codification
step
were
used
as
the
independent
variables
and
the
weekly
traffic
data
as
the
depen-
dent
variables.
The
statistically
significant
variables
were
then
identified
through
an
iterative
process.
For
example,
the
notebook
traffic
regression
model
(with
a
R
-square
value
of
0.7)
had
the
following
types
of
independent
variables
with
a
statistically
significant
impact on traffic to the notebook category pages:
•
marketing
spend
on
search
and
display
advertisements;
•
use
of
coupons
on
affiliate
sites;
•
holiday
events;
and
•
presence
of
desktop-
or
supplies-related
promo-
tions
in
the
email
message
and
the
number
of
such
email
campaigns
over
the
forecast
period.
The
first
three
significant
variables
had
a
positive
impact
on
traffic;
however,
the
fourth
had
a
negative
impact.
Step
5.
Model
integration.
We
take
the
output
of
the
time-series
model
as
the
baseline
traffic
forecast.
The
integration
of
the
regression
models
(Step
4)
and
the
weekly
baseline
traffic
forecasts
(Step
3)
provides
the
recalibrated
traffic
forecasts
based
on
upcoming
planned marketing activity. The models are integrated
as
follows:
(1)
first,
the
coefficients
of
the
significant
variables
in
the
regression
equation
are
expressed
in
percentage
terms
to
reflect
their
relative
contribution
in
explaining
the
regression
forecast;
(2)
binary
vari-
ables created earlier are used to estimate the relevance
of these significant variables; for example, if availabil-
ity of coupons was a significant variable, then the user
marks
a
1
against
the
binary
variable
created
for
that
variable;
and
(3)
these
binary
values
are
multiplied
by
their
percentage
contributions.
The
summation
of
these
products
across
all
the
significant
variables
pro-
vides
the
factor
to
multiply
by
the
baseline
ARIMA
forecast
to
generate
the
final
forecast.
Step
6.
Model
validation.
To
validate
the
forecast
results,
we
partition
the
historical
traffic
data
into
training
and
test
sets,
and
apply
the
model
devel-
oped
using
the
training
dataset
to
the
test
set
to
validate
results.
Step
7.
User
interface.
Model
coefficients
from
the
regression
models
and
the
baseline
traffic
forecasts
from
the
time-series
models
are
embedded
in
a
spreadsheet model (i.e., tool) to allow marketing plan-
ners to develop alternate marketing budget allocation
scenarios.
This
solution
replaced
the
legacy
approach
based
on
simple
moving
average
forecasts,
raising
the
fore-
cast
accuracy
from
a
previous
value
of
35
percent,
which
we
measured
in
terms
of
1
mean
abso-
lute
percent
error
(1-MAPE),
to
60
percent
for
each
12-week
forecast
period.
We
considered
a
few
other
approaches
to
Web
traffic
forecasting,
including
a
neural
network-based
approach
to
decompose
the
time series of Web traffic into unique components that
can
be
used
to
predict
future
patterns
(Aussem
and
Murtagh
2001).
Genetic
algorithms
have
also
been
used
to
forecast
Web
traffic,
as
Chen
(2011)
illus-
trates.
However,
to
facilitate
user
adoption,
ease
of
implementation, and the need to quantify and include
the
impact
of
marketing
activity
on
Web
traffic,
we
adopted
the
approach
we
described
in
the
previous
paragraphs.
These
traffic
forecast
models
enable
HPDirect.com
management
to
understand
the
impact
that
key
mar-
keting
activities
have
on
Web
traffic.
The
marketing
team
uses
these
demand-generation
models
to
plan
Web
traffic
scenarios
at
the
beginning
of
each
quar-
terly
planning
cycle
and
during
off-cycle
planning
exercises.
Since
2009,
HPDirect.com
has
used
these
models,
which
have
undergone
quarterly
refreshes
since
we
originally
developed
them.
Optimally
Allocate
Marketing
Budget
To
enable
the
HPDirect.com
marketing
and
plan-
ning
teams
to
efficiently
allocate
their
budgets
across
online
marketing
activities
(e.g.,
search
marketing,
affiliate
marketing,
email
marketing)
for
promot-
ing
various
product
categories,
we
developed
an
LP-based
marketing
budget
optimization
framework.
This
framework
seeks
to
maximize
total
revenue
based on the return on marketing spend for each mar-
keting activity and product category combination. We
took
the
following
approach.
1.
We
looked
at
the
optimization
effort
as
a
con-
tinuous process that starts with collecting information
on the historical return on investment (ROI), which is
defined as revenue from a marketing vehicle per dollar
spent
on
that
vehicle,
associated
with
each
individ-
Tandon
et
al.:
Delivering
Profitable
Growth
for
HPDirect.com
Using
OR
52
Interfaces
43(1),
pp.
48–61,
© 2013
INFORMS
ual
marketing
vehicle;
we
then
forecast
expected
ROI
from
each
vehicle
and
used
the
expected
ROI
to
allo-
cate across vehicles. ROI forecasts are generated using
time-series
forecasting
techniques.
Forecasts
of
rev-
enue
and
expenditure
are
generated
separately
prior
to computing the
forecasted
ROI.
2.
Next,
we
developed
a
multidimensional
opti-
mization
model
to
optimize
revenue;
the
model
accepts
the
following
as
input:
expected
ROI,
con-
straints
that
operate
based
on
marketing
vehicle
(i.e.,
the
user-specified
minimum
and
maximum
invest-
ment
allocation
bands
by
vehicle),
and
overall
bud-
getary
constraints.
3.
For
the
second
and
subsequent
budget
alloca-
tions,
we
used
the
ROI
values
to
date
to
revise
forecasts
that
eventually
determine
future
budget
allocations.
As
with
the
traffic
forecast
model,
this
methodol-
ogy
evolved
in
phases.
To
simplify
the
optimization
problem
across
all
the
phases,
ROI
is
assumed
to
be
a
linear
function
of
spend.
The
marketing
manager
responsible
for
managing
traffic
to
the
website
from
the
particular
source
(e.g.,
search
marketing,
affiliate
marketing,
email
marketing,
display
advertising),
in
consultation with the HPDirect.com’s director of mar-
keting, prescribes the maximum and minimum spend
constraints.
Phase
1
of
the
solution
used
a
simple
LP
approach,
developed
in
MS
Excel,
as
a
proof
of
concept
of
the
optimization
idea.
Although
Phase
1
of
the
approach
used ROI point values to prescribe budget allocations,
Phase
2
sought
to
recognize
that
variability
in
ROI
is
a
reality
and
recommendations
for
budget
alloca-
tion
must
use
an
ROI
that
is
most
relevant
for
the
period.
These
differences
arise
because
the
set
of
ROI
data points is a time-series distribution with its inher-
ent seasonality and trend components. In Phase 2, we
took
steps
to
do
the
following.
1.
Remove
the
seasonality
and
trend
from
the
ROI;
2.
fit
a
distribution
to
the
ROI
data
points
(with
seasonality
and
trends
removed);
3.
perform
Monte
Carlo
simulation
runs
based
on
the
parameters
of
the
fitted
ROI
distribution;
4.
add back seasonality to the outcomes of the simu-
lation runs with seasonality and trend components; and
5.
use
the
adjusted
(i.e.,
expected)
ROI
values
to
determine
budget
allocations
using
the
linear
program
that
could
maximize
overall
revenue
for
the
period
in
question.
In
contrast
to
a
judgment-driven
allocation,
the
Phase 2 approach is now providing valuable guidance
and direction to HPDirect.com’s director of marketing
on
how
best
to
allocate
the
marketing
budget
across
various
marketing
vehicles.
The
appendix
describes
the
LP
formulation
used
to
allocate
the
marketing
budget.
Solution
B
Solution
B,
the
intelligent
cube,
is
a
customer-
targeting
solution
that
improves
the
effectiveness
of
the direct marketing campaigns. HPDirect.com’s mar-
keting
team
uses
email
and
traditional
direct
printed
mail
as
its
primary
communication
medium
to
tar-
get
customers
with
its
product
offerings.
Tradition-
ally,
these
campaigns
have
been
broad
based
with
limited
use
of
available
customer
information.
This
has
resulted
in
contacting
customers
too
frequently,
leading
to
poor
conversion
rates
(number
of
peo-
ple
who
buy
a
product
from
HPDirect.com
divided
by
the
number
of
people
who
received
an
email
or
printed
mail)
and
increased
numbers
of
customers
who
unsubscribe
(number
of
people
who
opt
out
from
being
contacted
by
HP
for
marketing
offers
divided
by
the
number
of
people
who
received
an
email
or
printed
mail)
from
HP
mailing
lists.
HP
GA,
in
collaboration
with
HP’s
corporate
marketing
cus-
tomer
intelligence
(CM-CI)
team,
developed
an
inno-
vative
targeting
framework
that
helps
the
business
to
optimally
engage
with
our
customers
by
identifying
the
customers
most
likely
to
purchase
a
product
and
offering them meaningful product choices at the right
time
using
the
most
appropriate
messaging
(content
of
the
emails
and
printed
mails
based
on
the
cus-
tomer’s life stage, needs, and attitude toward technol-
ogy
products).
We
call
the
data
repository
that
brings
together
all
these
OR-based
solutions
and
models
the
intelligent
cube.
HPDirect.com’s
marketers
use
the
intelligent
cube
for
effective
customer
engagement.
The
OR-based
models
and
solutions
that
comprise
the intelligent cube are built using SAS software. They
use all the customer information available to HP (and
legally
acceptable
for
marketing
purposes),
including
customer
demographics,
psychographic
(e.g.,
interest
Tandon
et
al.:
Delivering
Profitable
Growth
for
HPDirect.com
Using
OR
Interfaces
43(1),
pp.
48–61,
© 2013
INFORMS
53
in
electronic
goods,
interest
in
music)
data,
transac-
tion
history,
campaign
response
(number
of
emails
opened
divided
by
number
of
emails
sent),
Web
behavior
(number
of
online
visits,
time
spent
per
visit),
and
customer
service
data
(number
of
service
tickets
raised
for
a
product
category,
problem
resolu-
tion
rate).
These
models
provide
a
multidimensional
view
of
expected
customer
behavior
across
dimen-
sions
such
as
product
purchase,
purchase
timing,
and
the
expected
marketing
channel
used
for
the
pur-
chase,
and
serve
as
the
basis
for
planning
and
exe-
cuting
customized
marketing
messages
and
product
offers.
The
specific
dimensions
of
the
intelligent
cube
are
listed
below.
•
Customer
segmentation:
This
helps
the
market-
ing team to understand to whom it should sell (whom
to
sell).
It
creates
customer
segments
based
on
atti-
tudes
toward
technology.
These
attitudes
are
inferred
using
a
primary
research
survey
on
a
sample
of
customers
and
later
extrapolated
to
the
entire
cus-
tomer
base
using
statistical
techniques
(i.e.,
discrim-
inant
function
analysis).
The
segment
information
helps
in
driving
differentiated
messaging
to
HP
cus-
tomers
based
on
their
latent
preferences
for
technol-
ogy
products.
•
Product
needs:
The
marketing
team
at
HPDirect.com
must
offer
the
most
appropriate
set
of
products
to
its
customers
to
increase
revenues,
improve
customer
satisfaction,
and
enhance
loyalty.
This
dimension
helps
the
team
to
understand
what
it
should
sell
(what
to
sell),
making
logical
next-
product
recommendations
to
customers
based
on
their
historical
purchase
patterns.
These
next-product
recommendations
are
based
on
Markov
chain
mod-
els;
the
model
estimates
a
transition
matrix,
which
gives
the
probability
that
a
customer
will
buy
a
product,
based
on
that
customer’s
historical
product
purchases.
•
Purchase timing: The marketing team sends mul-
tiple
marketing
communication
emails
to
customers.
The
timing
of
these
emails
is
important
because
all
customers
do
not
respond
to
such
communications.
This
dimension
helps
the
team
to
understand
when
it
should
sell
to
a
customer
(when
to
sell),
predict-
ing
the
time
that
the
customer
is
most
likely
to
make
the next purchase. Historical product transaction data
are used to develop Bayesian hierarchical models that
estimate the rate of purchase and probability of churn
(i.e.,
an
estimate
of
whether
a
customer
will
cease
to
buy
from
HP)
to
result
in
a
final-purchase
probabil-
ity
at
a
specific
time
in
the
future.
Each
customer
is
assigned
a
propensity-to-purchase
score,
which
helps
the
marketing
team
to
tailor
the
campaign
timing.
•
Marketing
channel
preference:
Customers
have
different
response
propensities
to
marketing
channels
(i.e.,
email
or
printed
mail).
This
dimension
helps
the
marketing
team
to
understand
how
it
should
sell
(how
to
sell),
predicting
the
most
appropriate
chan-
nel to use in targeting customers. Historical campaign
response
data
are
used
to
build
response
models
for
both
email
and
printed
mail
to
help
the
team
identify
the
right
channel
of
communication
to
customers.
Each
customer
is
scored
on
each
dimension
to
cre-
ate
a
secure
intelligent
cube
customer
data
reposi-
tory,
in
which
customer
segments
and
the
product
recommendations
are
coded
as
categorical
variables
for
ease
of
use.
Marketing
managers
have
access
to
this
data
repository,
which
helps
them
create
targeted
customer
lists
in
a
much
shorter
time
as
compared
to
legacy
processes.
Application
of
the
intelligent
cube
helps
in
marketing
the
right
product,
at
the
right
time,
with
relevant
messaging,
and
via
an
appropri-
ate
marketing
channel.
The
implementation
of
the
data repository involves a close collaboration between
HP
GA,
HP
CM-CI,
HPDirect.com,
and
HP’s
infor-
mation
technology
(IT)
organizations.
GA
and
CM-CI
teams
build,
validate,
and
test
individual
models.
The
IT
team
then
implements
these
models
on
pro-
duction
servers
and
refreshes
the
scores
monthly.
HPDirect.com’s
marketing
teams
use
these
scores
for
effective
customer
engagement.
The
scores
for
each
dimension are converted into binary variables for ease
of
use.
For
example,
the
purchase-timing
probabil-
ity
scores
are
arranged
in
descending
order;
the
top
30
percent
of
scores
are
then
coded
as
1
(i.e.,
high
likelihood
of
making
a
purchase),
and
the
remain-
ing
70
percent
are
coded
as
0
(i.e.,
low
likelihood
of
making
a
purchase).
The
other
scores
are
similarly
converted
into
binary
variables.
Table
1
provides
an
example
from
a
January
2011
campaign
of
how
the
intelligent
cube
solution
is
used
to
design
the
target
customer
list
for
a
personal
computers
(PC)
conver-
sion at HPDirect.com. The example illustrates how the
Tandon
et
al.:
Delivering
Profitable
Growth
for
HPDirect.com
Using
OR
54
Interfaces
43(1),
pp.
48–61,
© 2013
INFORMS
Customer
Buy-in-next-
Buy-through-
attitudinal
three-months
Buy-PC
email
Customer
segment
flag (0/1)
flag (0/1)
flag (0/1)
ID
(whom to sell)
(when to sell)
(what to sell)
(how to sell)
123
Digital techie
1
0
1
456
Sentimental
1
1
1
traditionalist
789
Successful adapters
0
0
1
Table 1: The
table
illustrates
an
intelligent
cube;
of
three
possible
cus-
tomer segments, ID 456 receives the email for the PC campaign because
this customer satisfies (i.e.,
1
=
yes
) all three criteria: product purchase
likelihood, purchase time frame, and email channel preference.
intelligent
cube
solution
helps
the
marketers
to
iden-
tify
the
customers
who
are
most
likely
to
buy
a
PC
in
the
next
three
months
and,
of
those
identified,
the
customers who prefer to be contacted by email. Based
on
this
information,
marketers
identify
the
right
set
of
customers
to
whom
they
should
market
the
prod-
ucts,
thus
avoiding
contacting
the
wrong
set
of
cus-
tomers
(i.e.,
those
who
would
not
be
interested
in
these
products).
The
effectiveness
of
the
intelligent
cube
solution
in
marketing
campaigns
is
measured
by
using
a
test-and-control
methodology.
For
the
PC
conversion
campaign, we select the test group based on the appli-
cation
of
the
intelligent
cube
solution
(see
Table
1);
the
control
group
consists
of
randomly
selected
cus-
tomers.
The
results
show
that
the
test
group
per-
formed
better
across
all
key
metrics,
including
email
open
rate
(i.e.,
number
of
emails
opened
divided
by
number
of
emails
sent),
email
click
rate
(i.e.,
num-
ber
of
emails
on
which
customers
clicked
divided
by
number of emails sent), conversion rate, and sales per
message delivered (i.e., total sales divided by number
of
emails
sent)
(see
Table
2).
We
continually
validate
and
test
the
intelligent
cube
solution.
Each
key
dimension
of
the
intelligent
cube
solution
is
explained
briefly
below.
Customer
Segmentation
The
first
step
in
developing
a
framework
for
effective
customer
engagement
is
to
understand
customer
atti-
tudes and technology needs. We defined six customer
segments
based
on
responses
to
survey
question-
naires,
which
we
collected
by
surveying
a
represen-
tative
sample
of
HP
customers.
Next,
we
classified
Circulation
Sales per
(messages
Open
Click
Conversion
message
Message
sent) (%)
rate (%)
rate (%)
rate (%)
delivered
Intelligent cube
20
11
0
96
0
0
94
4
0
83
$0
0
08
test group
Control group
80
8
0
23
0
0
73
1
0
99
$0
0
03
Percent lift
45
29
143
184%
(increment
over control)
Table 2: To measure the effectiveness of the intelligent cube solution, we
compare
the
key
metrics
across
the
test
and
control
groups
for
the
PC
conversion
campaign,
which
used
this
solution
to
target
to
prospective
PC
buyers.
The
table
shows
that
all
the
key
metrics
improve.
The
met-
rics are defined as follows: open rate
=
number of emails opened/number
of
emails
sent;
click
rate
=
number
of
emails
clicked/number
of
emails
sent;
conversion
rate
=
number
of
orders/number
of
emails
sent;
sales
per message delivered
=
total sales/number of emails sent.
each
HPDirect.com
customer
into
one
of
these
six
segments
using
a
statistical
algorithm
that
includes
demographic
and
transactional
variables
as
predic-
tors.
We
evaluated
several
classification
techniques,
including classification
and regression
trees,
k
-nearest
neighbor,
and
multinomial
logistic
regression;
we
chose linear discriminant analysis (LDA) (Hastie et al.
2001)
because
it
offered
the
best
classification
accu-
racy
(62
percent).
The
appendix
provides
details
of
using
LDA
for
customer
segmentation.
Having
clas-
sified
the
customers
into
one
of
the
six
segments,
we
developed detailed profiles for each segment based on
a
vast
array
of
internal
data
available.
In
a
June
2010
marketing
campaign
to
introduce
new
products,
the
marketing
team
applied
this
segmentation
scheme.
To
measure
the
impact,
we
followed
a
test-versus-
control
approach.
The
control
group
comprised
half
the customers; these customers received generic email
messages
(with
no
input
from
segment
profiles).
The
test
group
(the
other
half)
received
segment-specific
customized
messages
based
on
each
customer’s
seg-
ment
profile
(e.g.,
product
preferences,
interests).
Key
metrics,
including
sales,
average
order
size,
conver-
sion rate, and sales (in dollars) per delivered message,
were
computed
across
the
test
and
control
groups
to
measure
the
effectiveness
of
customized
messaging.
The
test
group
performed
better
across
all
key
met-
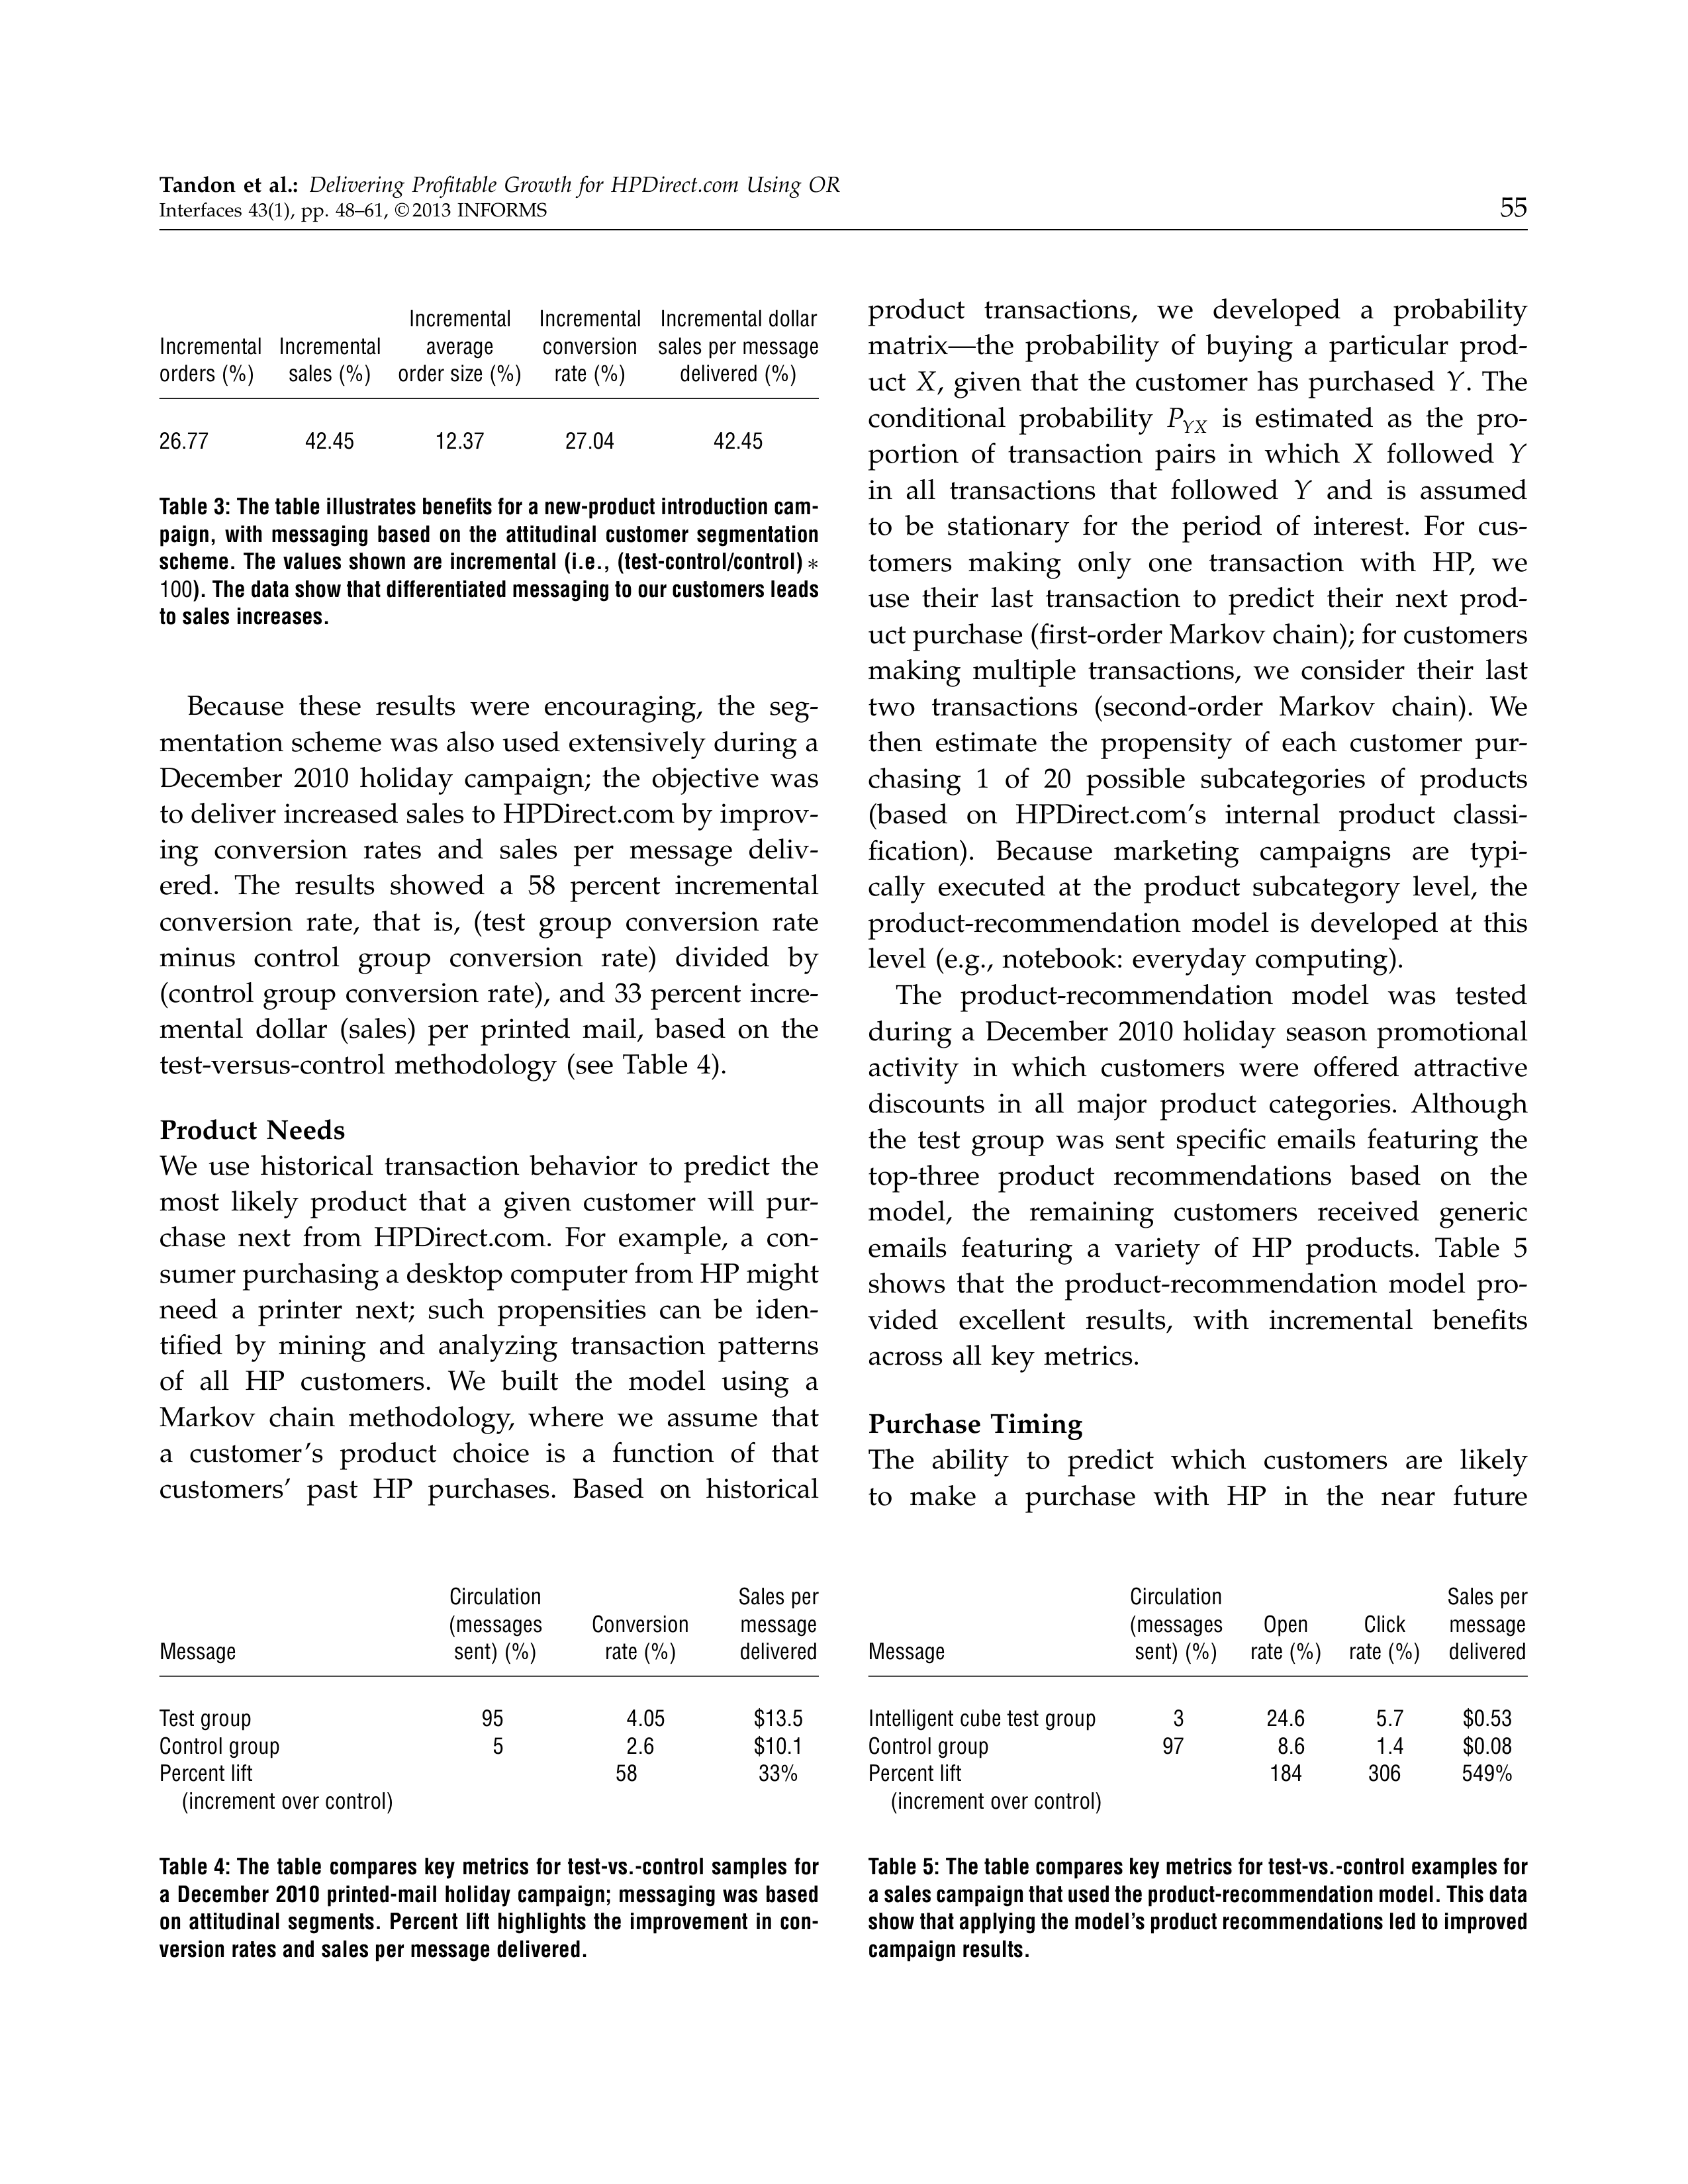
rics. Table 3 illustrates incremental benefits across key
metrics
from
this
campaign.
Tandon
et
al.:
Delivering
Profitable
Growth
for
HPDirect.com
Using
OR
Interfaces
43(1),
pp.
48–61,
© 2013
INFORMS
55
Incremental
Incremental
Incremental dollar
Incremental
Incremental
average
conversion
sales per message
orders (%)
sales (%)
order size (%)
rate (%)
delivered (%)
26.77
42.45
12.37
27.04
42.45
Table 3: The table illustrates benefits for a new-product introduction cam-
paign,
with
messaging
based
on
the
attitudinal
customer
segmentation
scheme.
The
values
shown
are
incremental
(i.e.,
(test-control/control)
∗
100
). The data show that differentiated messaging to our customers leads
to sales increases.
Because
these
results
were
encouraging,
the
seg-
mentation scheme was also used extensively during a
December
2010
holiday
campaign;
the
objective
was
to deliver increased sales to HPDirect.com by improv-
ing
conversion
rates
and
sales
per
message
deliv-
ered.
The
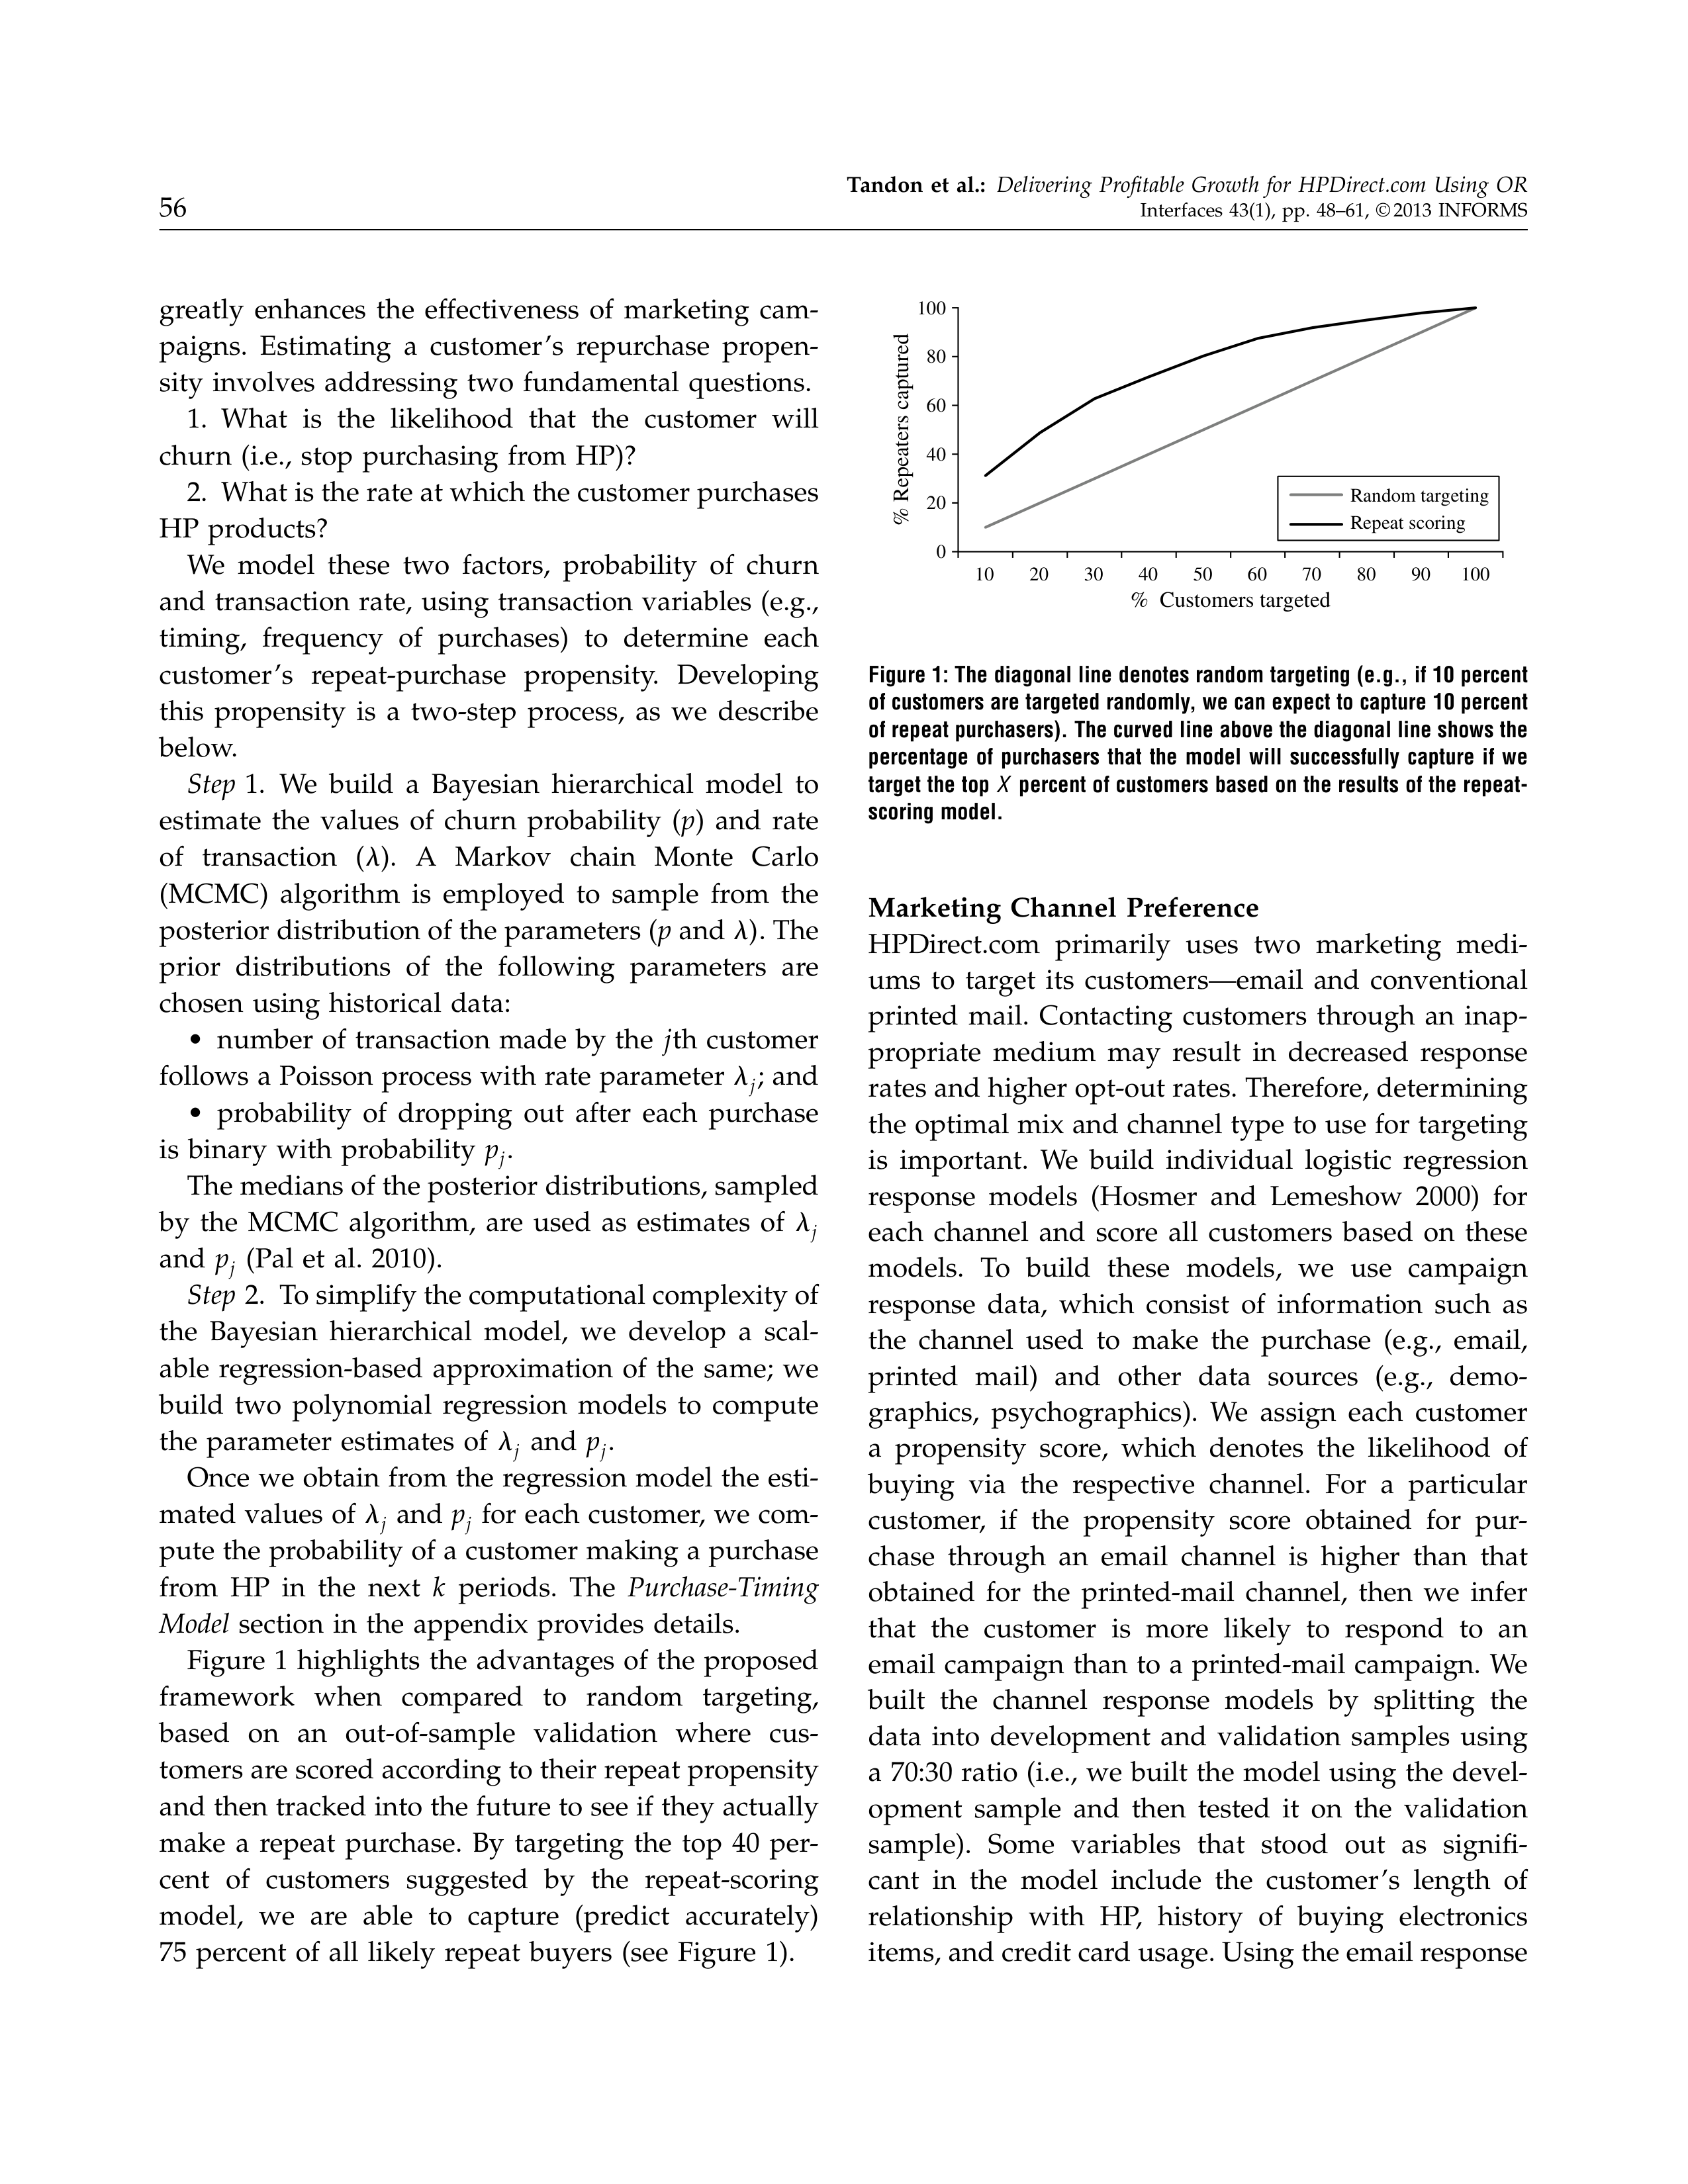
results
showed
a
58
percent
incremental
conversion
rate,
that
is,
(test
group
conversion
rate
minus
control
group
conversion
rate)
divided
by
(control
group
conversion
rate),
and
33
percent
incre-
mental
dollar
(sales)
per
printed
mail,
based
on
the
test-versus-control
methodology
(see
Table
4).
Product
Needs
We
use
historical
transaction
behavior
to
predict
the
most
likely
product
that
a
given
customer
will
pur-
chase
next
from
HPDirect.com.
For
example,
a
con-
sumer purchasing a desktop computer from HP might
need
a
printer
next;
such
propensities
can
be
iden-
tified
by
mining
and
analyzing
transaction
patterns
of
all
HP
customers.
We
built
the
model
using
a
Markov
chain
methodology,
where
we
assume
that
a
customer’s
product
choice
is
a
function
of
that
customers’
past
HP
purchases.
Based
on
historical
Circulation
Sales per
(messages
Conversion
message
Message
sent) (%)
rate (%)
delivered
Test group
95
4
0
05
$13
0
5
Control group
5
2
0
6
$10
0
1
Percent lift
58
33%
(increment over control)
Table 4: The
table
compares
key
metrics
for
test-vs.-control
samples
for
a
December
2010
printed-mail
holiday
campaign;
messaging
was
based
on
attitudinal
segments.
Percent
lift
highlights
the
improvement
in
con-
version rates and sales per message delivered.
product
transactions,
we
developed
a
probability
matrix—the
probability
of
buying
a
particular
prod-
uct
X
,
given
that
the
customer
has
purchased
Y
.
The
conditional
probability
P
YX
is
estimated
as
the
pro-
portion
of
transaction
pairs
in
which
X
followed
Y
in
all
transactions
that
followed
Y
and
is
assumed
to
be
stationary
for
the
period
of
interest.
For
cus-
tomers
making
only
one
transaction
with
HP,
we
use
their
last
transaction
to
predict
their
next
prod-
uct purchase (first-order Markov chain); for customers
making
multiple
transactions,
we
consider
their
last
two
transactions
(second-order
Markov
chain).
We
then
estimate
the
propensity
of
each
customer
pur-
chasing
1
of
20
possible
subcategories
of
products
(based
on
HPDirect.com’s
internal
product
classi-
fication).
Because
marketing
campaigns
are
typi-
cally
executed
at
the
product
subcategory
level,
the
product-recommendation
model
is
developed
at
this
level
(e.g.,
notebook:
everyday
computing).
The
product-recommendation
model
was
tested
during
a
December
2010
holiday
season
promotional
activity
in
which
customers
were
offered
attractive
discounts
in
all
major
product
categories.
Although
the
test
group
was
sent
specific
emails
featuring
the
top-three
product
recommendations
based
on
the
model,
the
remaining
customers
received
generic
emails
featuring
a
variety
of
HP
products.
Table
5
shows
that
the
product-recommendation
model
pro-
vided
excellent
results,
with
incremental
benefits
across
all
key
metrics.
Purchase
Timing
The
ability
to
predict
which
customers
are
likely
to
make
a
purchase
with
HP
in
the
near
future
Circulation
Sales per
(messages
Open
Click
message
Message
sent) (%)
rate (%)
rate (%)
delivered
Intelligent cube test group
3
24
0
6
5
0
7
$0
0
53
Control group
97
8
0
6
1
0
4
$0
0
08
Percent lift
184
306
549%
(increment over control)
Table 5: The table compares key metrics for test-vs.-control examples for
a sales campaign that used the product-recommendation model. This data
show that applying the model’s product recommendations led to improved
campaign results.
Tandon
et
al.:
Delivering
Profitable
Growth
for
HPDirect.com
Using
OR
56
Interfaces
43(1),
pp.
48–61,
© 2013
INFORMS
greatly
enhances
the
effectiveness
of
marketing
cam-
paigns.
Estimating
a
customer’s
repurchase
propen-
sity
involves
addressing
two
fundamental
questions.
1.
What
is
the
likelihood
that
the
customer
will
churn
(i.e.,
stop
purchasing
from
HP)?
2.
What is the rate at which the customer purchases
HP
products?
We
model
these
two
factors,
probability
of
churn
and
transaction
rate,
using
transaction
variables
(e.g.,
timing,
frequency
of
purchases)
to
determine
each
customer’s
repeat-purchase
propensity.
Developing
this
propensity
is
a
two-step
process,
as
we
describe
below.
Step
1.
We
build
a
Bayesian
hierarchical
model
to
estimate
the
values
of
churn
probability
(
p
)
and
rate
of
transaction
(
).
A
Markov
chain
Monte
Carlo
(MCMC)
algorithm
is
employed
to
sample
from
the
posterior distribution of the parameters (
p
and
5
. The
prior
distributions
of
the
following
parameters
are
chosen
using
historical
data:
•
number
of
transaction
made
by
the
j
th
customer
follows
a Poisson
process
with
rate
parameter
j
;
and
•
probability
of
dropping
out
after
each
purchase
is
binary
with
probability
p
j
.
The medians of the posterior distributions, sampled
by
the
MCMC
algorithm,
are
used
as
estimates
of
j
and
p
j
(Pal
et
al.
2010).
Step
2.
To simplify the computational complexity of
the
Bayesian
hierarchical
model,
we
develop
a
scal-
able
regression-based
approximation
of
the
same;
we
build
two
polynomial
regression
models
to
compute
the
parameter
estimates
of
j
and
p
j
.
Once
we
obtain
from
the
regression
model
the
esti-
mated
values
of
j
and
p
j
for
each
customer,
we
com-
pute the probability of a customer making a purchase
from
HP
in
the
next
k
periods.
The
Purchase-Timing
Model
section
in
the
appendix
provides
details.
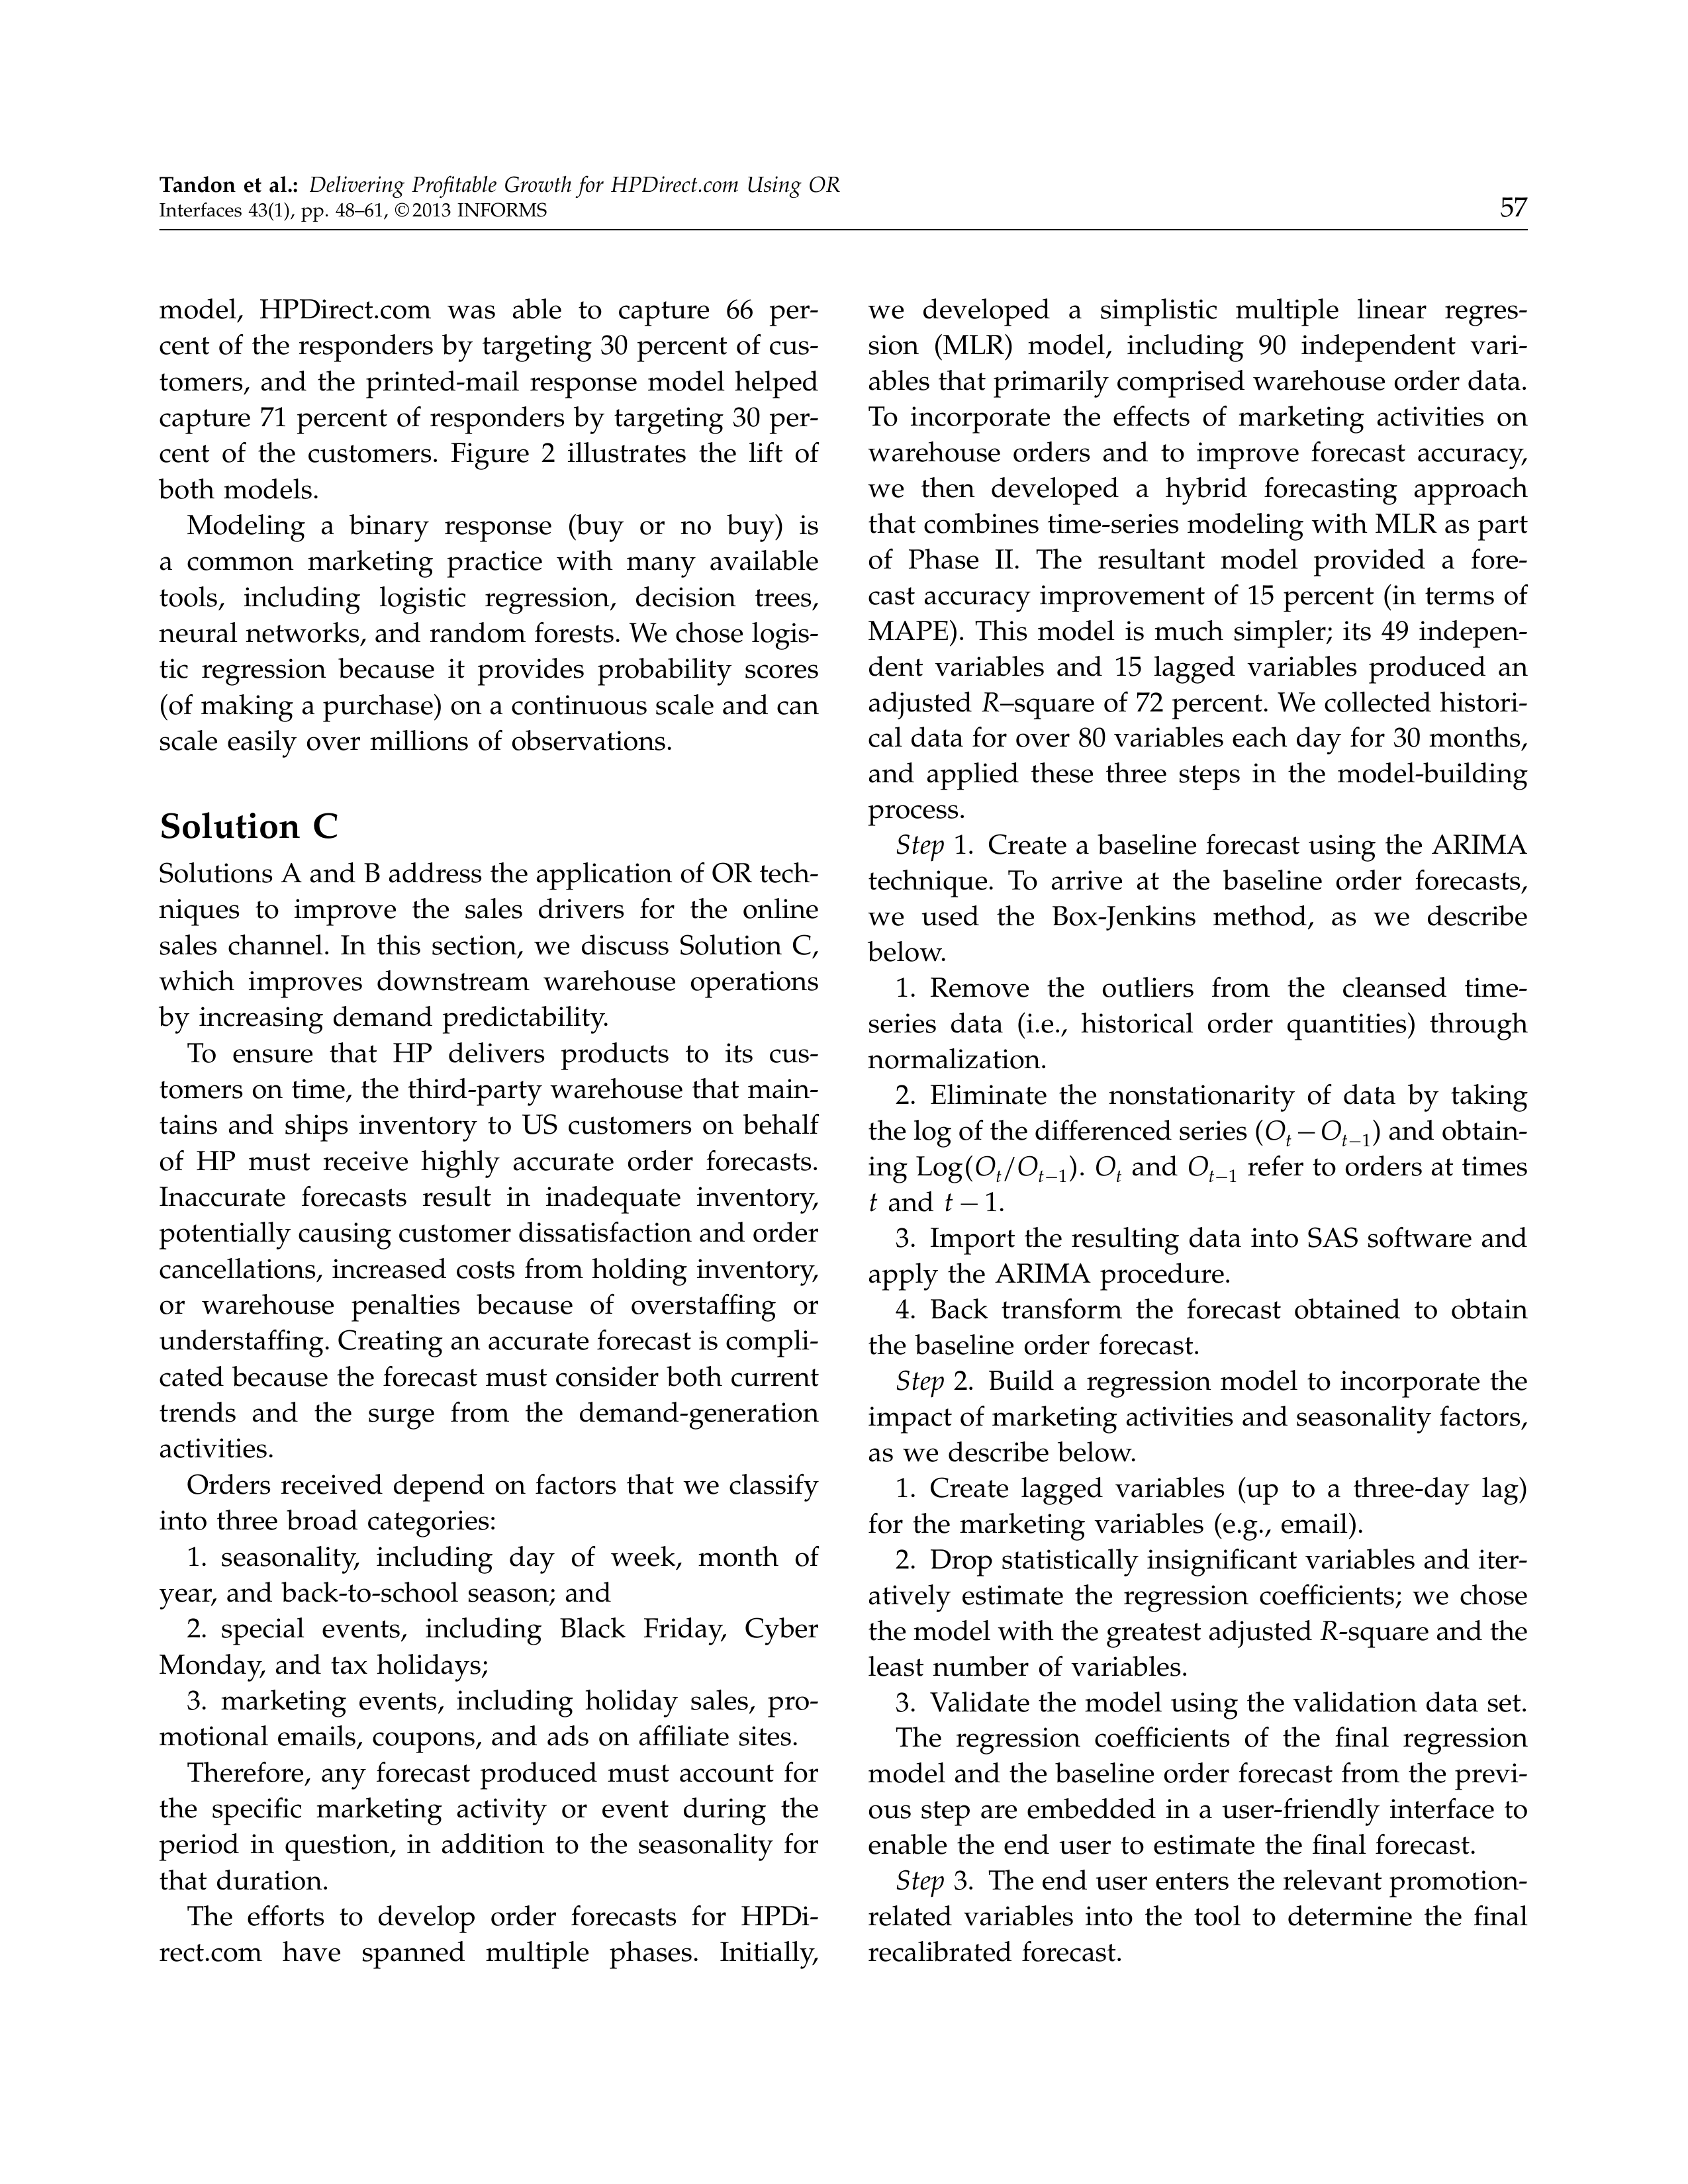
Figure
1
highlights
the
advantages
of
the
proposed
framework
when
compared
to
random
targeting,
based
on
an
out-of-sample
validation
where
cus-
tomers are scored according to their repeat propensity
and then tracked into the future to see if they actually
make
a
repeat
purchase.
By
targeting
the
top
40
per-
cent
of
customers
suggested
by
the
repeat-scoring
model,
we
are
able
to
capture
(predict
accurately)
75
percent
of
all
likely
repeat
buyers
(see
Figure
1).
0
20
40
60
80
100
10
20
30
40
50
60
70
80
90
100
Random targeting
Repeat scoring
%
Customers targeted
% Repeaters captured
Figure 1: The diagonal line denotes random targeting (e.g., if 10 percent
of customers are targeted randomly, we can expect to capture 10 percent
of repeat purchasers). The curved line above the diagonal line shows the
percentage
of
purchasers
that
the
model
will
successfully
capture
if
we
target the top
X
percent of customers based on the results of the repeat-
scoring model.
Marketing
Channel
Preference
HPDirect.com
primarily
uses
two
marketing
medi-
ums
to
target
its
customers—email
and
conventional
printed
mail.
Contacting
customers
through
an
inap-
propriate
medium
may
result
in
decreased
response
rates and higher opt-out rates. Therefore, determining
the
optimal
mix
and
channel
type
to
use
for
targeting
is
important.
We
build
individual
logistic
regression
response
models
(Hosmer
and
Lemeshow
2000)
for
each
channel
and
score
all
customers
based
on
these
models.
To
build
these
models,
we
use
campaign
response
data,
which
consist
of
information
such
as
the
channel
used
to
make
the
purchase
(e.g.,
email,
printed
mail)
and
other
data
sources
(e.g.,
demo-
graphics,
psychographics).
We
assign
each
customer
a
propensity
score,
which
denotes
the
likelihood
of
buying
via
the
respective
channel.
For
a
particular
customer,
if
the
propensity
score
obtained
for
pur-
chase
through
an
email
channel
is
higher
than
that
obtained
for
the
printed-mail
channel,
then
we
infer
that
the
customer
is
more
likely
to
respond
to
an
email
campaign
than
to
a
printed-mail
campaign.
We
built
the
channel
response
models
by
splitting
the
data
into
development
and
validation
samples
using
a
70:30
ratio
(i.e.,
we
built
the
model
using
the
devel-
opment
sample
and
then
tested
it
on
the
validation
sample).
Some
variables
that
stood
out
as
signifi-
cant
in
the
model
include
the
customer’s
length
of
relationship
with
HP,
history
of
buying
electronics
items, and credit card usage. Using the email response
Tandon
et
al.:
Delivering
Profitable
Growth
for
HPDirect.com
Using
OR
Interfaces
43(1),
pp.
48–61,
© 2013
INFORMS
57
model,
HPDirect.com
was
able
to
capture
66
per-
cent
of
the
responders
by
targeting
30
percent
of
cus-
tomers,
and
the
printed-mail
response
model
helped
capture
71
percent
of
responders
by
targeting
30
per-
cent
of
the
customers.
Figure
2
illustrates
the
lift
of
both
models.
Modeling
a
binary
response
(buy
or
no
buy)
is
a
common
marketing
practice
with
many
available
tools,
including
logistic
regression,
decision
trees,
neural networks, and random forests. We chose logis-
tic
regression
because
it
provides
probability
scores
(of making a purchase) on a continuous scale and can
scale
easily
over
millions
of
observations.
Solution
C
Solutions A and B address the application of OR tech-
niques
to
improve
the
sales
drivers
for
the
online
sales
channel.
In
this
section,
we
discuss
Solution
C,
which
improves
downstream
warehouse
operations
by
increasing
demand
predictability.
To
ensure
that
HP
delivers
products
to
its
cus-
tomers
on
time,
the
third-party
warehouse
that
main-
tains
and
ships
inventory
to
US
customers
on
behalf
of
HP
must
receive
highly
accurate
order
forecasts.
Inaccurate
forecasts
result
in
inadequate
inventory,
potentially causing customer dissatisfaction and order
cancellations,
increased
costs
from
holding
inventory,
or
warehouse
penalties
because
of
overstaffing
or
understaffing. Creating an accurate forecast is compli-
cated
because
the
forecast
must
consider
both
current
trends
and
the
surge
from
the
demand-generation
activities.
Orders
received
depend
on
factors
that
we
classify
into
three
broad
categories:
1.
seasonality,
including
day
of
week,
month
of
year,
and
back-to-school
season;
and
2.
special
events,
including
Black
Friday,
Cyber
Monday,
and
tax
holidays;
3.
marketing
events,
including
holiday
sales,
pro-
motional
emails,
coupons,
and
ads
on
affiliate
sites.
Therefore,
any
forecast
produced
must
account
for
the
specific
marketing
activity
or
event
during
the
period
in
question,
in
addition
to
the
seasonality
for
that
duration.
The
efforts
to
develop
order
forecasts
for
HPDi-
rect.com
have
spanned
multiple
phases.
Initially,
we
developed
a
simplistic
multiple
linear
regres-
sion
(MLR)
model,
including
90
independent
vari-
ables that primarily comprised warehouse order data.
To
incorporate
the
effects
of
marketing
activities
on
warehouse
orders
and
to
improve
forecast
accuracy,
we
then
developed
a
hybrid
forecasting
approach
that combines time-series modeling with MLR as part
of
Phase
II.
The
resultant
model
provided
a
fore-
cast
accuracy
improvement
of
15
percent
(in
terms
of
MAPE).
This
model
is
much
simpler;
its
49
indepen-
dent
variables
and
15
lagged
variables
produced
an
adjusted
R
–square
of
72
percent.
We
collected
histori-
cal
data
for
over
80
variables
each
day
for
30
months,
and
applied
these
three
steps
in
the
model-building
process.
Step
1.
Create
a
baseline
forecast
using
the
ARIMA
technique.
To
arrive
at
the
baseline
order
forecasts,
we
used
the
Box-Jenkins
method,
as
we
describe
below.
1.
Remove
the
outliers
from
the
cleansed
time-
series
data
(i.e.,
historical
order
quantities)
through
normalization.
2.
Eliminate
the
nonstationarity
of
data
by
taking
the log of the differenced series (
O
t
−
O
t
−
1
) and obtain-
ing
Log
4O
t
/O
t
−
1
5
.
O
t
and
O
t
−
1
refer
to
orders
at
times
t
and
t
−
1.
3.
Import
the
resulting
data
into
SAS
software
and
apply
the
ARIMA
procedure.
4.
Back
transform
the
forecast
obtained
to
obtain
the
baseline
order
forecast.
Step
2.
Build
a
regression
model
to
incorporate
the
impact of marketing activities and seasonality factors,
as
we
describe
below.
1.
Create
lagged
variables
(up
to
a
three-day
lag)
for
the
marketing
variables
(e.g.,
email).
2.
Drop statistically insignificant variables and iter-
atively
estimate
the
regression
coefficients;
we
chose
the model with the greatest adjusted
R
-square and the
least
number
of
variables.
3.
Validate
the
model
using
the
validation
data
set.
The
regression
coefficients
of
the
final
regression
model
and
the
baseline
order
forecast
from
the
previ-
ous
step
are
embedded
in
a
user-friendly
interface
to
enable
the
end
user
to
estimate
the
final
forecast.
Step
3.
The end user enters the relevant promotion-
related
variables
into
the
tool
to
determine
the
final
recalibrated
forecast.
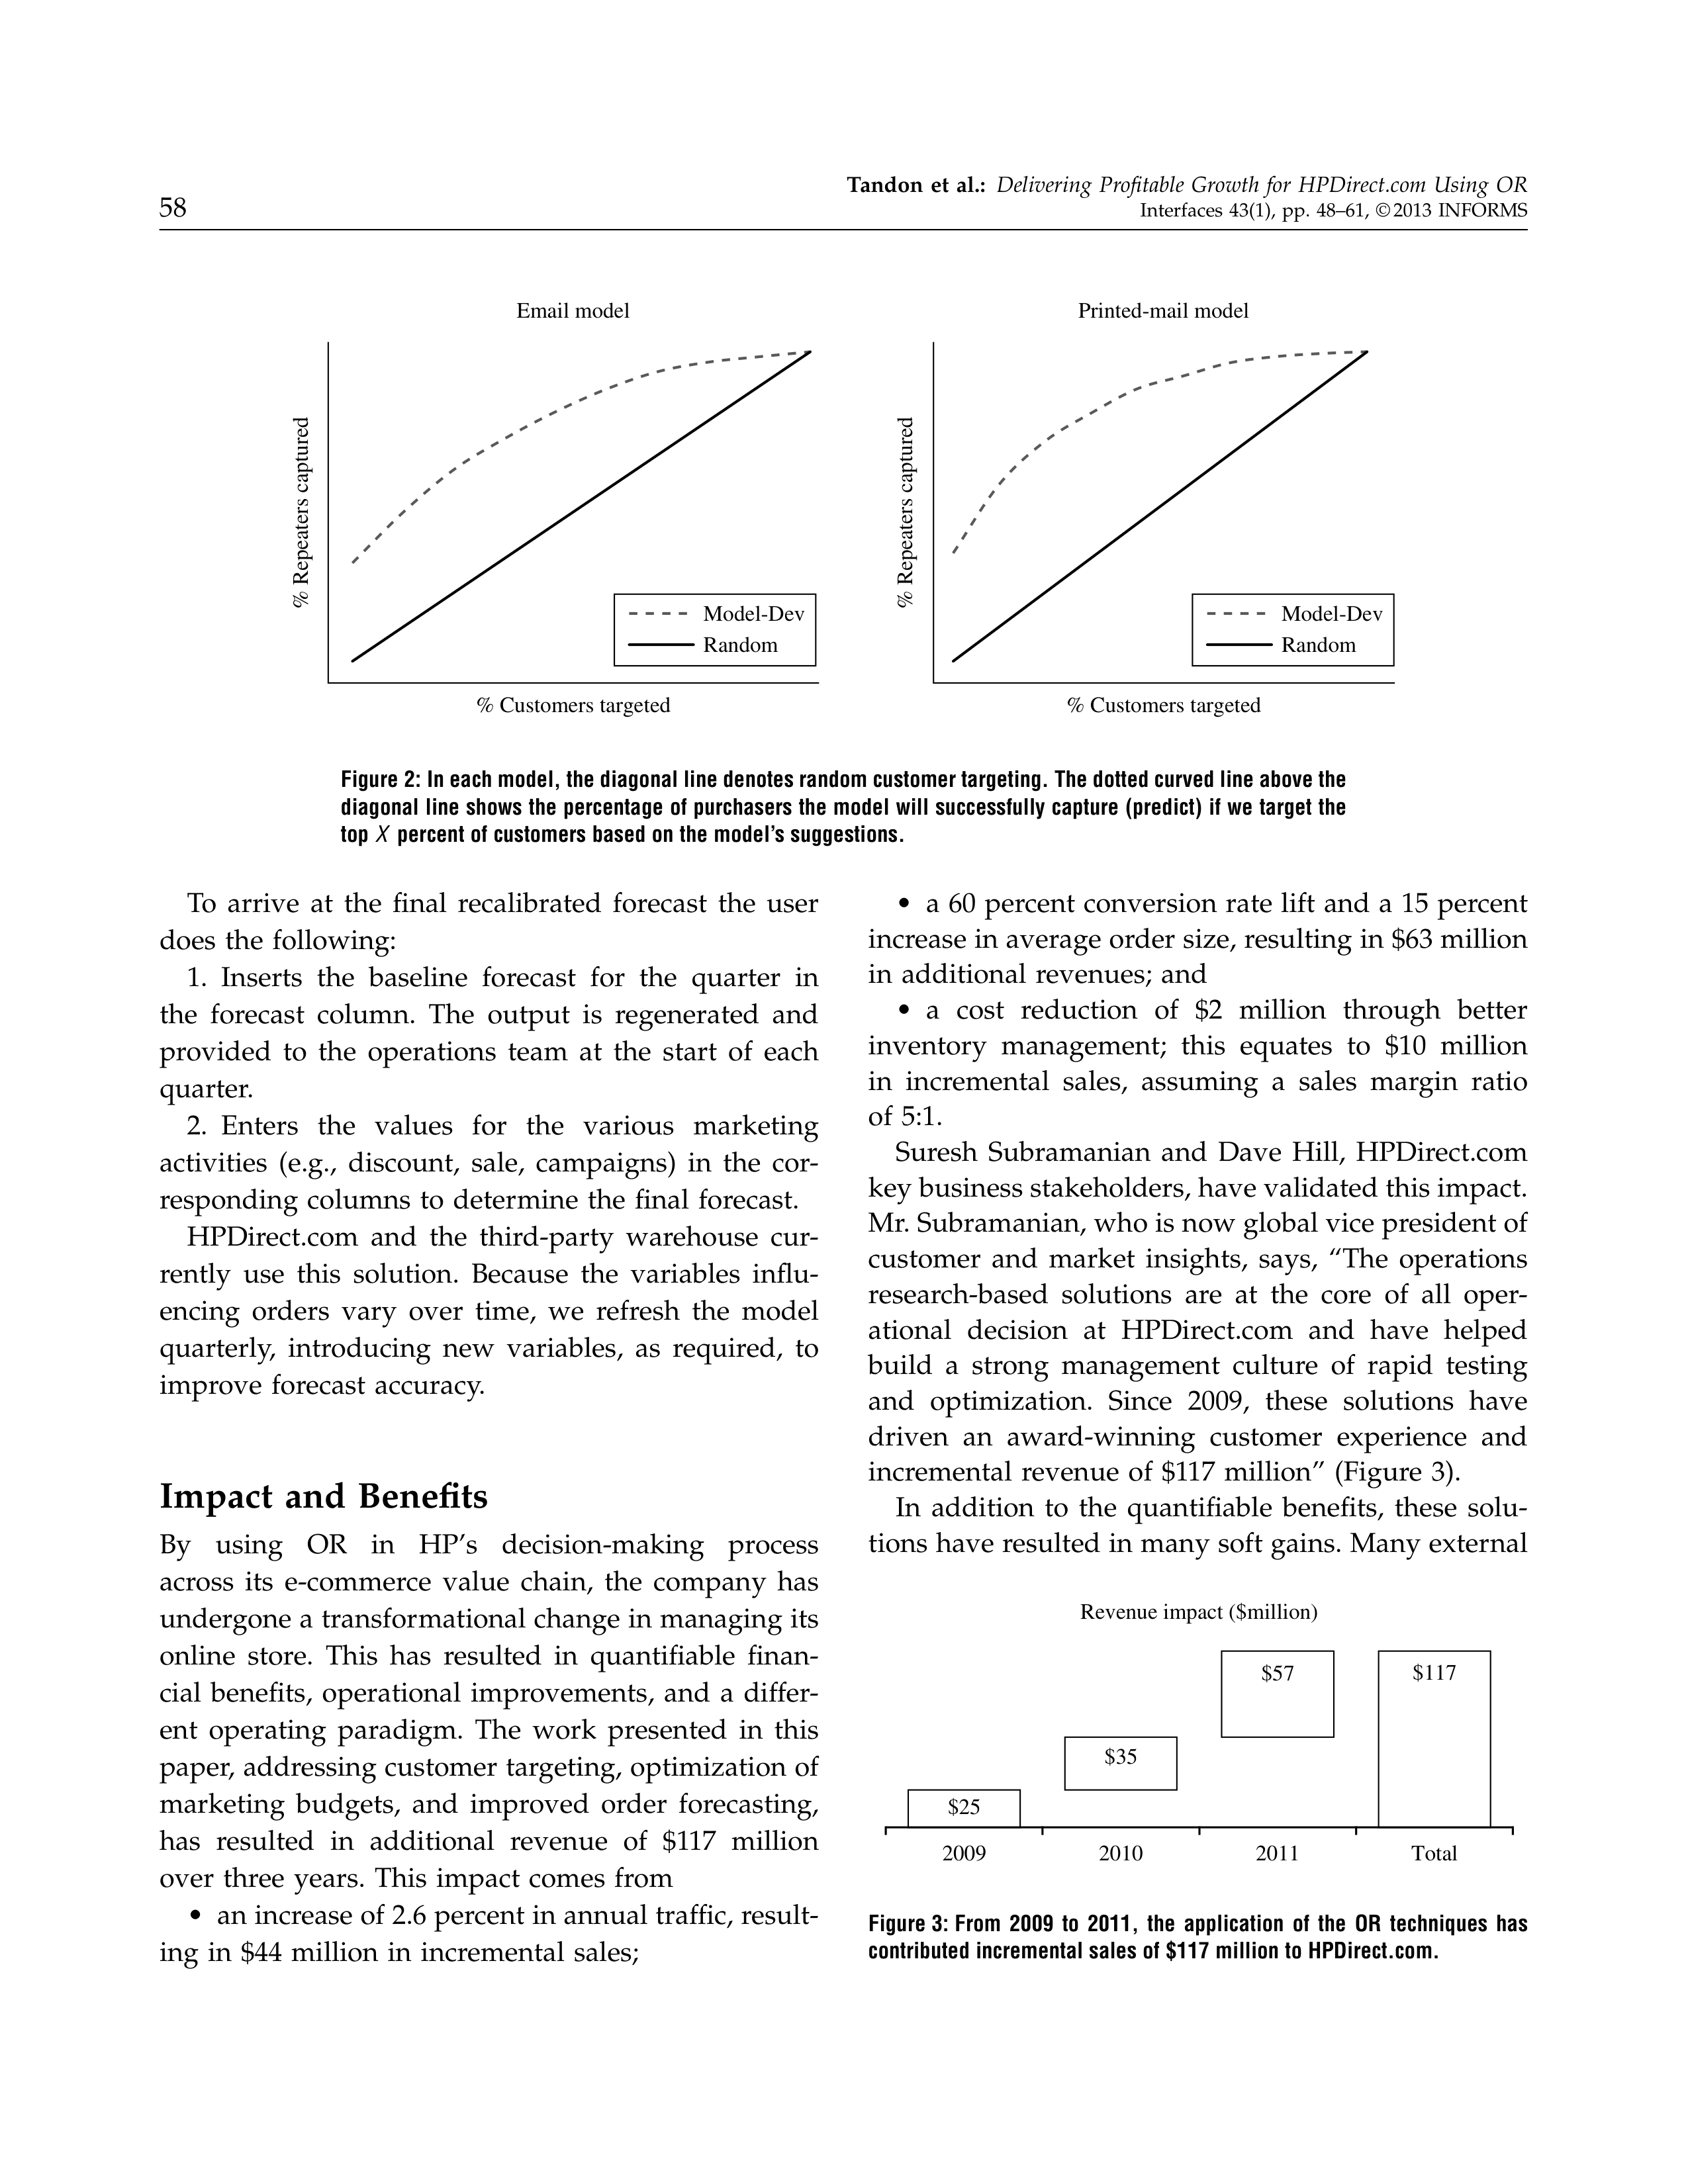
Tandon
et
al.:
Delivering
Profitable
Growth
for
HPDirect.com
Using
OR
58
Interfaces
43(1),
pp.
48–61,
© 2013
INFORMS
Email model
Printed-mail model
Model-Dev
Random
% Customers targeted
% Customers targeted
% Repeaters captured
% Repeaters captured
Model-Dev
Random
Figure 2: In each model, the diagonal line denotes random customer targeting. The dotted curved line above the
diagonal line shows the percentage of purchasers the model will successfully capture (predict) if we target the
top
X
percent of customers based on the model’s suggestions.
To
arrive
at
the
final
recalibrated
forecast
the
user
does
the
following:
1.
Inserts
the
baseline
forecast
for
the
quarter
in
the
forecast
column.
The
output
is
regenerated
and
provided
to
the
operations
team
at
the
start
of
each
quarter.
2.
Enters
the
values
for
the
various
marketing
activities
(e.g.,
discount,
sale,
campaigns)
in
the
cor-
responding
columns
to
determine
the
final
forecast.
HPDirect.com
and
the
third-party
warehouse
cur-
rently
use
this
solution.
Because
the
variables
influ-
encing
orders
vary
over
time,
we
refresh
the
model
quarterly,
introducing
new
variables,
as
required,
to
improve
forecast
accuracy.
Impact
and
Benefits
By
using
OR
in
HP’s
decision-making
process
across
its
e-commerce
value
chain,
the
company
has
undergone a transformational change in managing its
online
store.
This
has
resulted
in
quantifiable
finan-
cial
benefits,
operational
improvements,
and
a
differ-
ent
operating
paradigm.
The
work
presented
in
this
paper, addressing customer targeting, optimization of
marketing
budgets,
and
improved
order
forecasting,
has
resulted
in
additional
revenue
of
$117
million
over
three
years.
This
impact
comes
from
•
an increase of 2.6 percent in annual traffic, result-
ing
in
$44
million
in
incremental
sales;
•
a
60
percent
conversion
rate
lift
and
a
15
percent
increase in average order size, resulting in $63 million
in
additional
revenues;
and
•
a
cost
reduction
of
$2
million
through
better
inventory
management;
this
equates
to
$10
million
in
incremental
sales,
assuming
a
sales
margin
ratio
of
5:1.
Suresh
Subramanian
and
Dave
Hill,
HPDirect.com
key business stakeholders, have validated this impact.
Mr. Subramanian, who is now global vice president of
customer
and
market
insights,
says,
“The
operations
research-based
solutions
are
at
the
core
of
all
oper-
ational
decision
at
HPDirect.com
and
have
helped
build
a
strong
management
culture
of
rapid
testing
and
optimization.
Since
2009,
these
solutions
have
driven
an
award-winning
customer
experience
and
incremental
revenue
of
$117
million”
(Figure
3).
In
addition
to
the
quantifiable
benefits,
these
solu-
tions have resulted in many soft gains. Many external
$25
$35
Revenue impact ($million)
$57
$117
2009
2010
2011
Total
Figure 3: From
2009
to
2011,
the
application
of
the
OR
techniques
has
contributed incremental sales of $117 million to HPDirect.com.
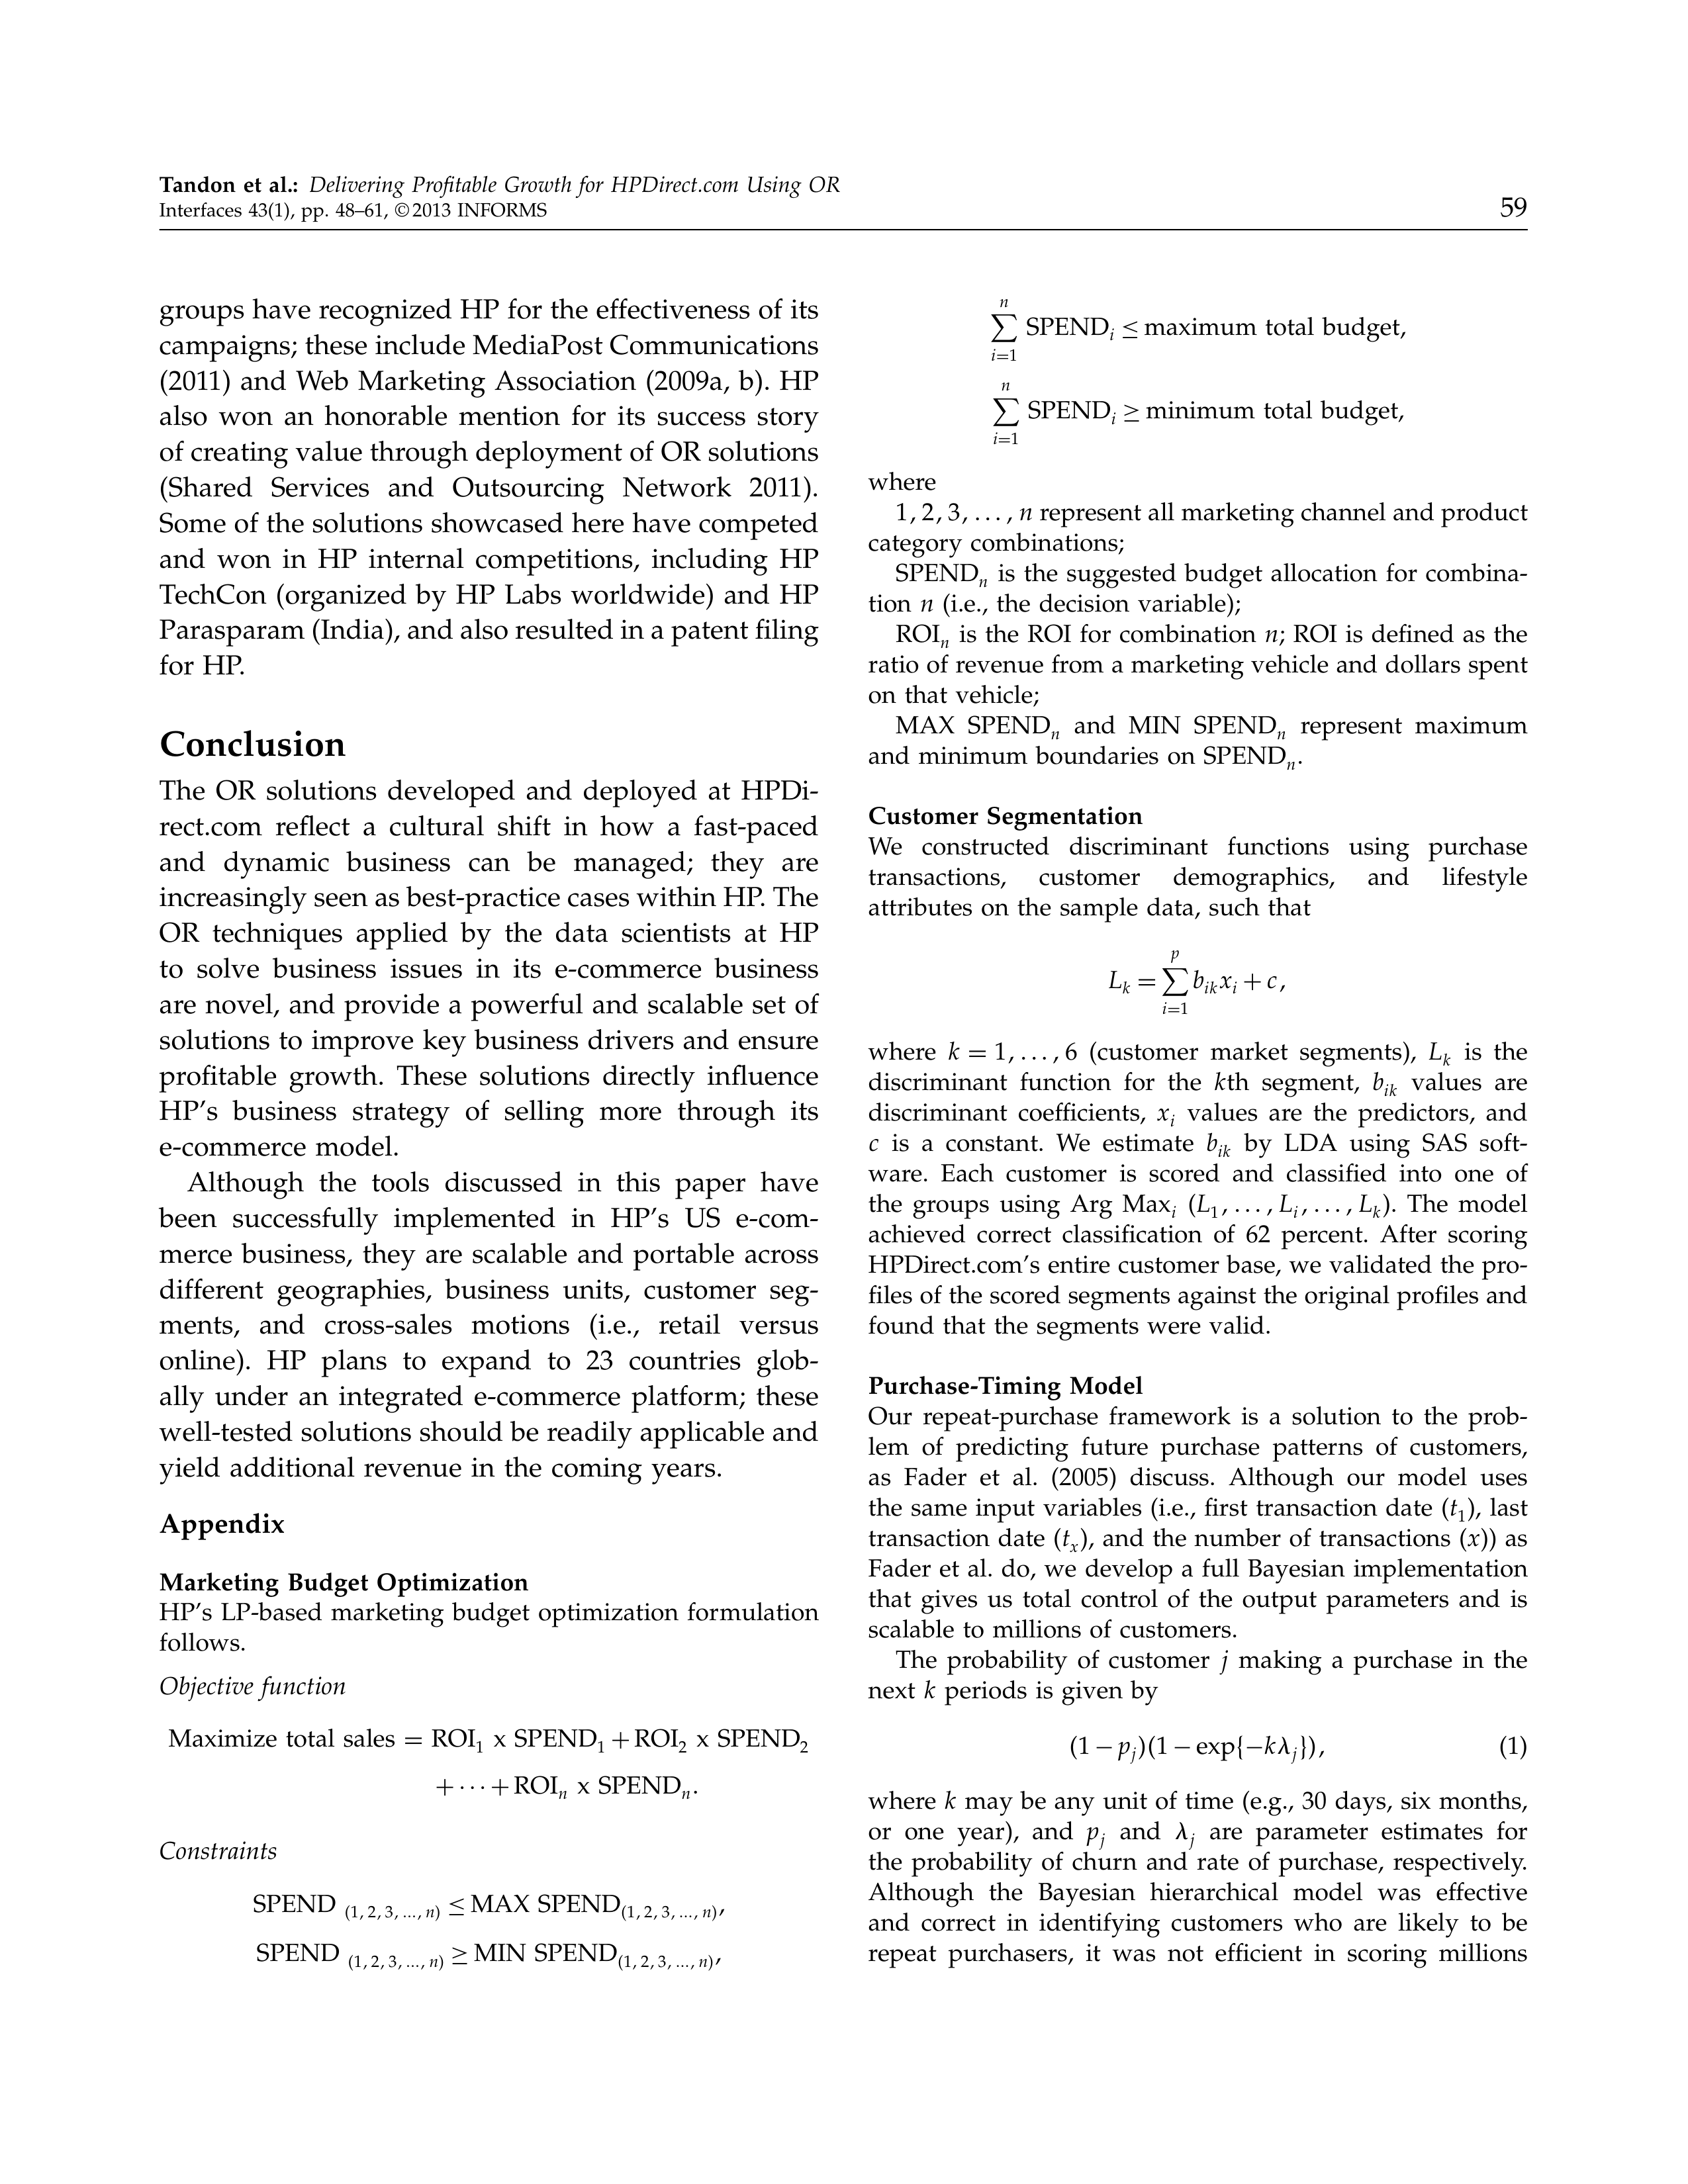
Tandon
et
al.:
Delivering
Profitable
Growth
for
HPDirect.com
Using
OR
Interfaces
43(1),
pp.
48–61,
© 2013
INFORMS
59
groups have recognized HP for the effectiveness of its
campaigns; these include MediaPost Communications
(2011)
and
Web
Marketing
Association
(2009a,
b).
HP
also
won
an
honorable
mention
for
its
success
story
of creating value through deployment of OR solutions
(Shared
Services
and
Outsourcing
Network
2011).
Some of the solutions showcased here have competed
and
won
in
HP
internal
competitions,
including
HP
TechCon
(organized
by
HP
Labs
worldwide)
and
HP
Parasparam (India), and also resulted in a patent filing
for HP.
Conclusion
The
OR
solutions
developed
and
deployed
at
HPDi-
rect.com
reflect
a
cultural
shift
in
how
a
fast-paced
and
dynamic
business
can
be
managed;
they
are
increasingly seen as best-practice cases within HP. The
OR
techniques
applied
by
the
data
scientists
at
HP
to
solve
business
issues
in
its
e-commerce
business
are
novel,
and
provide
a
powerful
and
scalable
set
of
solutions
to
improve
key
business
drivers
and
ensure
profitable
growth.
These
solutions
directly
influence
HP’s
business
strategy
of
selling
more
through
its
e-commerce
model.
Although
the
tools
discussed
in
this
paper
have
been
successfully
implemented
in
HP’s
US
e-com-
merce
business,
they
are
scalable
and
portable
across
different
geographies,
business
units,
customer
seg-
ments,
and
cross-sales
motions
(i.e.,
retail
versus
online).
HP
plans
to
expand
to
23
countries
glob-
ally
under
an
integrated
e-commerce
platform;
these
well-tested solutions should be readily applicable and
yield
additional
revenue
in
the
coming
years.
Appendix
Marketing
Budget
Optimization
HP’s
LP-based
marketing
budget
optimization
formulation
follows.
Objective
function
Maximize
total
sales
=
ROI
1
x
SPEND
1
+
ROI
2
x
SPEND
2
+ ··· +
ROI
n
x
SPEND
n
0
Constraints
SPEND
4
1
1
2
1
3
10001n5
≤
MAX
SPEND
4
1
1
2
1
3
10001n5
,
SPEND
4
1
1
2
1
3
10001n5
≥
MIN
SPEND
4
1
1
2
1
3
10001n5
,
n
X
i
=
1
SPEND
i
≤
maximum
total
budget,
n
X
i
=
1
SPEND
i
≥
minimum
total
budget,
where
1
1
2
1
3
10001n
represent all marketing channel and product
category
combinations;
SPEND
n
is
the
suggested
budget
allocation
for
combina-
tion
n
(i.e.,
the
decision
variable);
ROI
n
is
the
ROI
for
combination
n
;
ROI
is
defined
as
the
ratio of revenue from a marketing vehicle and dollars spent
on
that
vehicle;
MAX
SPEND
n
and
MIN
SPEND
n
represent
maximum
and
minimum
boundaries
on
SPEND
n
.
Customer
Segmentation
We
constructed
discriminant
functions
using
purchase
transactions,
customer
demographics,
and
lifestyle
attributes
on
the
sample
data,
such
that
L
k
=
p
X
i
=
1
b
ik
x
i
+
c
1
where
k
=
1
10001
6
(customer
market
segments),
L
k
is
the
discriminant
function
for
the
k
th
segment,
b
ik
values
are
discriminant
coefficients,
x
i
values
are
the
predictors,
and
c
is
a
constant.
We
estimate
b
ik
by
LDA
using
SAS
soft-
ware.
Each
customer
is
scored
and
classified
into
one
of
the
groups
using
Arg
Max
i
(
L
1
10001L
i
10001L
k
).
The
model
achieved
correct
classification
of
62
percent.
After
scoring
HPDirect.com’s
entire
customer
base,
we
validated
the
pro-
files of the scored segments against the original profiles and
found
that
the
segments
were
valid.
Purchase-Timing
Model
Our
repeat-purchase
framework
is
a
solution
to
the
prob-
lem
of
predicting
future
purchase
patterns
of
customers,
as
Fader
et
al.
(2005)
discuss.
Although
our
model
uses
the
same
input
variables
(i.e.,
first
transaction
date
(
t
1
),
last
transaction
date
(
t
x
),
and
the
number
of
transactions
(
x
))
as
Fader
et
al.
do,
we
develop
a
full
Bayesian
implementation
that
gives
us
total
control
of
the
output
parameters
and
is
scalable
to
millions
of
customers.
The
probability
of
customer
j
making
a
purchase
in
the
next
k
periods
is
given
by
4
1
−
p
j
54
1
−
exp
8
−
k
j
951
(1)
where
k
may
be
any
unit
of
time
(e.g.,
30
days,
six
months,
or
one
year),
and
p
j
and
j
are
parameter
estimates
for
the
probability
of
churn
and
rate
of
purchase,
respectively.
Although
the
Bayesian
hierarchical
model
was
effective
and
correct
in
identifying
customers
who
are
likely
to
be
repeat
purchasers,
it
was
not
efficient
in
scoring
millions
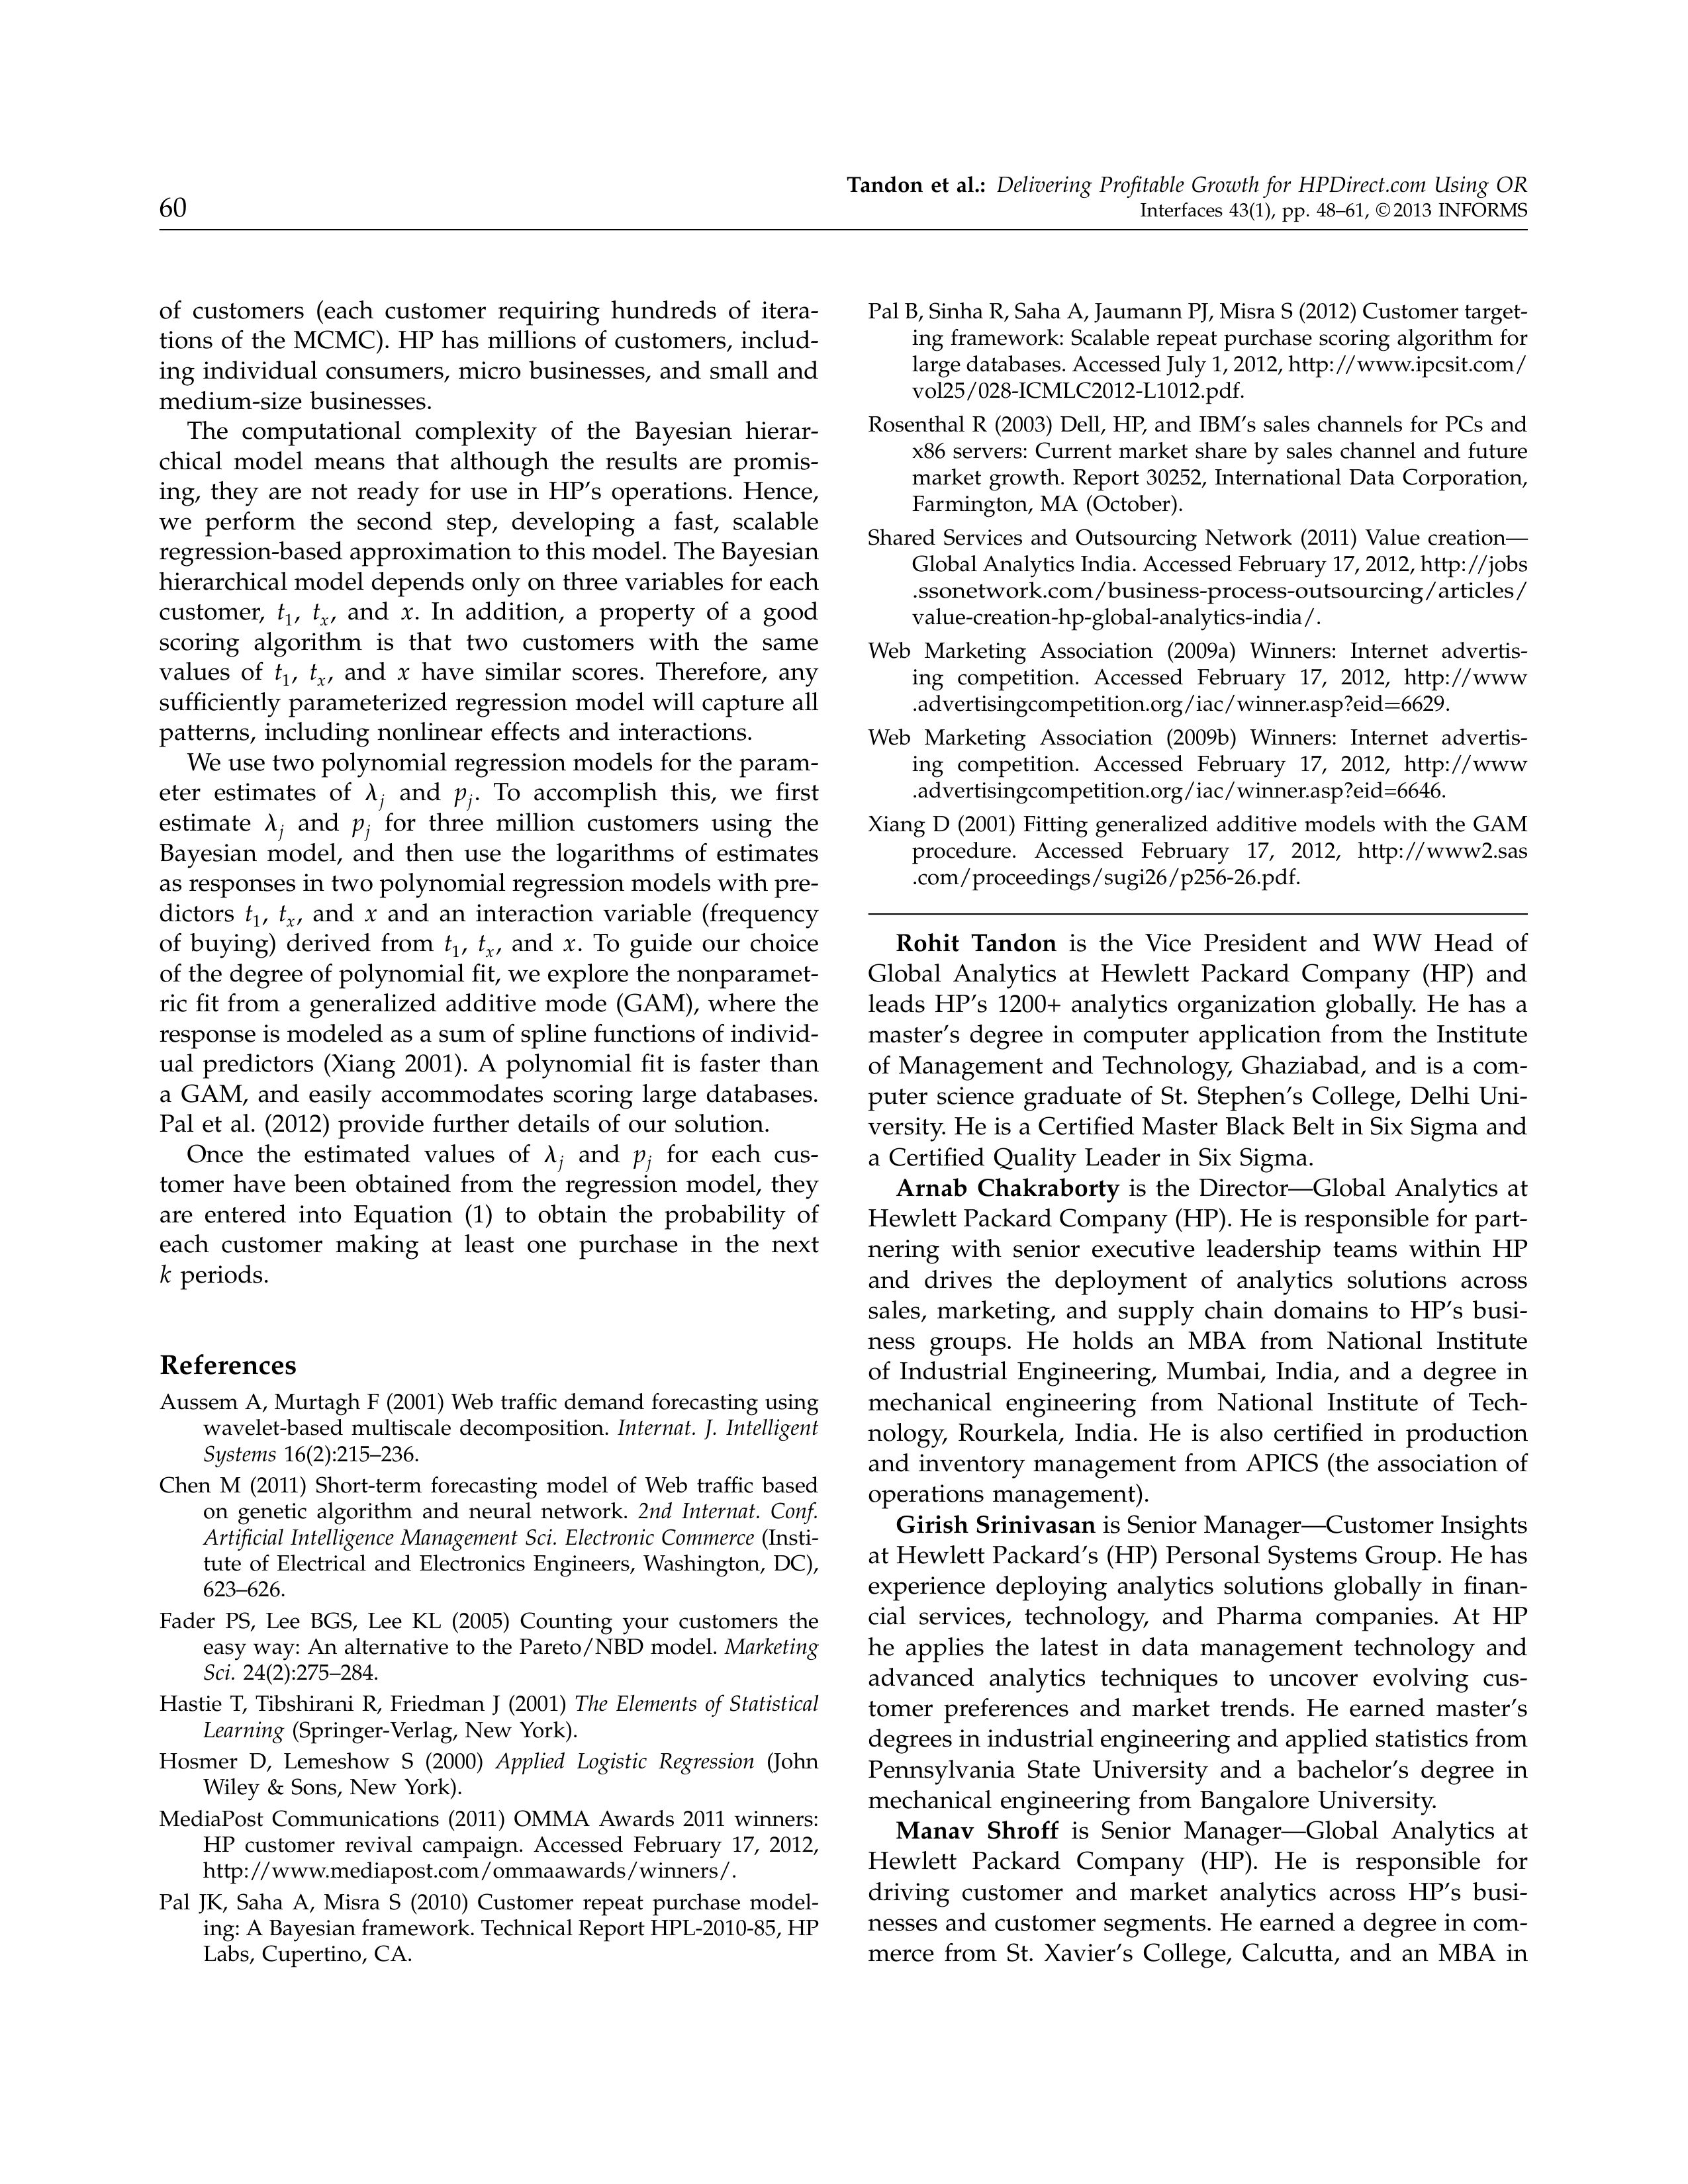
Tandon
et
al.:
Delivering
Profitable
Growth
for
HPDirect.com
Using
OR
60
Interfaces
43(1),
pp.
48–61,
© 2013
INFORMS
of
customers
(each
customer
requiring
hundreds
of
itera-
tions
of
the
MCMC).
HP
has
millions
of
customers,
includ-
ing
individual
consumers,
micro
businesses,
and
small
and
medium-size
businesses.
The
computational
complexity
of
the
Bayesian
hierar-
chical
model
means
that
although
the
results
are
promis-
ing,
they
are
not
ready
for
use
in
HP’s
operations.
Hence,
we
perform
the
second
step,
developing
a
fast,
scalable
regression-based approximation to this model. The Bayesian
hierarchical model depends only on three variables for each
customer,
t
1
,
t
x
,
and
x
.
In
addition,
a
property
of
a
good
scoring
algorithm
is
that
two
customers
with
the
same
values
of
t
1
,
t
x
,
and
x
have
similar
scores.
Therefore,
any
sufficiently
parameterized
regression
model
will
capture
all
patterns,
including
nonlinear
effects
and
interactions.
We use two polynomial regression models for the param-
eter
estimates
of
j
and
p
j
.
To
accomplish
this,
we
first
estimate
j
and
p
j
for
three
million
customers
using
the
Bayesian
model,
and
then
use
the
logarithms
of
estimates
as responses in two polynomial regression models with pre-
dictors
t
1
,
t
x
,
and
x
and
an
interaction
variable
(frequency
of
buying)
derived
from
t
1
,
t
x
,
and
x
0
To
guide
our
choice
of the degree of polynomial fit, we explore the nonparamet-
ric
fit
from
a
generalized
additive
mode
(GAM),
where
the
response is modeled as a sum of spline functions of individ-
ual
predictors
(Xiang
2001).
A
polynomial
fit
is
faster
than
a
GAM,
and
easily
accommodates
scoring
large
databases.
Pal
et
al.
(2012)
provide
further
details
of
our
solution.
Once
the
estimated
values
of
j
and
p
j
for
each
cus-
tomer
have
been
obtained
from
the
regression
model,
they
are
entered
into
Equation
(1)
to
obtain
the
probability
of
each
customer
making
at
least
one
purchase
in
the
next
k
periods.
References
Aussem
A,
Murtagh
F
(2001)
Web
traffic
demand
forecasting
using
wavelet-based
multiscale
decomposition.
Internat.
J.
Intelligent
Systems
16(2):215–236.
Chen
M
(2011)
Short-term
forecasting
model
of
Web
traffic
based
on
genetic
algorithm
and
neural
network.
2nd
Internat.
Conf.
Artificial
Intelligence
Management
Sci.
Electronic
Commerce
(Insti-
tute
of
Electrical
and
Electronics
Engineers,
Washington,
DC),
623–626.
Fader
PS,
Lee
BGS,
Lee
KL
(2005)
Counting
your
customers
the
easy
way:
An
alternative
to
the
Pareto/NBD
model.
Marketing
Sci.
24(2):275–284.
Hastie
T,
Tibshirani
R,
Friedman
J
(2001)
The
Elements
of
Statistical
Learning
(Springer-Verlag,
New
York).
Hosmer
D,
Lemeshow
S
(2000)
Applied
Logistic
Regression
(John
Wiley
&
Sons,
New
York).
MediaPost
Communications
(2011)
OMMA
Awards
2011
winners:
HP
customer
revival
campaign.
Accessed
February
17,
2012,
http://www.mediapost.com/ommaawards/winners/.
Pal
JK,
Saha
A,
Misra
S
(2010)
Customer
repeat
purchase
model-
ing: A Bayesian framework. Technical Report HPL-2010-85, HP
Labs,
Cupertino,
CA.
Pal B, Sinha R, Saha A, Jaumann PJ, Misra S (2012) Customer target-
ing
framework:
Scalable
repeat
purchase
scoring
algorithm
for
large databases. Accessed July 1, 2012, http://www.ipcsit.com/
vol25/028-ICMLC2012-L1012.pdf.
Rosenthal
R
(2003)
Dell,
HP,
and
IBM’s
sales
channels
for
PCs
and
x86
servers:
Current
market
share
by
sales
channel
and
future
market
growth.
Report
30252,
International
Data
Corporation,
Farmington,
MA
(October).
Shared
Services
and
Outsourcing
Network
(2011)
Value
creation—
Global Analytics India. Accessed February 17, 2012, http://jobs
.ssonetwork.com/business-process-outsourcing/articles/
value-creation-hp-global-analytics-india/.
Web
Marketing
Association
(2009a)
Winners:
Internet
advertis-
ing
competition.
Accessed
February
17,
2012,
http://www
.advertisingcompetition.org/iac/winner.asp?eid
=
6629.
Web
Marketing
Association
(2009b)
Winners:
Internet
advertis-
ing
competition.
Accessed
February
17,
2012,
http://www
.advertisingcompetition.org/iac/winner.asp?eid=6646.
Xiang
D
(2001)
Fitting
generalized
additive
models
with
the
GAM
procedure.
Accessed
February
17,
2012,
http://www2.sas
.com/proceedings/sugi26/p256-26.pdf.
Rohit
Tandon
is
the
Vice
President
and
WW
Head
of
Global
Analytics
at
Hewlett
Packard
Company
(HP)
and
leads
HP’s
1200+
analytics
organization
globally.
He
has
a
master’s
degree
in
computer
application
from
the
Institute
of
Management
and
Technology,
Ghaziabad,
and
is
a
com-
puter
science
graduate
of
St.
Stephen’s
College,
Delhi
Uni-
versity. He is a Certified Master Black Belt in Six Sigma and
a
Certified
Quality
Leader
in
Six
Sigma.
Arnab
Chakraborty
is
the
Director—Global
Analytics
at
Hewlett Packard Company (HP). He is responsible for part-
nering
with
senior
executive
leadership
teams
within
HP
and
drives
the
deployment
of
analytics
solutions
across
sales,
marketing,
and
supply
chain
domains
to
HP’s
busi-
ness
groups.
He
holds
an
MBA
from
National
Institute
of
Industrial
Engineering,
Mumbai,
India,
and
a
degree
in
mechanical
engineering
from
National
Institute
of
Tech-
nology,
Rourkela,
India.
He
is
also
certified
in
production
and
inventory
management
from
APICS
(the
association
of
operations
management).
Girish Srinivasan
is Senior Manager—Customer Insights
at
Hewlett
Packard’s
(HP)
Personal
Systems
Group.
He
has
experience
deploying
analytics
solutions
globally
in
finan-
cial
services,
technology,
and
Pharma
companies.
At
HP
he
applies
the
latest
in
data
management
technology
and
advanced
analytics
techniques
to
uncover
evolving
cus-
tomer
preferences
and
market
trends.
He
earned
master’s
degrees in industrial engineering and applied statistics from
Pennsylvania
State
University
and
a
bachelor’s
degree
in
mechanical
engineering
from
Bangalore
University.
Manav
Shroff
is
Senior
Manager—Global
Analytics
at
Hewlett
Packard
Company
(HP).
He
is
responsible
for
driving
customer
and
market
analytics
across
HP’s
busi-
nesses
and
customer
segments.
He
earned
a
degree
in
com-
merce
from
St.
Xavier’s
College,
Calcutta,
and
an
MBA
in
Tandon
et
al.:
Delivering
Profitable
Growth
for
HPDirect.com
Using
OR
Interfaces
43(1),
pp.
48–61,
© 2013
INFORMS
61
marketing and finance from Kirloskar Institute of Advanced
Management
Studies.
He
is
a
GE-certified
Green
Belt
and
a
Lean
coach.
Ahmar
Abdullah
is
a
database
marketing/analytics
pro-
fessional
with
six
years
of
experience
in
customer-focused
advanced and predictive analytics, primary research, strate-
gic analytic insight, and deep B2C customer knowledge. He
earned
a
bachelor’s
degree
in
chemical
engineering
from
Zakir
Husain
College
of
Engineering
and
Technology
(Ali-
garh
Muslim
University)
and
a
master’s
in
business
admin-
istration
from
Goa
Institute
of
Management.
Bharathan
Shamasundar
is
an
analytics
professional
with
over
eight
years
of
experience
across
financial
plan-
ning
and
analysis,
risk,
and
marketing
analytics
at
Hewlett
Packard and GE. He holds a bachelor’s degree in commerce
from
Bangalore
University,
a
master’s
in
finance
from
the
Institute
of
Chartered
Financial
Analysts
of
India,
and
an
MBA
from
the
Indian
School
of
Business,
Hyderabad.
Ritwik
Sinha
holds
a
bachelor’s
degree
in
statistics
from
Presidency
College,
Calcutta,
and
a
master’s
in
statistics
from
Indian
Statistical
Institute,
New
Delhi.
His
expertise
lies
in
building
analytical
models
for
customer
targeting.
Suresh
Subramanian
is
VP—Customer
Insights
at
Hewlett
Packard’s
Personal
Systems
Group.
He
has
over
17
years
of
experience
in
middle
and
upper
management
at
high-tech
Fortune
200
companies,
including
a
seven-
year
stint
at
Gateway,
Inc.,
as
vice
president,
marketing.
He
earned
a
master’s
degree
and
a
PhD
in
business
adminis-
tration
and
an
undergraduate
degree
in
engineering.
Dave
Hill
is
director
of
Hewlett
Packard’s
consumer
exchange
business,
which
encompasses
the
US
e-commerce
business
and
consumer
call
center.
He
holds
a
bachelor
of
science
degree
in
civil
engineering,
an
MBA,
and
a
profes-
sional
engineering
license
and
chartered
financial
analyst
designation.
Prasanna
Dhore
is
a
customer-centric
marketing
execu-
tive
with
broad
experience
encompassing
key
senior
man-
agement
roles
in
marketing,
CRM,
customer
engagement
and
development,
analytics,
and
strategic
planning
across
technology,
financial
services,
and
publishing.
He
holds
an
MS
in
statistics
and
OR
from
New
York
University’s
Leonard
Stern
School
of
Business,
an
MBA
from
Kansas
State
University,
and
a
BS
in
mechanical
engineering.
He
received
his
chartered
financial
analyst
designation
in
2004.