
Charts have a lot of use in various fields for various purposes. Charts can be used in making organizational charts and flow charts. Chart are also great for comparing data concerning monetary values. There are more than what we can think of on how charts can be put to use.
One of those things can be for comparison purposes. Bar charts and pie charts are also used to compare data, but what is the difference of a comparison chart to those other two charts? Wondering too? Well, lets get deeper into the what is and what for of this chart.
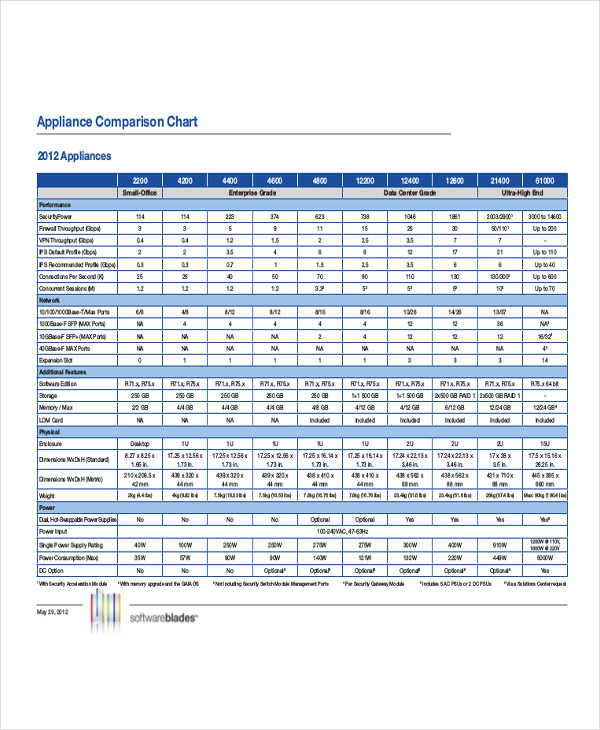
Appliance Comparison Example
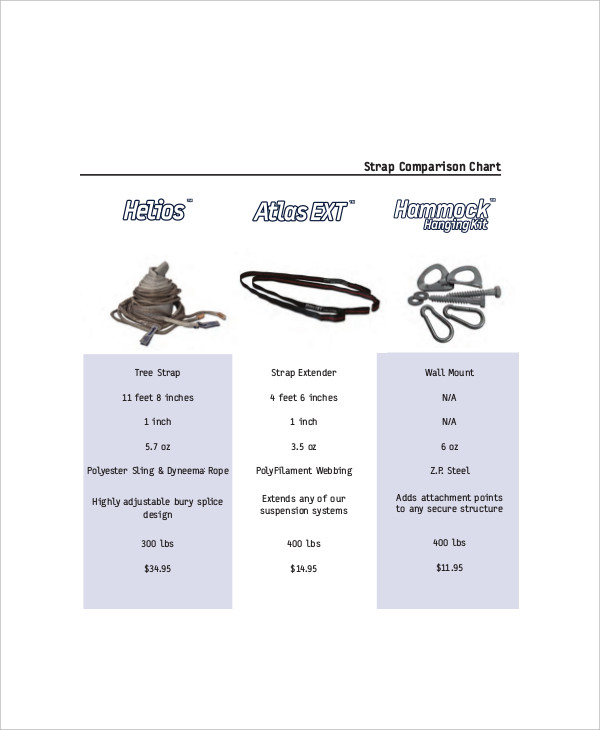
Strap Comparison Chart
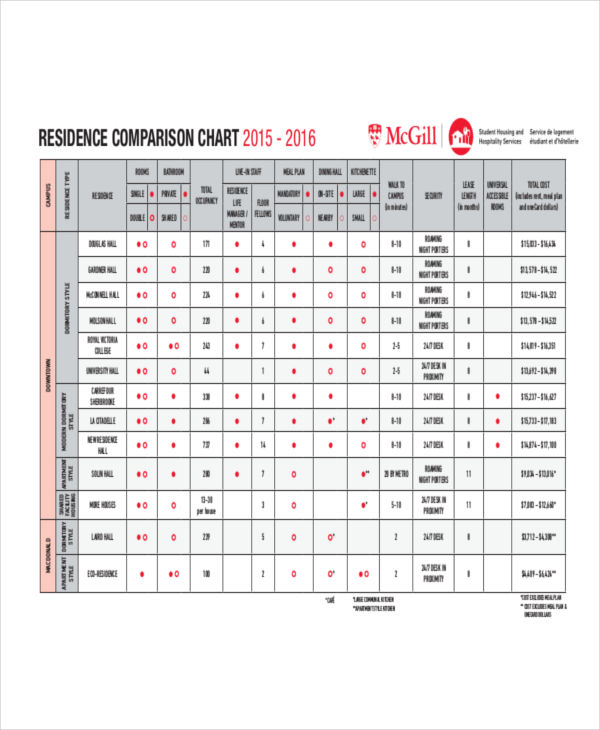
Residence Comparison Sample
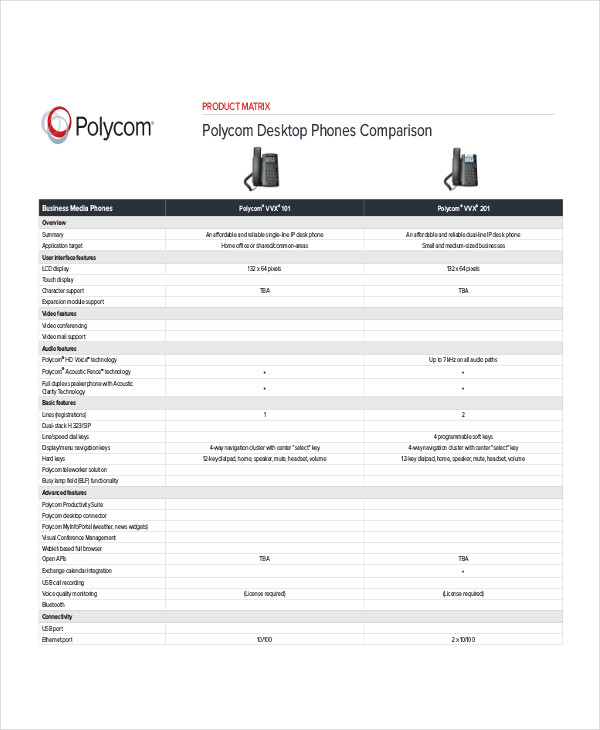
Phone Comparison Chart
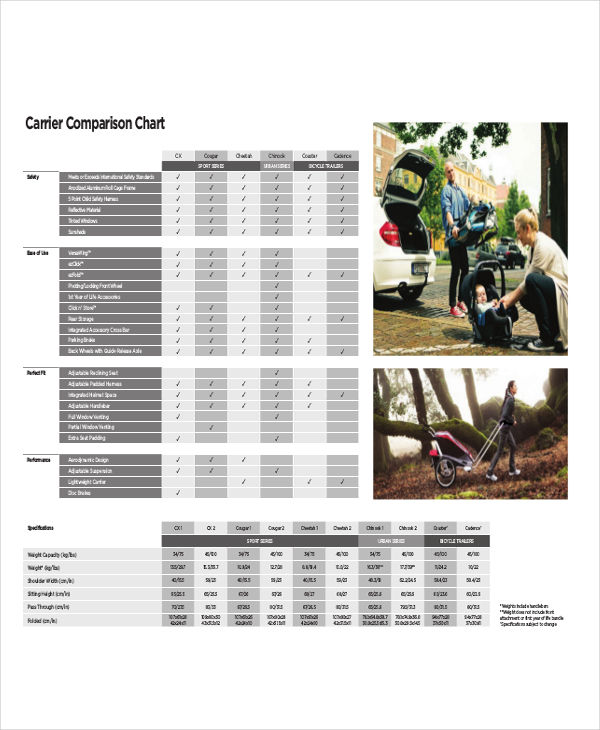
Carrier Comparison Example
What Is a Comparison Chart?
From the word itself, comparison means the act of comparing or seeing the difference and similarity of two option or alternative. This means that comparison charts are chart examples that allows one to compare features or aspects of two alternatives and determine which alternative would be best to choose.
Although pie charts can also be used as a tool for comparison, this type of chart is only limited to showing numerical proportions. Comparison charts, on the other hand, allows you to see in which aspect or point two alternative can differ in value or in characteristic.
How to Create a Comparison Chart?
Now that we know what a comparison chart is for, let us dwell into how we can create it. There are no specific instructions in making a chart but there are points to consider. Comparison charts can be price charts as well.
To make a comparison chart, there must be at least two objects or alternatives to compare. Comparison charts are highly used in comparing products, so to compare, we must determine the characteristics these objects have in common. After listing all the data, you are then able to see comparisons and, thus, made a comparison chart.
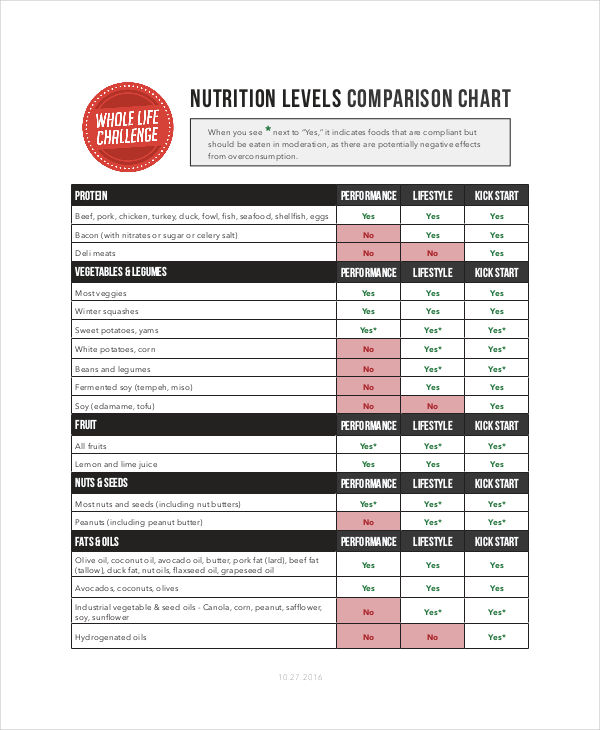
Nutrient Comparison Chart
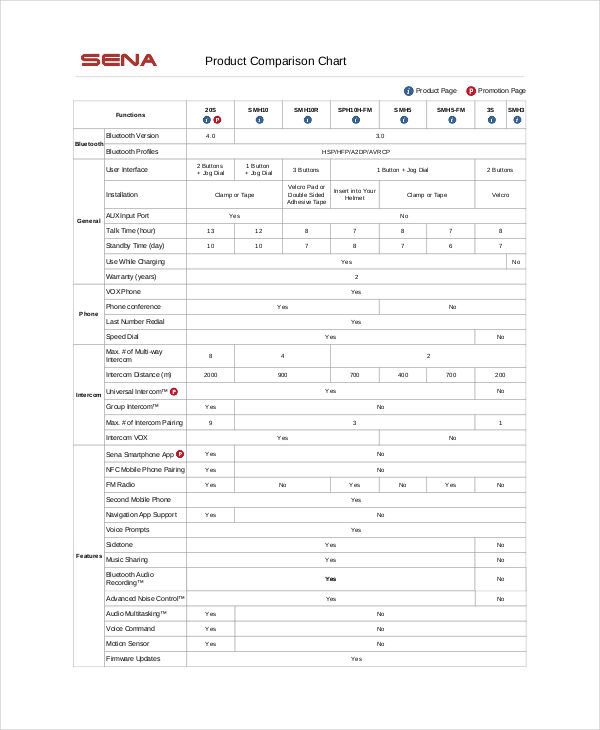
Product Comparison Sample
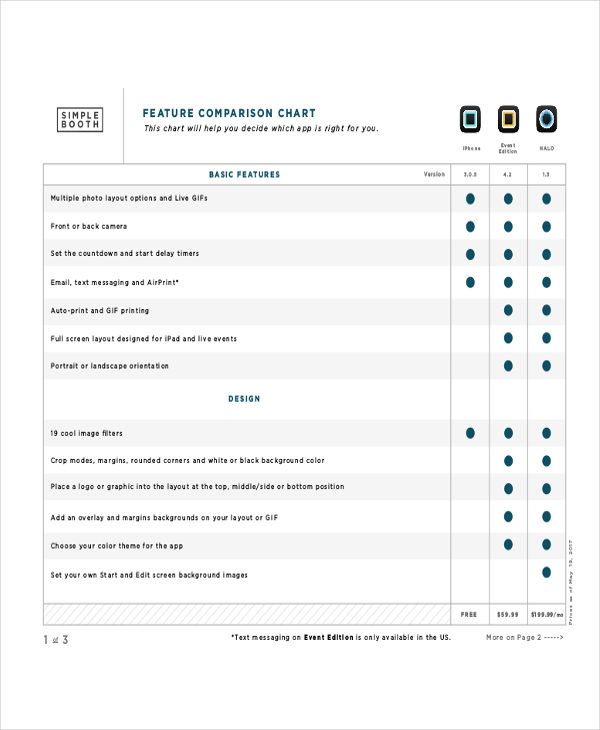
Feature Comparison Chart
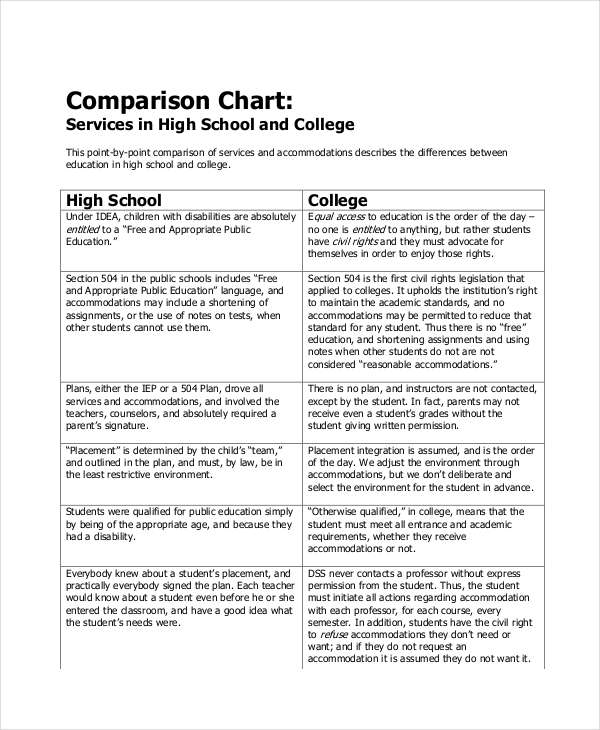
Disability Comparison Example
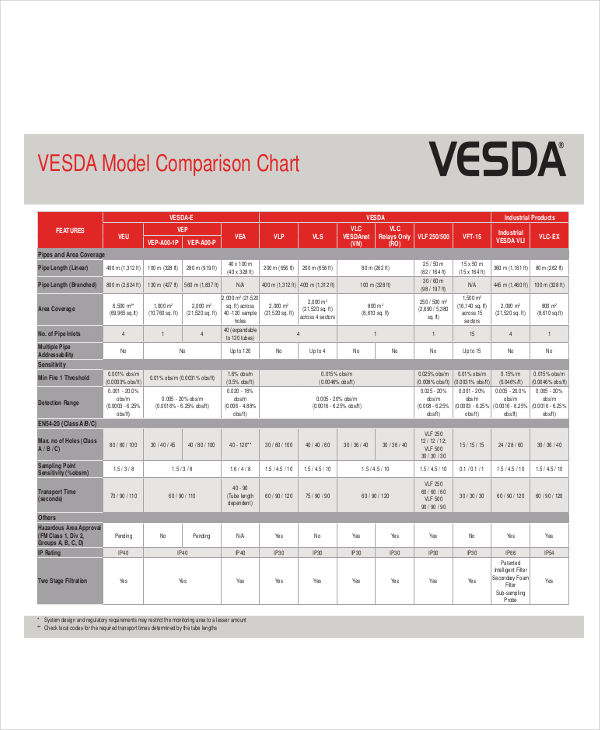
Model Comparison Chart
What Is the Use and Purpose of a Comparison Chart?
As one of those people who are always on the look out of buying products or services that would be much cheaper than others, it is really convenient to have a comparison chart. It is always better to spend less for a product or a service that are basically the same, right? That’s how a comparison chart is useful. With this chart, you can make a better decision in choosing two or more alternatives.
Life is not as easy as counting the petals of a sunflower. When you make a choice, you have to weigh things out to make sure that you are making the right decision. That’s how it is when comparing two or more alternatives. Through the use of a comparison chart, you can see all the characteristics of an object with just a single view. Not only one object, but more than the fingers you have on your hand.
Aside from prices and characteristics, comparison charts can be use as a measurement chart in PDF which can tell you how much you have increase the revenue or how much you have lessen cost. Comparison charts can be used in any field and are easy to understand.