
Chart is a term used to define documents which represent facts and information using graphs, lines, symbols, figures, and images. Charts simply summarize or elaborate information using images and visuals. Most people prefer to use charts in representing various things, as in food charts.
There are various types of charts, and the most commonly used ones include pie charts, bar charts, line charts, and flow charts among others. Since most people learn easily through the aid of visual aids, charts are widely used in schools, and even in the business world.
Metric Conversion Data Chart
Metric System Conversion Chart
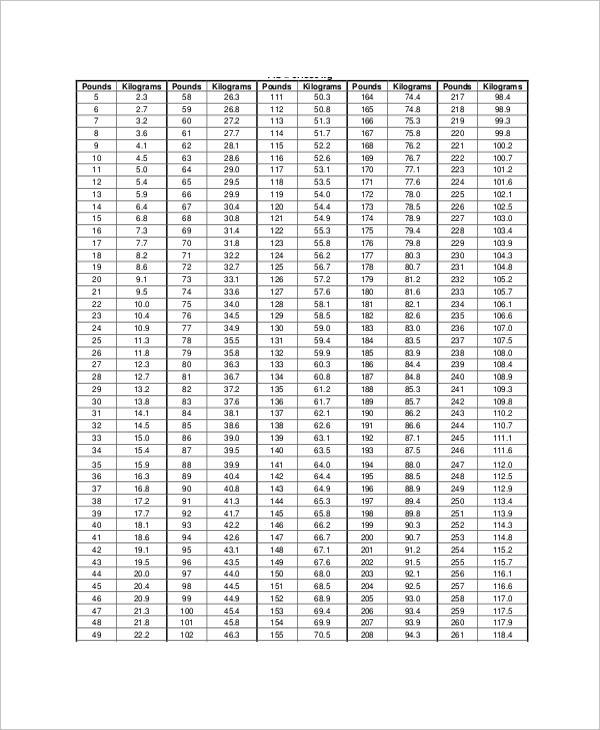
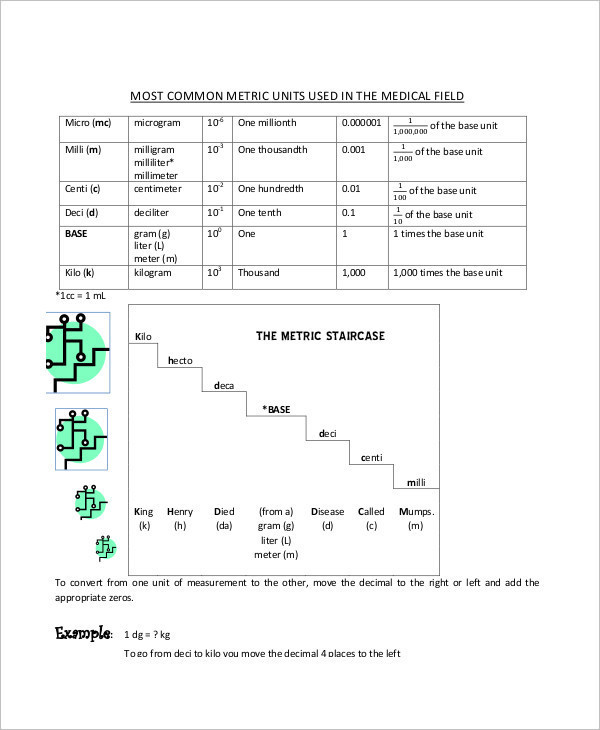
Metric Weight Conversion Example
Metric Unit Conversion Chart
What Is a Metric Conversion Chart?
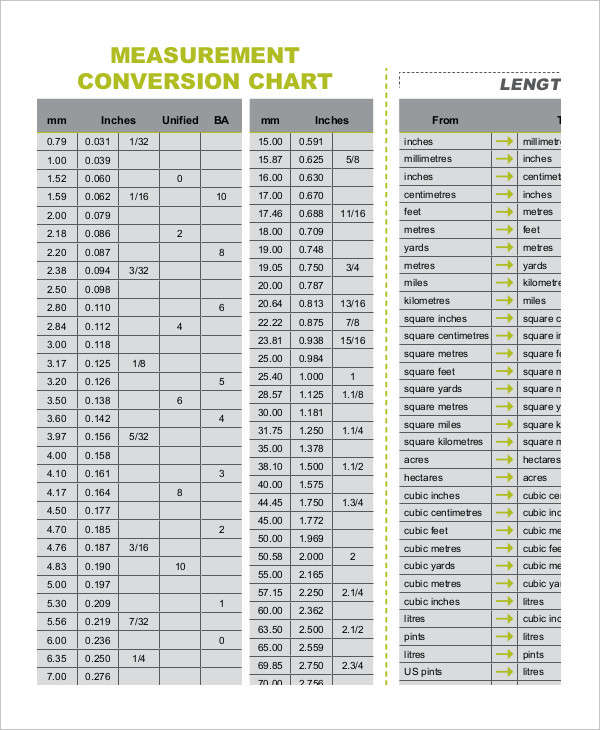
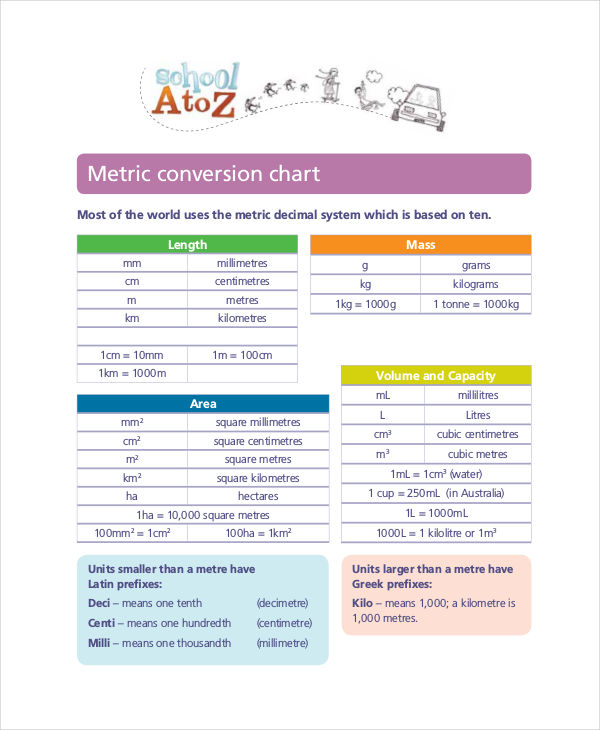
A metric conversion chart, as its name suggests, is a type of chart representing information on the conversion of different metric units. Metric unit conversion charts usually show how to convert certain metric units or measurements to another.
They usually contain figures representing the metric units, and words indicating the units of figures. Common metric units we are familiar of are meters, centimeters, kilograms, grams, kilometers, miles, etc.
How to Use a Metric Conversion Chart
Generally, metric conversion charts indicate instructions on how to convert a specific measurement to another. For example, a metric conversion chart can indicate the conversion of grams to kilograms (e.g. 1000 g = 1 kg).
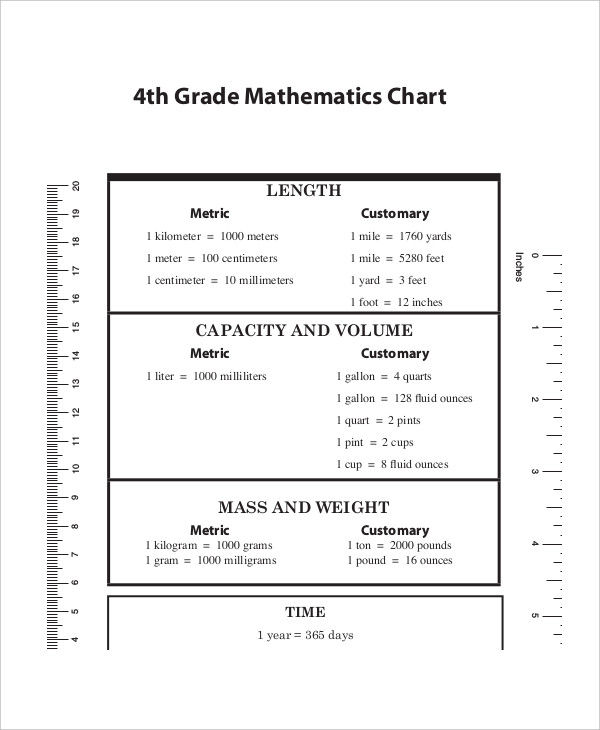
Metric conversion charts are typically used in educational institutions, usually written in a way that can be easily understood by students, making it easier for teachers to discuss the process of conversion.
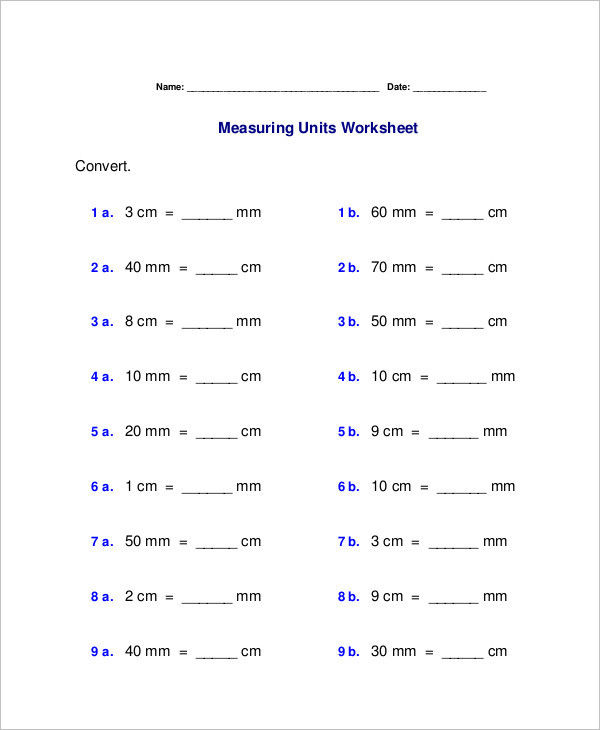
Teachers may include metric conversion charts during written exams on metric conversion to help students convert different metric units to another.
Some teachers require students to study and memorize contents of metric conversion charts during or before their lessons. Metric conversions charts may contain information from the simplest metric unit conversion to the most complicated ones.
Metric Conversion Chart for Kids
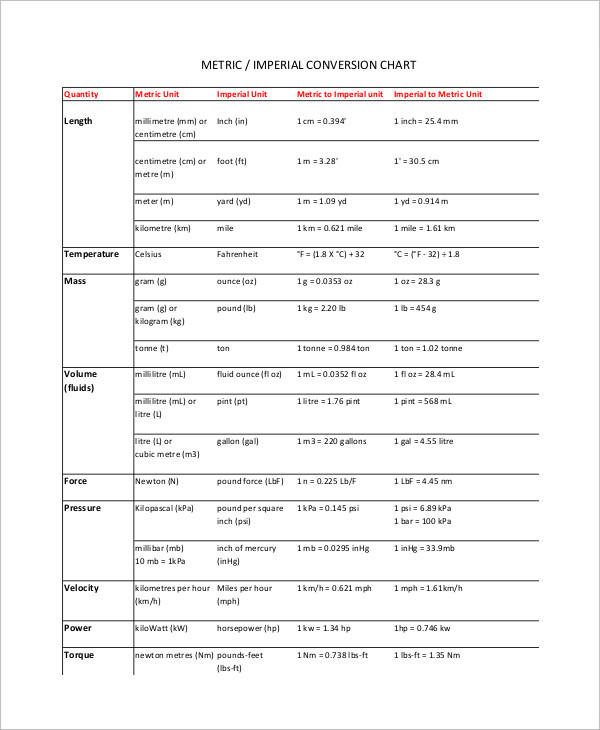
Imperial Metric Conversion Chart
Simple Metric Conversion Chart
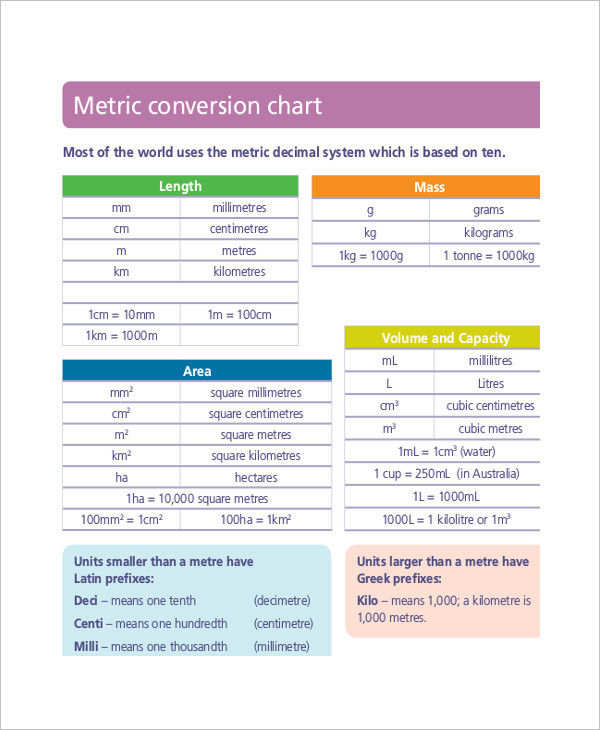
Basic Metric Conversion Sample
How to Make a Metric Conversion Chart
Many people think that making a metric conversion chart is an easy task. Well honestly, it might be a bit tricky. Because the hard part in making a metric conversion chart comes when you start to input numbers and information in the chart (and that is what a metric conversion chart is about). To make it a bit easier, here are things to remember when making your own metric chart:
- Research. Yes, they’re just numbers, but you need to make sure that the information you provide is 100% accurate. So do your research. You may compare your information with some metric conversion charts for this one.
- Be creative. Most people dread numbers. They might find it hard to comprehend information involving numbers, so make sure you catch their attention by presenting your metric conversion chart creatively.
- Keep it clear. Avoid overcrowding your chart with too much number and symbols. Provide empty spaces where you don’t write or put anything. Your readers’ eyes might need them somehow.
- Review and improve. Numbers and figures can be quite confusing at times. Metric conversion chart examples involve too many numbers, which is why you need to take time in reviewing and checking for errors in your metric conversion chart.