10+ Negative Correlation Examples to Download

10+ Negative Correlation Examples to Download

Negative correlation is a statistical concept where two variables move in opposite directions. When one variable increases, the other decreases, and vice versa. This relationship is crucial in various fields, including finance, economics, and science, as it helps identify inverse patterns and dependencies. Understanding negative correlation enables analysts to make informed decisions, manage risks, and optimize strategies. In this article, we explore the fundamentals of negative correlation, its significance, and practical applications across different domains.
What is Negative Correlation?
A negative correlation is a connection between two elements, such as independent and dependent variables, that work in opposite directions. To illustrate a negative correlation, if the price of X tends to rise when the price of Y lowers, and vice versa, then the two are negatively associated. This means that as one variable increases, the other decreases, and this inverse relationship can be quantified using the correlation coefficient. A negative correlation is often observed in various fields, such as finance, where certain asset classes move in opposite directions, or in biology, where one species’ population growth might lead to a decline in another species. To illustrate a negative interpretation, if the price of X tends to rise when the price of Y lowers, and vice versa, then the two are negatively associated.
How it Works?
Negative correlation works by illustrating an inverse relationship between two variables. Here’s how it works in detail:
- Data Collection: Gather data points for the two variables you want to analyze. These variables can be anything measurable, such as stock prices, temperature, or sales figures.
- Plotting Data: Create a scatter plot to visualize the relationship between the two variables. Each point on the plot represents a pair of values for the variables.
- Calculating Correlation Coefficient: Use statistical methods to calculate the correlation coefficient, typically denoted as 𝑟r. The correlation coefficient ranges from -1 to 1:
- 𝑟=−1r=−1: Perfect negative correlation, where an increase in one variable always results in a proportional decrease in the other.
- 𝑟=0r=0: No correlation, meaning no predictable relationship between the variables.
- 𝑟=1r=1: Perfect positive correlation, where an increase in one variable always results in a proportional increase in the other.
- Interpretation: If the correlation coefficient is negative (e.g., -0.5), it indicates a negative correlation. The closer 𝑟r is to -1, the stronger the negative correlation. A value closer to 0 suggests a weak or negligible negative correlation.
- Application: Use the negative correlation to make predictions or decisions. For example, in finance, if stock A and stock B have a strong negative correlation, an investor might hedge risks by including both stocks in their portfolio.
Negative Correlation Examples
- Interest Rates and Stock Prices: Generally, when interest rates rise, stock prices tend to fall because higher borrowing costs can reduce corporate profits.
- Gas Prices and Car Sales: As gas prices increase, the sales of gas-guzzling vehicles like SUVs often decrease, while the sales of fuel-efficient cars may increase.
- Unemployment Rates and Consumer Spending: When unemployment rates rise, consumer spending usually decreases because people have less disposable income.
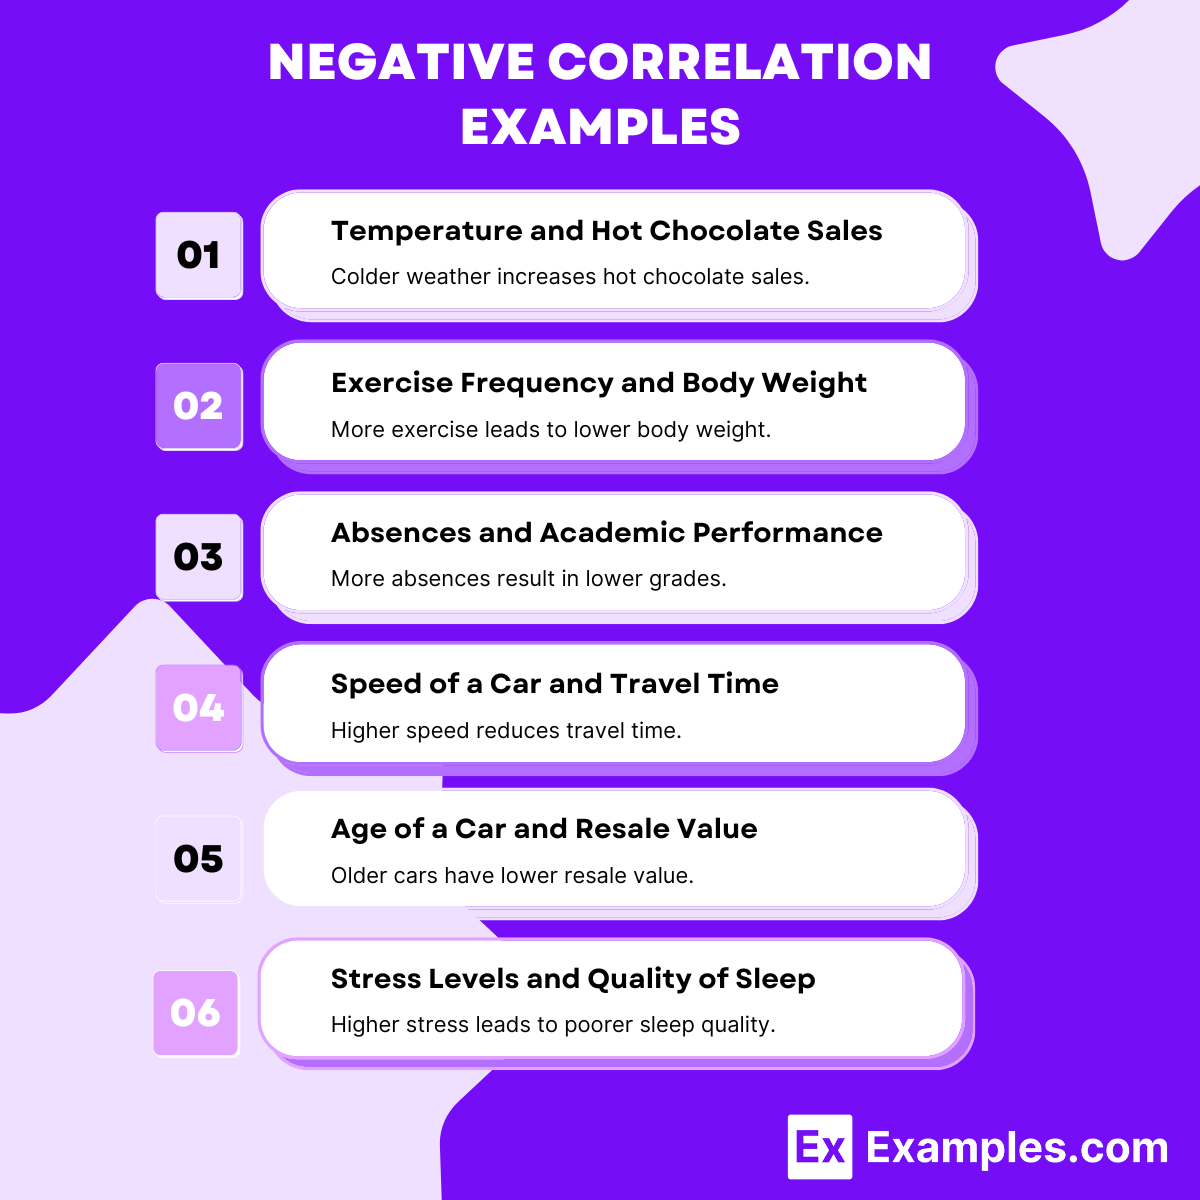
- Exercise and Body Weight: Increased exercise often leads to decreased body weight due to higher calorie expenditure.
- Alcohol Consumption and Liver Health: Higher levels of alcohol consumption are usually associated with poorer liver health.
- Temperature and Heating Bills: As the temperature decreases, heating bills tend to increase due to higher energy usage.
- Age and Flexibility: Generally, as age increases, physical flexibility decreases.
- Rainfall and Outdoor Event Attendance: Increased rainfall often leads to decreased attendance at outdoor events.
- Supply and Prices: In many cases, as the supply of a product increases, its price decreases due to market saturation.
- Work Hours and Leisure Time: As work hours increase, leisure time typically decreases.
- Smoking and Lung Capacity: Higher levels of smoking are usually associated with reduced lung capacity.
- Education Level and Birth Rate: In many societies, higher levels of education are correlated with lower birth rates.
- Pollution and Air Quality: As pollution levels increase, air quality typically decreases.
- Stress and Sleep Quality: Increased stress levels often lead to decreased sleep quality.
- Speed and Travel Time: As speed increases, travel time generally decreases for a given distance.
Negative Correlation Examples in Real life
- Exercise and Body Weight: Generally, the more someone exercises, the lower their body weight tends to be. Increased physical activity typically leads to weight loss or maintenance.
- Temperature and Hot Drink Sales: As the temperature increases, the sales of hot drinks like coffee and tea often decrease. People are more likely to buy cold beverages in hotter weather.
- Speed of a Car and Travel Time: The faster a car travels, the less time it takes to reach a destination. Higher speeds lead to shorter travel times, assuming constant distance and safe driving conditions.
- Price of a Product and Quantity Demanded: According to the law of demand, as the price of a product increases, the quantity demanded usually decreases. Higher prices tend to deter consumers from purchasing as much of the product.
- Unemployment Rate and Consumer Spending: When the unemployment rate rises, consumer spending typically falls. Higher unemployment means fewer people have disposable income to spend, leading to reduced overall spending in the economy.
Negative Correlation in Psychology
In psychology, a negative correlation refers to a relationship between two variables in which one variable increases as the other decreases. This inverse relationship means that higher values of one variable are associated with lower values of the other. Negative correlations are often explored in psychological research to understand how different aspects of behavior, mental processes, or environmental factors interact with each other.
Negative Correlation Examples in Psychology
- Self-Esteem and Anxiety: Higher self-esteem often correlates with lower levels of anxiety. As a person’s self-esteem increases, their anxiety tends to decrease.
- Exercise and Depression: Increased physical activity is often associated with decreased levels of depression. Regular exercise can lead to improved mental health and a reduction in depressive symptoms.
- Stress and Sleep Quality: Higher stress levels are typically associated with poorer sleep quality. As stress increases, the quality and duration of sleep tend to decrease.
- Screen Time and Academic Performance: More screen time, particularly on non-educational activities, is often linked to lower academic performance. As screen time increases, grades and overall academic success may decrease.
- Social Support and Loneliness: Greater social support often correlates with lower feelings of loneliness. Individuals with strong social networks typically experience less loneliness.
Negative Correlation Examples in Healthcare
- Physical Activity and Cardiovascular Disease: Increased levels of physical activity are negatively correlated with the incidence of cardiovascular diseases. Regular exercise helps lower blood pressure, improve cholesterol levels, and reduce the risk of heart disease.
- Smoking and Lung Function: Smoking is negatively correlated with lung function. As smoking frequency increases, lung function (measured by parameters like FEV1) decreases, leading to respiratory problems and diseases such as COPD.
- Medication Adherence and Hospital Readmission: Higher medication adherence rates are negatively correlated with hospital readmissions. Patients who follow their prescribed medication regimens are less likely to be readmitted to the hospital.
- Body Mass Index (BMI) and Life Expectancy: There is a negative correlation between high BMI and life expectancy. Higher BMI, especially in the obese range, is associated with shorter life expectancy due to the increased risk of various health conditions like diabetes, heart disease, and certain cancers.
- Sleep Duration and Stress Levels: Adequate sleep duration is negatively correlated with stress levels. As sleep duration increases, stress levels tend to decrease, promoting better mental health and overall well-being.
Positive Correlation Examples
- Height and Weight: Generally, as a person’s height increases, their weight tends to increase as well.
- Education and Income: Higher levels of education often correlate with higher income levels.
- Advertising and Sales: Increased spending on advertising typically correlates with increased sales of a product.
- Exercise and Physical Fitness: More frequent exercise is associated with better physical fitness.
- Experience and Skill Level: As a person gains more experience in a job, their skill level tends to increase.
Weak Negative Correlation
A weak negative correlation indicates a relationship between two variables where, as one variable increases, the other variable tends to decrease, but this relationship is not strong. The correlation coefficient for a weak negative correlation would typically be close to 0 but still negative (e.g., between -0.1 and -0.3).
Weak Negative Correlation Examples
- Height and Weight in Adults:
- There might be a weak negative correlation between height and weight among a specific subset of adults (e.g., certain age groups or specific conditions) where generally taller individuals might weigh less than shorter ones due to specific dietary or lifestyle factors.
- Hours Spent Studying and Number of Social Media Posts:
- There might be a weak negative correlation between the number of hours a student spends studying and the number of social media posts they make. As studying increases, social media activity might slightly decrease, but other factors play significant roles, making the correlation weak.
- Temperature and Hot Beverage Sales:
- In regions with moderate climates, there might be a weak negative correlation between daily temperature and hot beverage sales. As temperatures rise slightly, hot beverage sales might decrease slightly, but not in a strong or consistent manner.
- Rainfall and Outdoor Activity:
- There might be a weak negative correlation between the amount of daily rainfall and the number of people engaging in outdoor activities. Light rain might discourage some outdoor activities but not strongly, leading to a weak negative correlation.
Strong Negative Correlation
A strong negative correlation between two variables means that as one variable increases, the other variable tends to decrease in a consistent and predictable manner. In statistical terms, this is represented by a correlation coefficient close to -1. A strong negative correlation (e.g., 𝑟r close to -0.8 or -0.9) implies that the two variables have a very consistent inverse relationship. For example, if you were examining the relationship between time spent studying and number of errors on a test, you might find a strong negative correlation: as study time increases, the number of errors decreases.
Strong Negative Correlation Examples
- Temperature and Heating Bills: In colder months, as the temperature decreases, heating bills tend to increase because more energy is required to heat homes.
- Hours of Exercise and Body Fat Percentage: Typically, as the number of hours spent exercising increases, body fat percentage tends to decrease due to the burning of calories and increase in muscle mass.
- Speed of a Vehicle and Travel Time: As the speed of a vehicle increases, the time it takes to travel a fixed distance decreases, assuming other conditions are constant.
- Alcohol Consumption and Motor Skills Performance: As alcohol consumption increases, motor skills performance generally decreases due to the impairing effects of alcohol.
- Age of a Car and Its Resale Value: As a car gets older, its resale value usually decreases because of wear and tear and the introduction of newer models.
What is the R value for a negative correlation?
The R-value in quantitative research means that there is a correlation between the number’s value and the closeness of the pair: The quantitative analysis is that there is no correlation when r is zero. If r is 1, then there is a one-to-one positive correlation. A complete negative correlation is represented by the value r = -1.
One should use the correlations only to determine a cause. The executives can use it to understand the relationship between variables, such as market demand and consumer spending, that already exists as part of the analysis and then formulate deductive reasoning. But one should not use it as a research design to investigate the cause and effect of the change in one variable due to other variables because multiple factors will always impact that relationship. For example, consumer spending in the market and the revenue of an FMCG company. They may show a positive correlation in this case study or experimental research, but that company’s revenue may increase because of some other reason, like the launch of a new product or expansion into an emerging economy.
Significance of Negative Correlation
A negative correlation signifies an inverse relationship between two variables. When one variable increases, the other decreases, and vice versa. Here are some key points highlighting the significance of negative correlation:
- Understanding Relationships: Identifying negative correlations helps in understanding the dynamics between variables. For instance, if studying the relationship between exercise frequency and body weight, a negative correlation would indicate that increased exercise is associated with lower body weight.
- Predictive Analysis: Negative correlations can be used to make predictions. For example, if there’s a known negative correlation between hours spent studying and errors on a test, increasing study time can be expected to reduce errors.
- Risk Management: In finance, negative correlations are essential for portfolio diversification. If one asset’s value tends to rise when another’s falls, combining them can reduce overall risk.
- Causal Inferences: While correlation does not imply causation, understanding negative correlations can guide further investigation into causal relationships. Researchers can design experiments to explore why two variables are inversely related.
- Business and Economics: Businesses can use negative correlations for strategic decisions. For instance, if sales of a product are negatively correlated with its price, lowering the price might increase sales volume.
- Environmental Studies: In environmental science, negative correlations help understand ecosystem dynamics. For instance, a negative correlation between pollution levels and biodiversity can highlight the impact of pollution on ecosystems.
- Medical Research: In health studies, negative correlations can reveal important health trends. For example, a negative correlation between smoking and lung capacity indicates the harmful effects of smoking.
Applications of Negative Correlation Across Different Domains
Finance and Investment
- Portfolio Diversification: Investors combine assets with negative correlations to reduce risk. For example, stocks and bonds often have a negative correlation, so when stock prices fall, bond prices may rise, balancing the overall portfolio performance.
- Hedging: Derivatives like options or futures are used to hedge against potential losses in investments. If the underlying asset price falls, the derivative’s value might increase, offsetting the loss.
Economics
- Consumer Behavior: There may be a negative correlation between the price of a good and its demand (law of demand). As prices increase, demand generally decreases, and vice versa.
- Economic Indicators: Some economic indicators may have negative correlations. For example, unemployment rates and GDP growth often show an inverse relationship; as GDP grows, unemployment rates tend to fall.
Healthcare
- Medication and Symptoms: The effectiveness of certain medications might negatively correlate with the severity of symptoms. As medication dosage increases, symptom severity decreases.
- Preventive Measures and Disease Incidence: There is often a negative correlation between the implementation of preventive measures (like vaccinations) and the incidence of certain diseases.
Environmental Science
- Pollution and Air Quality: Increased pollution levels are negatively correlated with air quality. As pollution rises, air quality decreases.
- Temperature and Snowfall: In certain regions, there might be a negative correlation between temperature and snowfall. As temperatures rise, snowfall decreases.
Psychology and Sociology
- Stress and Performance: According to the Yerkes-Dodson Law, there is an optimal level of stress for peak performance. Too much or too little stress can negatively correlate with performance levels.
- Social Support and Mental Health: Increased social support often correlates negatively with mental health issues. As social support rises, mental health problems decrease.
Engineering
- System Reliability and Component Stress: In engineering systems, the reliability of a system might negatively correlate with the stress on its components. As component stress increases, system reliability decreases.
- Signal Processing: Noise and signal clarity often have a negative correlation. As noise increases, signal clarity decreases.
Education
- Study Time and Failure Rates: There can be a negative correlation between the amount of time spent studying and failure rates. As study time increases, failure rates typically decrease.
- Class Size and Academic Performance: In some cases, there might be a negative correlation between class size and academic performance. Larger class sizes might lead to lower individual student performance.
Sports
- Training Intensity and Injury Rates: There can be a negative correlation between moderate training intensity and injury rates. While overtraining increases injury risk, appropriate training levels can reduce it.
- Player Fatigue and Performance: Player fatigue often correlates negatively with performance. As fatigue increases, performance tends to decline.
Negative Correlation Coefficient
A negative correlation coefficient indicates an inverse relationship between two variables. As one variable increases, the other tends to decrease, and vice versa. The correlation coefficient, denoted as 𝑟r, ranges from -1 to 1:
- 𝑟=−1r=−1 signifies a perfect negative linear relationship, meaning every increase in one variable corresponds to a proportional decrease in the other.
- 𝑟=0r=0 indicates no linear relationship between the variables.
- 𝑟r between 0 and -1 signifies a negative linear relationship, with values closer to -1 indicating a stronger inverse relationship.
For example, if we observe a negative correlation between the amount of time spent studying and the number of errors made on a test, it implies that more study time generally leads to fewer errors.
Advantages
- Risk Management and Diversification:
- Investment Strategy: In finance, negative correlation between assets can be beneficial for diversification. When one asset’s value decreases, the value of another increases, which can reduce overall portfolio risk.
- Balanced Performance: Negative correlation can help smooth out the performance of a portfolio, leading to more stable returns over time.
- Predictive Power:
- Insight into Relationships: Negative correlation can provide insights into how variables interact. For instance, understanding that an increase in exercise is correlated with a decrease in body weight can inform health interventions.
- Forecasting: In some contexts, knowing one variable’s trend can help predict the trend of the other, which can be useful for planning and decision-making.
- Control and Intervention:
- Causality Understanding: If the negative correlation suggests a causal relationship, it can be used to control or influence one variable by manipulating the other. For example, increasing educational interventions might be used to decrease dropout rates.
- Improving Outcomes: In healthcare, for instance, knowing that increased medication adherence negatively correlates with hospitalization rates can lead to strategies that encourage adherence.
Disadvantages
- Complex Interpretation:
- Misinterpretation Risk: Correlation does not imply causation. A negative correlation might lead to incorrect conclusions about the relationship between variables if other factors are not considered.
- Overlooking Context: Without understanding the underlying reasons for the correlation, actions based solely on negative correlation can be misguided.
- Negative Implications:
- Undesirable Outcomes: In some cases, a negative correlation can indicate a problematic relationship. For example, if increased work hours negatively correlate with job satisfaction, it may suggest issues with work-life balance.
- Statistical Limitations:
- Spurious Correlation: Negative correlations can sometimes be spurious, resulting from coincidental relationships rather than any meaningful connection. This can lead to misguided decisions if the correlation is assumed to be meaningful without further investigation.
- Non-linear Relationships: Negative correlations assume a linear relationship between variables, which might not capture more complex, non-linear interactions.
- Limited Applicability:
- Scope of Variables: Negative correlations between two variables do not account for the potential influence of other variables, limiting the scope of analysis.
- Context Dependence: The applicability of negative correlation findings can be highly context-dependent, reducing their generalizability.
1. What is negative correlation?
Negative correlation occurs when one variable increases while the other decreases, indicating an inverse relationship between the two variables.
How is negative correlation represented?
Negative correlation is represented by a correlation coefficient ranging from -1 to 0. A value close to -1 indicates a strong inverse relationship.
What is an example of negative correlation?
An example is the relationship between exercise frequency and body fat percentage: as exercise frequency increases, body fat percentage tends to decrease.
How is negative correlation calculated?
Negative correlation is calculated using statistical methods, such as Pearson’s correlation coefficient, which quantifies the strength and direction of the relationship between two variables.
What does a negative correlation of -1 mean?
A negative correlation of -1 indicates a perfect inverse relationship, meaning as one variable increases, the other decreases at a constant rate.
Can negative correlation be zero?
Yes, a correlation of zero indicates no relationship between the two variables, meaning changes in one do not predict changes in the other.
What is the difference between positive and negative correlation?
Positive correlation indicates that both variables move in the same direction, whereas negative correlation means they move in opposite directions.
How does negative correlation impact investments?
In investments, negative correlation helps diversify portfolios, reducing risk by balancing assets that move inversely to one another.
Can negative correlation change over time?
Yes, the correlation between variables can change due to various factors, such as economic conditions, market dynamics, or changes in underlying relationships.
What fields use negative correlation analysis?
Negative correlation analysis is used in finance, economics, health, psychology, and social sciences to understand inverse relationships between variables.
Share :
