Flowcharts used to be the most popular method to represent computer algorithms before computer terminals and third-generation programming languages started to take over in the late 1970s. According to the New World Encyclopedia, these programming languages express computer algorithms in a more concise and readable way. Despite technological advances, though, many still use flowcharts for various projects, such as clinical research project plans, etc.
[bb_toc content=”][/bb_toc]
What Is Research Flowchart?
A flowchart, in general, is a sequential graphical representation of the processes involved in solving a problem. This diagram contains connecting lines or arrows and boxes that represent a process workflow. Through this diagram, you can quickly analyze, design, and document a process or program, which makes it an essential part of research projects in various fields such as qualitative researches and case studies. This chart also helps your audience to effectively understand research proposals, data collection, research design, literature review, abstract, research questionnaires, and other sections of a research paper, since it can provide an overview of each part more quickly.
Different Types of Flowcharts
As a researcher, there are many types of flowchart that you can create to organize your research project. Provided below are the most common diagrams you can use.
Basic Flowchart
This type of flowchart represents a systematic step-by-step process that leads to certain conclusions. It contains different shapes and arrows which show the sequence and direction of a process. Moreover, you can use it to execute a more effective study analyzation, design, documentation, and process management.
Swimlane Flowchart
Unlike the basic flowchart, the swimlane flowchart shows the connection of different objects in the chart. An excellent example of this flowchart is an organizational chart. This type of chart usually highlights the positions and responsibilities of every individual who belongs to an organization. Aside from that, it shows how these people will work hand-in-hand to accomplish the ultimate corporate goal.
Workflow Flowchart
The workflow diagram plays a vital role in the business process. This visualization tool allows you to represent the necessary tasks to obtain a specific goal. You may also indicate in the chart the people you assigned to execute the tasks. In research, you can use it to show the functionalities of particular objects.
Data Flowchart
Through a data flowchart, you can illustrate the connection of the information from the system and external sources. A data flowchart is also an essential tool in representing the flow of information or data into and out of a system.
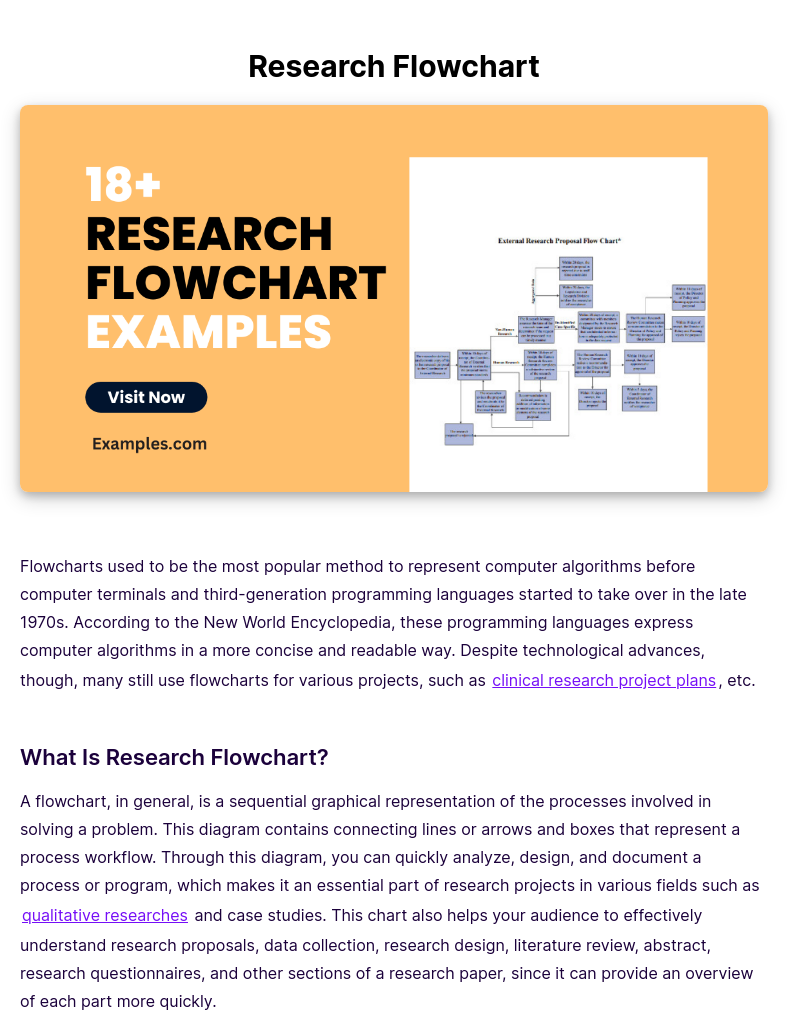
18+ Research Flowchart Examples
Now that you know the most common types of research flowcharts, download the following samples to get more knowledge on how you can effectively use these diagrams.
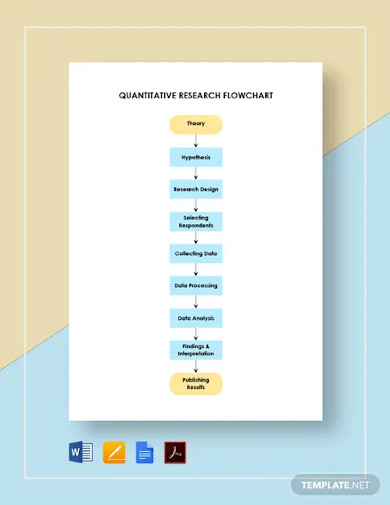
1. Quantitative Research Flowchart Template
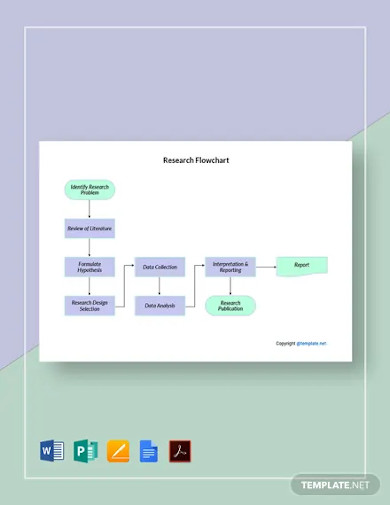
2. Sample Research Flowchart Template
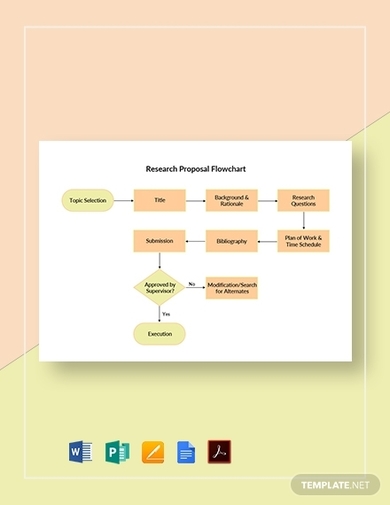
3. Research Proposal Flowchart Template
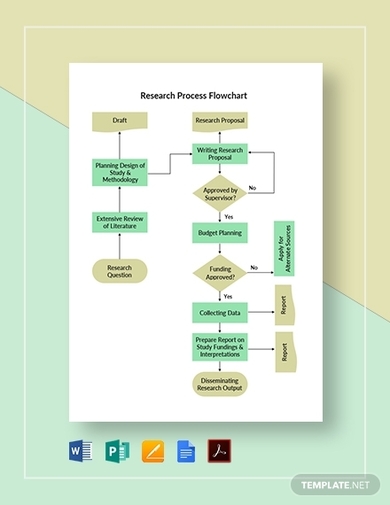
4. Research Process Flowchart Template
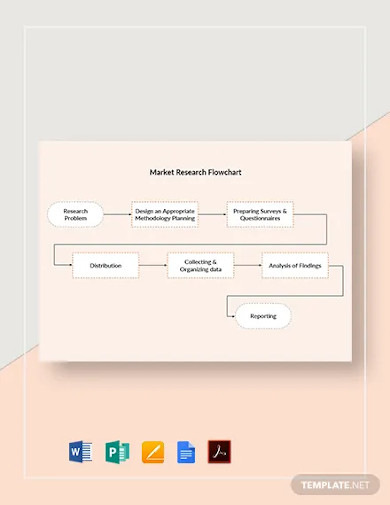
5. Market Research Flowchart Template
6. Editable Research Flowchart Template
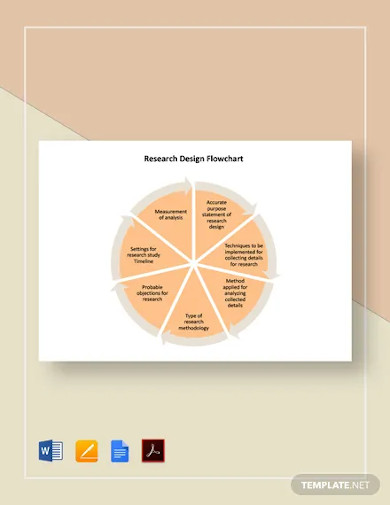
7. Research Design Flowchart Template
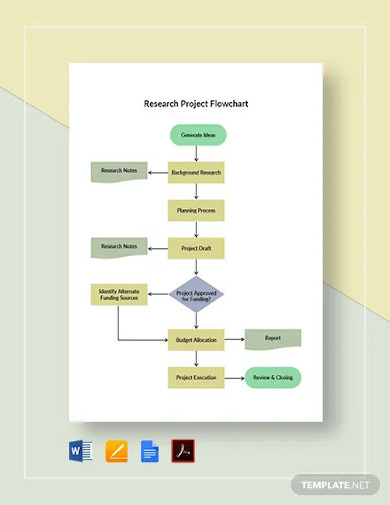
8. Research Project Flowchart Template
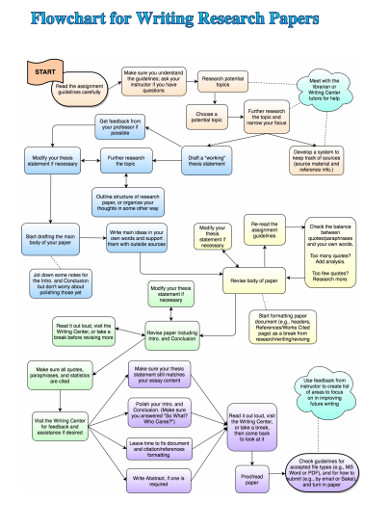
9. Flowchart for Writing Research Papers Examples
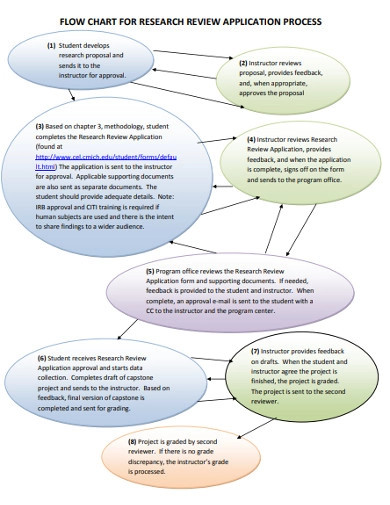
10. Research Application Process Flowchart Example
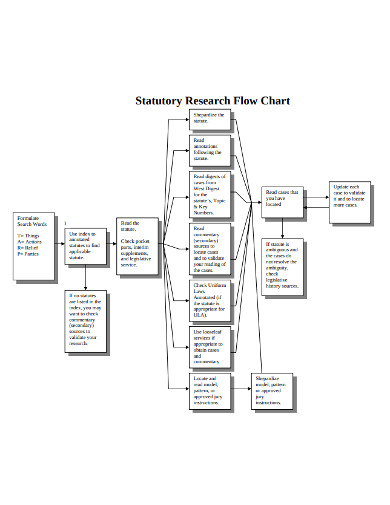
11. Statutory Research Flow Chart Example
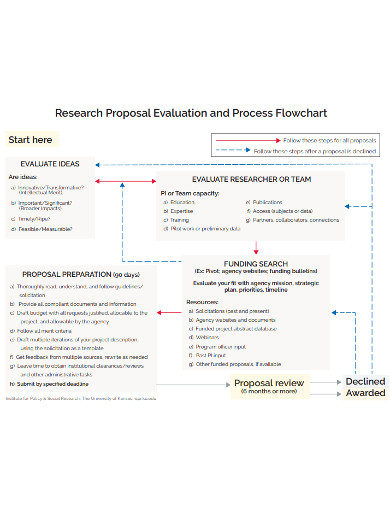
12. Research Proposal Evaluation and Process Flowchart Example
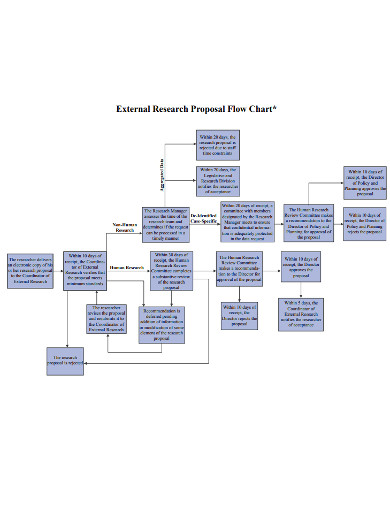
13. External Research Proposal Flow Chart Example
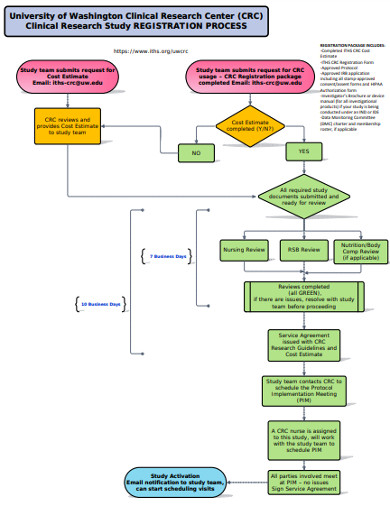
14. Clinical Study Research Flowchart Example
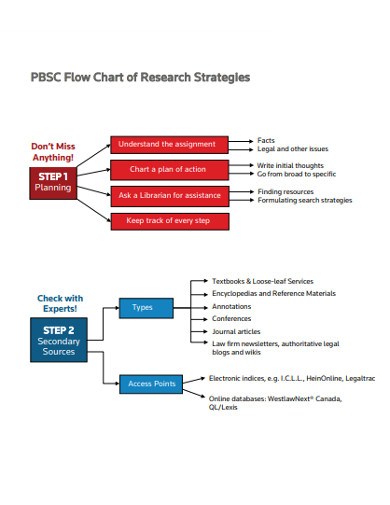
15. Flow Chart of Research Strategies Example
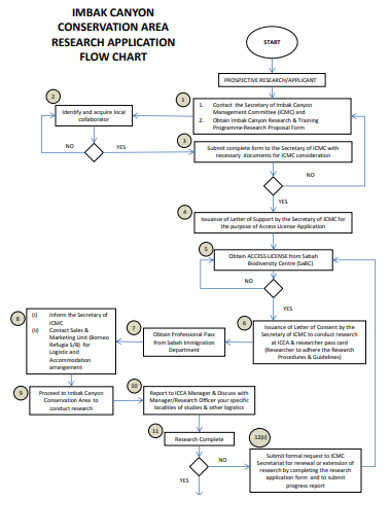
16. Conservation Area Research Flowchart Example
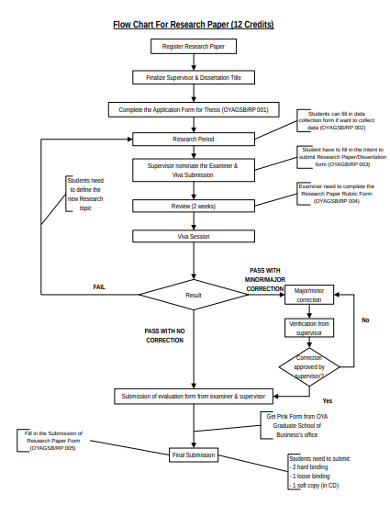
17. Sample Flow Chart For Research Paper Example
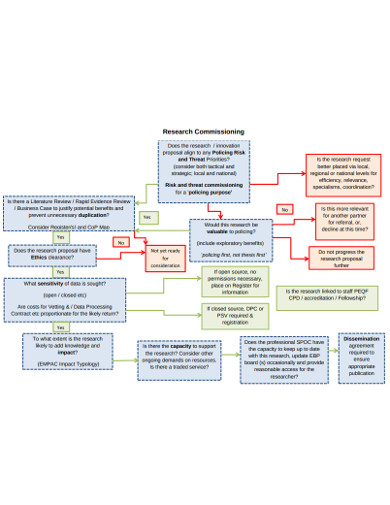
18. Research Commissioning Flowchart Example
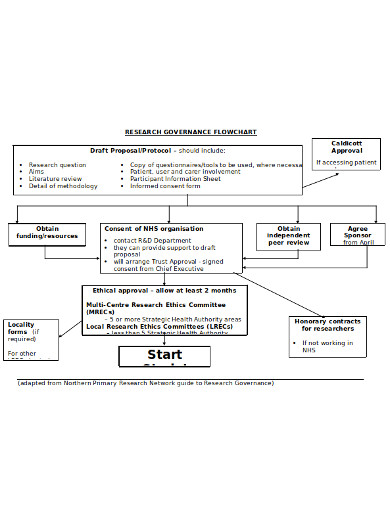
19. Research Governance Flowchart Example
How to Create a Process Flowchart?
As mentioned earlier, you can use flowcharts, such as a process flowchart, in various research sections. With that said, you need to follow an organized guide in creating a great flowchart, whether you are creating it for medical research or other scientific studies. Follow the steps provided below for you to come up with a functional research flowchart.
1. Do Your Research
Before doing anything else, you have to understand the environment of your research project. Determine if you need to learn specific research skills to carry out the investigation or research method accordingly.
2. Evaluate
In this step, you will determine if the existing researches have used flowcharts. You will also find out if there is a need to use a flowchart for your research project. You will then decide the best diagram that you can apply.
3. Create the Flowchart
There are many online tools that you can use to create a diagram for your project. You can use either the free or the paid versions. These paid versions may come with additional features. However, it is essential to know that usually, free versions will get the job done. You don’t want to pay for something that you don’t really need, right?
4. Modify and Enhance
To make your flowchart functional, include essential information such as the details or explanation of each content that you incorporate in your chart. However, keep in mind that in the real world, processes can be complex, so fitting all the materials on one page can be a challenge. Be creative. Summarize the process details, but do not omit the essential parts.
A flowchart is indeed vital in creating more strategic research in many aspects. Improving the flow of the project both in reader’s and the researcher’s end is just an example of what it can do. With that said, it can be helpful if you know how to incorporate this type of visualization to the research methodology that you are using.