Given the data set: 4, 8, 6, 5, 3, what is the standard deviation?
1.58
2.24
3.16
4.12

Life is full of variations, which means no data set is the same. To account for the subjectivity of the data we obtain, we use standard deviation to help predict the variance of data.

Standard deviation is the average value variance of the data set or array. If you want to learn more about standard deviation you may use any of the standard deviation samples, PDF, and activities in the list above.
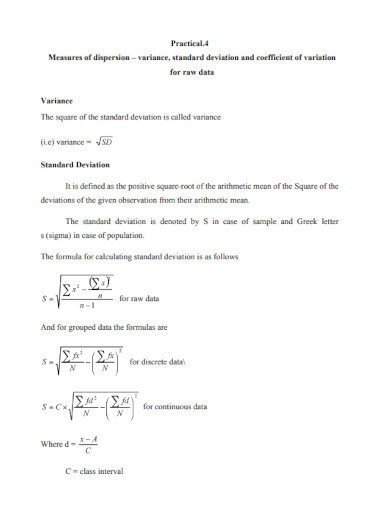
The formula of standard deviation is ?=?1/N N?Ni=1(Xi??)2 and is best tackled one equation at a time. ? is the standard deviation of the data set, N is the number of data inside the data set, X is each value of the data, and ? is the mean of the population.
Begin by finding the mean or average of the data set. Write all the data in the data set on a piece of paper or digital note-taking software. This means you must add up all the data and divide it by the number of data in the data set
After you have found the mean or average of the data, you must use it to determine the deviation of the numbers in the data set. The deviation is the difference between the data and the average of the data set. Repeat this process until you have found the deviation of all the numbers in the data set.
You must first square all the deviations of the data set. Afterward, you must add up the deviations, this will help you find the variance of the data.
Using the squared sum of the deviations in the data set, we must divide it with something called Bessel’s correction which comes in the form of N-1, where N is the total number of the data set.
You must square root the variance to obtain the standard deviation of the data set. Note that the overall format of the standard deviation should come in the form of x? ± ?, where x? is the mean or average of the data set and ? is the standard deviation.
Yes, you can apply the standard deviation formula in Microsoft Excel which is commonly in the form of STDEV.S for real numbers or STDEV.A for arguments and logical statements. To use STDEV.S in Microsoft Excel you must first open an excel sheet and select a cell to put a formula in. After you have done that you must input STDEV.S([Number1]:[Number2]:[Number3]) in the cell’s formula bar. The number signifies the specific rational number in the data array, while the 1, 2, 3, and … signify the position of the number in the data. You may alternatively select cells in the specified range or array of cells in the sheet which could come in the form of STDEV.S(Letter1:Letter2). Doing this will cover the whole span of data between the cells chosen. The product of the STDEV.S formula will result in the form of [Average Number of the Data ± the standard deviation].
Standard deviation is the concept that takes into account the random and subjective nature of the perspectives of people and humans. This means it tries to factor in random human mistakes, deviance, and scores, to create a more accurate answer or conclusion. Not only that but the standard deviation will also factor in the overall variability of the data set. The standard deviation has plenty of real-life applications that cater more to the subject of research that includes both qualitative and quantitative research.
There are plenty of real-life examples of the usage of standard deviations. One such example is the determination of house prices in a given set of neighborhoods, one can use standard deviation to predict the prices of all the houses in the neighborhood chosen. Another example you can observe is in the determination of the average scores in an exam. This will help teachers and professors discover the overall variance of scores, which can be used to gauge the whole performance of the class.
Standard Deviation is the measure of the variability of a specific set of real numbers. If used properly, the standard deviation can be used to determine the variance of the data.
Text prompt
Add Tone
10 Examples of Public speaking
20 Examples of Gas lighting
Given the data set: 4, 8, 6, 5, 3, what is the standard deviation?
1.58
2.24
3.16
4.12
For the data set: 2, 2, 2, 2, 2, what is the standard deviation?
0
1
2
3
Which data set has the highest standard deviation?
1, 1, 1, 1
1, 2, 1, 2
1, 5, 1, 5
1, 9, 1, 9
If the standard deviation of a data set is 0, what can be inferred about the data?
All values are different
All values are the same
The mean is 0
The data set is empty
Given the data set: 10, 12, 14, 16, 18, what is the variance?
2
4
8
10
If the standard deviation of a data set increases, what happens to the data's spread?
It decreases
It stays the same
It increases
It becomes negative
Given the data set: 3, 7, 7, 19, what is the mean?
8
9
10
11
For the data set: 6, 9, 12, what is the range?
3
6
9
12
Which of the following data sets has the smallest standard deviation?
1, 2, 3, 4, 5
2, 2, 2, 2, 2
1, 3, 5, 7, 9
5, 10, 15, 20, 25
Given the data set: 5, 15, 25, what is the mean?
10
15
20
25
Before you leave, take our quick quiz to enhance your learning!

