60+ Null Hypothesis Examples

60+ Null Hypothesis Examples
Making a certain class or laboratory experiment would require a good null hypothesis. You will be given variables to be used in your experiment and then you would be able to identify the relationship between the two. Every beginning of the experiment report would indicate your hypotheses. It is proven useful for it can be tested to prove if the result is considered false.
What is a Null Hypothesis?
A null hypothesis is used during experiments to prove that there is no difference in the relationship between the two variables. Every type of experiment would require you to make a null hypothesis. From the word itself “null” means zero or no value. If you want to practice making a good experiment report, consider providing a good null hypothesis. Null hypothesis is designed to be rejected if the alternative hypothesis is proven to be exact.
Null Hypothesis Examples in Research
1. Medical Research
- Research Question: Does a new drug lower cholesterol levels more effectively than the current drug?
- Null Hypothesis (H0): The new drug has no effect on cholesterol levels compared to the current drug.
- Symbolic Form: H0: ?1 = ?2
2. Educational Research
- Research Question: Does the use of interactive technology improve student test scores?
- Null Hypothesis (H0): Interactive technology does not improve student test scores.
- Symbolic Form: H0: ?1 = ?2
3. Business Research
- Research Question: Does a new marketing strategy increase sales?
- Null Hypothesis (H0): The new marketing strategy does not increase sales.
- Symbolic Form: H0: ?1 = ?2
4. Psychological Research
- Research Question: Does cognitive-behavioral therapy reduce symptoms of anxiety more than standard therapy?
- Null Hypothesis (H0): Cognitive-behavioral therapy does not reduce anxiety symptoms more than standard therapy.
- Symbolic Form: H0: ?1 = ?2
5. Environmental Research
- Research Question: Does urbanization affect bird population diversity?
- Null Hypothesis (H0): Urbanization has no effect on bird population diversity.
- Symbolic Form: H0: ?urban = ?rural
6. Nutritional Research
- Research Question: Does a low-carb diet lead to more weight loss than a low-fat diet?
- Null Hypothesis (H0): A low-carb diet does not lead to more weight loss than a low-fat diet.
- Symbolic Form: H0: ?1 = ?2
7. Economic Research
- Research Question: Does increasing the minimum wage reduce poverty levels?
- Null Hypothesis (H0): Increasing the minimum wage does not reduce poverty levels.
- Symbolic Form: H0: ?before = ?after
8. Sociological Research
- Research Question: Does social media usage affect teenagers’ self-esteem?
- Null Hypothesis (H0): Social media usage does not affect teenagers’ self-esteem.
- Symbolic Form: H0: ?users = ?non-users
9. Agricultural Research
- Research Question: Does the use of a new fertilizer increase crop yield?
- Null Hypothesis (H0): The new fertilizer does not increase crop yield.
- Symbolic Form: H0: ?1 = ?2
10. Technological Research
- Research Question: Does a new software algorithm improve processing speed?
- Null Hypothesis (H0): The new software algorithm does not improve processing speed.
- Symbolic Form: H0: ?new = ?old
Null Hypothesis Examples in Psychology
1. Effectiveness of Therapy
- Research Question: Does cognitive-behavioral therapy (CBT) reduce symptoms of depression more effectively than no treatment?
- Null Hypothesis (H0): Cognitive-behavioral therapy does not reduce symptoms of depression more effectively than no treatment.
- Symbolic Form: H0: ?CBT = ?control
2. Impact of Sleep on Memory
- Research Question: Does sleep deprivation affect short-term memory performance?
- Null Hypothesis (H0): Sleep deprivation has no effect on short-term memory performance.
- Symbolic Form: H0: ?sleep_deprived = ?non_sleep_deprived
3. Influence of Color on Mood
- Research Question: Does the color of a room affect individuals’ mood?
- Null Hypothesis (H0): The color of a room does not affect individuals’ mood.
- Symbolic Form: H0: ?color1 = ?color2 = ?color3
4. Social Media and Self-Esteem
- Research Question: Does the frequency of social media use affect teenagers’ self-esteem?
- Null Hypothesis (H0): The frequency of social media use does not affect teenagers’ self-esteem.
- Symbolic Form: H0: ?high_use = ?low_use
5. Mindfulness and Stress Reduction
- Research Question: Does mindfulness meditation reduce stress levels in college students?
- Null Hypothesis (H0): Mindfulness meditation does not reduce stress levels in college students.
- Symbolic Form: H0: ?mindfulness = ?control
6. Parenting Styles and Academic Performance
- Research Question: Does authoritative parenting style affect children’s academic performance?
- Null Hypothesis (H0): Authoritative parenting style does not affect children’s academic performance.
- Symbolic Form: H0: ?authoritative = ?other_styles
7. Impact of Exercise on Anxiety
- Research Question: Does regular exercise reduce anxiety levels in adults?
- Null Hypothesis (H0): Regular exercise does not reduce anxiety levels in adults.
- Symbolic Form: H0: ?exercise = ?no_exercise
8. Gender Differences in Risk-Taking Behavior
- Research Question: Are there differences in risk-taking behavior between males and females?
- Null Hypothesis (H0): There are no differences in risk-taking behavior between males and females.
- Symbolic Form: H0: ?males = ?females
9. Impact of Music on Concentration
- Research Question: Does listening to music while studying affect concentration levels?
- Null Hypothesis (H0): Listening to music while studying does not affect concentration levels.
- Symbolic Form: H0: ?music = ?no_music
10. Effect of Group Therapy on Social Skills
- Research Question: Does group therapy improve social skills in individuals with social anxiety?
- Null Hypothesis (H0): Group therapy does not improve social skills in individuals with social anxiety.
- Symbolic Form: H0: ?group_therapy = ?no_therapy
Null Hypothesis Examples in Biology
1. Effect of Fertilizers on Plant Growth
- Research Question: Does a new fertilizer improve plant growth compared to no fertilizer?
- Null Hypothesis (H0): The new fertilizer does not improve plant growth compared to no fertilizer.
- Symbolic Form: H0: ?fertilizer = ?no_fertilizer
2. Antibiotic Effectiveness on Bacteria
- Research Question: Does a new antibiotic reduce bacterial growth more effectively than an existing antibiotic?
- Null Hypothesis (H0): The new antibiotic does not reduce bacterial growth more effectively than the existing antibiotic.
- Symbolic Form: H0: ?new_antibiotic = ?existing_antibiotic
3. Impact of Temperature on Enzyme Activity
- Research Question: Does temperature affect the activity of a specific enzyme?
- Null Hypothesis (H0): Temperature does not affect the activity of the specific enzyme.
- Symbolic Form: H0: Enzyme activity at temperature1 = Enzyme activity at temperature2
4. Genetic Influence on Trait Expression
- Research Question: Does a specific gene affect the expression of a particular trait in a plant species?
- Null Hypothesis (H0): The specific gene does not affect the expression of the particular trait in the plant species.
- Symbolic Form: H0: Trait expression with gene = Trait expression without gene
5. Effect of Light Intensity on Photosynthesis
- Research Question: Does light intensity affect the rate of photosynthesis in plants?
- Null Hypothesis (H0): Light intensity does not affect the rate of photosynthesis in plants.
- Symbolic Form: H0: Photosynthesis rate at light intensity1 = Photosynthesis rate at light intensity2
6. Impact of Diet on Animal Growth
- Research Question: Does a high-protein diet affect the growth rate of animals?
- Null Hypothesis (H0): A high-protein diet does not affect the growth rate of animals.
- Symbolic Form: H0: Growth rate on high-protein diet = Growth rate on normal diet
7. Effect of Pollution on Aquatic Life
- Research Question: Does water pollution affect the survival rate of fish in a lake?
- Null Hypothesis (H0): Water pollution does not affect the survival rate of fish in a lake.
- Symbolic Form: H0: Fish survival in polluted water = Fish survival in non-polluted water
8. Impact of Caffeine on Heart Rate in Daphnia
- Research Question: Does caffeine affect the heart rate of Daphnia (water fleas)?
- Null Hypothesis (H0): Caffeine does not affect the heart rate of Daphnia.
- Symbolic Form: H0: Heart rate with caffeine = Heart rate without caffeine
9. Influence of Soil pH on Plant Germination
- Research Question: Does soil pH affect the germination rate of seeds?
- Null Hypothesis (H0): Soil pH does not affect the germination rate of seeds.
- Symbolic Form: H0: Germination rate at pH1 = Germination rate at pH2
10. Effect of Salinity on Aquatic Plant Growth
- Research Question: Does salinity affect the growth of aquatic plants?
- Null Hypothesis (H0): Salinity does not affect the growth of aquatic plants.
- Symbolic Form: H0: Plant growth in saline water = Plant growth in freshwater
Null Hypothesis Examples in Business
1. Effect of Marketing Campaign on Sales
- Research Question: Does a new marketing campaign increase product sales?
- Null Hypothesis (H0): The new marketing campaign does not increase product sales.
- Symbolic Form: H0: ?campaign = ?no_campaign
2. Impact of Training Programs on Employee Productivity
- Research Question: Do training programs improve employee productivity?
- Null Hypothesis (H0): Training programs do not improve employee productivity.
- Symbolic Form: H0: ?trained = ?untrained
3. Influence of Price Changes on Demand
- Research Question: Do price changes affect the demand for a product?
- Null Hypothesis (H0): Price changes do not affect the demand for the product.
- Symbolic Form: H0: ?price_change = ?no_price_change
4. Customer Satisfaction and Service Quality
- Research Question: Does improving service quality increase customer satisfaction?
- Null Hypothesis (H0): Improving service quality does not increase customer satisfaction.
- Symbolic Form: H0: ?improved_service = ?standard_service
5. Effect of Employee Benefits on Retention Rates
- Research Question: Do enhanced employee benefits reduce turnover rates?
- Null Hypothesis (H0): Enhanced employee benefits do not reduce turnover rates.
- Symbolic Form: H0: ?enhanced_benefits = ?standard_benefits
6. Impact of Social Media Presence on Brand Awareness
- Research Question: Does an active social media presence increase brand awareness?
- Null Hypothesis (H0): An active social media presence does not increase brand awareness.
- Symbolic Form: H0: ?active_social_media = ?inactive_social_media
7. Influence of Store Layout on Customer Purchases
- Research Question: Does store layout affect customer purchasing behavior?
- Null Hypothesis (H0): Store layout does not affect customer purchasing behavior.
- Symbolic Form: H0: ?layout1 = ?layout2
8. Online Advertising and Website Traffic
- Research Question: Does online advertising increase website traffic?
- Null Hypothesis (H0): Online advertising does not increase website traffic.
- Symbolic Form: H0: ?ads = ?no_ads
9. Effect of Product Packaging on Sales
- Research Question: Does new product packaging design increase sales?
- Null Hypothesis (H0): The new product packaging design does not increase sales.
- Symbolic Form: H0: ?new_packaging = ?old_packaging
10. Influence of Remote Work on Employee Performance
- Research Question: Does remote work affect employee performance?
- Null Hypothesis (H0): Remote work does not affect employee performance.
- Symbolic Form: H0: ?remote_work = ?office_work
Null Hypothesis Examples in Statistics
1. Comparing Means
- Research Question: Is there a difference in average test scores between two groups of students?
- Null Hypothesis (H0): There is no difference in the average test scores between the two groups.
- Symbolic Form: H0: ?1 = ?2
2. Proportions
- Research Question: Is the proportion of defective products the same in two different production lines?
- Null Hypothesis (H0): The proportion of defective products is the same in both production lines.
- Symbolic Form: H0: p1 = p2
3. Regression Analysis
- Research Question: Is there a relationship between years of experience and salary?
- Null Hypothesis (H0): There is no relationship between years of experience and salary.
- Symbolic Form: H0: ? = 0 (where ? is the regression coefficient)
4. ANOVA (Analysis of Variance)
- Research Question: Are the means of three or more groups equal?
- Null Hypothesis (H0): The means of all groups are equal.
- Symbolic Form: H0: ?1 = ?2 = ?3 = … = ?k
5. Chi-Square Test for Independence
- Research Question: Are gender and voting preference independent?
- Null Hypothesis (H0): Gender and voting preference are independent.
- Symbolic Form: H0: There is no association between gender and voting preference.
6. Time Series Analysis
- Research Question: Does a time series exhibit a trend over time?
- Null Hypothesis (H0): There is no trend in the time series data over time.
- Symbolic Form: H0: The time series has no significant trend component.
7. Hypothesis Testing for Variance
- Research Question: Is the variance in test scores different between two classes?
- Null Hypothesis (H0): The variances in test scores are equal between the two classes.
- Symbolic Form: H0: ?1² = ?2²
8. Correlation Analysis
- Research Question: Is there a correlation between two variables, such as height and weight?
- Null Hypothesis (H0): There is no correlation between the two variables.
- Symbolic Form: H0: ? = 0 (where ? is the correlation coefficient)
9. Two-Sample t-Test
- Research Question: Do two samples have the same mean?
- Null Hypothesis (H0): The two samples have the same mean.
- Symbolic Form: H0: ?1 = ?2
10. One-Sample t-Test
- Research Question: Does the sample mean differ from a known population mean?
- Null Hypothesis (H0): The sample mean is equal to the population mean.
- Symbolic Form: H0: ? = ?0
Real life Examples of Null Hypothesis
1. Medical Studies
- Research Question: Does a new medication lower blood pressure more effectively than the current medication?
- Null Hypothesis (H0): The new medication does not lower blood pressure more effectively than the current medication.
- Example: A clinical trial compares blood pressure readings between patients taking the new medication and those taking the current medication.
2. Education
- Research Question: Does a new teaching method improve student test scores?
- Null Hypothesis (H0): The new teaching method does not improve student test scores.
- Example: An educational study compares test scores of students taught using the new method versus those taught using traditional methods.
3. Business
- Research Question: Does a new advertising campaign increase product sales?
- Null Hypothesis (H0): The new advertising campaign does not increase product sales.
- Example: A company runs the new campaign and compares sales data before and after the campaign.
4. Public Health
- Research Question: Does a smoking cessation program reduce the smoking rate in a community?
- Null Hypothesis (H0): The smoking cessation program does not reduce the smoking rate in the community.
- Example: Public health officials analyze smoking rates before and after implementing the program.
5. Environmental Science
- Research Question: Does the introduction of a specific fish species affect the biodiversity of a lake?
- Null Hypothesis (H0): The introduction of the specific fish species does not affect the biodiversity of the lake.
- Example: Environmental scientists monitor biodiversity levels before and after introducing the fish species.
6. Economics
- Research Question: Does raising the minimum wage reduce poverty levels?
- Null Hypothesis (H0): Raising the minimum wage does not reduce poverty levels.
- Example: Economists compare poverty rates in regions with and without recent minimum wage increases.
7. Psychology
- Research Question: Does mindfulness meditation reduce stress levels among college students?
- Null Hypothesis (H0): Mindfulness meditation does not reduce stress levels among college students.
- Example: A study measures stress levels before and after a mindfulness meditation program in a group of students.
8. Agriculture
- Research Question: Does the use of a new fertilizer increase crop yield?
- Null Hypothesis (H0): The new fertilizer does not increase crop yield.
- Example: Farmers apply the new fertilizer to one field and a standard fertilizer to another and compare the yields.
9. Technology
- Research Question: Does a new software update improve the speed of a computer program?
- Null Hypothesis (H0): The new software update does not improve the speed of the computer program.
- Example: Software engineers measure the program’s speed before and after applying the update.
10. Marketing
- Research Question: Does personalized email marketing increase customer engagement?
- Null Hypothesis (H0): Personalized email marketing does not increase customer engagement.
- Example: A company sends personalized emails to one group and generic emails to another, then compares engagement rates.
More Null Hypothesis Examples & Samples in PDF
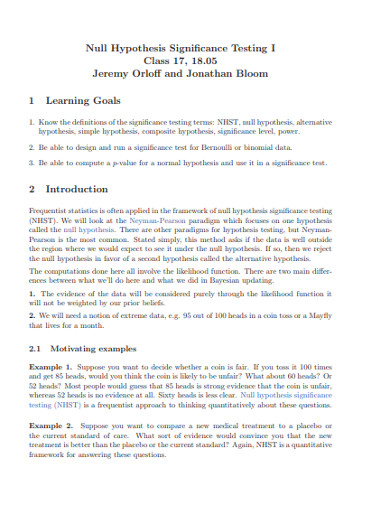
1. Null Hypothesis Significance Test Example
2. Sample Null Hypothesis Example
3. Critical Assessment of Null Hypothesis Example
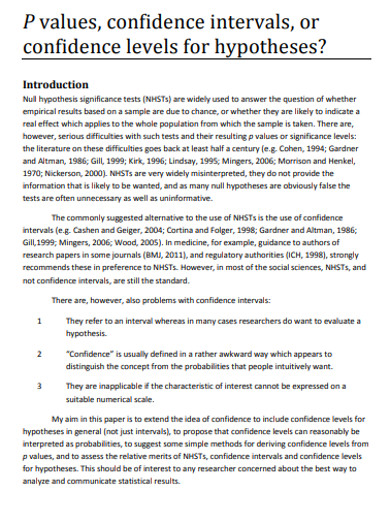
4. Confidence Levels for Null Hypotheses Example
5. Interpreting Failure to Reject A Null Hypothesis Example
ns_row class=”row”]
[/ns_row]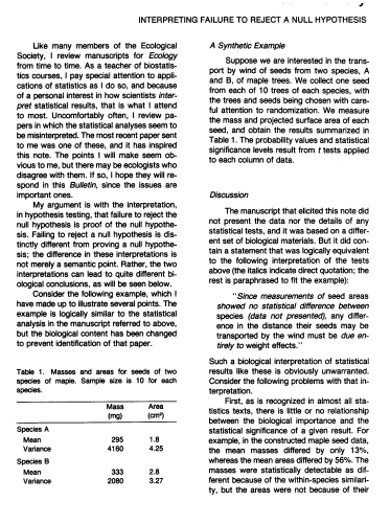
6. Simple Null Hypothesis Example
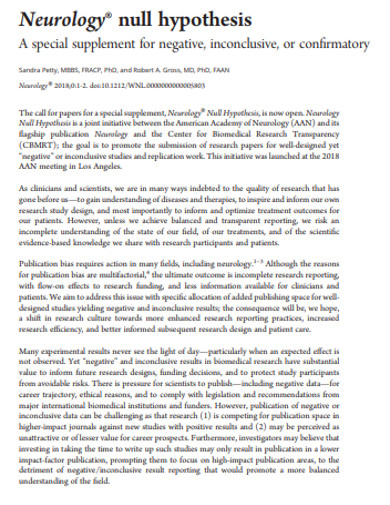
7. Basic Neurology Null Hypothesis Example
8. Null Research Hypothesis in DOC
Purpose of Null Hypothesis
The null hypothesis is a fundamental concept in statistics and scientific research. It serves several critical purposes in the process of hypothesis testing, guiding researchers in drawing meaningful conclusions from their data. Below are the primary purposes of the null hypothesis:
1. Baseline for Comparison
The null hypothesis provides a baseline or a default position that indicates no effect, no difference, or no relationship between variables. It is the statement that researchers aim to test against an alternative hypothesis. By starting with the assumption that there is no effect, researchers can objectively assess whether the data provide enough evidence to support the alternative hypothesis.
2. Eliminates Bias
By assuming no effect or no difference, the null hypothesis helps eliminate bias in research. Researchers approach their study without preconceived notions about the outcome, ensuring that the results are based on the data collected rather than personal beliefs or expectations.
3. Framework for Statistical Testing
The null hypothesis provides a structured framework for conducting statistical tests. It is essential for calculating p-values and test statistics, which determine whether the observed data are significantly different from what would be expected under the null hypothesis. This framework allows for a standardized approach to testing hypotheses across various fields of study.
4. Facilitates Decision Making
The null hypothesis facilitates decision-making in research by providing clear criteria for accepting or rejecting it. If the data provide sufficient evidence to reject the null hypothesis, researchers can conclude that there is a statistically significant effect or difference. This decision-making process is critical in advancing scientific knowledge and understanding.
5. Controls Type I and Type II Errors
The null hypothesis plays a crucial role in controlling Type I and Type II errors in hypothesis testing. A Type I error occurs when the null hypothesis is incorrectly rejected (a false positive), while a Type II error happens when the null hypothesis is incorrectly accepted (a false negative). By defining the null hypothesis, researchers can set significance levels (e.g., alpha level) to manage the risk of these errors.
When is the Null Hypothesis Rejected?
Rejecting the null hypothesis is a critical step in the process of hypothesis testing. The decision to reject the null hypothesis is based on statistical evidence derived from the data collected in a study. Below are the key factors that determine when the null hypothesis is rejected:
1. P-Value
The p-value is a measure of the probability that the observed data (or something more extreme) would occur if the null hypothesis were true. The null hypothesis is rejected if the p-value is less than or equal to the predetermined significance level (?).
- Significance Level (?): This is the threshold set by the researcher, commonly 0.05 (5%). If the p-value ? 0.05, the null hypothesis is rejected.
Example:
- If a p-value of 0.03 is obtained and the significance level is 0.05, the null hypothesis is rejected.
2. Test Statistic
The test statistic is a standardized value calculated from sample data during a hypothesis test. It measures the degree to which the sample data differ from the null hypothesis. The decision to reject the null hypothesis depends on whether the test statistic falls within the critical region.
- Critical Region: This is determined by the significance level and the distribution of the test statistic (e.g., Z-distribution, t-distribution).
Example:
- In a two-tailed test with ? = 0.05, the critical region for a Z-test might be Z < -1.96 or Z > 1.96. If the test statistic is 2.10, the null hypothesis is rejected.
3. Confidence Intervals
Confidence intervals provide a range of values that are likely to contain the population parameter. If the confidence interval does not include the value specified by the null hypothesis, the null hypothesis is rejected.
- Example:
- If a 95% confidence interval for the mean difference between two groups is (2.5, 5.0) and the null hypothesis states that the mean difference is 0, the null hypothesis is rejected.
4. Effect Size
Effect size measures the magnitude of the difference between groups or the strength of a relationship between variables. While not a direct criterion for rejecting the null hypothesis, a substantial effect size can support the decision to reject the null hypothesis when combined with a significant p-value.
Null Hypothesis vs. Alternative Hypothesis
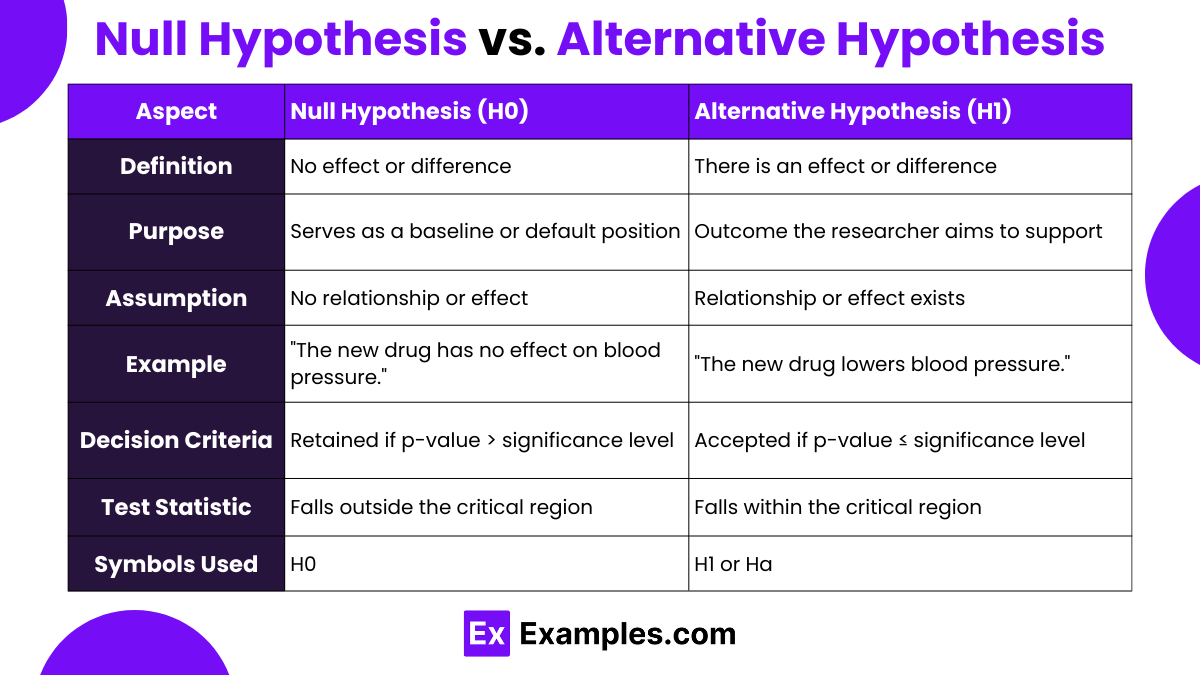
| Aspect | Null Hypothesis (H0) | Alternative Hypothesis (H1) |
|---|---|---|
| Definition | A statement that there is no effect or difference. | A statement that there is an effect or difference. |
| Purpose | Serves as a baseline or default position. | Represents the outcome the researcher aims to support. |
| Assumption | Assumes no relationship or effect. | Assumes a relationship or effect exists. |
| Example | “The new drug has no effect on blood pressure.” | “The new drug lowers blood pressure.” |
| Decision Criteria | Retained if the p-value is greater than the significance level (?). | Accepted if the p-value is less than or equal to the significance level (?). |
| Test Statistic | Falls outside the critical region, indicating no significant effect. | Falls within the critical region, indicating a significant effect. |
| Symbols Used | Denoted by H0. | Denoted by H1 or Ha. |
| Outcome of Interest | Focuses on the absence of a significant effect or relationship. | Focuses on the presence of a significant effect or relationship. |
| Type I Error | Incorrectly rejecting a true null hypothesis (false positive). | N/A |
| Type II Error | N/A | Incorrectly accepting a false null hypothesis (false negative). |
How to Write a Null Hypothesis
Writing a null hypothesis is a crucial step in designing a scientific study or experiment. The null hypothesis (H0) serves as a starting point for statistical testing and represents a statement of no effect or no difference. Here’s a step-by-step guide on how to write a null hypothesis:
1. Identify the Research Question
Start by clearly defining the research question you want to investigate. Understand what you are testing and what you expect to find.
- Example Research Question: Does a new medication reduce blood pressure more effectively than an existing medication?
2. Determine the Variables
Identify the independent and dependent variables in your study.
- Independent Variable: The variable that is manipulated or categorized (e.g., type of medication).
- Dependent Variable: The variable that is measured or observed (e.g., blood pressure).
3. State the Null Hypothesis Clearly
The null hypothesis should assert that there is no effect, no difference, or no relationship between the variables. It is usually written as a statement of equality or no change.
- Format: “There is no [effect/difference/relationship] in [dependent variable] between [independent variable groups].”
- Example: “There is no difference in blood pressure reduction between the new medication and the existing medication.”
4. Use Proper Symbols and Notation
In formal scientific writing, use symbols and proper notation to represent the null hypothesis.
- Example: H0: ?1 = ?2
- Here, ?1 represents the mean blood pressure reduction for the new medication, and ?2 represents the mean blood pressure reduction for the existing medication.
Why is the null hypothesis important?
The null hypothesis is crucial as it provides a baseline for comparison and allows researchers to test the significance of their findings.
How do you state a null hypothesis?
A null hypothesis is stated as no effect or no difference, typically in the form “There is no [effect/difference] between [groups/variables].”
What is the alternative hypothesis?
The alternative hypothesis (H1) suggests that there is an effect or difference between variables, opposing the null hypothesis.
What does it mean to reject the null hypothesis?
Rejecting the null hypothesis means the data provides sufficient evidence to support the alternative hypothesis, indicating a significant effect or difference.
What is a p-value?
A p-value measures the probability that the observed data would occur if the null hypothesis were true. Low p-values indicate strong evidence against the null hypothesis.
What is a Type I error?
A Type I error occurs when the null hypothesis is incorrectly rejected, meaning a false positive result is concluded.
What is a Type II error?
A Type II error happens when the null hypothesis is incorrectly accepted, meaning a false negative result is concluded.
How do you choose a significance level (?)?
The significance level, often set at 0.05, is chosen based on the acceptable risk of making a Type I error in the context of the study.
Can the null hypothesis be proven true?
No, the null hypothesis can only be rejected or not rejected. Failing to reject it does not prove it true, only that there is not enough evidence against it.
What is the role of sample size in hypothesis testing?
Larger sample sizes increase the test’s power, reducing the risk of Type II errors and making it easier to detect a true effect.
Share :
