Scientific investigation for the ACT Exam is a systematic approach to understanding the natural world through observation, experimentation, and analysis. This methodical process involves formulating hypotheses, designing experiments, collecting and analyzing data, and drawing conclusions. It is a cornerstone of scientific research and is essential for making discoveries, testing theories, and validating scientific knowledge. For the ACT Exam, understanding scientific investigation is crucial as it forms the basis of the science section, which assesses your ability to interpret, analyze, evaluate, and reason scientifically.
Learning Objectives
By the end of this study, you will be able to understand and apply the scientific investigation process, including identifying variables, designing experiments, analyzing data, and drawing conclusions, thereby enhancing their ability to think critically and solve problems using scientific methods.
The Scientific Method

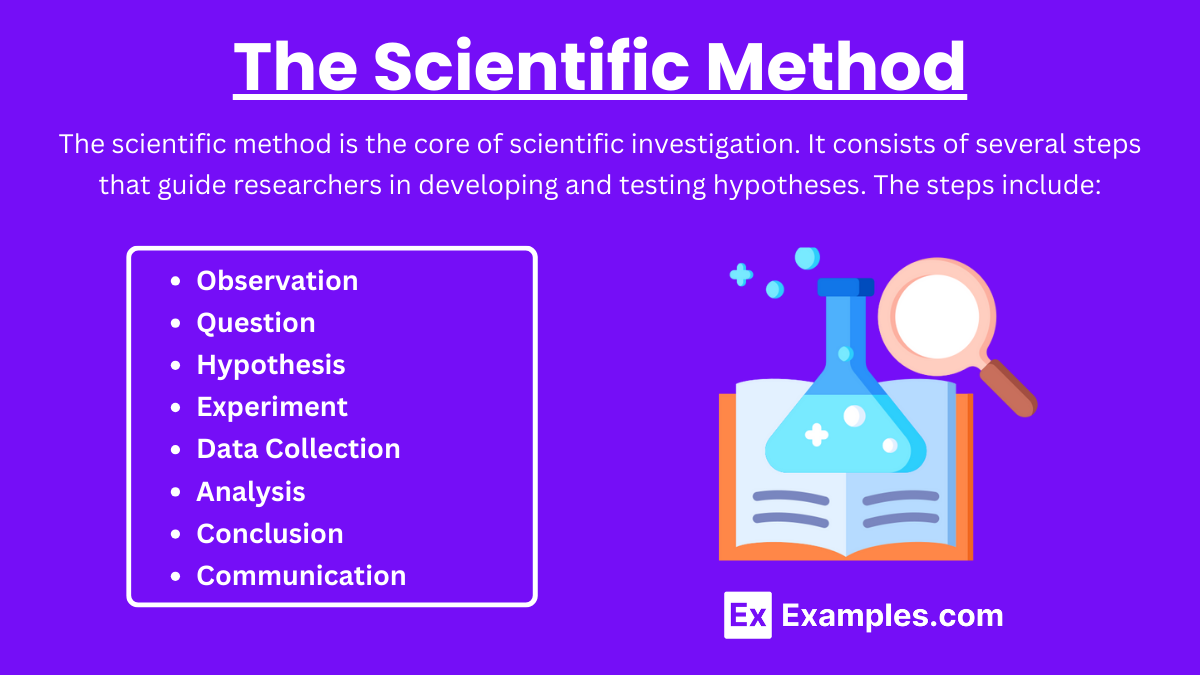
The scientific method is the core of scientific investigation. It consists of several steps that guide researchers in developing and testing hypotheses. The steps include:
- Observation: The process begins with careful observation of phenomena. This involves noting details and patterns that can spark questions and lead to further inquiry.
- Question: Based on observations, a clear and concise question is formulated. This question should be specific and measurable.
- Hypothesis: A hypothesis is a testable prediction that provides a possible answer to the question. It should be based on existing knowledge and logical reasoning.
- Experiment: Experiments are designed to test the hypothesis. This involves identifying variables, creating controls, and establishing procedures to ensure reliable results.
- Data Collection: During the experiment, data is meticulously collected and recorded. This data can be quantitative (numerical) or qualitative (descriptive).
- Analysis: The collected data is analyzed to determine if it supports or refutes the hypothesis. This may involve statistical analysis, graphing, and comparing results to expected outcomes.
- Conclusion: Based on the analysis, a conclusion is drawn. This conclusion addresses whether the hypothesis was supported and discusses the implications of the findings.
- Communication: The results are communicated to the broader scientific community through reports, presentations, and publications. This allows others to replicate the study and build upon the findings.
Variables in Scientific Investigation
Variables are elements that can change or be changed in an experiment. They are crucial in the design and analysis of experiments.
- Independent Variable: The factor that is deliberately changed or manipulated by the researcher.
- Dependent Variable: The factor that is measured or observed; it is affected by changes in the independent variable.
- Controlled Variables: Factors that are kept constant to ensure that the effect on the dependent variable is due to the independent variable alone.
Designing an Experiment
Designing an experiment involves several key considerations:
- Hypothesis Formulation: A good hypothesis is specific, testable, and based on prior knowledge or observation.
- Operational Definitions: Clearly defining how variables will be measured or manipulated.
- Control Group: A group that does not receive the experimental treatment, used as a baseline for comparison.
- Experimental Group: The group that receives the treatment or variable being tested.
- Randomization: Randomly assigning subjects to control and experimental groups to reduce bias.
- Replication: Repeating the experiment to ensure that results are consistent and reliable
Data Collection and Analysis

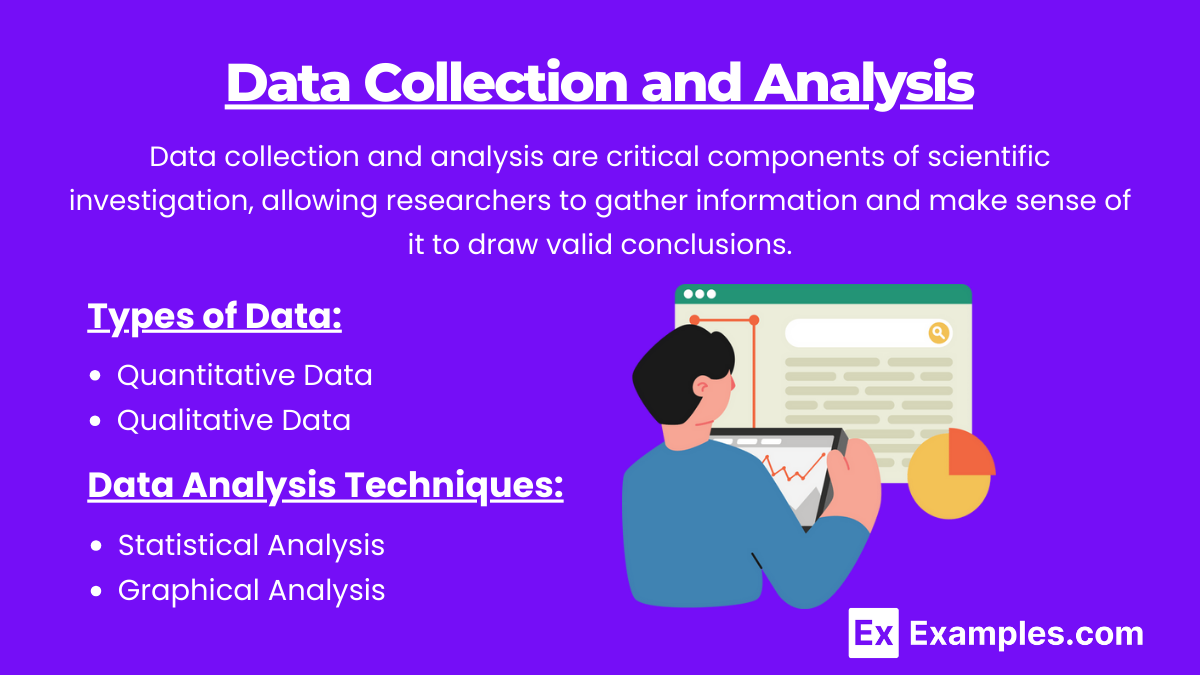
Data collection and analysis are critical components of scientific investigation, allowing researchers to gather information and make sense of it to draw valid conclusions. Data can be quantitative, involving numerical measurements, or qualitative, involving descriptive characteristics. Analyzing this data involves various techniques, such as statistical methods and graphical representations, to identify patterns, trends, and relationships that answer the research questions.
Types of Data
- Quantitative Data: Numerical data that can be measured and compared. Examples include measurements of height, weight, temperature, and time.
- Qualitative Data: Descriptive data that involves characteristics and qualities. Examples include observations of color, texture, and behavior.
Data Analysis Techniques
- Statistical Analysis: Using statistical methods to interpret data, including measures of central tendency (mean, median, mode) and variability (range, standard deviation).
- Graphical Analysis: Representing data visually using charts, graphs, and tables to identify patterns and trends.
Drawing Conclusions
Based on the data analysis, researchers draw conclusions about whether the hypothesis is supported or refuted. This involves:
Interpreting Results
Interpreting the results involves comparing the actual outcome to the expected outcome based on the hypothesis. It requires critical thinking to assess whether the data supports the hypothesis and to consider alternative explanations.
Reporting Findings
Communicating the findings is a key part of the scientific process. This includes writing detailed reports, creating presentations, and publishing results in scientific journals. Effective communication ensures that others can understand and build upon the work.
Ethical Considerations in Scientific Investigation
Integrity and Honesty
Researchers must maintain integrity and honesty in their work, reporting data accurately and without fabrication or falsification.
Respect for Subjects
When research involves human or animal subjects, ethical considerations include obtaining informed consent, ensuring confidentiality, and minimizing harm.
Examples of Scientific Investigation for ACT Exam
Example 1: Plant Growth and Water Types
- Observation: Some plants seem to grow better with rainwater than tap water.
- Question: Does the type of water affect plant growth?
- Hypothesis: If plants are watered with rainwater, then they will grow taller than those watered with tap water.
- Experiment: Divide plants into two groups. Water one group with rainwater and the other with tap water for four weeks.
- Data Collection: Measure the height of the plants in each group every week.
- Analysis: Compare the average height of plants in each group.
- Conclusion: Determine if rainwater significantly affects plant growth compared to tap water.
Example 2: Exercise and Heart Rate
- Observation: People seem to have different heart rates after the same exercise routine.
- Question: How does the intensity of exercise affect heart rate?
- Hypothesis: If exercise intensity increases, then heart rate will increase proportionally.
- Experiment: Have participants perform exercises at low, medium, and high intensity for 15 minutes each.
- Data Collection: Measure participants’ heart rates immediately after each exercise session.
- Analysis: Compare heart rates across different exercise intensities.
- Conclusion: Determine the relationship between exercise intensity and heart rate.
Example 3: Studying Techniques and Test Performance
- Observation: Different studying techniques might lead to varying test scores.
- Question: Does the method of studying affect test performance?
- Hypothesis: If students use active recall techniques, then their test scores will be higher than those who use passive reading techniques.
- Experiment: Assign students to two groups: one uses active recall, the other uses passive reading to study the same material.
- Data Collection: Administer a test on the material to both groups.
- Analysis: Compare the average test scores of the two groups.
- Conclusion: Determine if active recall techniques improve test performance compared to passive reading.
Example 4: Temperature and Chemical Reaction Rate
- Observation: Chemical reactions seem to happen faster at higher temperatures.
- Question: How does temperature affect the rate of a chemical reaction?
- Hypothesis: If the temperature increases, then the rate of the chemical reaction will increase.
- Experiment: Conduct the same chemical reaction at different temperatures (e.g., 20°C, 30°C, 40°C).
- Data Collection: Measure the time it takes for the reaction to complete at each temperature.
- Analysis: Compare the reaction rates at different temperatures.
- Conclusion: Determine the effect of temperature on the rate of the chemical reaction.
Example 5: Noise Levels and Concentration
- Observation: People seem to concentrate better in quieter environments.
- Question: Does noise level affect concentration?
- Hypothesis: If the noise level decreases, then concentration levels will improve.
- Experiment: Have participants complete concentration tasks in environments with varying noise levels (e.g., silent, moderate noise, loud noise).
- Data Collection: Measure task performance (accuracy and time taken) in each noise environment.
- Analysis: Compare performance across the different noise levels.
- Conclusion: Determine if there is a significant impact of noise level on concentration.
Practice Questions
Question 1
A researcher wants to test the effect of fertilizer on plant growth. She sets up three groups of plants: one receives no fertilizer, the second receives a low amount of fertilizer, and the third receives a high amount of fertilizer. What are the independent and dependent variables in this experiment?
A. Independent variable: Amount of fertilizer; Dependent variable: Plant growth
B. Independent variable: Plant growth; Dependent variable: Amount of fertilizer
C. Independent variable: Amount of water; Dependent variable: Plant height
D. Independent variable: Plant height; Dependent variable: Amount of water
Answer: A
Explanation: The independent variable is what the researcher changes (amount of fertilizer), and the dependent variable is what is measured (plant growth).
Question 2
In an experiment to test the effect of sleep on memory retention, participants are divided into three groups based on the amount of sleep they get: 4 hours, 6 hours, and 8 hours. They are then given a memory test the next day. What should be the controlled variables in this experiment?
A. Type of memory test, time of day test is given
B. Amount of sleep, type of memory test
C. Participants’ age, health, prior sleep habits
D. Type of memory test, participants’ age, and health
Answer: D
Explanation: Controlled variables should include factors like the type of memory test and participants’ age and health to ensure results are due to sleep duration.
Question 3
A scientist hypothesizes that a new drug will lower blood pressure more effectively than an existing drug. She conducts a double-blind study with two groups: one receiving the new drug and the other receiving the existing drug. What is the purpose of a double-blind study, and how does it improve the validity of the experiment?
A. Ensures neither participants nor researchers know who receives which treatment
B. Ensures researchers know but participants do not
C. Ensures participants know but researchers do not
D. Ensures both participants and researchers know who receives which treatment
Answer: A
Explanation: A double-blind study eliminates bias and ensures differences in outcomes are due to the drugs, improving experiment validity.


