
Most of the time, when we are dealing with large quantities of data, we no longer wanted to read long paragraphs of pure text; instead, we are seeking for a quick way to understand the presentation of the data. Typically, we want something that contains images or those that our brains can easily interpret and recall. This data presentation can be done in several ways, and the most common way is through flow chart. By using flow chart, the data can be more comprehensive, problems can easily be identified, and we can easily find bottlenecks when we are applying it in our organization. There are a lot of uses of flow charts, especially the process flow chart which can be used to indicate certain tasks and the process that constitutes the whole flow.
Want some examples for process flow charts? Check them out in the next section.
Application Process Flow Chart Example

Basic Process Flow Chart Example
Detailed Process Flow Chart Example
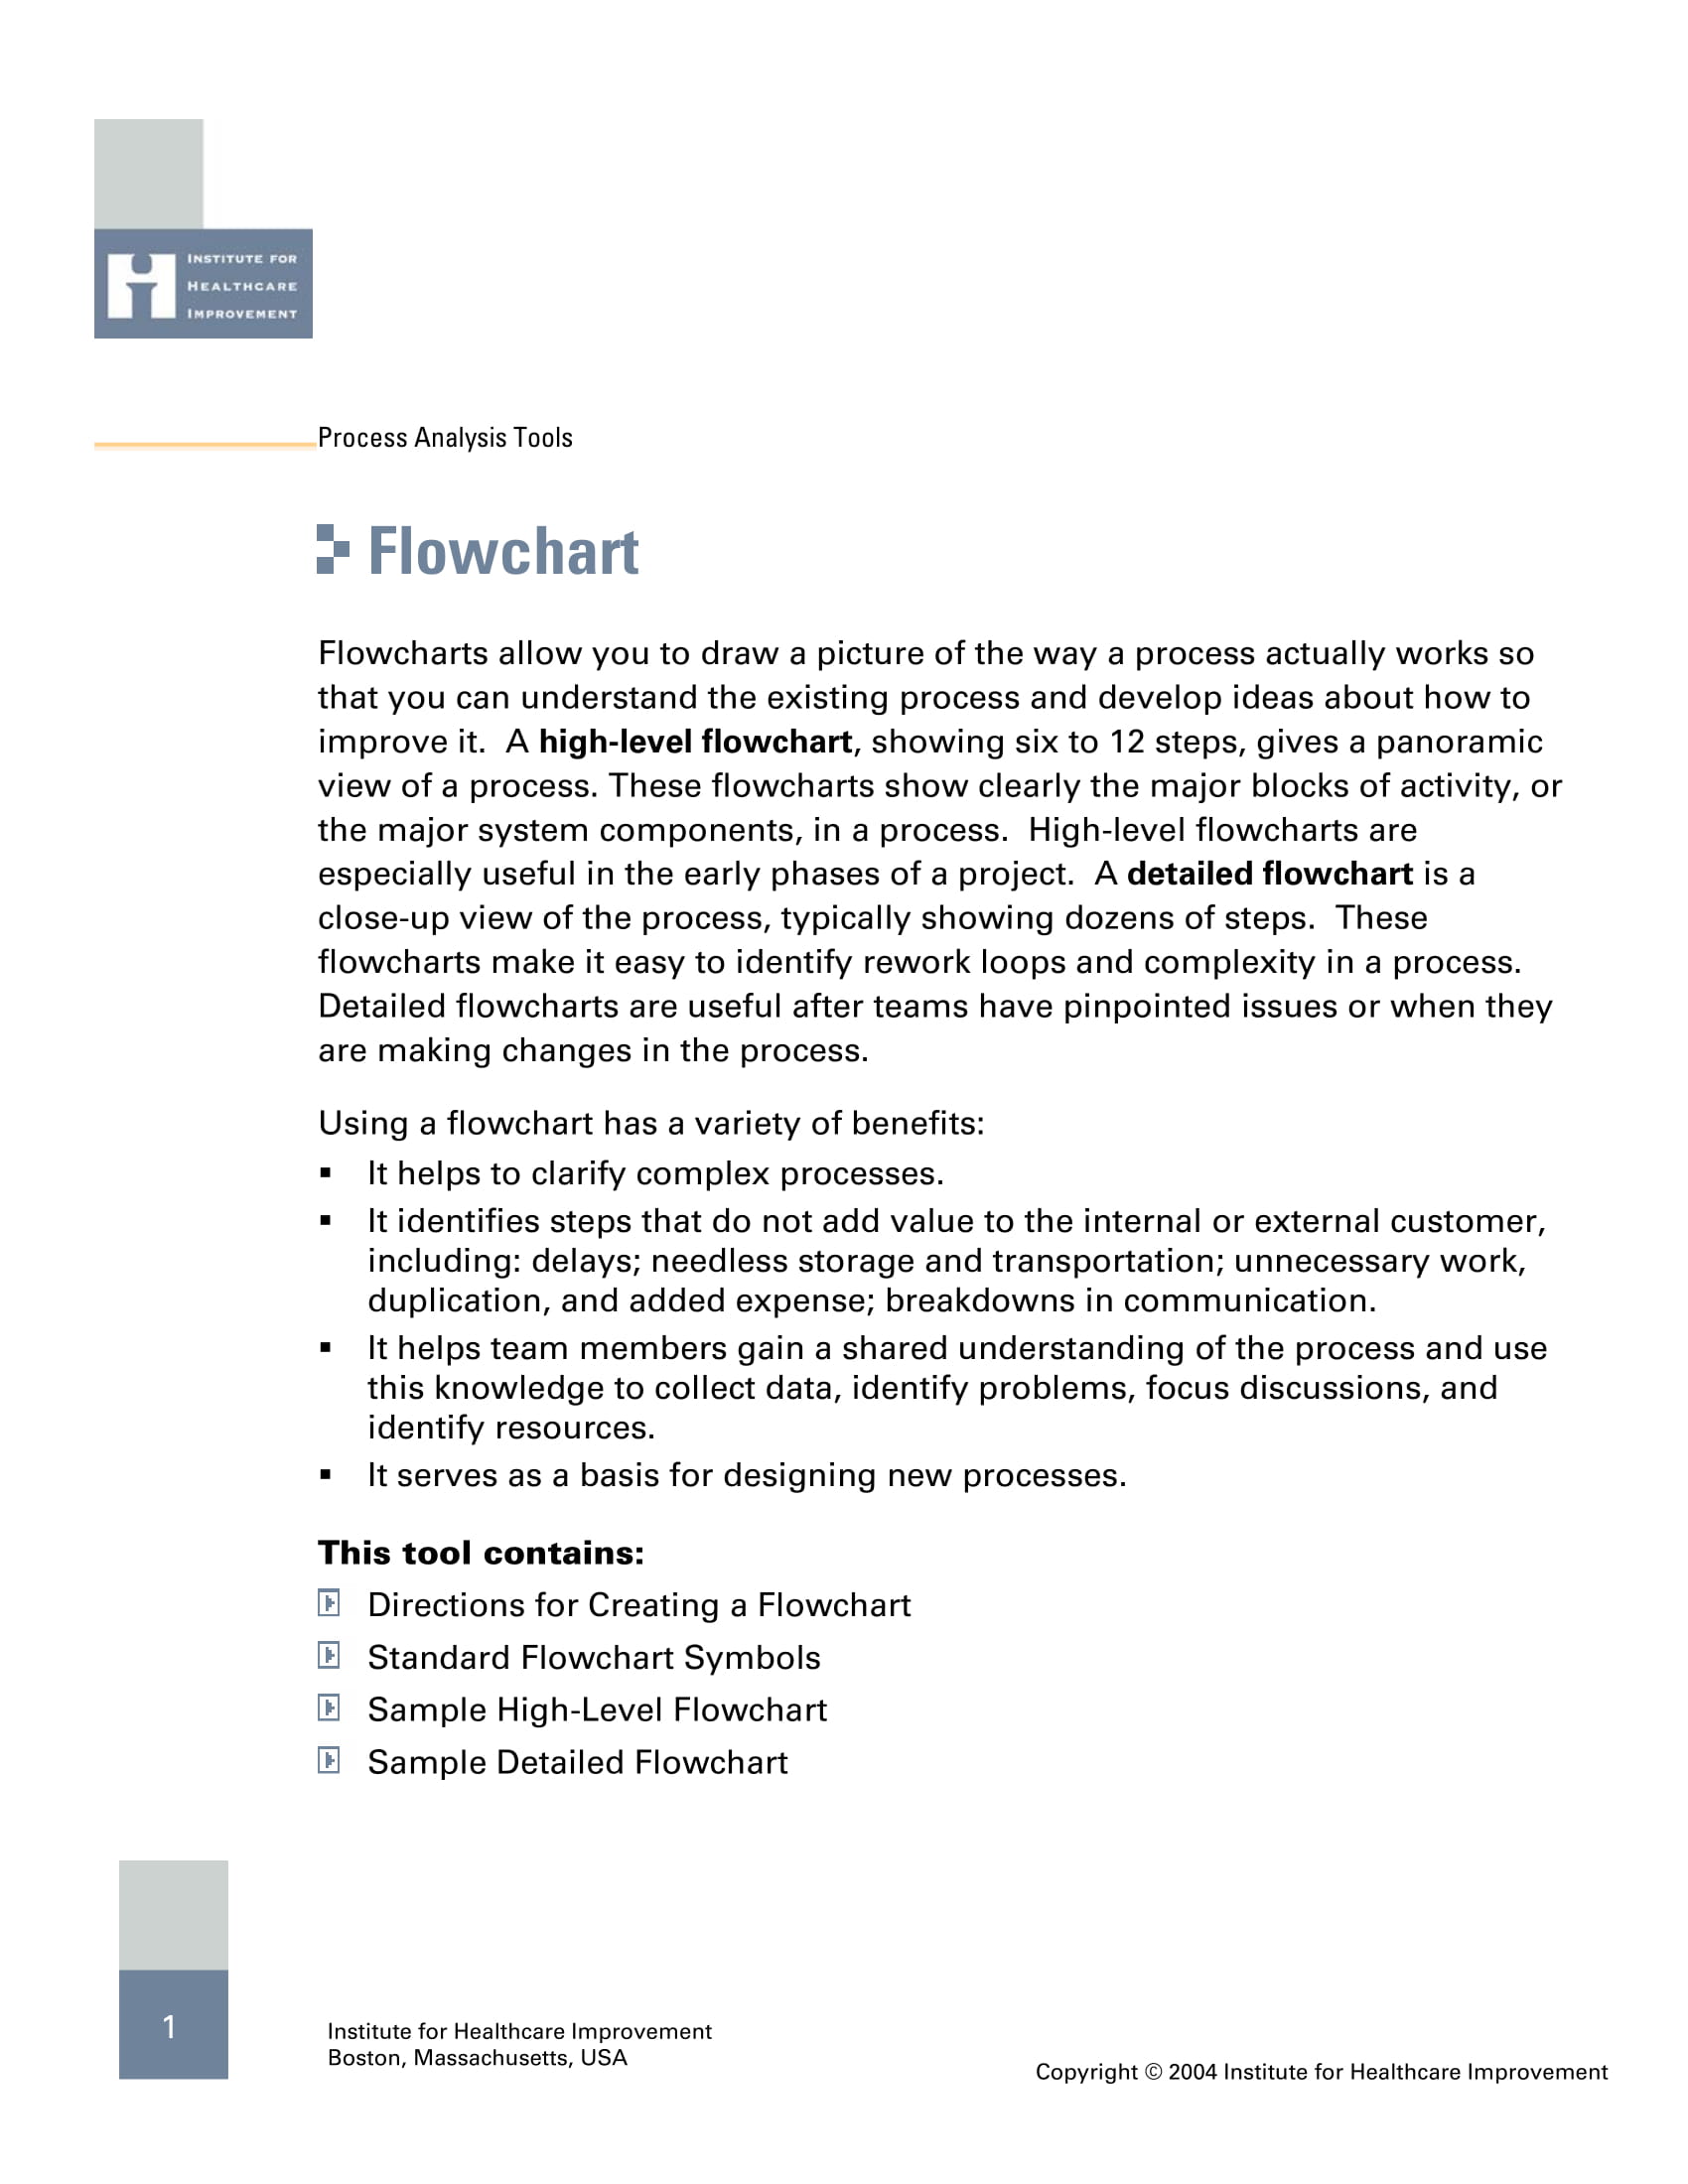
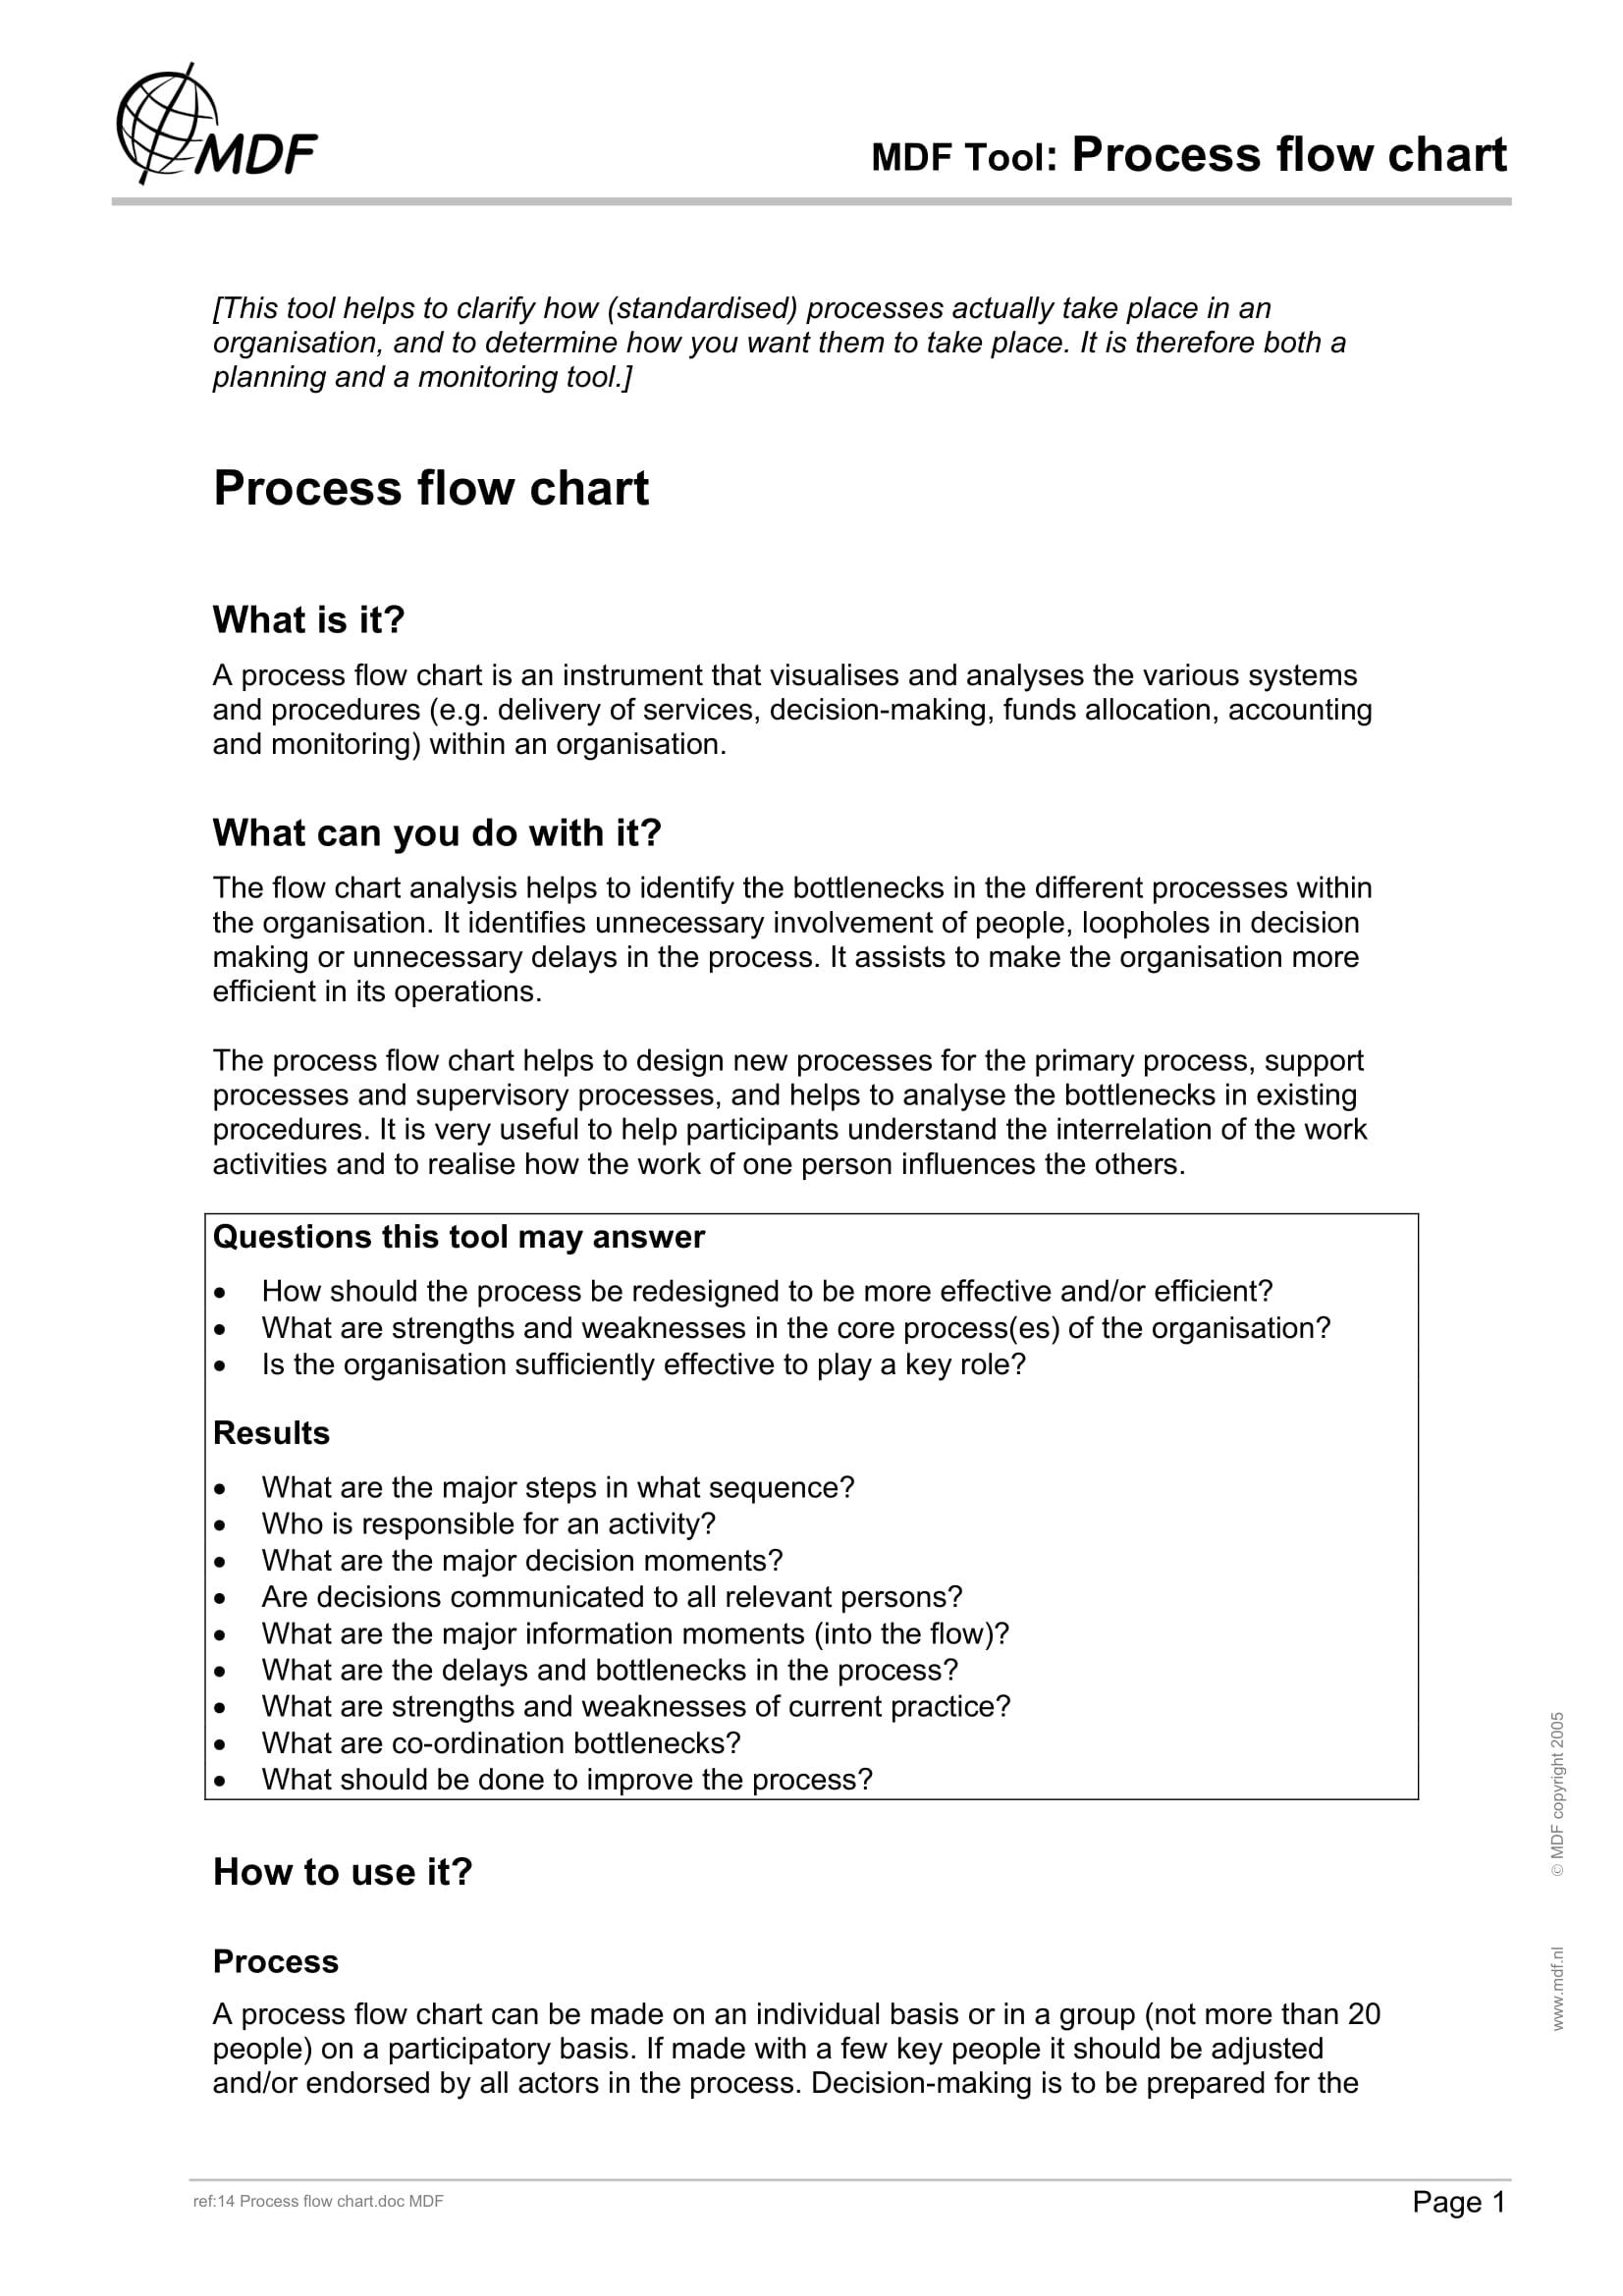
What Is a Process Flow Chart?
A process flow chart, also known as the system flow diagram, is a type of chart that includes a picture of steps of a process in a sequential order with elements that displays the sequence of actions, materials, or services, entering and leaving the process, the decisions that must be made, people who became involved in a process, or the time involved at each step or process.
The process included in a flow chart can be a manufacturing process, an administrative process, a service process, or a project plan. Hence, this tool can be used widely in a lot of circumstance, helping the user to manage the data into something that can easily be read and understood.
Uses of Flow Chart
As has been stated above, flow charts are very versatile as they serve a lot of functions and they can be tailored according to the needs of the user. Among the common uses of flow charts are as follows:
- to study a process that needs to be improved
- to inform or educate the reader on how is a certain process done
- to document a certain process
- to understand how a process is done
- to plan the steps to be taken in a project
- to have a better communication with the persons involved with the same process
There are a lot more uses of flow chart depending on the nature of task that the user is working on. Can you add more to the above list of uses?
How to Create an Organized Flow Chart
- On the top of your sheet, write the title of the process to be diagrammed. This is your main point, and the overall subject of your flow chart. You must see to it that everything you include in your flow chart is in connection with and would lead to your title.
- Then, you must decide on the boundaries of your process as well as the level of detail to be included in your diagram. You can ask the following questions to help you decide on this matter:
- Where or when does the process start?
- Where or when does the process end?
- Decide what activities you should include on your process. You need not create a sequence yet; just everything that you think will be involved in the process. Make sure that it is complete and you did not forget anything. However, some people may prefer to write the activities in sequence as it helps them remember all the necessary steps in the process.
- Next, after gathering all the necessary steps in your process, you now need to arrange the activities in proper sequence.
- When all the activities have already been included in the outline of your process, draw the proper flow chart symbols that correspond to the task of each item in the process. The different flow chart symbols are presented below.
- After all has drawn and properly put into place, review the flow chart with others who are involved in the process such as the workers, supervisors, suppliers, and customers to see if they agree to the correctness of the process.
Documentation Process Flow Chart Example

Procedure and Process Flow Chart Example
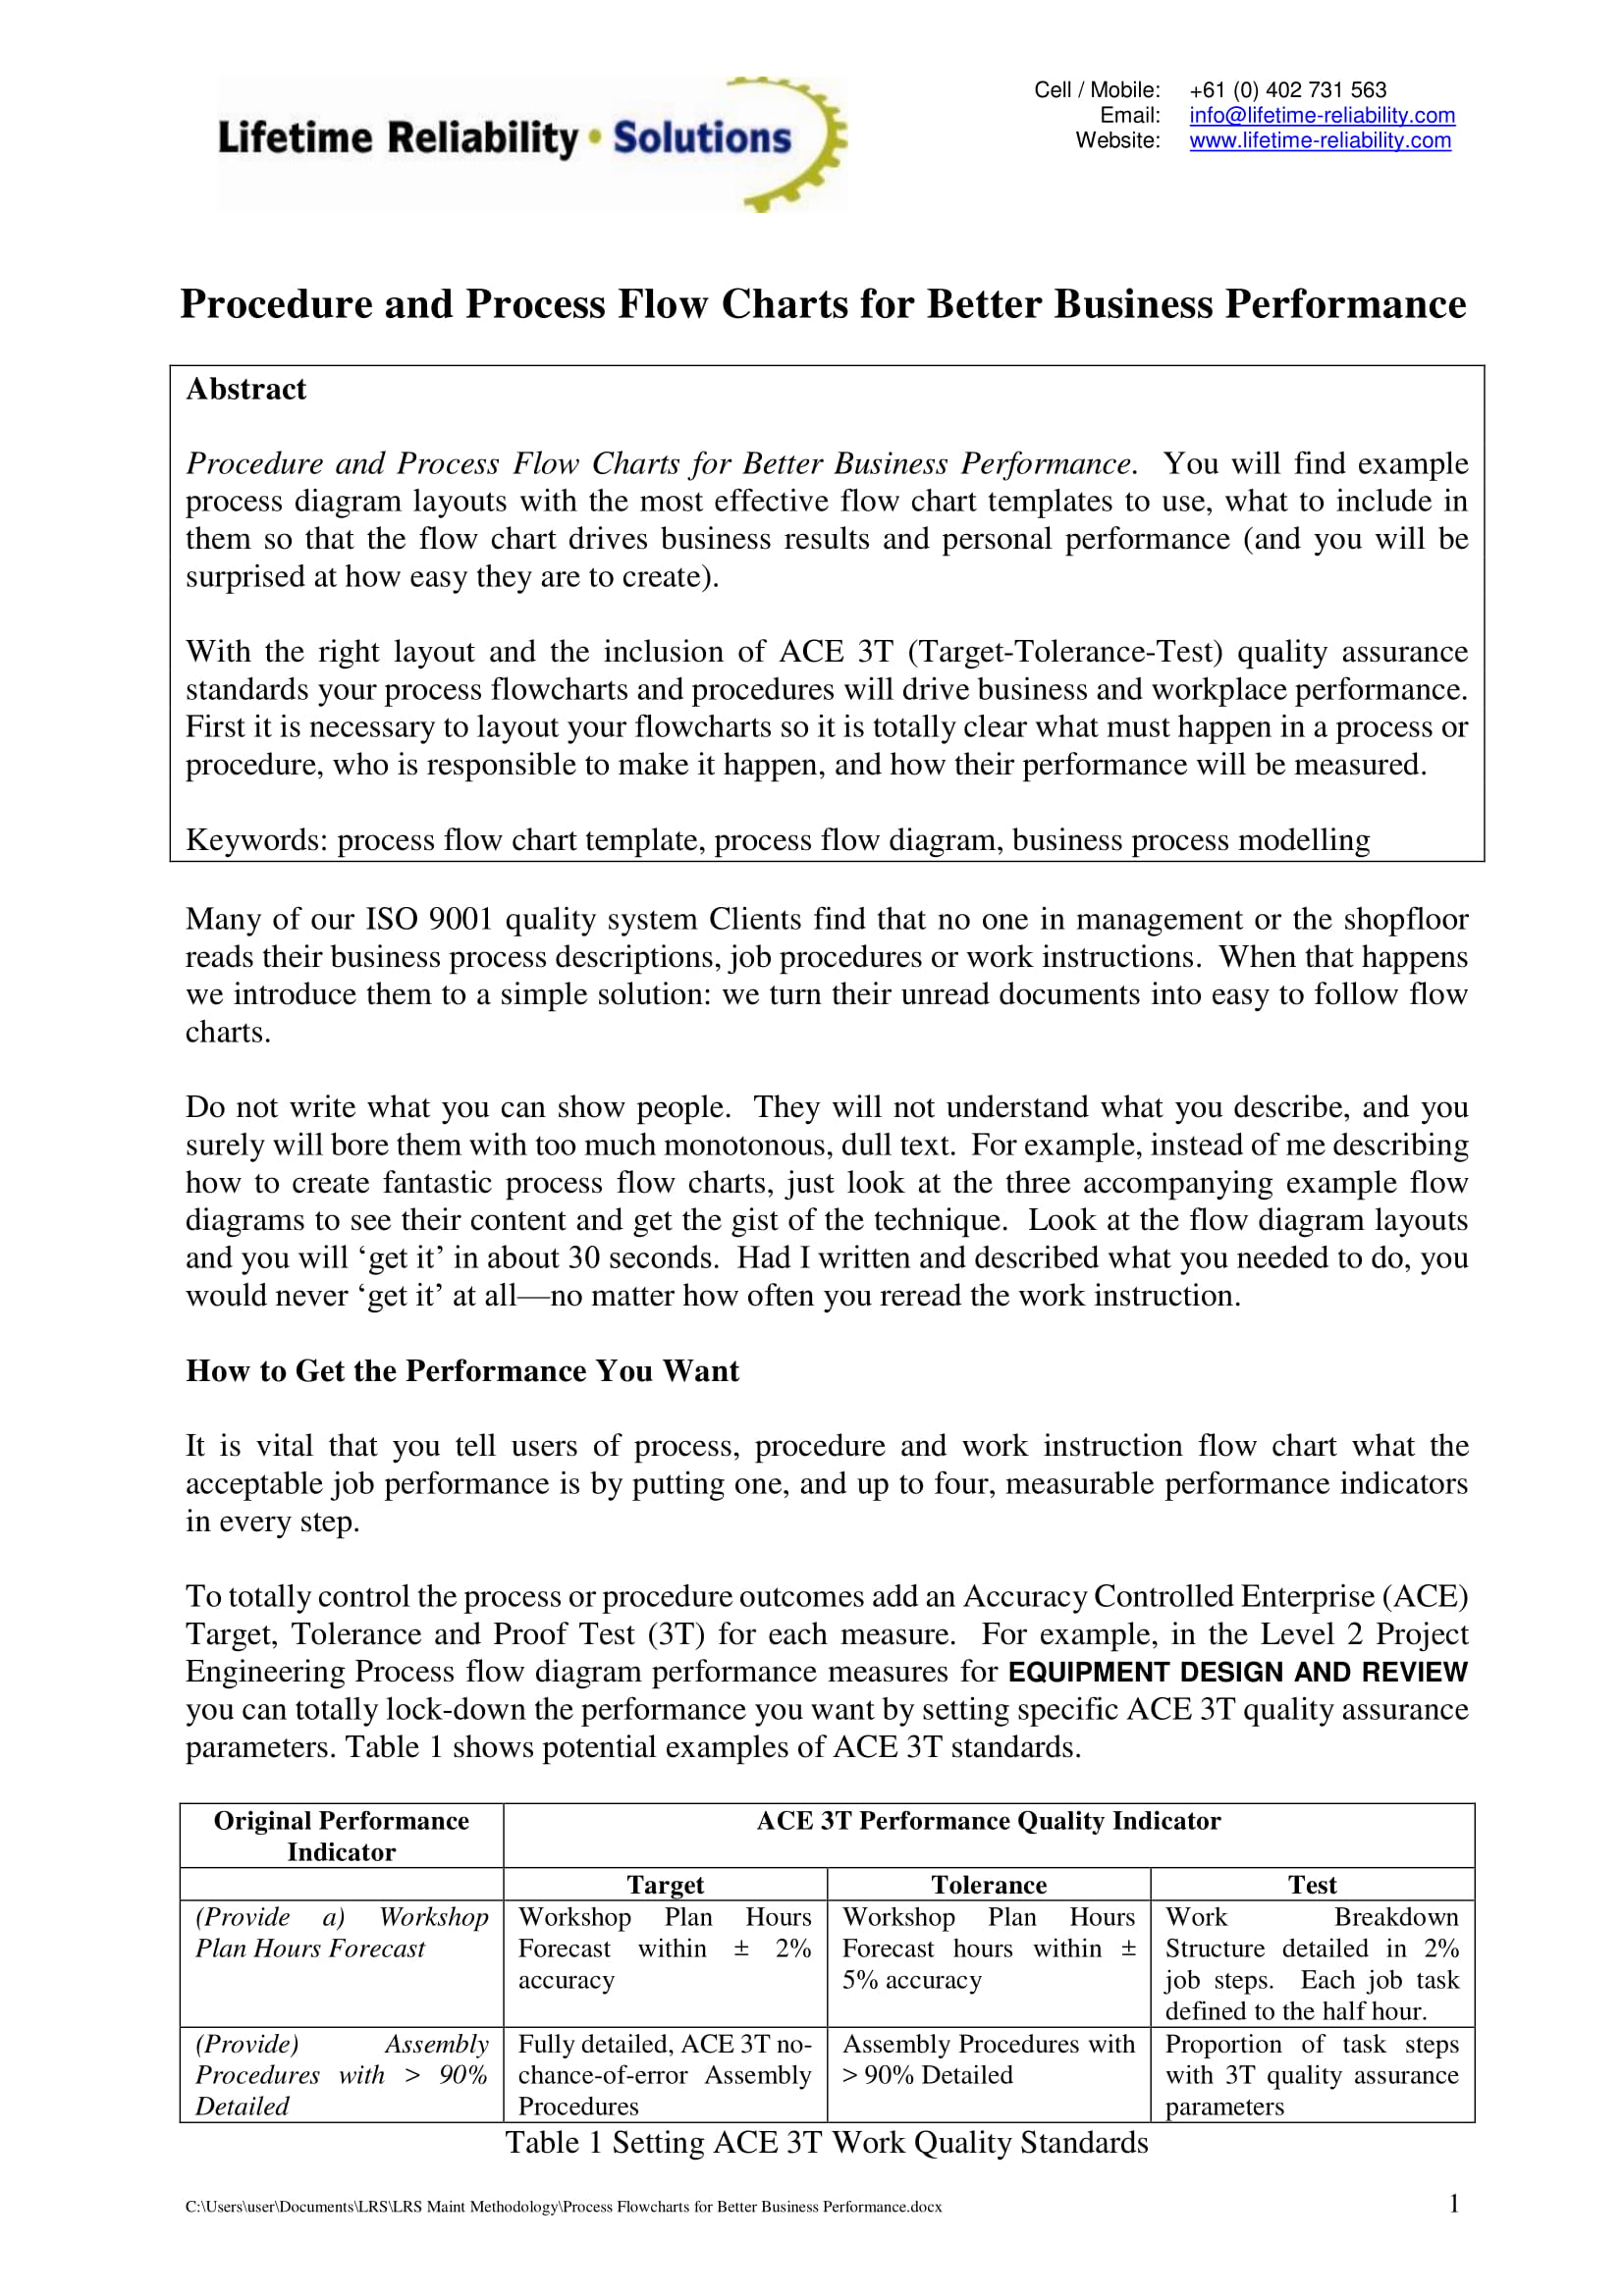
Process Flow Chart Discussion and Example
Common Flow Chart Symbols
In a flow chart, you can see that it usually uses certain shapes that represent the different tasks or actions or steps in the process. Also called flow chart shapes, flow diagram symbols, or mapping symbols, these symbols entail different meanings when used in a flow chart. The most common flow chart symbols are as follows:
- Process symbol (square or rectangle) – this is also known as an action symbol as this shape represents an action, a process, or a function. It is the most widely used symbol in flow charting. The text inside the square or rectangle usually includes a verb.
- Start or end symbol (oval) – this is also known as the terminator symbol as this shape represents the start points, end points, and potential outcomes of a path. Ideally, the word start, begin, and end is placed inside the terminator symbol to make things more obvious.
- Document symbol (rectangle with a wavelike base) – this symbol represents the input or output of a document. Examples of input are receiving a report, email, or order while examples of output are generating a presentation, memo, or letter.
- Decision or conditional symbol (diamond) – this symbol indicates a question that is usually answerable by yes or no, or true or false. The answer to the question determines the arrows coming out of the diamond. This shape is quite unique with two arrows coming out of it, splitting into different branches depending on the answer or consequences thereafter. The arrows should be always labelled, for example, by yes or no, to avoid confusion in the process flow.
- Connector symbol (circle) – this symbol connects separate elements across one page and is usually used in complicated flow charts.
- Off-page connector or link symbol (pentagon with one parallel side) – this flow chart symbol connects separate elements across multiple pages with the page number usually placed within the shape. This is commonly used in complicated flow charts.
- Input/output symbol (parallelogram) – this symbol is also referred to as the data symbol as it represents data that is available for input or output as well as representing resources used or generated. This is closely similar to paper tape symbol which also represents input/output, but the latter is already outdated and no longer used for flow chart diagramming.
- Comment or note symbol (braces or curly brackets) – this symbol adds further explanation, notes, or comments within the specified range. It is typically connected by a dashed line to the section that it is explaining.
Other Flow Chart Symbols
- Database symbol (cylinder) – this represents the data housed on a storage service that will likely allow for searching and filtering by users of the flow chart.
- Paper tape symbol (waved flag) – as stated above, this is an outdated symbol that is now rarely used in process flows and flow chart diagramming. However, this could be used whenever you are mapping out processes or input methods on much older computers.
- Summing junction symbol (circle with an X symbol inside) – this sums the input of the converging paths.
- Predefined process symbol (rectangle with additional line on the left and right line inside the rectangle) – this indicates a complicated process that is well-known.
- Internal storage symbol (rectangle with additional lines on the left and upper side of the rectangle) – this indicates data that is stored within internal memory and is commonly used to map out software designs.
- Manual input symbol (four-sided shape similar to a rectangle but with an uneven top) – this symbol represents the manual input of data into a field or step in a process, for example, the step in a login process where a user is manually entering the data.
- Manual operation symbol (trapezoid with top longer than the base) – this shape indicates that a step that must be done manually and not automatically.
- Merge symbol (inverted triangle) – this shape represents the combination of multiple paths to become one.
- Multiple documents symbol (piled rectangle with a wavelike base) – this represents multiple documents.
- Preparation symbol (hexagon) – this symbol helps introduce the setup to another step within the same process and differentiates between the steps that is a preparation for work and steps that do work.
- Stored data symbol (cylinder with a semi-open top) – this is also known as data storage symbol and represents where the data gets stored within a process or flow.
- Delay symbol (half oval) – this represents a segment of delay in a process, indicating the exact length of delay within the shape.
- “Or” symbol (circle with a plus sign inside) – this symbol indicates that the process flow continues two or more paths.
- Display symbol (closely similar to off-page connector or link symbol but in a horizontal manner) – this shape indicates where information will get displayed within a process flow.
- Hard disk symbol (horizontal cylinder) – also known as direct access storage, this shape indicates where data is stored within a hard drive.
Process Transactional Flow Chart Example
Research Process Flow Chart Example

Simple Process Flow Chart Example
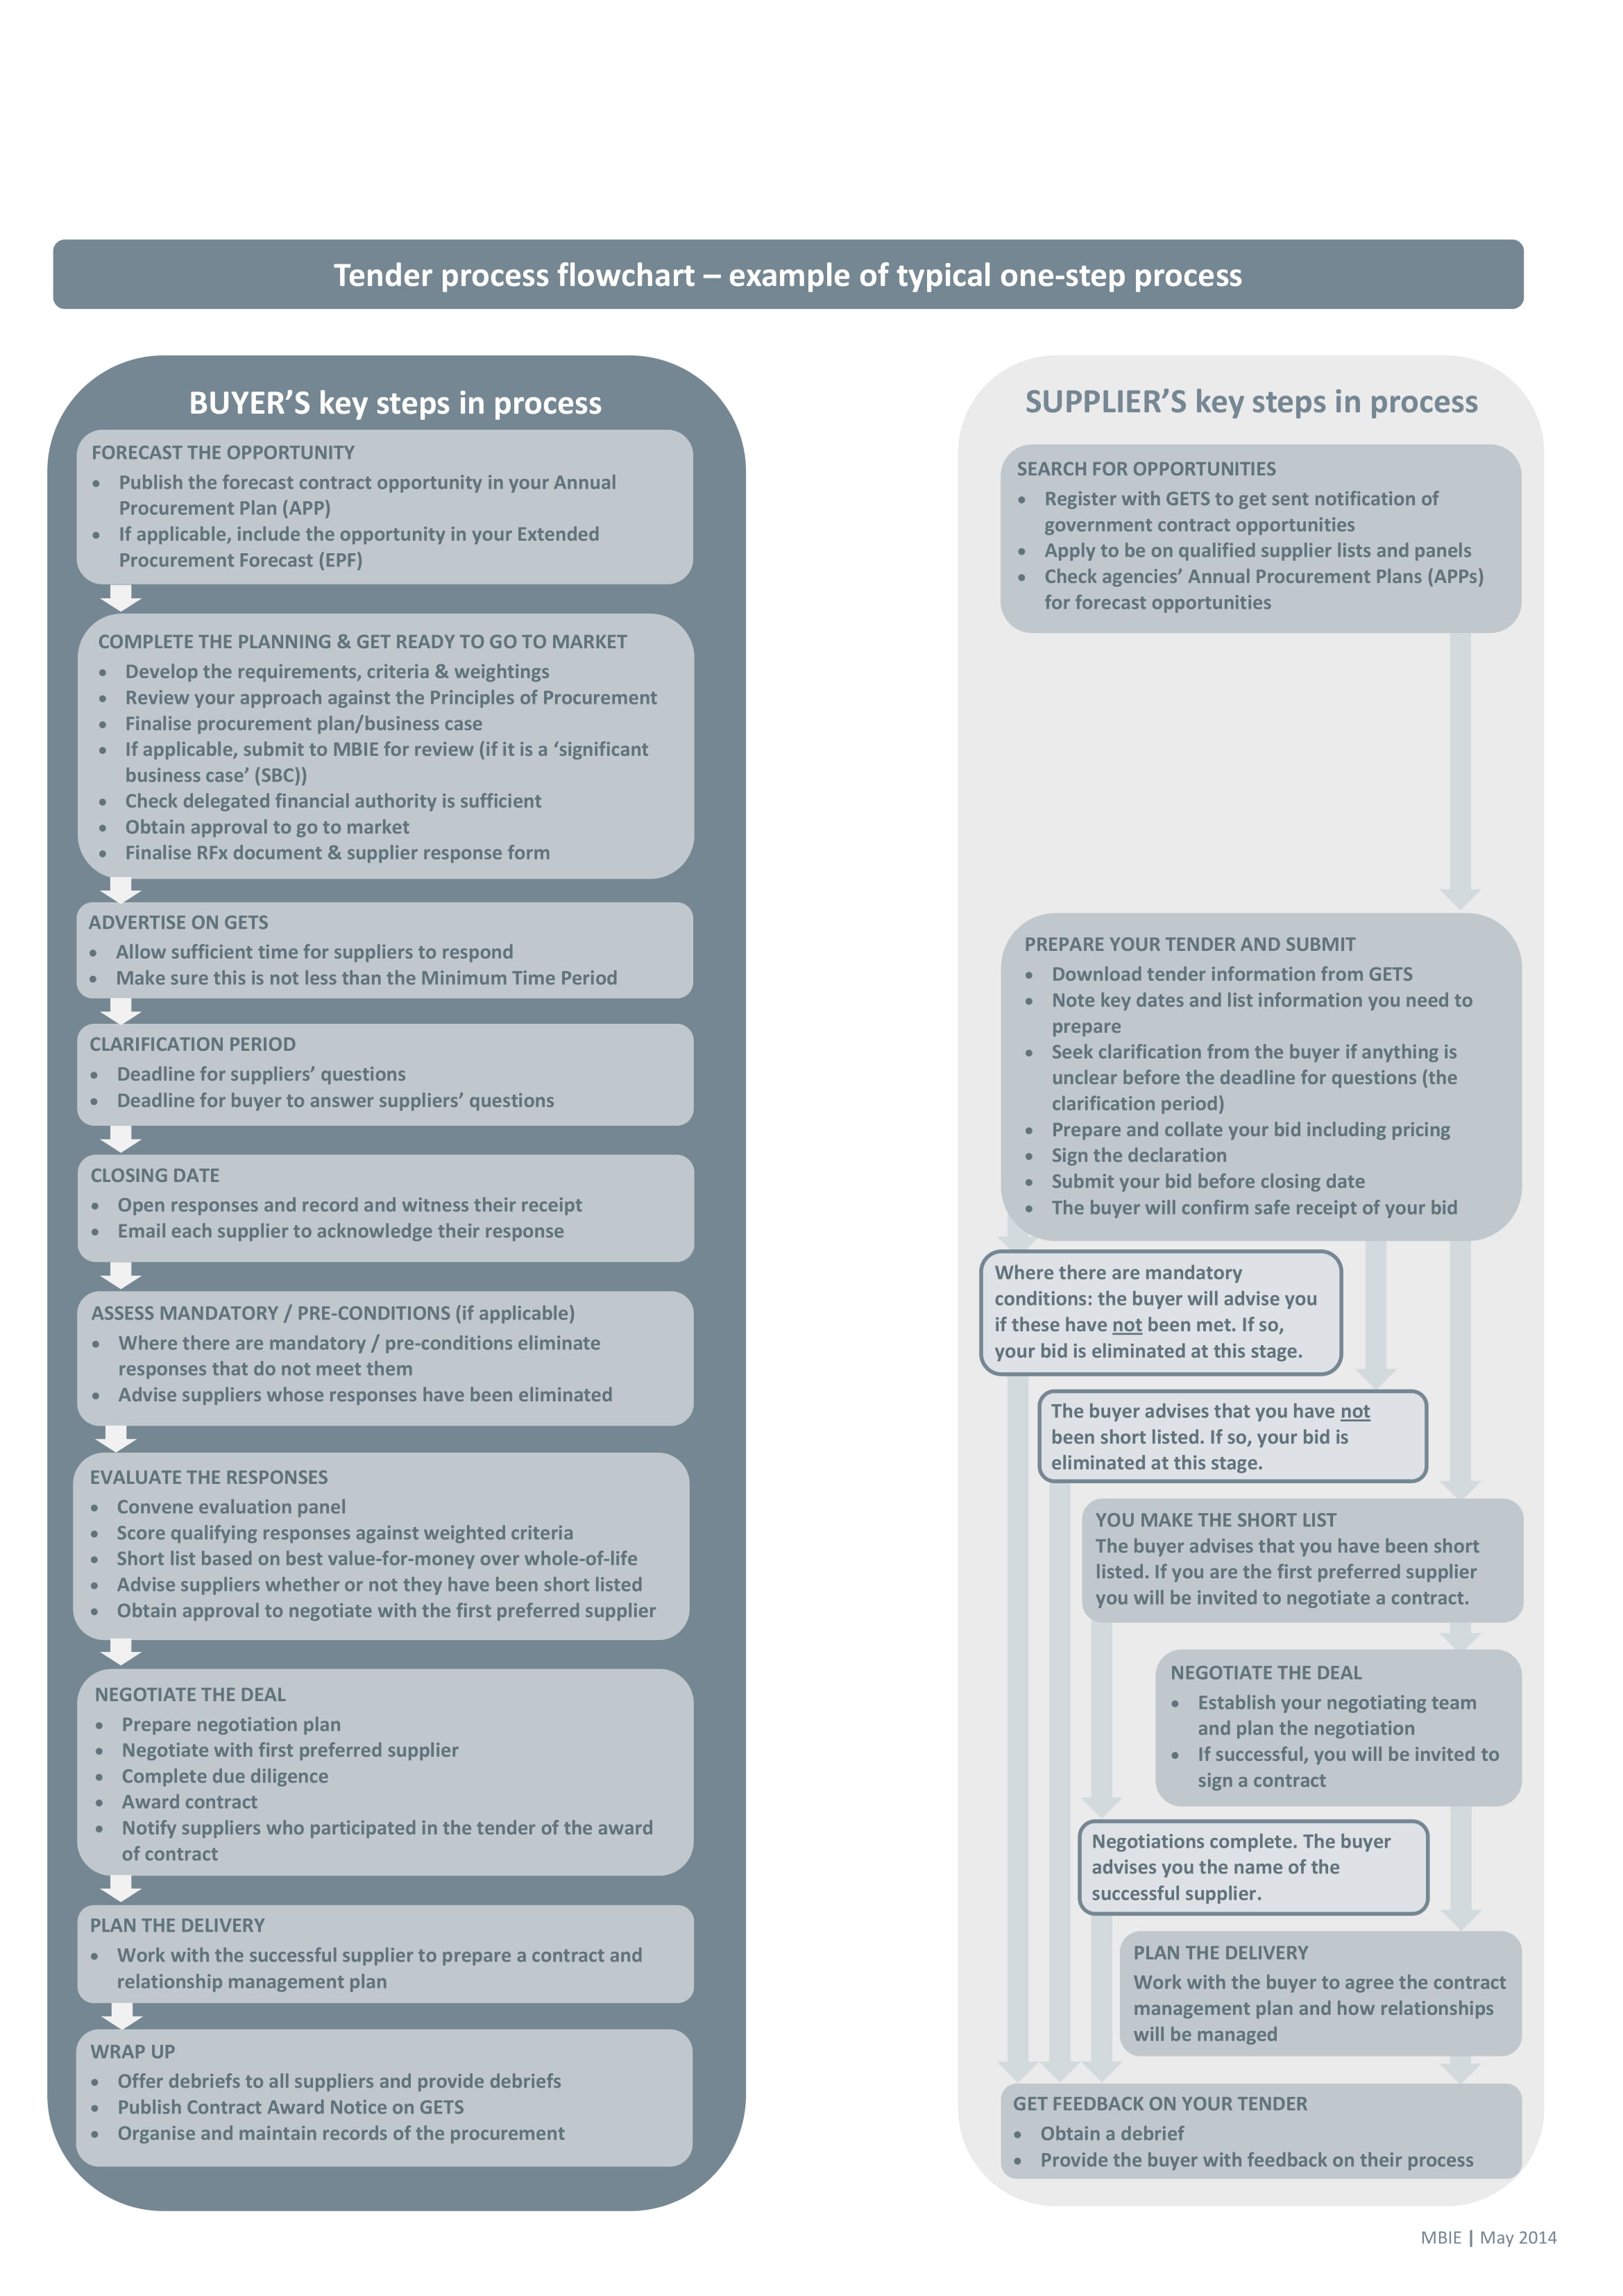
Tender Process Flow Chart Example
Advantages and Disadvantages of Flow Chart
Advantages
- Flow charts are a better way of communicating and presenting the logic of a system to all concerned readers, providing them easy-to-read information.
- With the help of flow chart, a problem can be analyzed in a more effective way as data can be easily understood when presented in a flow chart.
- Program flow charts serve as a good program documentation as they are easier to save and they do not consume a lot of space.
- Flow charts act as a guide during the systems analysis and program development phase, turning a complex process into something comprehensible and attainable.
- Flow charts help in debugging process, the process of identifying and removing errors and bottlenecks.
- The maintenance of operating program becomes easy with the help of flow chart because flow chart helps in quickly identifying tasks still needed to do and tasks that are already completed.
Disadvantages
- At times, when the program logic is quite complicated, the flow chart becomes complex and complicated as well.
- If alterations are required, a complete redrawing of the flow chart may be necessary.
- Reproduction of flow chart becomes a problem as the flow chart symbols cannot be typed.
- The essentials of what is done can easily be lost in the technical details of how it is done.
Last Words
Process flow chart is important especially in breaking down complex ideas and data into comprehensible information. It can present the information or a process in the most systematic and organized way which can be easily understood by the users. It contains different shapes indicating different actions needed in a process.
Whenever you need to create your own process flow chart, you can always refer to this article especially the examples presented above.