Power BI Dashboard is a powerful business analytics tool by Microsoft that provides interactive visualizations and business intelligence capabilities with an interface simple enough for end users to create their own reports and dashboards. This dashboard allows users to visualize data from multiple sources, enabling informed decision-making and insights. By integrating various data sources, Power BI Dashboard offers real-time analytics, customizable visualizations, and seamless sharing options, making it an essential tool for businesses looking to enhance their data-driven strategies.
What is a Power BI Dashboard?
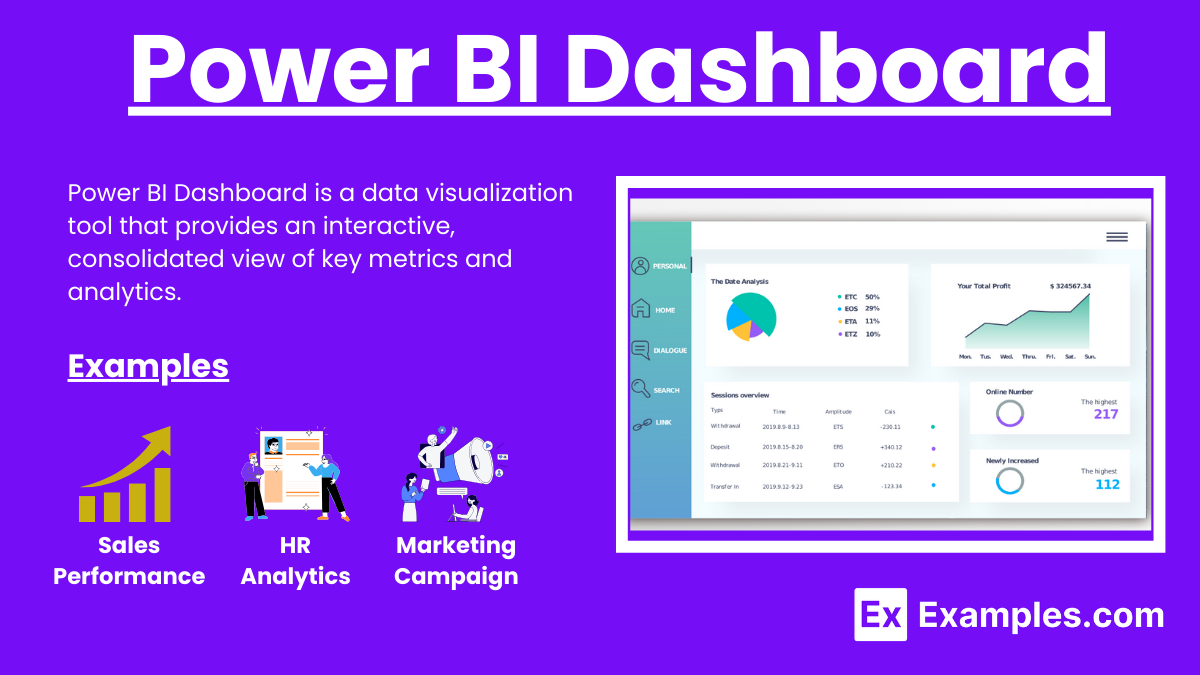
A Power BI Dashboard is an interactive data visualization tool by Microsoft that consolidates data from multiple sources into a single, easily interpretable interface. It allows users to create and customize visual reports without needing advanced technical skills. These dashboards provide real-time insights and support decision-making processes, making complex data accessible to all levels of an organization.
Power BI Dashboards Examples
- Sales Performance Dashboard: Visualizes sales data to track targets, revenue, and performance.
- HR Analytics Dashboard: Analyzes employee data, turnover rates, and recruitment metrics.
- Marketing Campaign Dashboard: Measures campaign effectiveness, ROI, and customer engagement.
- Financial Overview Dashboard: Monitors financial health with profit and loss statements, cash flow, and balance sheets.
- Customer Satisfaction Dashboard: Tracks customer feedback, satisfaction scores, and service metrics.
- Project Management Dashboard: Oversees project timelines, resource allocation, and progress.
- IT Operations Dashboard: Monitors IT infrastructure performance, system uptime, and incident reports.
- Healthcare Analytics Dashboard: Analyzes patient data, treatment outcomes, and healthcare services.
- Retail Performance Dashboard: Tracks inventory levels, sales trends, and store performance.
- Supply Chain Dashboard: Monitors supply chain efficiency, logistics, and delivery times.
- Education Analytics Dashboard: Analyzes student performance, attendance, and academic progress.
- Manufacturing Operations Dashboard: Tracks production metrics, quality control, and equipment efficiency.
- Real Estate Dashboard: Visualizes property listings, sales trends, and market analysis.
- E-commerce Dashboard: Monitors online sales, customer behavior, and website performance.
- Environmental Impact Dashboard: Analyzes sustainability metrics, carbon footprint, and resource usage.
- UI Design Feedback Dashboard: Collects and visualizes feedback on UI design elements and user experience.
- Bug-Tracking Dashboard: Integrates useful bug-tracking tools to monitor and resolve software issues.
Power BI sales dashboard examples
- Regional Sales Performance Dashboard: Visualizes sales data by region, showing revenue, target achievement, and market share. This helps identify high-performing regions and areas needing improvement.
- Product Sales Dashboard: Tracks sales figures for different products, highlighting best-sellers, inventory levels, and revenue contributions. This allows businesses to optimize inventory and marketing strategies.
- Sales Pipeline Dashboard: Displays the sales pipeline stages, from leads to closed deals, with conversion rates and sales cycle times. This provides insights into the efficiency of the sales process and potential bottlenecks.
- Sales Representative Performance Dashboard: Monitors individual sales rep performance, including number of deals closed, revenue generated, and target achievement. This helps in assessing and rewarding employee performance.
- Customer Segmentation Dashboard: Analyzes sales data by customer segments, identifying key customer groups, purchase patterns, and lifetime value. This enables targeted marketing and personalized customer engagement strategies.
Types of Power BI Dashboard
- Operational Dashboard – Displays real-time data to monitor day-to-day operations and performance metrics.
- Analytical Dashboard – Offers in-depth data analysis, trends, and insights for strategic decision-making.
- Strategic Dashboard – Focuses on high-level metrics, long-term goals, and organizational performance.
- Tactical Dashboard – Supports mid-level management in tracking and managing short-term operational goals and projects.
- Performance Dashboard – Highlights key performance indicators (KPIs) to measure and manage performance against targets.
- Financial Dashboard – Monitors financial data, budgets, and expenditures for financial health and performance.
- Marketing Dashboard – Analyzes marketing campaign performance, customer engagement, and ROI metrics.
- Sales Dashboard – Tracks sales data, forecasts, and pipeline management to drive sales strategy and performance.
- HR Dashboard – Monitors workforce metrics, recruitment, retention, and employee performance.
- IT Dashboard – Tracks IT infrastructure, system performance, and security metrics.
How to Create a Dashboard in Power BI?
- Sign in to Power BI: Open Power BI and sign in with your Microsoft account to access dashboard features.
- Connect to Data Sources: Import data from various sources like Excel, SQL databases, and online services.
- Prepare Data: Clean and transform data using Power BI’s data modeling tools for accurate analysis.
- Create Visualizations: Use charts, graphs, and maps to represent data insights visually on your dashboard.
- Arrange Visuals: Drag and drop visuals to organize the dashboard layout for clarity and impact.
- Apply Filters: Use filters and slicers to refine data views and enable interactive analysis.
- Publish Dashboard: Save and publish the dashboard to the Power BI service for sharing and collaboration.
- Share and Collaborate: Share the dashboard with team members, allowing real-time collaboration and decision-making.
Features of Power BI
- Interactive Visualizations: Create dynamic graphs and charts that allow users to drill down into data for deeper insights.
- Data Connectivity: Connect to a wide range of data sources including databases, cloud services, and Excel files.
- Real-Time Data: Monitor live data streams and update dashboards in real-time for up-to-date analysis.
- Customizable Dashboards: Design personalized dashboards with various visual elements to meet specific business needs.
- Data Modeling: Use Power BI’s data modeling tools to clean, transform, and prepare data for analysis.
- Natural Language Query: Ask questions in natural language and get answers in the form of visuals, making data exploration intuitive.
- Mobile Access: Access and interact with dashboards on mobile devices, ensuring data is available on-the-go.
- Collaboration Tools: Share dashboards and reports with team members, enabling collaboration and collective decision-making.
- Integration with Microsoft Products: Seamlessly integrates with other Microsoft products like Excel, Azure, and SharePoint.
- Security Features: Ensure data security with robust encryption, role-based access controls, and compliance with industry standards.
Advantages of a Power BI dashboard
- Enhanced Data Visualization: Power BI dashboards use interactive graphs and charts, making it easier to interpret complex data and uncover insights.
- Real-Time Data Monitoring: Dashboards provide real-time updates, ensuring you always have the most current data for decision-making.
- User-Friendly Interface: The intuitive design of Power BI allows users without advanced technical skills to create and customize their own dashboards.
- Seamless Integration: Power BI integrates with various data sources and Microsoft products, streamlining data management and analysis processes.
- Collaboration and Sharing: Easily share dashboards with team members, fostering collaboration and enabling data-driven decisions across the organization.
Power BI Dashboards vs Reports
| Aspect | Power BI Dashboards | Power BI Reports |
|---|---|---|
| Purpose | Provides an overview of key metrics and real-time data for quick insights. | Offers detailed and comprehensive data analysis and insights. |
| Interactivity | Highly interactive with real-time updates and dynamic visuals. | Interactive with drill-through capabilities but not necessarily real-time. |
| Data Sources | Combines multiple data sources into one view. | Typically focuses on detailed analysis from a single dataset or related datasets. |
| Customization | Allows for high customization with tiles, visuals, and layout adjustments. | Customizable, but mainly focuses on detailed data visualizations and structured layouts. |
| Use Case | Ideal for monitoring KPIs and business performance at a glance. | Best for in-depth analysis, detailed reporting, and historical data review. |
| Refresh Rate | Often set to refresh in real-time or at frequent intervals. | Usually refreshed based on a set schedule or on-demand. |
| User Experience | Designed for quick access to key metrics and summaries. | Designed for thorough analysis and detailed information presentation. |
| Sharing | Easily shared with interactive capabilities, often embedded in dashboards. | Can be shared, exported, or embedded in reports and presentations. |
Sign in to Power BI, connect to data sources, create visualizations, and arrange them on the dashboard.
They provide real-time insights, enhance data visualization, and support informed decision-making.
Yes, you can customize the layout, visuals, and data filters according to your needs.
Power BI can connect to a variety of data sources, including databases, cloud services, and Excel files.
Data can update in real-time or based on scheduled refresh intervals.
Yes, you can share dashboards with team members or external users for collaboration.
Common uses include tracking sales performance, financial analysis, and monitoring operational metrics.
Basic technical skills are helpful, but Power BI is designed to be user-friendly for non-technical users.
Power BI includes robust security features like data encryption and role-based access controls.
Yes, Power BI Dashboards can be accessed and interacted with on mobile devices.