Deviation and Variance in Finance Examples to Download

Deviation, in statistical language, means the difference between the value of numbers. It is a statistical tool that measures the difference between the value of the variable and other value, often relative to its mean. By pointing and focusing the variation between each data that is related to the mean it is calculated as the square root of the variance.
Variance, on the other hand, works to measure the spread between the numbers. It reads the distance of every number of the data from the mean. It is used to compare the relative performance of each asset.
5+ Deviation and Variance in Finance Examples in PDF
1. Impact of Financial Leverage on the Variance of Stock Returns
2. Variance Analysis of Financial Ratio and Industry Target Ratio
3. Good and Bad Variance Premier and Expected Returns
4. Cash Flow and Budgetary Variance Analysis in Financial Management
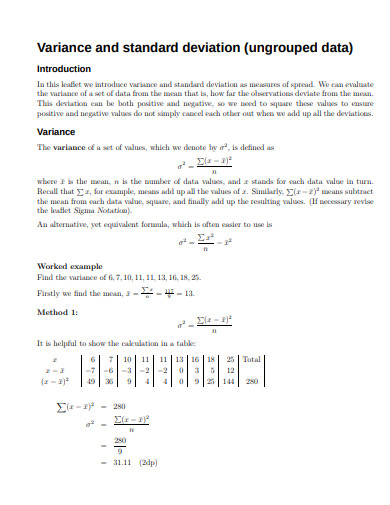
5. Variance and Standard Deviation Example
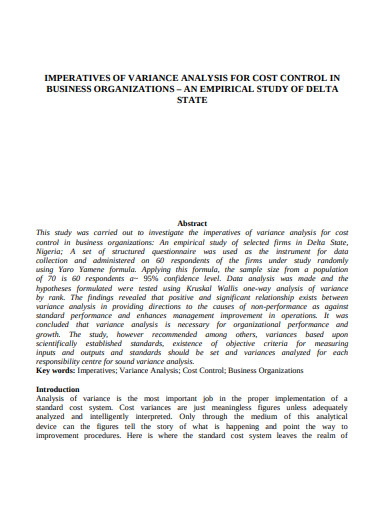
6. Imperatives of Variance Analysis for Cost Control in Business Organisation
What is the Formula of Standard Deviation and Standard variance?
Standard deviation and variance though belong to the mathematical and statistical field of study but these are also applied to the business and marketing sector. In accounting, economics, investment, etc the role of standard deviation and variance have been very fruitful and significant.
Standard Deviation
In business, standard deviation measures the finance and helps to calculate the rate of returns on an annual basis of the investments and highlights the investment historical volatility. The greater the SD of securities would be, the more variance would be between the price and the mean. The formula commonly followed to calculate the standard deviation is
The calculation process of standard deviation is done by calculating
- The value of the mean with the addition of all the data points and by dividing them by the total number of the data points.
- The variance of each data point with subtracting the data point value from the mean number. The outcomes are squared and summed and the result is again calculated by dividing them by the number of the data points.
- Finally, to calculate the standard deviation the square root of the variance is used.
Variance
In business and investment, the variance derived from the investment returns along with the assets is evaluated and analyzed as a way to achieve asset allocation. This equation is also used as a formula in business to compare the performance of several aspects and elements of the portfolio against the mean. The formula to calculate variance is
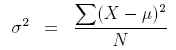
1. Variance is calculated by calculating the differences between every number in the set and the mean.
2. Then the differences need to be squared.
3. At last, the sum of squared data needs to be divided by the number of values.
How Variance can be used in Business?
Variance measures variability and thus it helps the investors to measure the risk by using the volatility. The variance statistics can help the investor to get the idea or assume the risk an investor might face with specific security he or she is purchasing. Large variance indicates that that the set numbers are far from each other and the mean too whereas the small variance may mean the opposite. Variance can be both positive and negative, variance as zero is negative and variance with other identification numbers are positive. A variance may add both advantages and disadvantages.
Advantages:
- Variance is used to study the relation of each number to others within a data set. It is also a simple way of doing the calculation rather than following the broad mathematical techniques.
- In a variance calculation, all the deviations are treated with the mean data no matter what direction they are heading to. The squared deviations can not give the appearance of no variable in the total data set as it can not be summed to zero.
- A zero value in a variance signifies that all the values in a dataset can be identical.
Disadvantages:
- It adds extra weight to the outliers and the data which are far from the mean.
- Interpreting variance is not easy. It is normally used by users to square the root of the value that indicates the standard deviation of the dataset
How to Distinguish Standard Deviation and Deviation?
Several key points make a variance and standard deviation different from each other in many prospects. The following are the points explained minutely.
- Variance indicates numerical value which denotes and explains the variability of observation from the mean. whereas standard deviation helps in measuring the dispersion of observation in the dataset.
- Variance is an average of the squared deviation whereas the standard deviation denotes its root means.
- Variance is signified by sigma-squared (σ2) as its symbol and the standard deviation is signified only by sigma (σ).
- Variance is described always in squared form always greater than the other values in the dataset. On the other hand, the standard deviation is described is always described in the same units of the values within the dataset.
- Variance is used to measure how individual data in the set is spread out to what extent whereas standard deviation, conversely, measures to what extent the observation differs from its mean in the dataset.
Share :
