
The world is a dome housing different processes every second of the day. Even the planets follow a strict routine of making sure they’re traveling on the right orbit. Processes are an important part of micromanagement. Every establishment and company adheres to the process to preserve harmony. This is why flowcharts are an important part of their operation. It informs everyone how a certain task is done without the intricacies of a lengthy manual. Flowcharts compress several pages of a lecture on a single-page diagram. Learn how you can efficiently design a flowchart while checking out flowchart examples below.
[bb_toc content=”][/bb_toc]
56+ Flow Chart Examples in PDF
Production Flow Chart
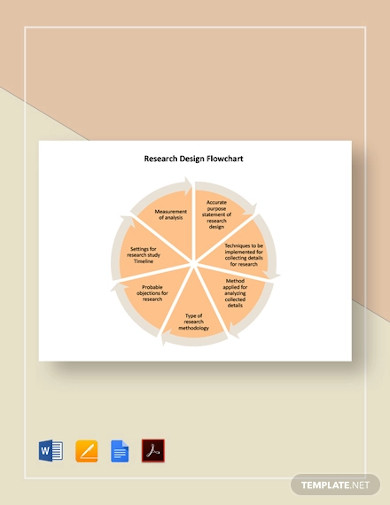
Research Design Flowchart Template
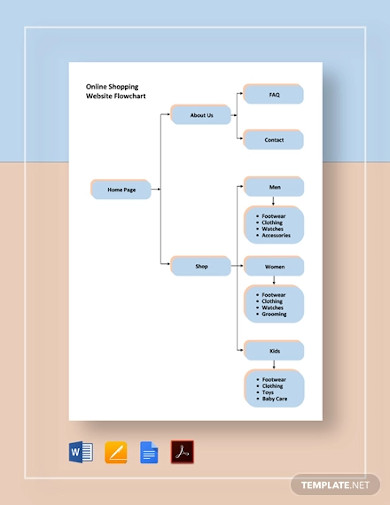
Online Shopping Website Flowchart Template
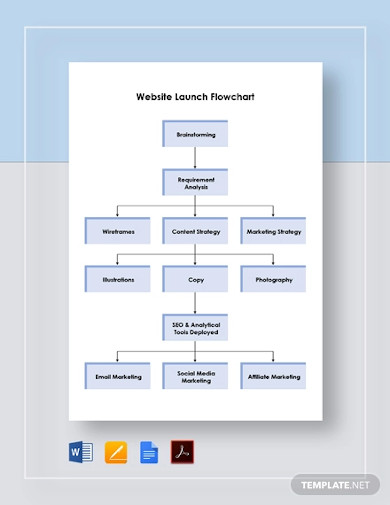
Website Launch Flowchart Template
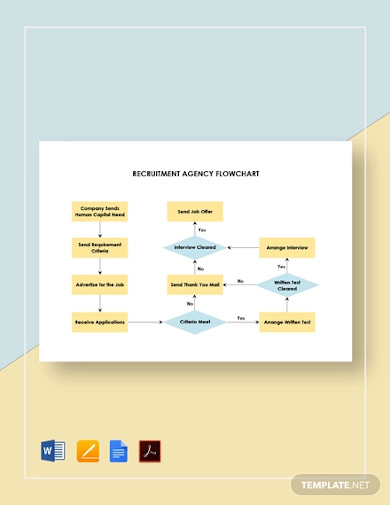
Recruitment Agency Flowchart Template
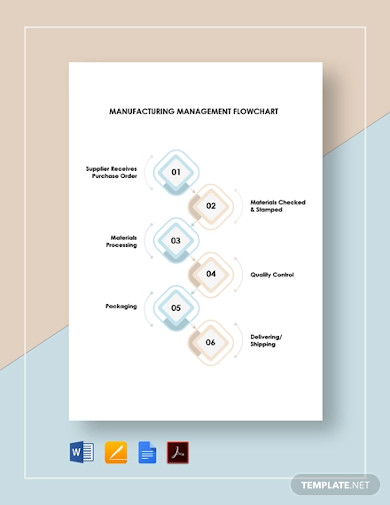
Manufacturing Management Flowchart Template
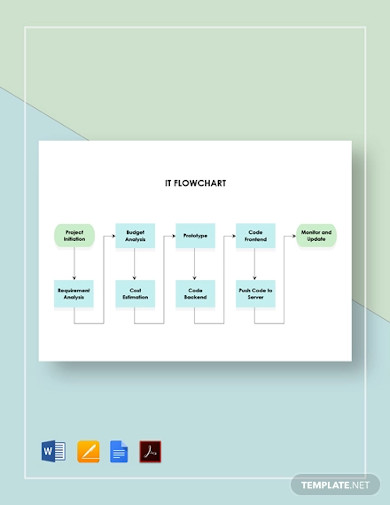
IT Flowchart Template
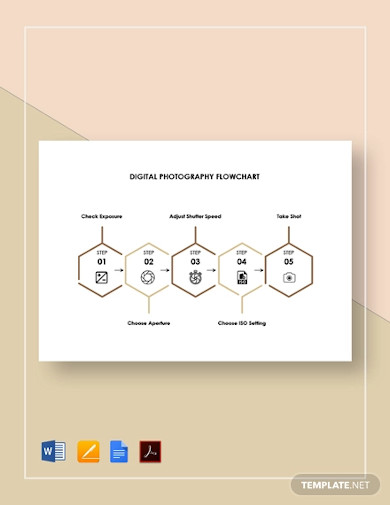
Digital Photography Flowchart Template
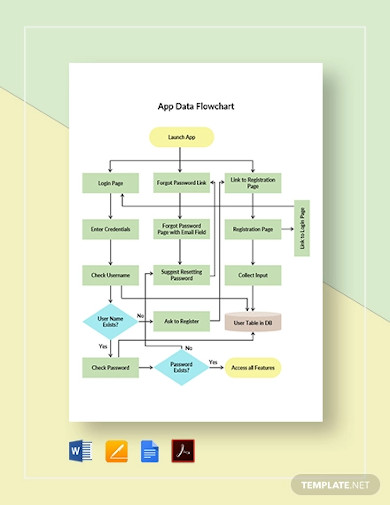
App Data Flowchart Template
Production Planning Flow Chart
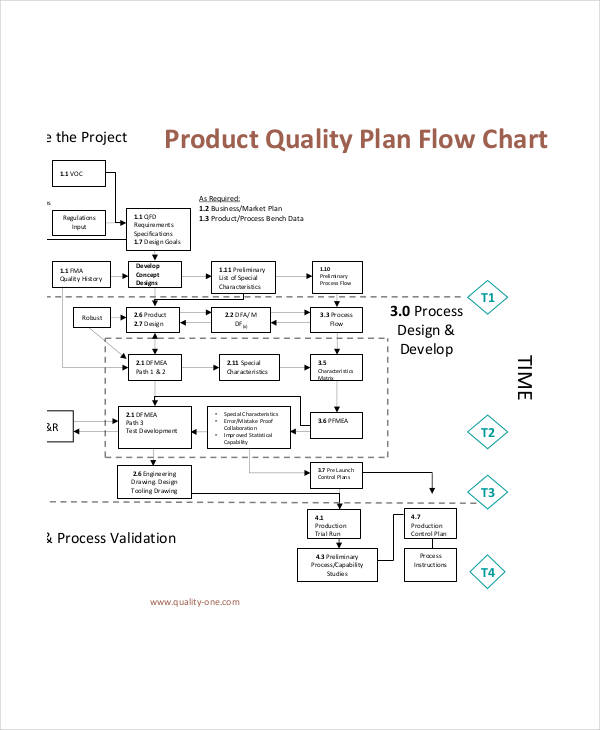
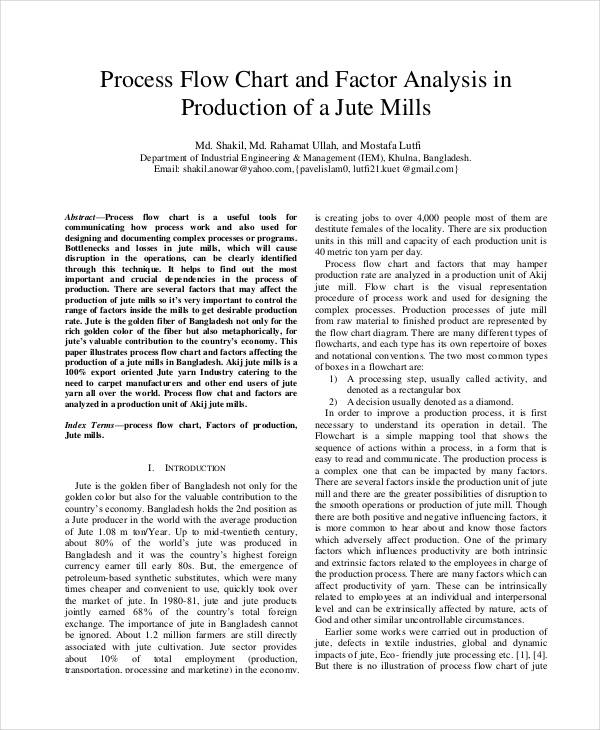
Production Process Flow Chart
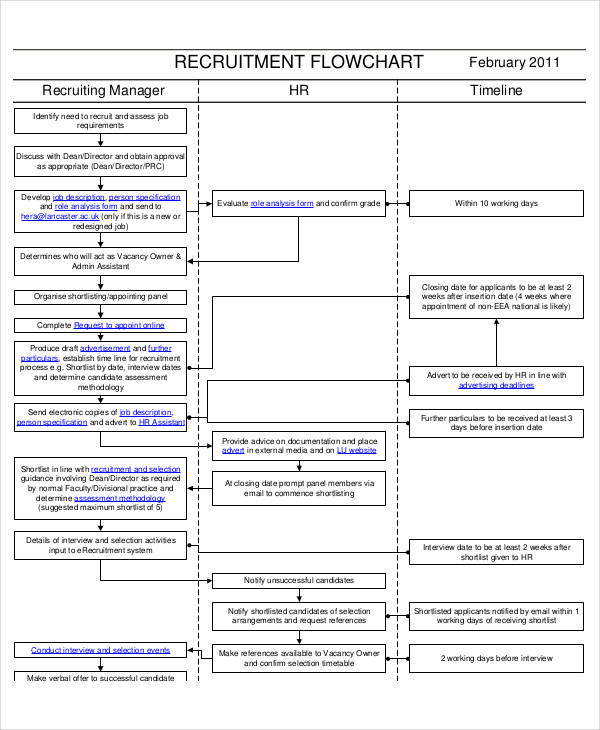
Recruitment Flow Chart
Recruitment Process Flowchart
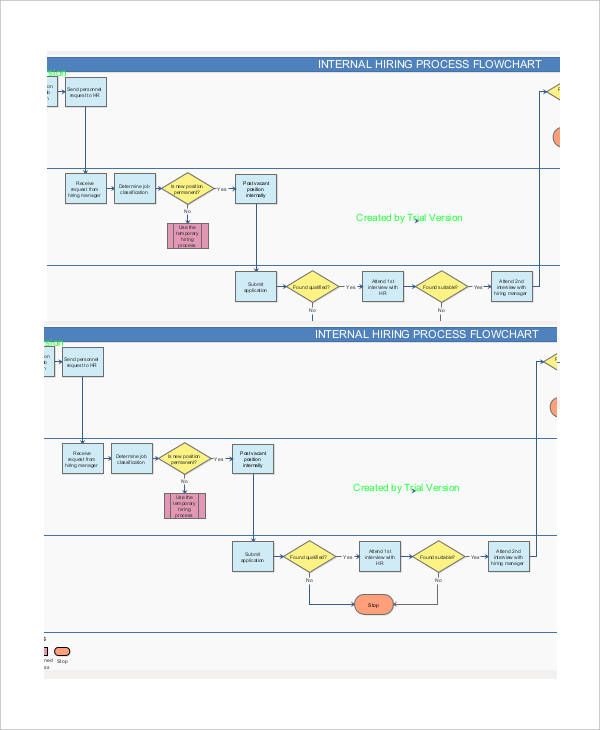
Internal Recruitment Flow Chart
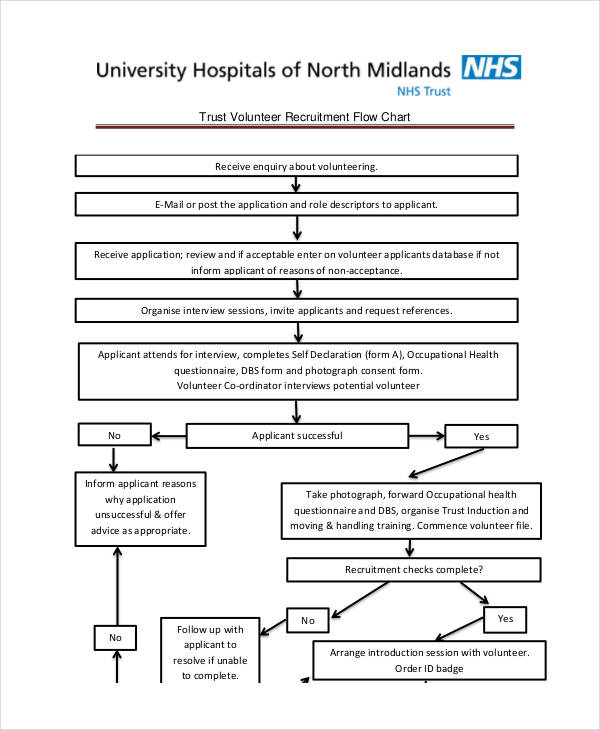
Volunteer Recruitment Flow Chart
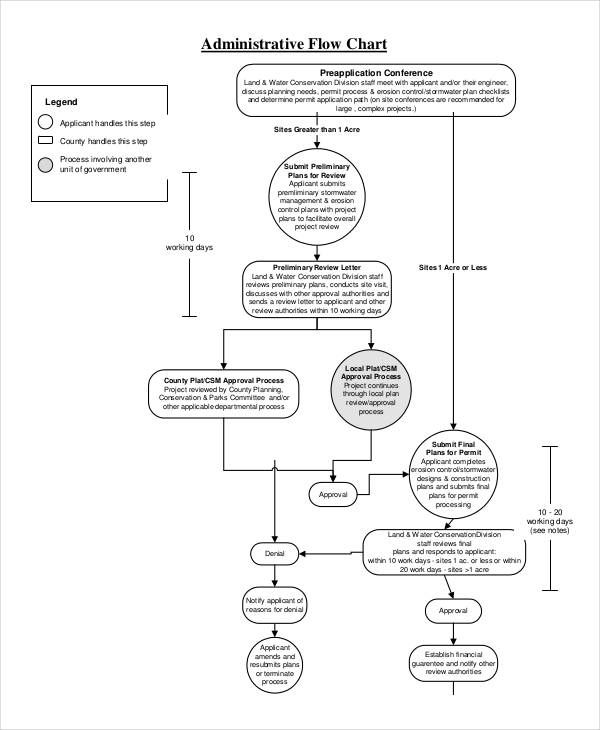
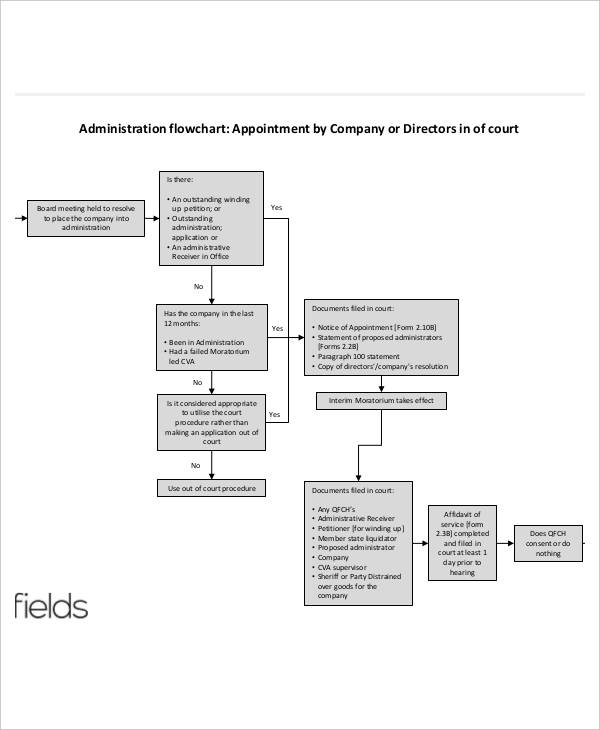
Administration Flow Chart Example
Administrative Process Flow Chart
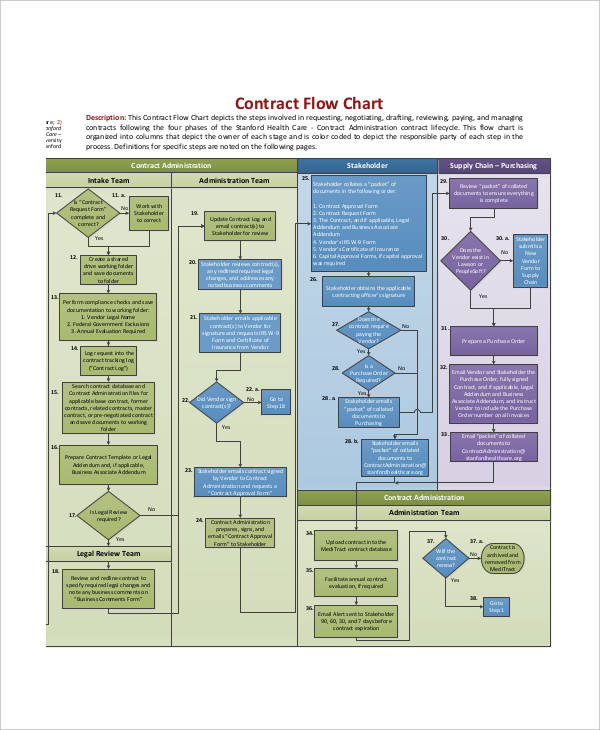
Contract Administration Flow Chart
Office Administration Flow Chart
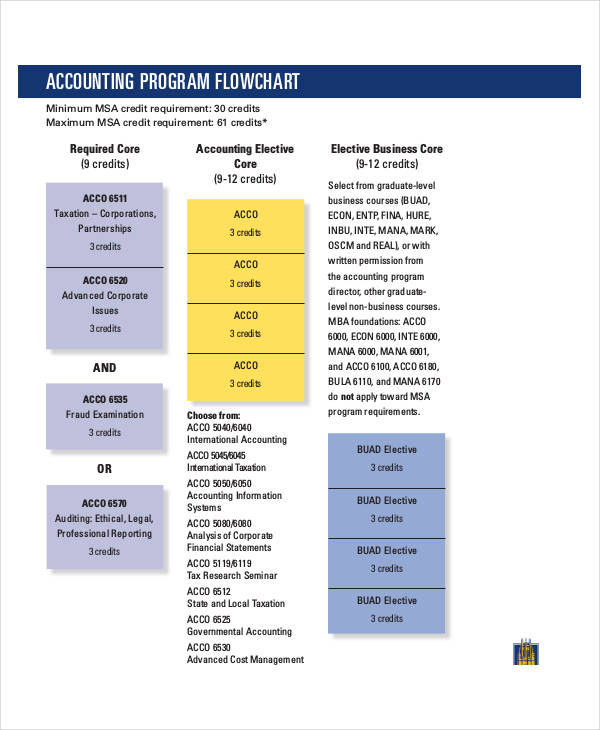
Accounting Flow Chart
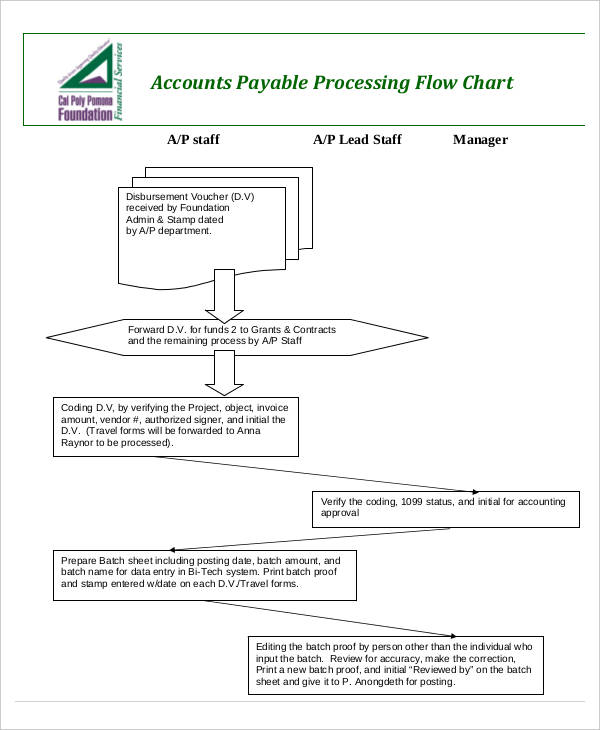
Accounting Process Flow Chart
Accounting Department Flow Chart
Approval Flow Chart
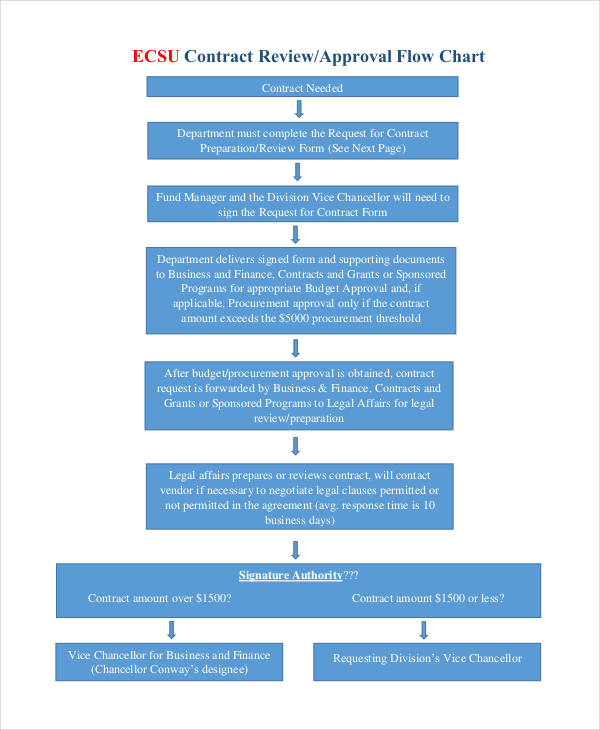
Contract Approval Flow Chart
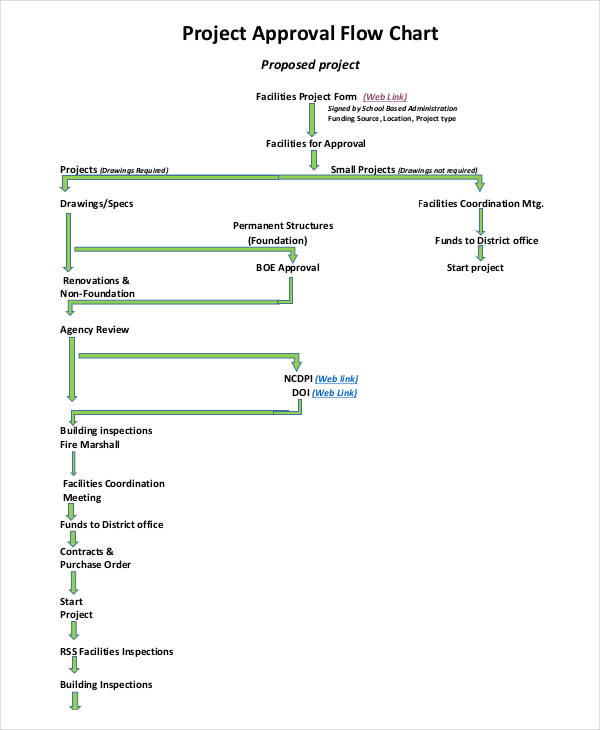
Project Approval Flow Chart
Business Flow Chart Example
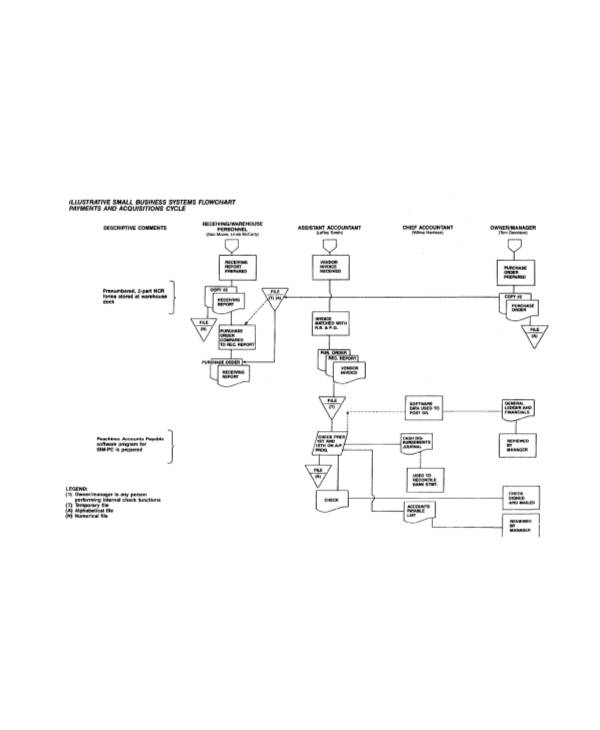
Small Business Flow Chart
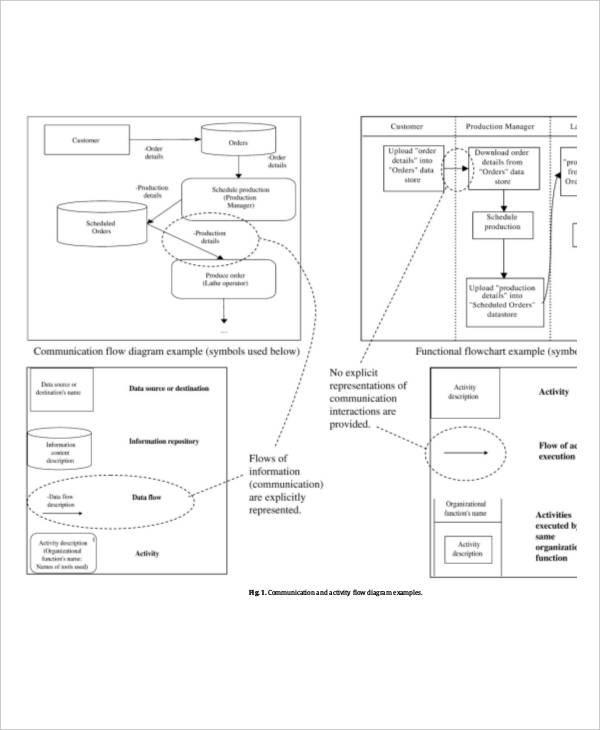
Business Communication Flow Chart
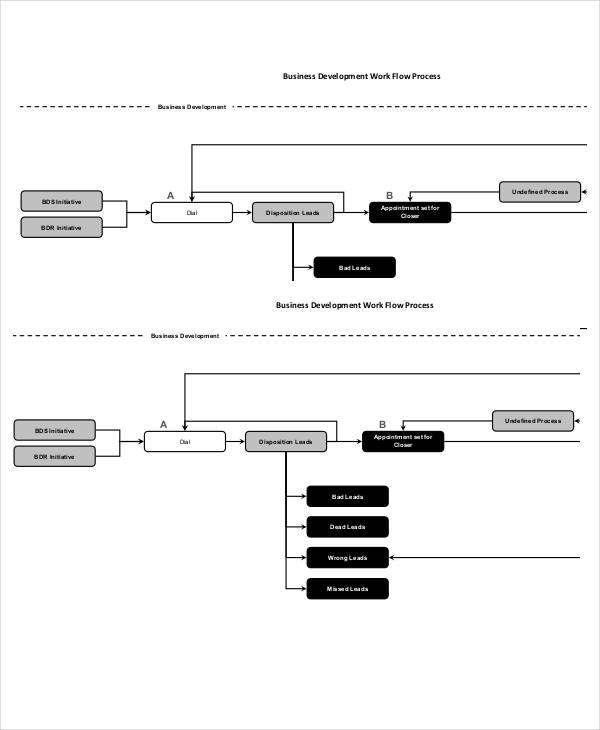
Business Development Flow Chart
Company Flow Chart
Construction Company Flow Chart

Manufacturing Company Flow Chart
Communication Flow Chart
Project Communication Flow Chart
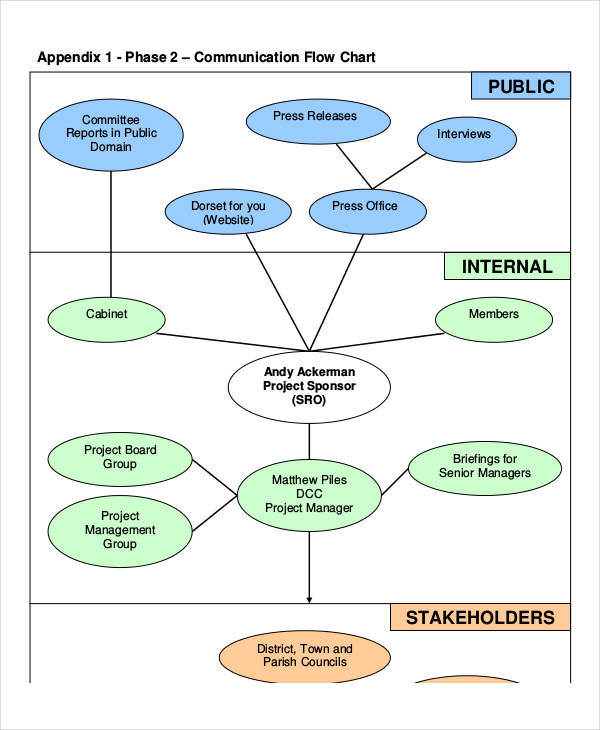
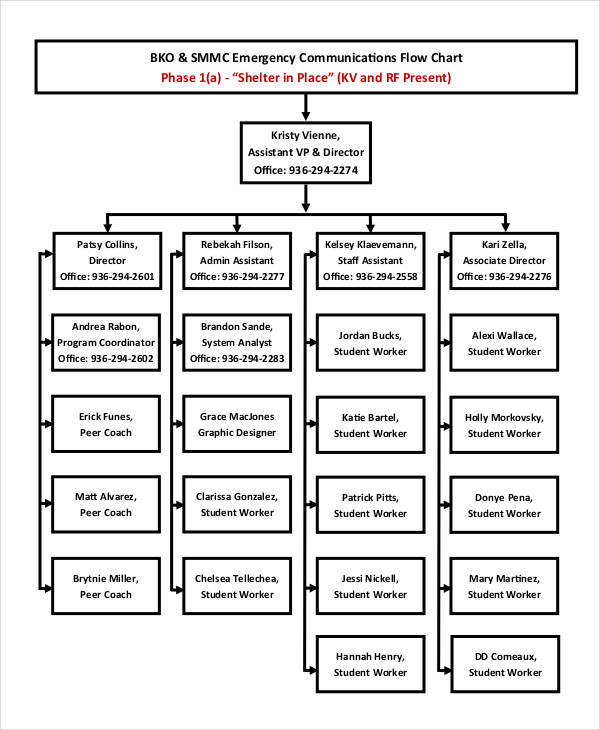
Emergency Communication Flow Chart
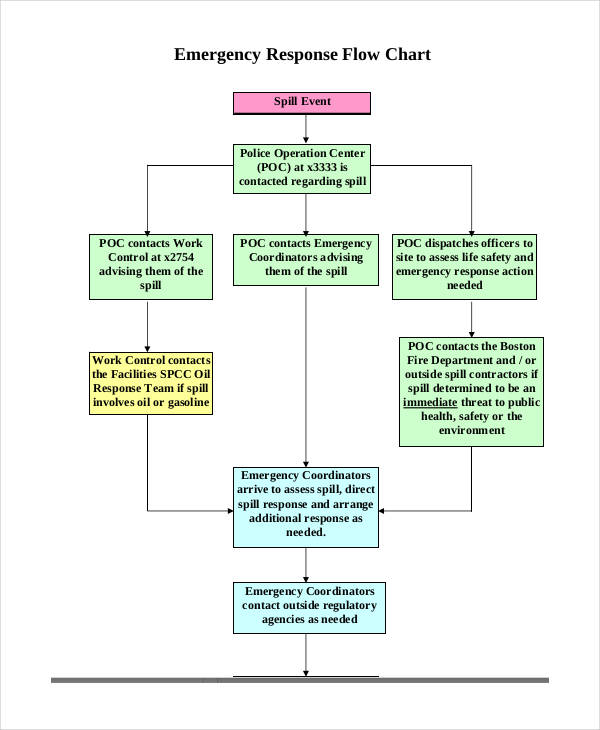
Emergency Flow Chart
Emergency Response Flow Chart
Medical Emergency Flow Chart
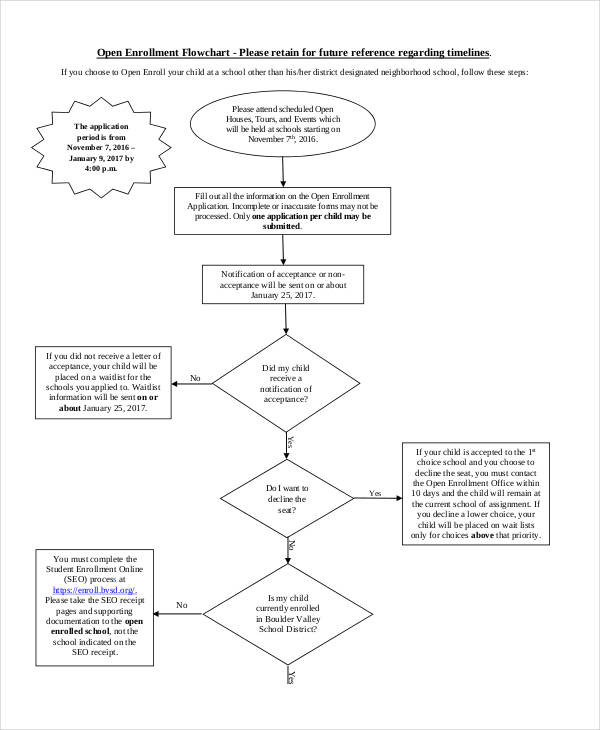
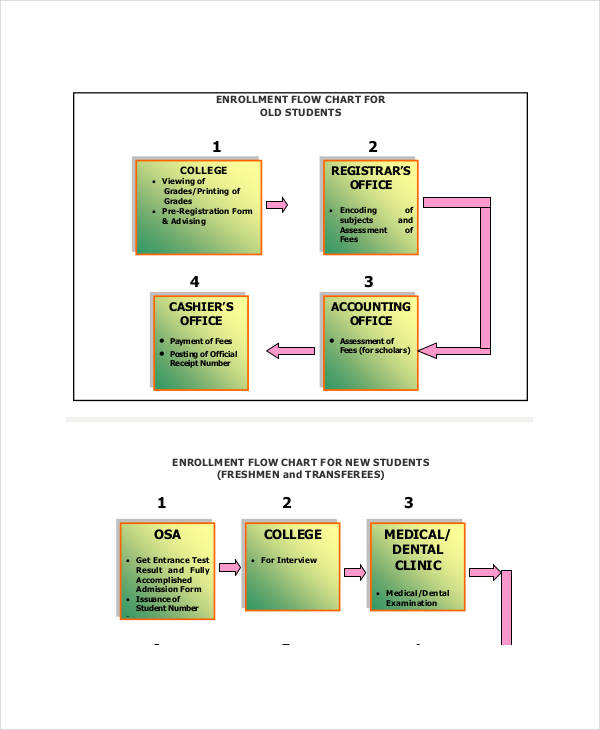
Enrollment Flow Chart
Open Enrollment Flow Chart
Student Enrollment Flow Chart
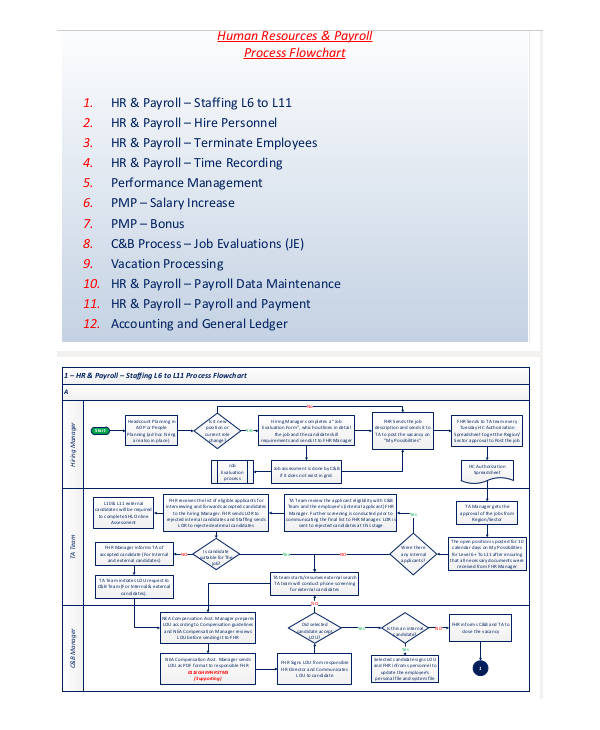
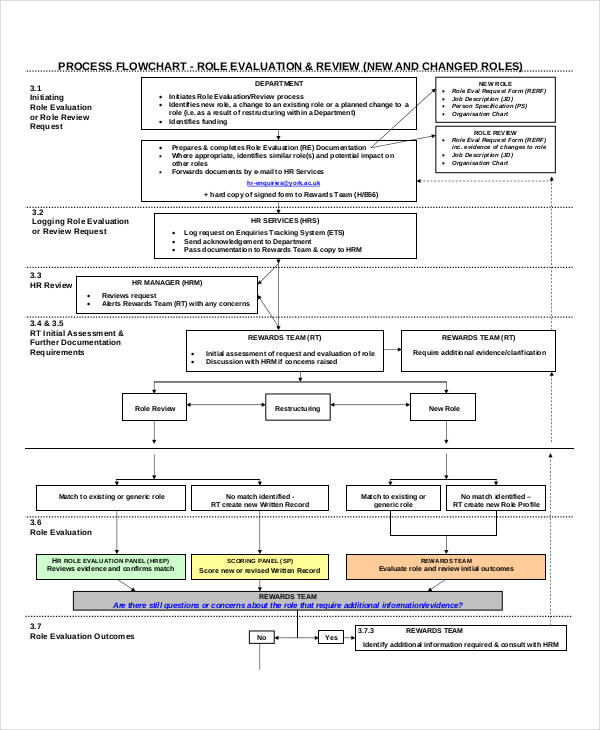
HR Flow Chart Example
HR Process Flow Chart
Job Flow Chart
Job Description Flow Chart

Job Analysis Flow Chart
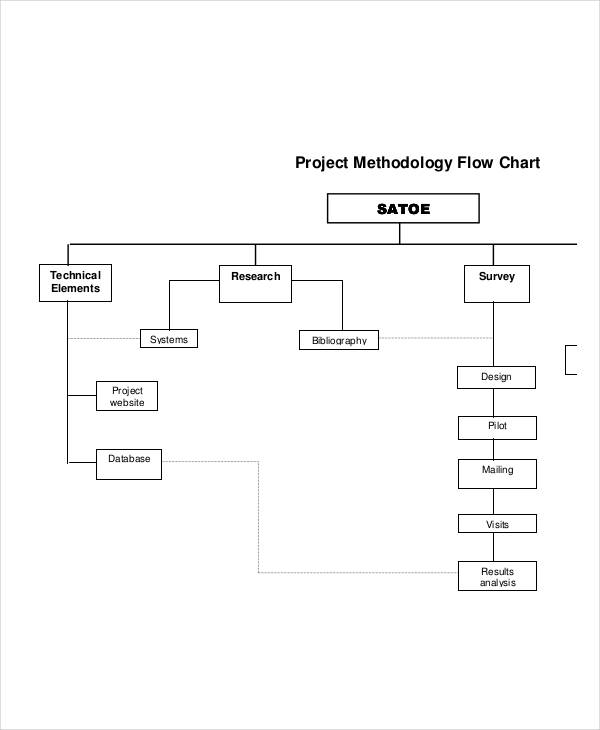
Project Methodology Flow Chart
Nursing Process Flow Chart
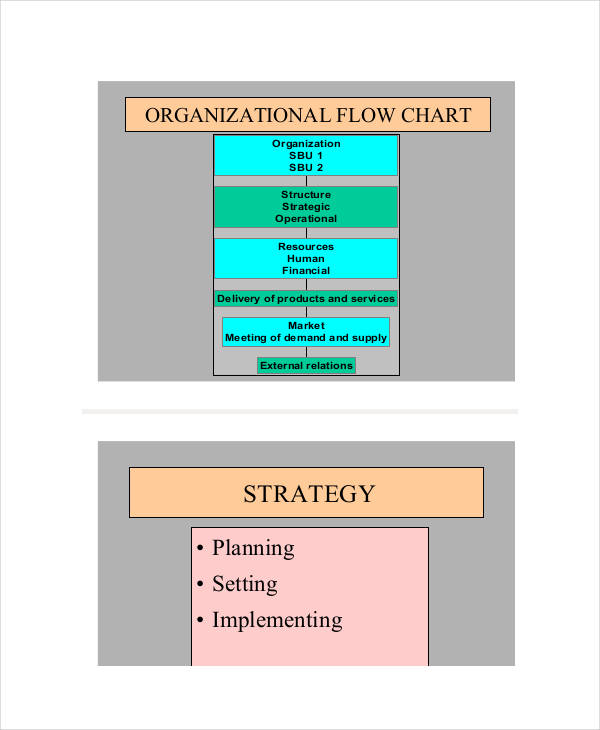
Organization Flow Chart
Business Organization Flow Chart
Company Organization Flow Chart
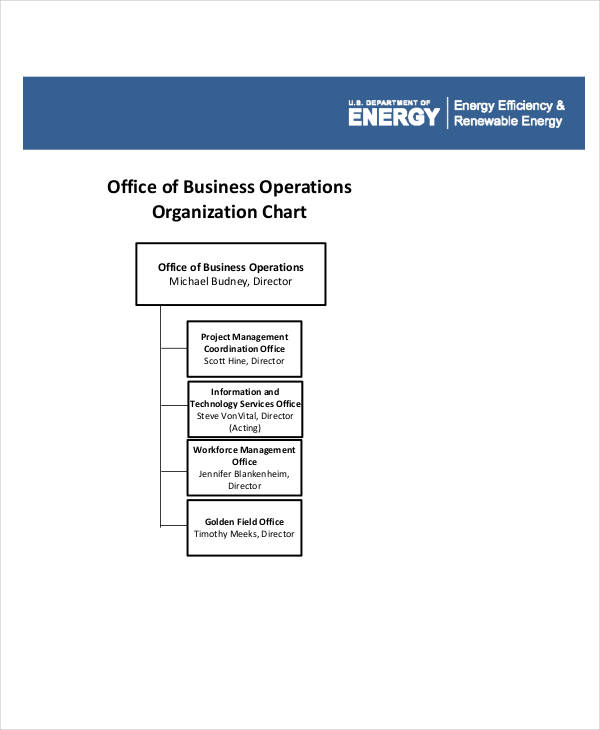
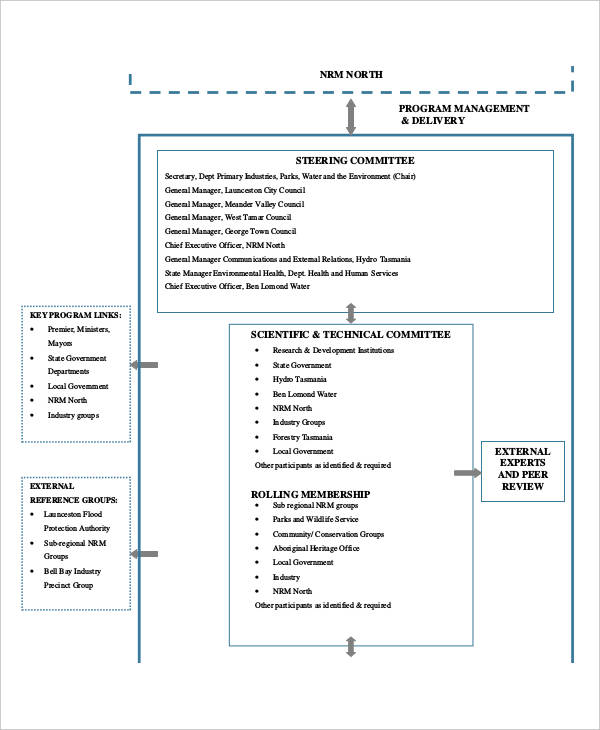
Program Management Flow Chart
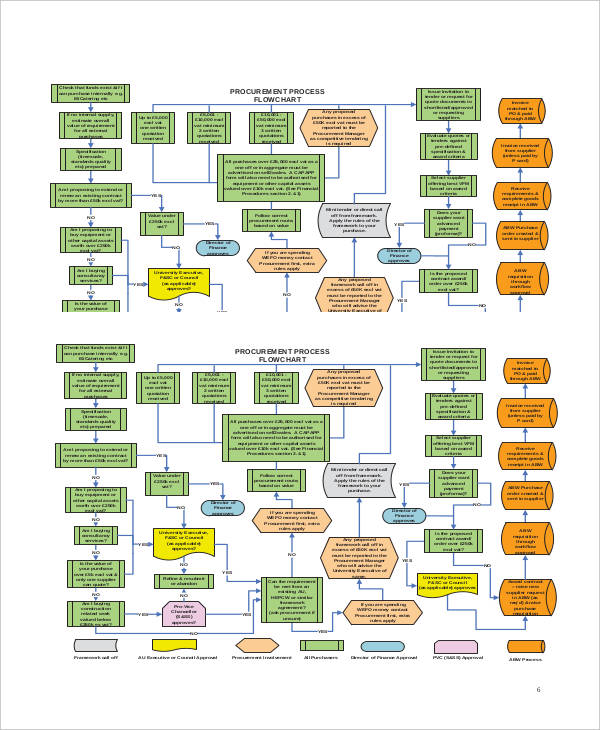
Procurement Process Flow Chart
Research Flow Chart
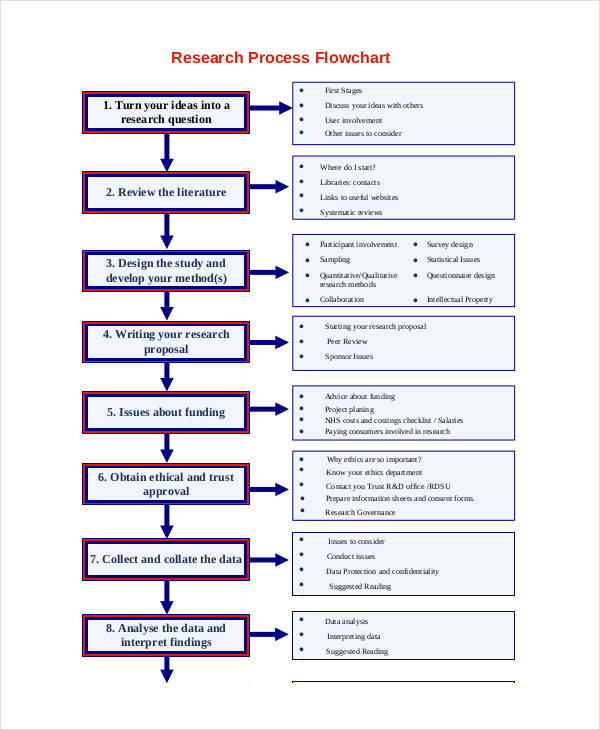
Research Process Flowchart

Research Proposal Flow Chart
Sales Flow Chart
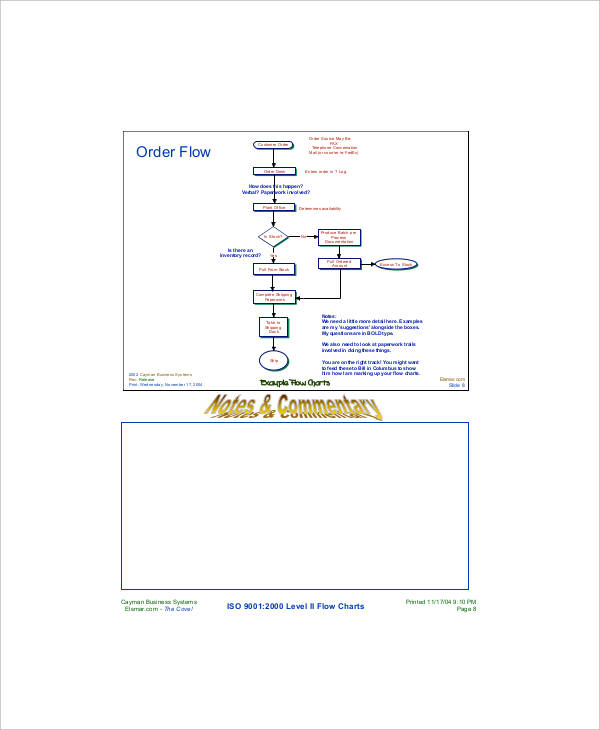
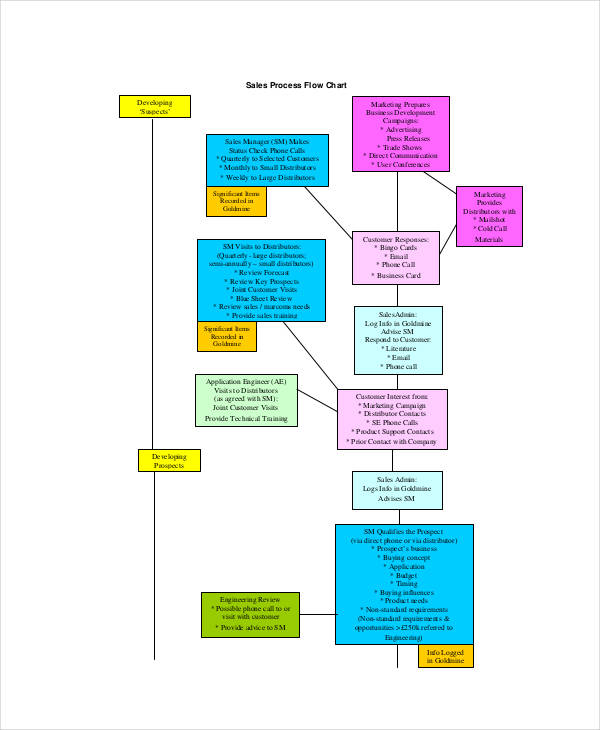
Sales Process Flowchart
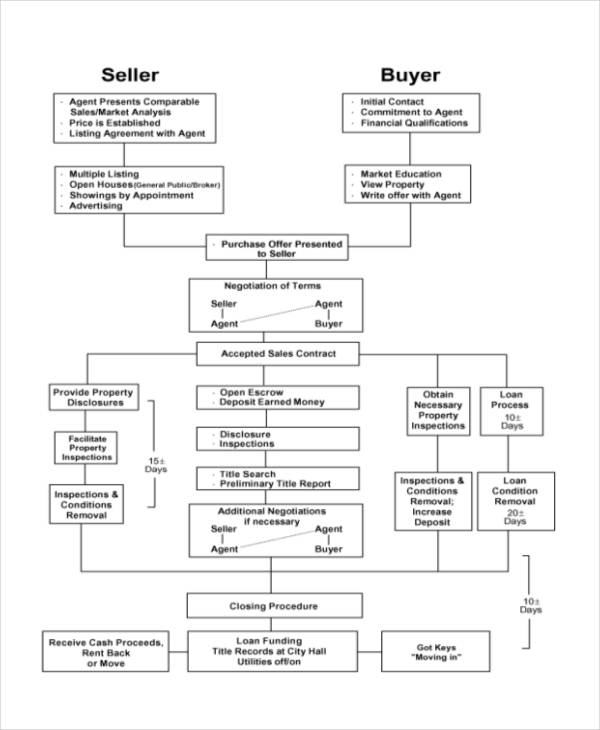
Real Estate Sales Flowchart
Selection Flow Chart
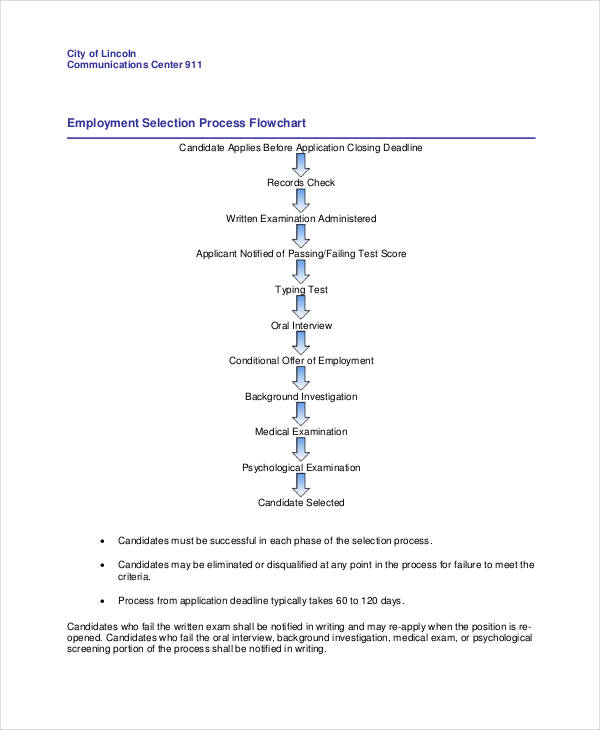
Selection Process Flowchart
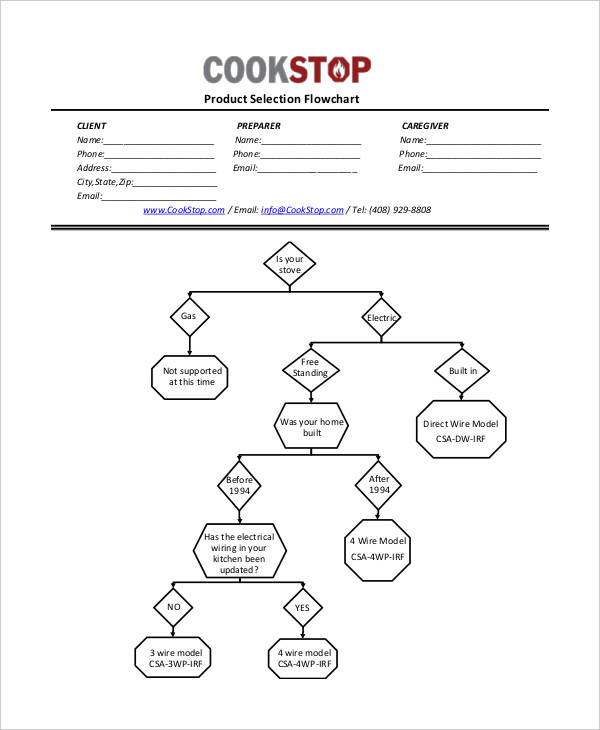
Product Selection Flowchart
Safety Flow Chart Example
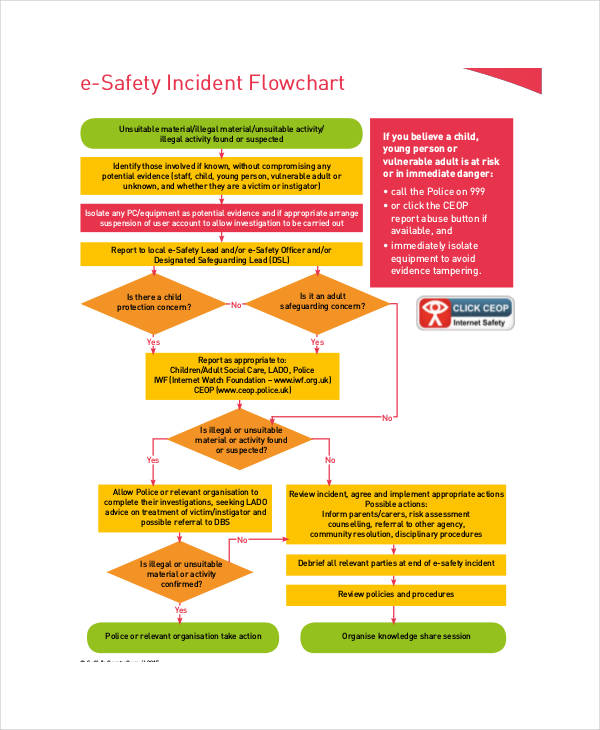
Safety Incident Flow Chart
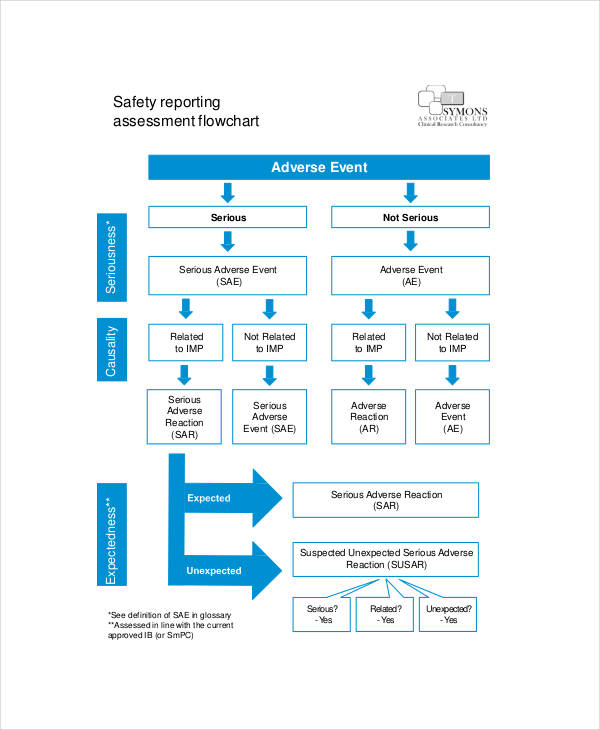
Safety Reporting Flow Chart
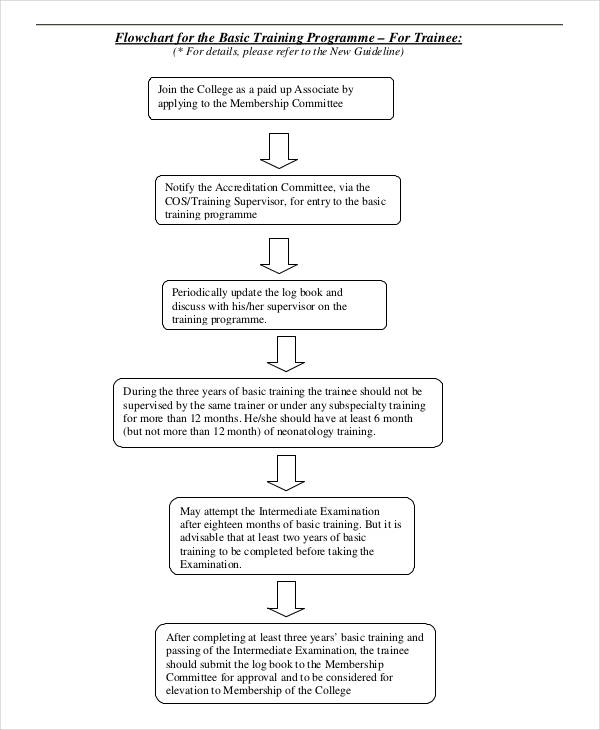
Training Flow Chart
Training Process Flow Chart
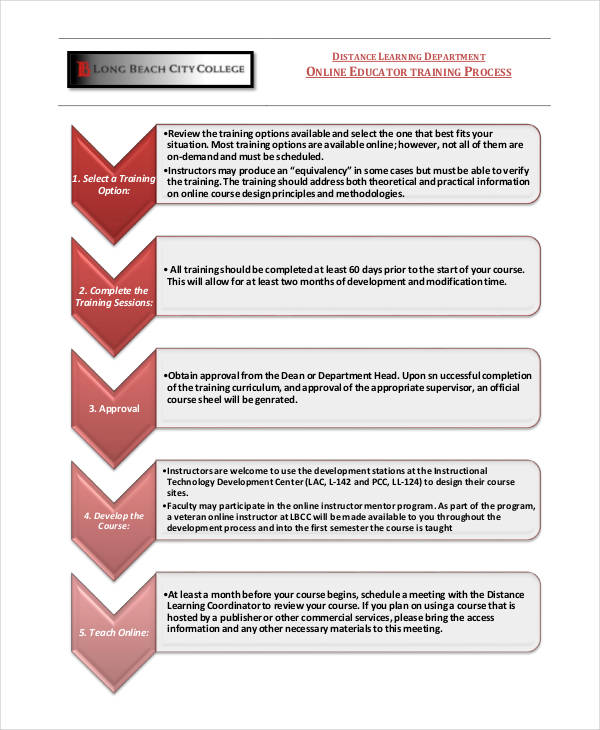
Training Program Flow Chart
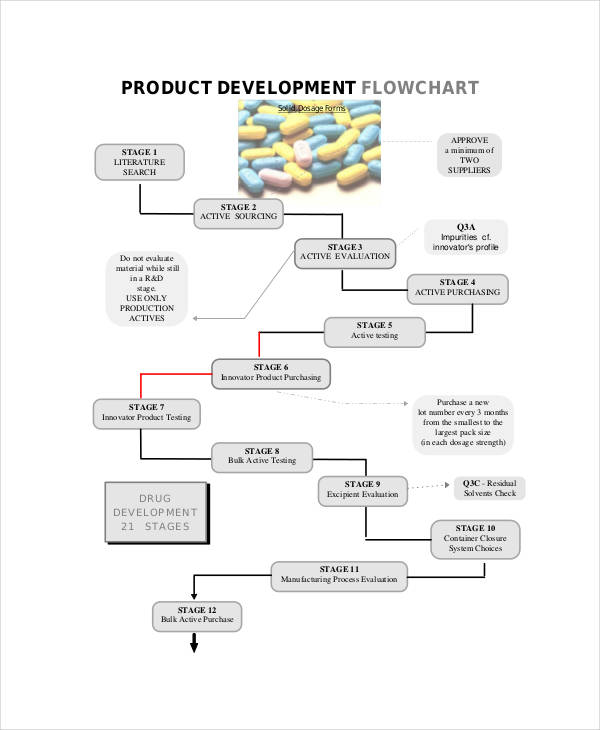
Product Development Flow Chart
Laboratory Flow Chart
Medical Laboratory Flow Chart
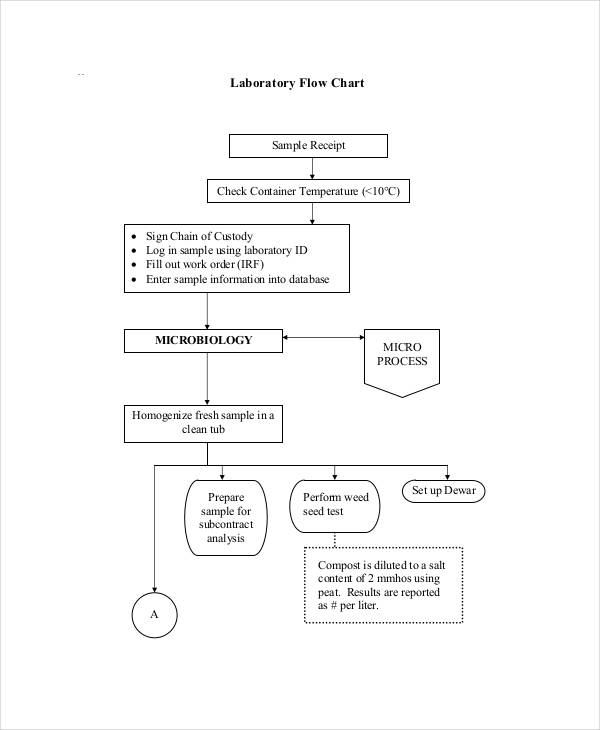
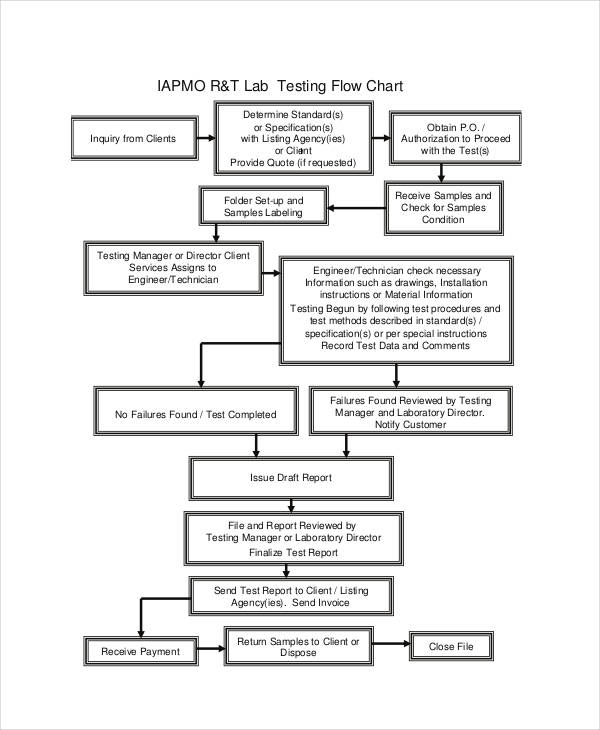
Laboratory Process Flow Chart
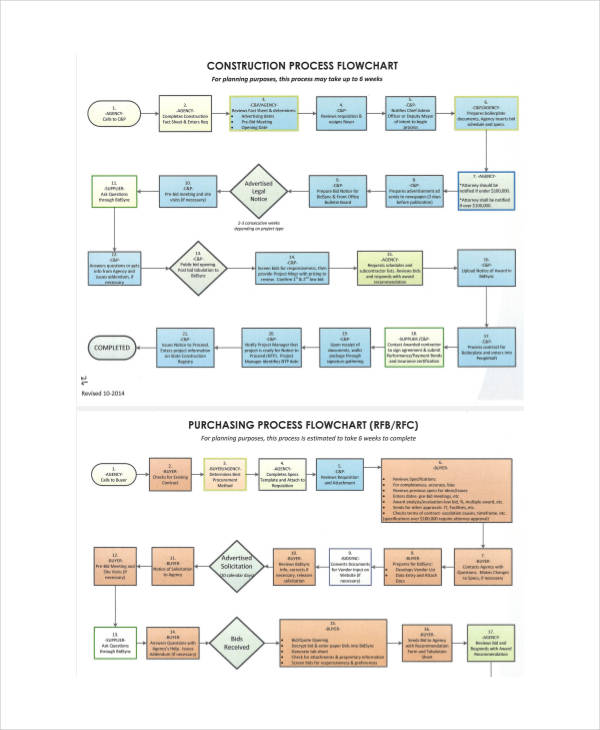
Construction Work Flow Chart
Management Flow Chart
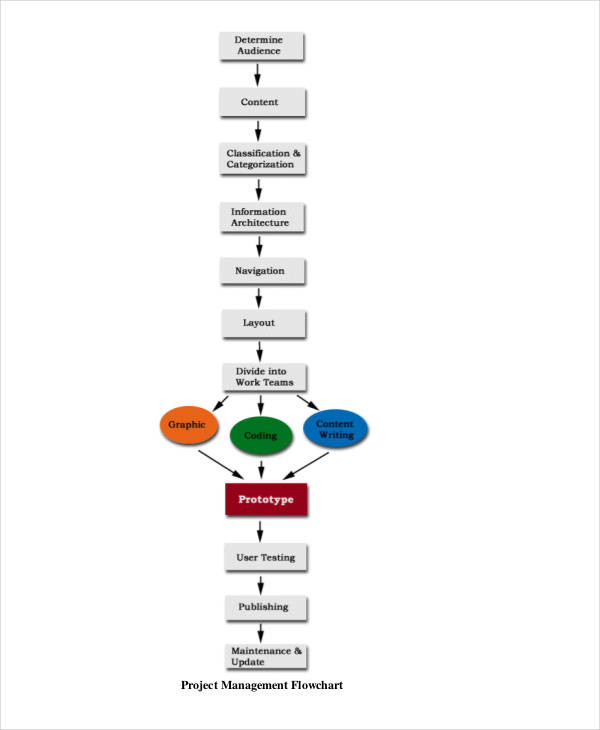
Project Management Flow Chart
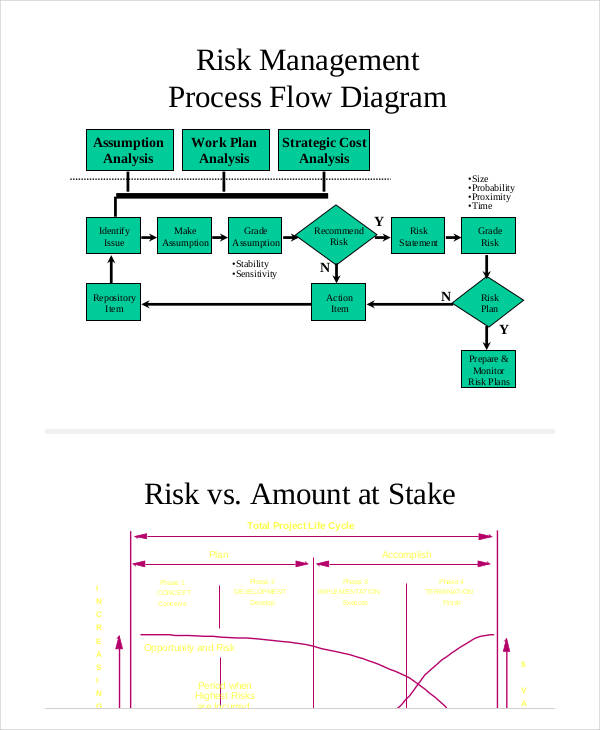
Risk Management Flow Chart
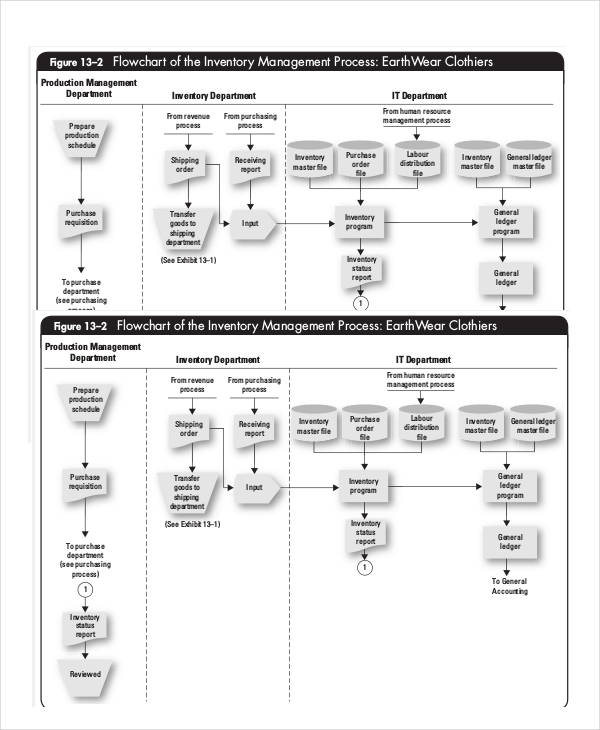
Inventory Management Flow Chart
What Is a Flowchart?
A flowchart is a visual diagram that presents a process. It shows how the operation and what is included during the procedure through a series of interconnected flowchart symbols. This chart is used in various industries and business activities, whether it’s operating a program or providing instruction on how certain key roles in the organization should perform a process.
How to Design a Flowchart
It may be another wall display or informative shared on your file storage, but a flowchart can do wonders, according to Chron, among the reasons why you should use a flowchart is because it does not only layout the process, it also contributes to a task’s efficiency and timeline. When everyone knows what to do in different angles, the solution presents itself immediately. If you’re designing your own flowchart, below are some easy steps to guide you:
1. Master the Flowchart Symbols
A distinct characteristic of a flowchart is its symbols. You can’t call a flowchart as such apart from those. If you plan to make a management flowchart, learn all the basic flowchart symbols. Each of them represents meaning that contributes to a chart’s overall comprehensibility. For example, the oval represents the start and the end of a process so you know when a flow stops and when the other flow begins. The rectangle, the most commonly used symbol represents a step that needs to be taken. The diamond shape denotes a decision. There are also symbols for documents and data input, so you’ll know what the process flow involves.
2. Be Consistent All Throughout
When you begin to put together the data along with the symbols to create a process, remember to design everything consistently. Every shape should be of equal sizes. The color fillers should be the same or should blend seamlessly with others. Also, fonts should be the same as well. A flowchart is an important information source to make sense of the processes, and an inconsistent layout will ruin this purpose. If the color bothers you, you might as well create a simple work flowchart. If you do make a creative chart, make the design functional. Functional designs are those that contribute to a material’s usage rather than being a display. For example, you might want to change colors for every end decision, so the viewer can easily identify them.
3. Arrange the Data From Left to Right
Unless you’re from a country whose writing system requires you to read starting from the opposite direction, you should arrange all your event flowchart data from left to right. This helps the audience make out what the diagram is all about because they’re processing in the way their reading a book. It tends to be a lot more confusing if the trail of steps starts from the right, especially if it is lengthy.
4. Don’t Overlap Arrows
It’s the rule in every process flow diagram: never overlap arrows. Overlapping lines and arrows can easily confuse. This is especially important if there are numerous steps and lines involved in a single process flowchart. Untangle your arrows. If there are too many on the spaces in between your shapes and symbols, make the lines go around the shape and outside the inner picture.
5. Limit Everything to a Single Page
As much as you can, don’t use two pages for your flowchart. Flipping over to the second page can be very complicated since you have to repeatedly refer to the first page to get the whole picture. If the process is too long to contain on one layout, find some things that you can remove because a long flowchart is not good either.
FAQ’s
What are the different flowchart types?
Generally, there are four different types of flowcharts: document flowcharts, data flowcharts, system flowcharts, and program flowcharts.
Who introduced flowcharts?
Frank and Lilian Gilberth presented the method of the first structure to document processing called the flow process chart in front of the American Society of Mechanical Engineers in 1921.
What are the uses of a flowchart?
Aside from showing how a system works, flowcharts are also used in decision making, brewing a solution, coming up with ideas, and showing ways to store information.
Having an established process flow in any organization is necessary to avoid pitfalls and chaos. When everyone threads on the same procedure, they can perform their roles efficiently because there’s a predetermined guide on how to do them. This also helps managers manage their performance because any problem can be traced along the process line. This is how business flowcharts can help you, too. If you need a well-designed flowchart structure, go through the flowchart templates list and get yours!