19+ Chart Templates & Examples in Apple Numbers

chart

A chart, regardless of what type, can play a significant role both of the personal and professional lives of the people who use it. Little did you know charts have improved your life in one way or another. Charts can be practically used for almost everything—to understand complicated concepts, to encapsulate or consolidate data, to complete research papers, to delegate household chores, and up to present proposals.

If you have minimal knowledge regarding charts and that you have no idea how to make one, you should consider reading further this article for we have provided discussion regarding the elements that make up a chart, steps in creating a chart, tips on how to create a chart, as well as the answers to the frequently asked questions surrounding charts. And the best of all? We have also provided downloadable and editable chart templates in Numbers format.

Elements of a Chart

Learn what makes a chart effective and complete by learning the elements that make up a chart. Each of the elements serves a specific purpose and each purpose is a factor that makes a chart effective. Knowing all of these gives you an advantage especially when it is your first time creating a chart.

1. Title: Charts must always have a title, one that is clear and specific. The title is the one that would enable you to specify the data or the topic being represented in your chart. This element is positioned usually at the upper-center part of the chart so whenever someone will view it, it will be the first thing they see. Make sure the title is specific enough so as to avoid possible confusion.

2. Chart Area: This area is the space where the rest of the parts of a chart—the points, labels, axes, and grid lines—are placed, drawn, and shown. This is basically the area that the chart covers and also the background of the chart. Chart areas are usually white but you can surely change it according to its purpose or according to your preference. You may also add a border if that pleases you.

3. Plot Area: This element is the area or the space found within the chart area. This element, which appears directly behind the data series, is where the plotting of the contents of the graph is done and basically where the data is being consolidated. You can customize this area into different colors and styles that will help you enhance its overall look and feel.

4. Points: Charts are not considered as charts without the data points. The points would actually depend on the type of chart you will use. If you are going to use a bar chart, you have to use bars when conveying information and not literal points. But when you use charts like line charts and progress charts, use points if you want to illustrate the gradual change of a certain variable over a particular duration.

5. Legend: A chart will not be understood without a legend. The legend plays the function of each of the items you have included on your chart with the purpose of helping you readers understand whatever you have included on your chart. Not including a legend will only make readers confused and will make them interpret it on their own, and this interpretation will possibly be different than what you had intended in the very first place.

6. Labels: This element does not only describe a data point but it will also depict what each item on the axis represents. Labels are used to give the readers what a point stands for as well as the role it plays to achieve the overall objective of the chart. Ensure that these labels are also defined and reflected on your legend. If you are not able to provide a custom label, this will be generated automatically. You may also see comparison chart examples.

19+ Chart Templates in Apple Numbers

Behavioral Chart

behavioral chart

Template Details

Available File Formats
  •  
  •  
  •  
  •  
  •  
Size: A4 and US Sizes

Get This Template

Comparison Chart

comparison chart

Template Details

Available File Formats
  •  
  •  
  •  
  •  
  •  
Size: A4 and US Sizes

Get This Template

Compilation Report Chart

compilation report chart

Template Details

Available File Formats
  •  
  •  
  •  
  •  
Size: A4 and US Sizes

Get This Template

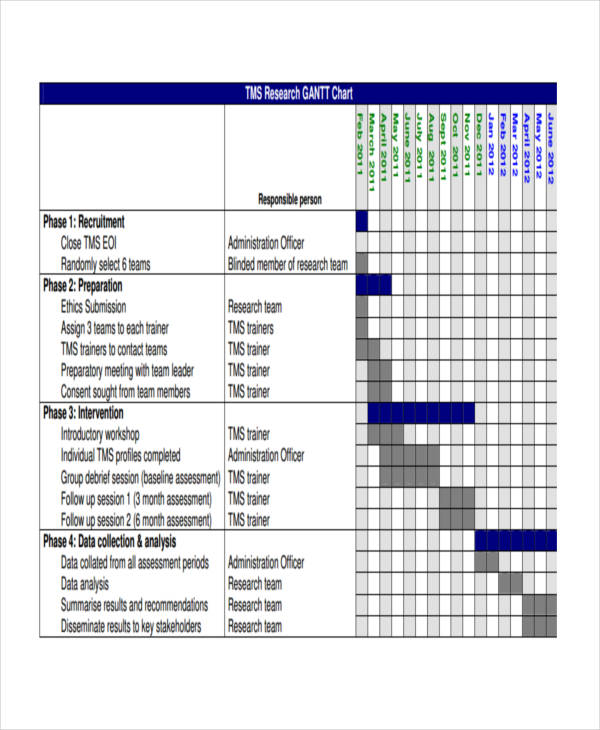
Excel Gantt Chart

excel gantt chart

Template Details

Available File Formats
  •  
  •  
  •  
  •  
Size: A4 and US Sizes

Get This Template

Flow Chart

flow chart

Template Details

Available File Formats
  •  
  •  
  •  
  •  
  •  
Size: A4 and US Sizes

Get This Template

Gantt Chart of Daily Subjects

marketing plan chart

Template Details

Available File Formats
  •  
  •  
  •  
  •  
Size: A4 and US Sizes

Get This Template

Goal Chart

gantt chart of daily subjects1

Template Details

Available File Formats
  •  
  •  
  •  
  •  
  •  
Size: A4 and US Sizes

Get This Template

Marketing Plan Chart

goal chart

Template Details

Available File Formats
  •  
  •  
  •  
  •  
Size: A4 and US Sizes

Get This Template

Medication Chart

medication chart

Template Details

Available File Formats
  •  
  •  
  •  
  •  
  •  
Size: A4 and US Sizes

Get This Template

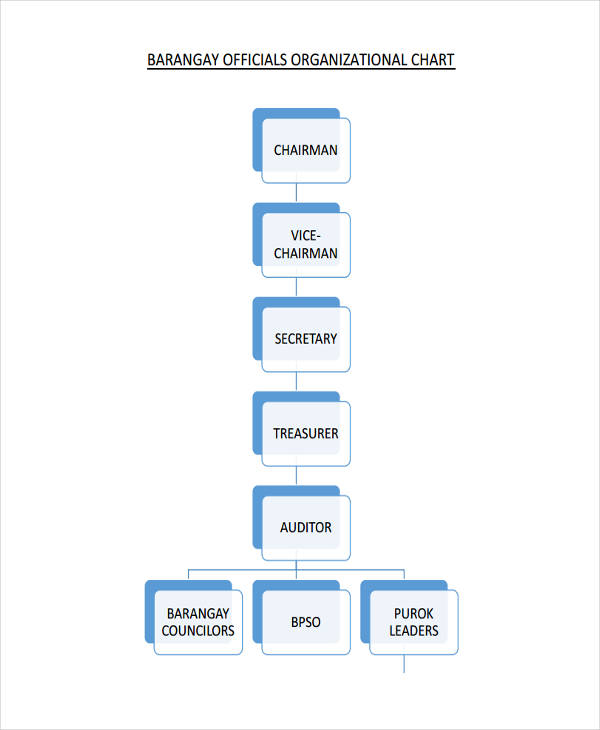
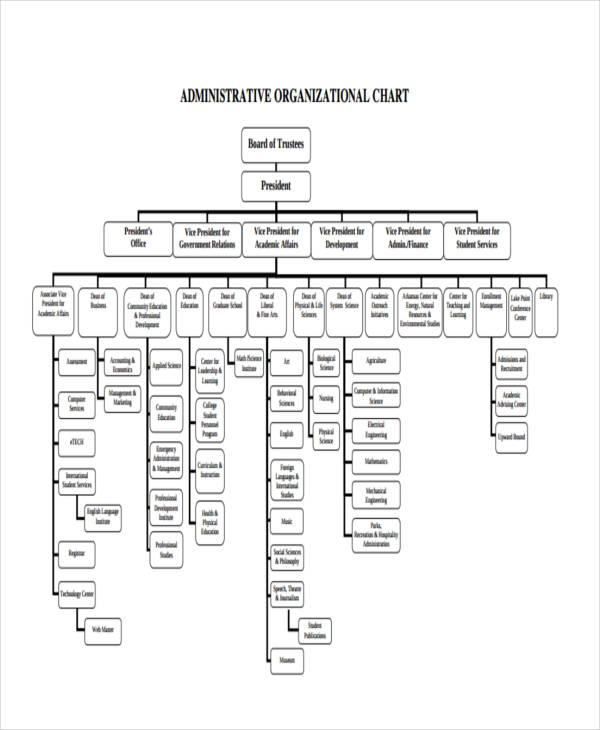
Organizational Chart

organizational chart1

Template Details

Available File Formats
  •  
  •  
  •  
  •  
  •  
Size: A4 and US Sizes

Get This Template

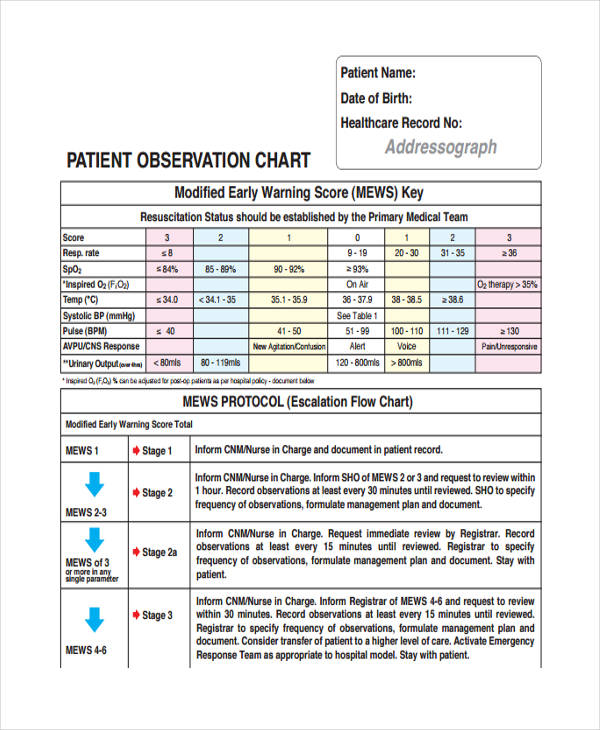
Patient Chart

patient chart

Template Details

Available File Formats
  •  
  •  
  •  
  •  
  •  
Size: A4 and US Sizes

Get This Template

PERT Chart

pert chart

Template Details

Available File Formats
  •  
  •  
  •  
  •  
  •  
Size: A4 and US Sizes

Get This Template

Progress Gantt Chart with Events

progress gantt chart with events1

Template Details

Available File Formats
  •  
  •  
  •  
  •  
Size: A4 and US Sizes

Get This Template

Project Management Gantt Chart

project management gantt chart1

Template Details

Available File Formats
  •  
  •  
  •  
  •  
  •  
Size: A4 and US Sizes

Get This Template

Quadrant Chart

quadrant chart

Template Details

Available File Formats
  •  
  •  
  •  
  •  
Size: A4 and US Sizes

Get This Template

Ranking Chart

ranking chart

Template Details

Available File Formats
  •  
  •  
  •  
  •  
Size: A4 and US Sizes

Get This Template

Responsibility Chart

responsibility chart

Template Details

Available File Formats
  •  
  •  
  •  
  •  
  •  
Size: A4 and US Sizes

Get This Template

Sales Activity Gantt Chart

sales activity gantt chart

Template Details

Available File Formats
  •  
  •  
  •  
  •  
Size: A4 and US Sizes

Get This Template

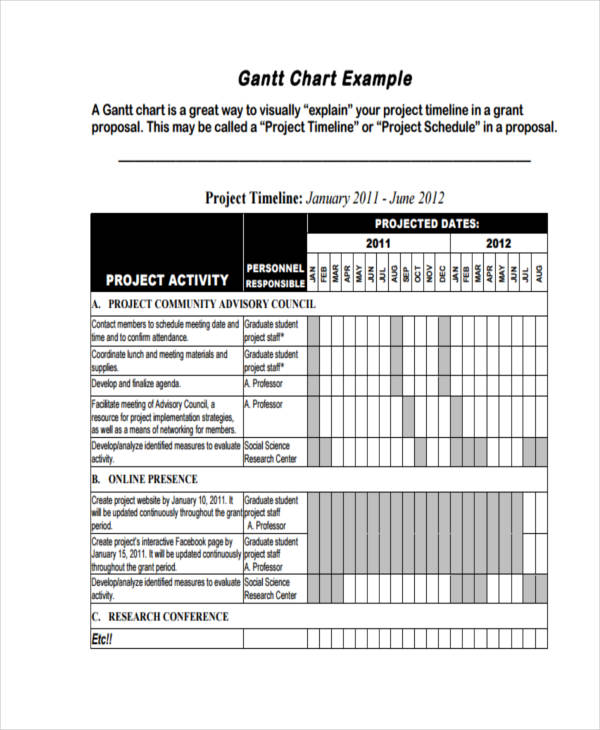
Sample Gantt Chart

sample gantt chart

Template Details

Available File Formats
  •  
  •  
  •  
  •  
  •  
Size: A4 and US Sizes

Get This Template

Weekly Gantt Chart

weekly gantt chart

Template Details

Available File Formats
  •  
  •  
  •  
  •  
  •  
Size: A4 and US Sizes

Get This Template

How to Create a Chart

While there are various ways on how to create a chart since it depends on the type of chart you have chosen, here are some steps and guidelines that you can use for any and whatever type of chart you would like to use.

1. Determine the purpose of your chart: Never start anything without having a clear understanding as to the purpose. It applies to creating a chart—do not create or even plan creating one if you do not know the very reason why you have to create a chart. What if you create a chart for your presentation but you don’t actually need one? Or what if you do actually need to present one but you used a bar chart instead of a pie chart?

2. Gather all the necessary data: Once you have already figured out your reason or purpose for creating a chart, you may now start gathering all of the necessary data for your chart to actually materialize and get realized. Data collection is a vital and crucial step for any chart creation. If you have to do certain methods of data collection, then do so, but make sure that the kind of data you receive are correct and significant to the purpose you have determined as to why you are making a chart.

3. Find a chart template: Once you have already completed your data, you may now look for a template that will be perfect to the kind of data that you want to present and how you want to present it. Sure, you can always start from scratch but if it is still your first time creating one, you will certainly have a difficulty in putting all the elements together. You may also see price chart examples.

With the use of a chart template, you will have everything in place and what you are left to do is to add your contents and organize and edit the template to suit to how you want to present your data. In this article, we have provided chart templates and examples that come in Apple Numbers format, plus, these templates are downloadable and editable. Convenient, right?

4. Add your content: In order for you to “own” the template, you have to add your own content into the template you have chosen. Not all templates will contain the contents that you need, so you would really then have to add your own.

It is said that there are two ways on how you can create a chart: make one in a program such as Apple Numbers and customize a chart template. If you are going to use the chart templates that we have here in this article, you can do both ways—you customize a template using Apple Numbers since the templates that we have here in this article comes in that format. You may also see behaviour chart examples.

5. Review and revise: As soon as you have everything in place, you may now start reviewing and revising (if necessary) everything you have added in the template. You may have committed some grammar mistakes and spelling errors and placed certain elements at the wrong places. As soon as you have reviewed and noticed that it has to be revised, do so at once so you can have your chart ready for presentation.

Types of Charts

Charts have different types and you can choose any of these types to help you in effectively presenting the data you want to present to your audience.

  • Column charts: if you want to show a comparison of at least one set of data points, then this type of chart is perfect for you. The vertical or the Y-axis are usually presenting values while the horizontal or the X-axis are presenting the period of time.
  • Bar charts: to present and compare certain concepts and percentages among sets of data, bar charts are the best type of chart to use since it allows you to set various and distinct choices for the respondents of your data gathering. You may also see business flow chart examples.
  • Pie charts: this chart that literally comes in the shape of a pie can help you show the relationship between the categories of your data or when you are particularly dealing with categorized data groups and show each of its differences according to a single variable.
  • Line charts: this type of chart is good for explaining the trends over a specific period. Line charts are usually presented with markers that usually comes in some shapes such as a circle or a square.
  • Area charts: similar to line charts, this type of chart is also best used when presenting trends over a certain period or when presenting the changes that happened between data groups.
  • Spider and Radar charts: also known as web charts, start charts or polar charts, this type of chart is used to present large sets of various data groups. You may also see weekly chart examples.
  • Comparison charts: also known as cluster diagrams, this type of chart is used to compare at least two groups of data or objects and are used to show a comparison of both qualitative and quantitative details.

Chart FAQs

Do you still have further questions regarding a chart? Here are the answers to the most frequently asked questions about charts:

What is a chart?

A chart is the graphical representation of data. These data are presented in the form of points or symbols, like lines and bars, that enables and allows the readers and the very person who makes the chart understand and comprehend that data easily as well as foresee the current and the future data. Through charts, you will be able to uncover and understand the trends, relationships, and patterns within certain data, both complex ones and not.

What is the purpose of a chart?

If you want to have an in-depth understanding of particular data, the use of charts can be of great help. Aside from business use, charts can actually be of use even for managing a household and especially be of use to the academic setting where students are asked to create study proposals, research papers, and the like. Anything that will require you to present your findings and analysis, using a chart will help you to effectively present all of it.

Why is a chart so important?

If you are asked to present something in any business meeting, you will likely find yourself presenting a chart since people can easily understand what you are trying to convey to them. If you are trying to describe a very delicate, detailed, and important subject, you will have no problem in presenting these if you will use a chart. If you are proposing something, you can easily persuade people through a presentation with a detailed and effective chart.

You can now start creating your own chart with these professionally made chart templates and examples. Charts are effective tools that will help you in presenting data to your audience. A word of caution though: charts will not act as magic and put everything yourself for your convenience—you have to do your part in making it as effective as possible. But with the help of what you have learned from this article, you will make it through without having so much difficulty.

More Design