Oftentimes, we need to encapsulate the data and information that we gather for a certain topic. For example, in school, we need to summarize the lessons discussed for us to easily remember every important detail. At work, when we present our survey or financial updates, we need to present it in a manner that can be immediately understood by the people we are presenting to. You may also see daily chart examples & samples.
Usually, we use different charts in order to present information in a concise and understandable way.
There are different types of charts categorized according to their functions. Commonly, bar, pie, and line charts are used especially in showing information involving graphical illustration for understandability. There are also charts that are named after their originator such as the Gantt, Nolan, and Smith charts. There are still many other types of general charts, and this will be discussed in the next section.
Below are some examples of different types of charts. Check them out and see if you can find something helpful for you.
Basically, a simple chart is a graphical representation of data in a form of a diagram or graph, organizing a qualitative data for it to be easily understood by the readers.
There are also charts that are adorned with extra information like the map surround for a specific purpose such as the nautical or aeronautical charts.
In the area of music, there are also several types of charts such as the chord chart where there is music notation and the record chart for album popularity.
Charts are helpful in breaking down raw data into something that can easily be read and understood and can be created manually or through the use of computer using a charting application.
There are different types of charts, and they can be classified common such as histogram, bar chart, pie chart, line chart, timeline chart, organizational chart, tree chart, flow chart, area chart, cartogram, and pedigree chart; less-common such as bubble chart, polar area diagram, waterfall chart, radar chart, tree map, streamgraph, and GapChart; field-specific such as open-high-low-close chart, candlestick chart, Kagi chart, and sparkline; well-known named charts such as Punnette square, Gantt chart, Nolan chart, PERT chart, and Smith chart; and other charts such as Shewhart chart, Greninger chart, heatmap, natal chart, nomogram, Pareto chart, run chart, strip chart, structure chart, and vowel chart.
They are briefly explained as follows:
First introduced by Karl Pearson, a histogram is a precise representation of the numerical information that is distributed and is a rough estimate of the probability distribution of a continuous variable or quantitative variable. In a bar graph, it relates two variables, while in histogram, it relates to only one. You may also see behavior chart examples & samples.
In constructing a histogram, the range of values is first binned or bucketed by dividing the whole range of figures into a series of intervals and then counted how many of those figures fall into each interval.
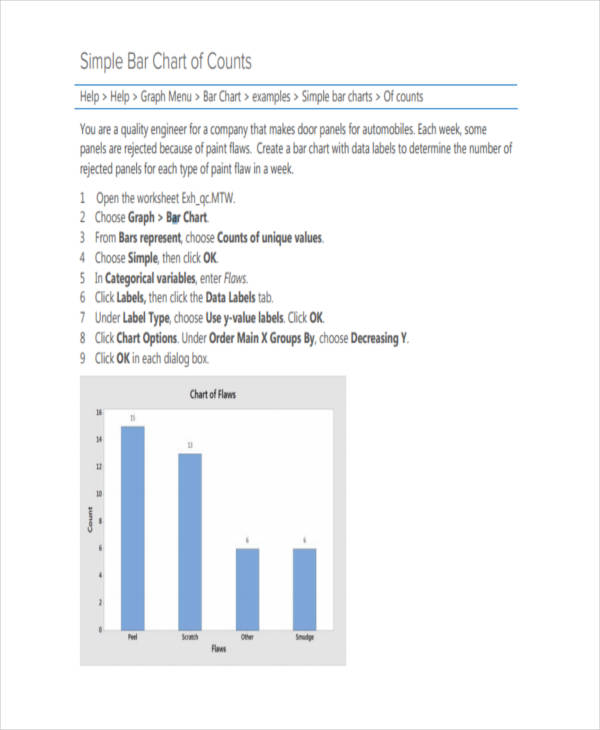
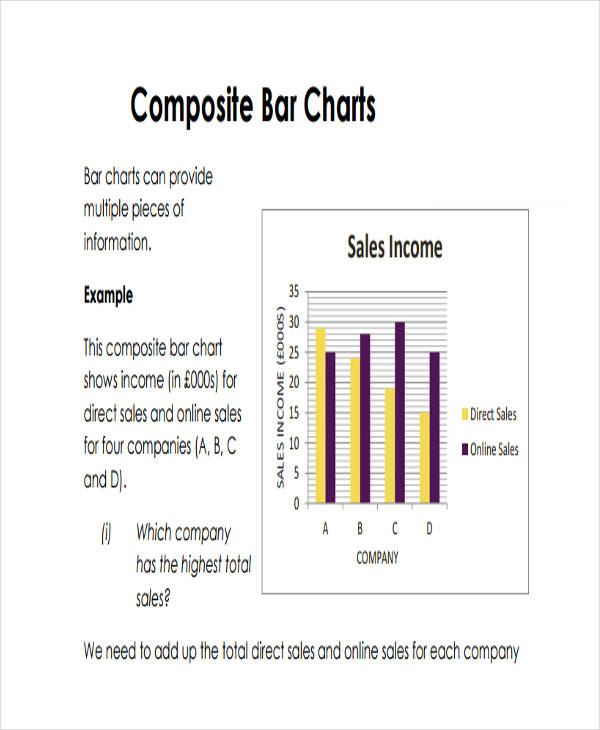
A bar chart or bar graph presents categorical data with the use of rectangular bars with heights or lengths proportional to the values that they are representing which can be plotted either vertically, which is sometimes called a line graph, or horizontally.
This chart also shows comparisons among discrete categories in which one axis of the chart shows the specific categories being compared while the other axis represents a measured value. Some bar graphs show values of more than one measured variable by presenting bars clustered in groups. You may also like monthly chart examples & samples.
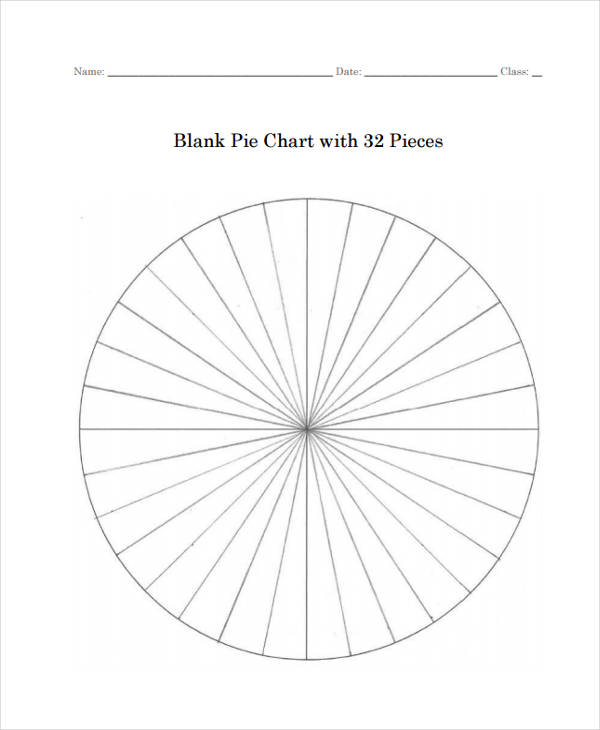
A pie chart, also known as circle chart, is a circle-shaped statistical graphic. The circle is divided into slices to illustrate numerical proportion in which the arc length of each slice is proportional to the quantity it represents. This is generally credited to the Statistical Breviary of William Playfair. These are immensely used in the business world as well as in mass media. You may also check out growth chart examples & samples.
However, there are criticisms pointing out that it is difficult to compare different sections in a pie chart or to compare data across different pie charts, and it is suggested to use other plots like box plot or dot plots.
A line chart, also known as line graph, is a common type of chart that displays information through a series of data points called markers connected by straight line segments. It is almost similar to a scatter plot apart from the measurement points that are ordered and joined with straight line segments. This is often used to visualize a time series and can be called run charts. You might be interested in chart note examples & samples.
Line charts are credited to William Playfair, Francis Hauksbee, and Nicolaus Samuel Cruquius.
A timeline chart displays a list of happenings in chronological order. Typically, a graphic design showing a long bar labelled with dates as well as the corresponding events can be seen in a timeline chart.
Mostly, timelines use a linear scale, in which a certain unit of distance is equal to a certain amount of time. They can be categorized as text timelines or those timelines with text labels, as number timelines or those timelines with number labels, and those that are interactive, clickable, and zoomable. You may also see price chart examples & samples.
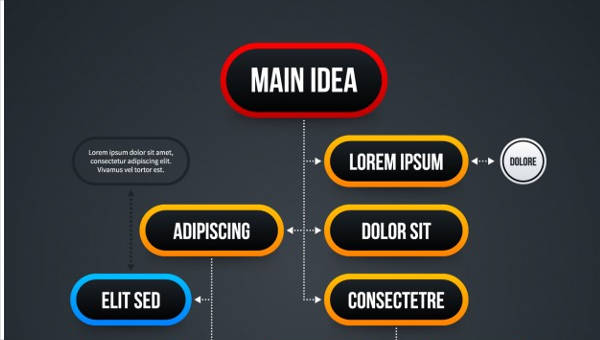
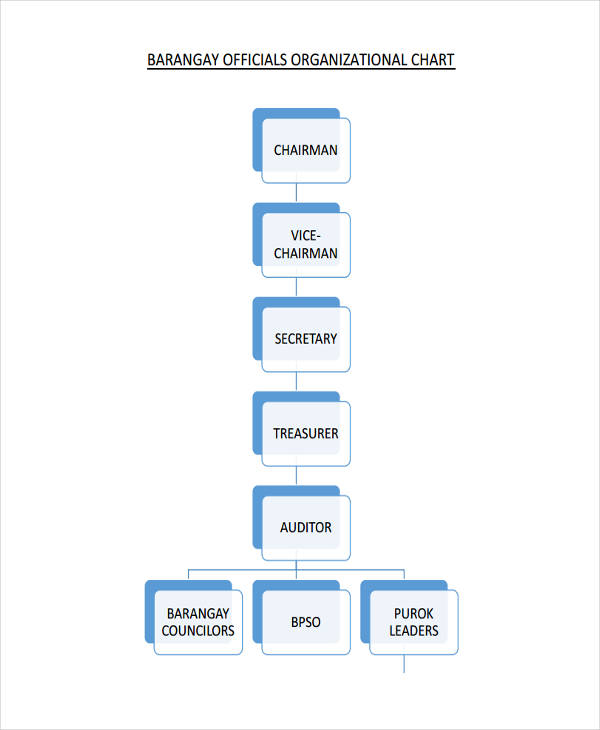
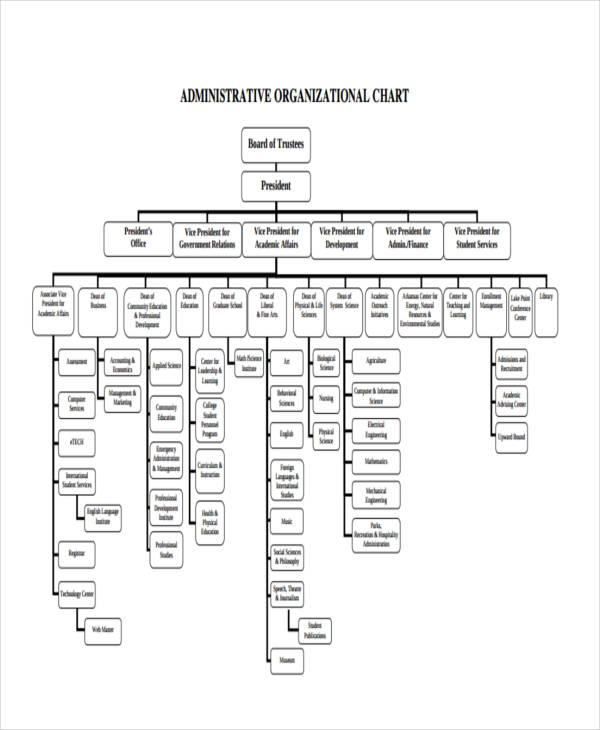
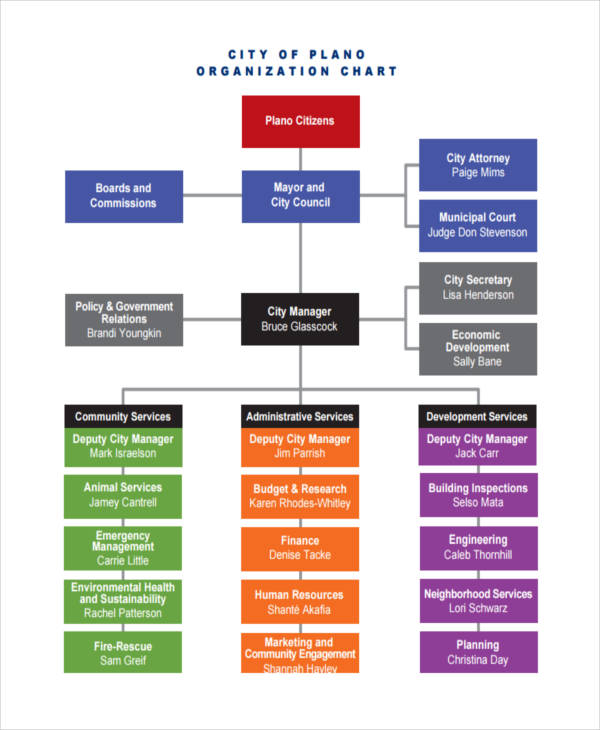
Also called organization chart, organigram, or organogram, an organizational chart is a diagram showing the structure of a certain organization, the relationships and ranks of the positions or jobs. This also refers to similar diagrams, like those that shows the different elements of a field of knowledge. It helps one to visualize the hierarchy of an organization, through graphical presentation. This is also helpful for the members to know who are their immediate heads and to whom they are going to address their concerns.
A tree chart is a way of presenting the hierarchy in a tree-like structure with elements such as a root node, a member that has no superior or parent; nodes, which are linked together with line connections that represent the relationships between the members; and leaf nodes representing members without children child nodes. This is usually used to show family relations, to show the classification in taxonomy, and to show the origin of species. You may also see food chart examples & samples.
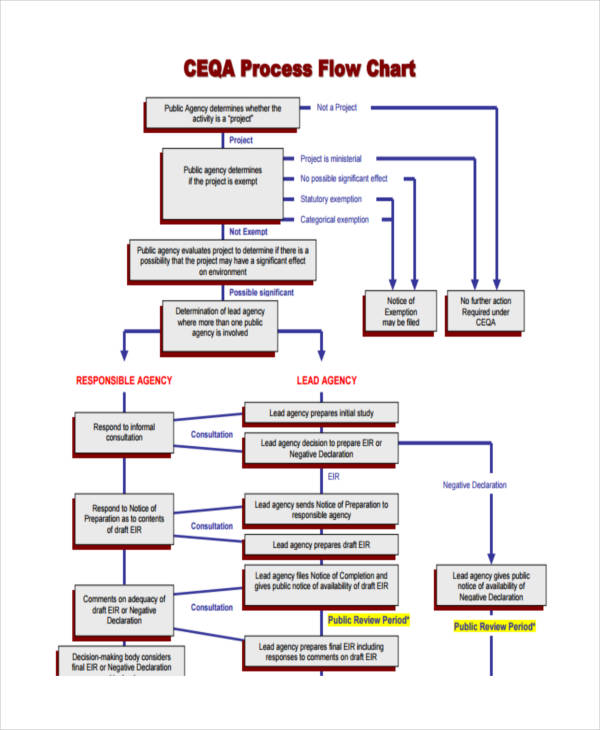
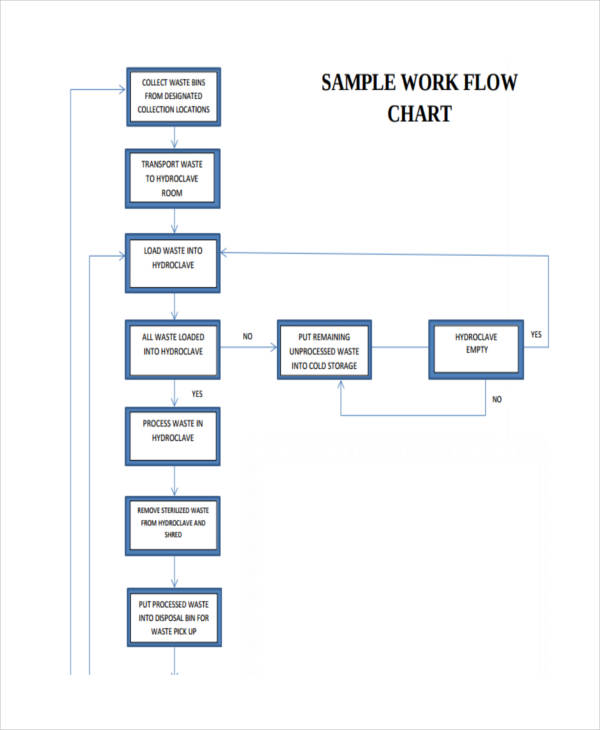
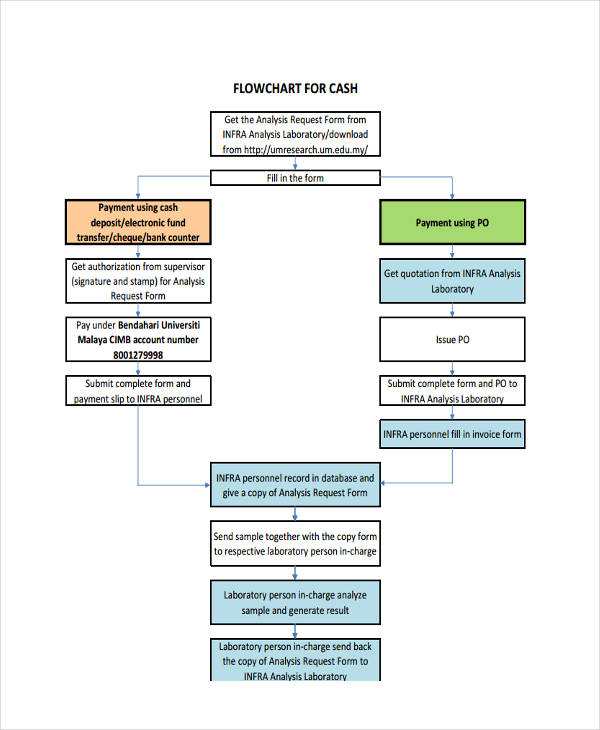
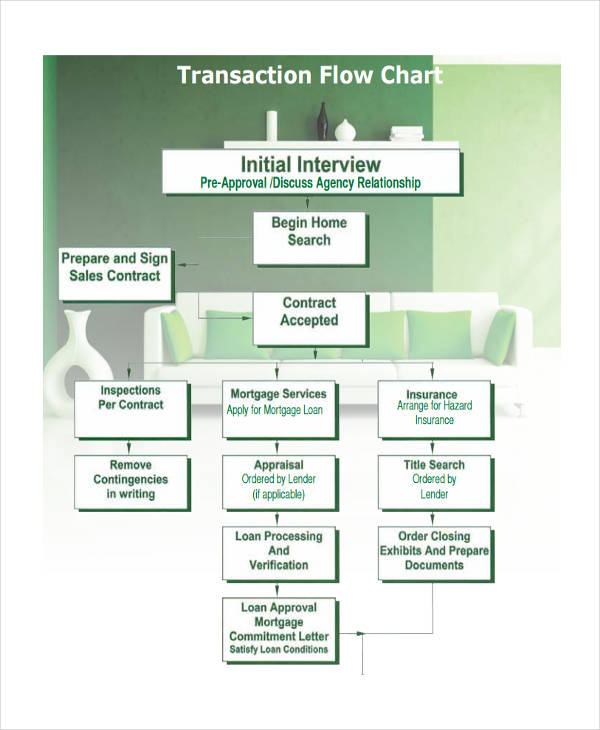
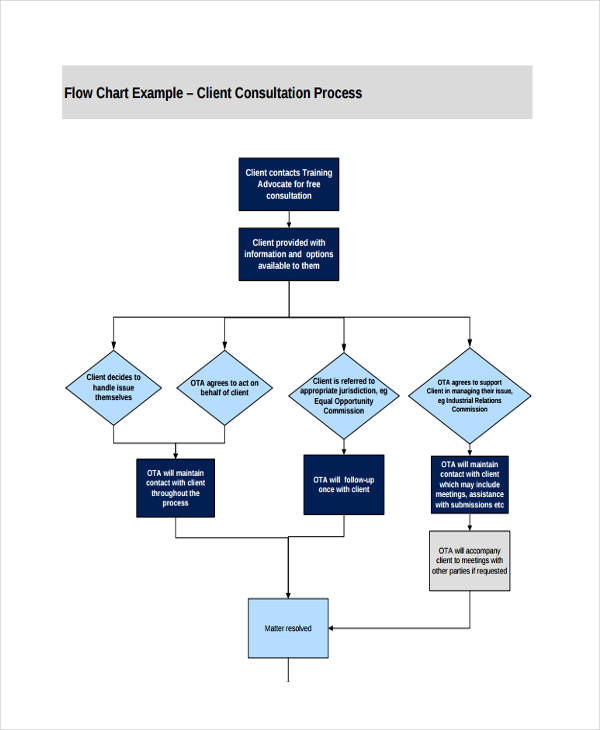
A flow chart or flowchart is a diagram representing a workflow or process. It shows the steps as boxes of different shapes and their order by connecting the boxes with arrows. This also illustrates a solution model to a certain problem. Hence, flow charts are used in designing, documenting, analyzing, or managing a process or program for they help visualize what is going on and understand a process or step. This also helps is finding flaws and bottlenecks in a process.
An area chart, also called area graph, shows quantitative data through a graphical representation based on the line chart. The space between axis and line are emphasized with colors or hatchings. In an area chart, two or more quantities are being compared. This chart, as well as the line, bar, and pie charts, is credited to William Playfair. The first area charts in history are contained in his book The Commercial and Political Atlas which is published in 1786. You may also like color chart examples & samples.
A cartogram is a type of map in which a mapping variable is substituted for land area or distance, for example, travel time, population, or GNP of a certain area. It has a fairly long history, with examples that can be traced back in the mid-1800s. You may also check out size chart examples & samples.
Sometimes, the geometry or space of the map is distorted in order to convey the variable’s information, displaying emphasis for that certain variable. Cartogram can be classified as either area cartogram or distance cartogram.
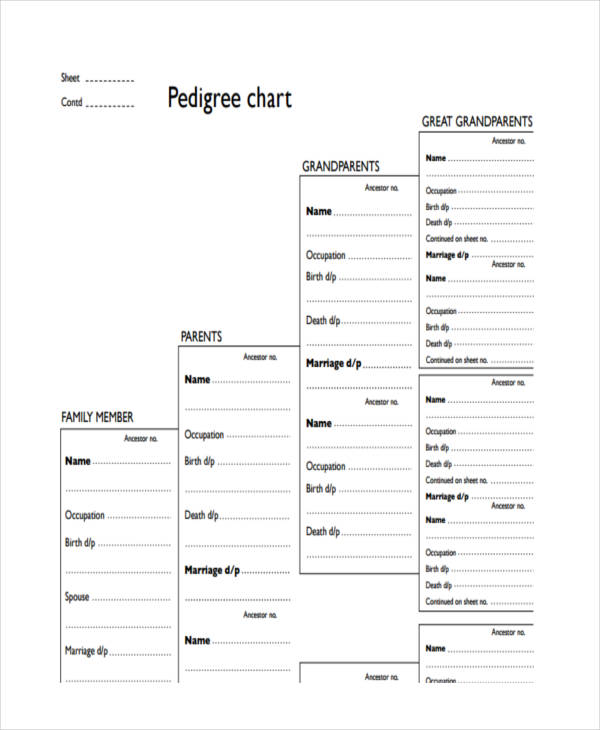
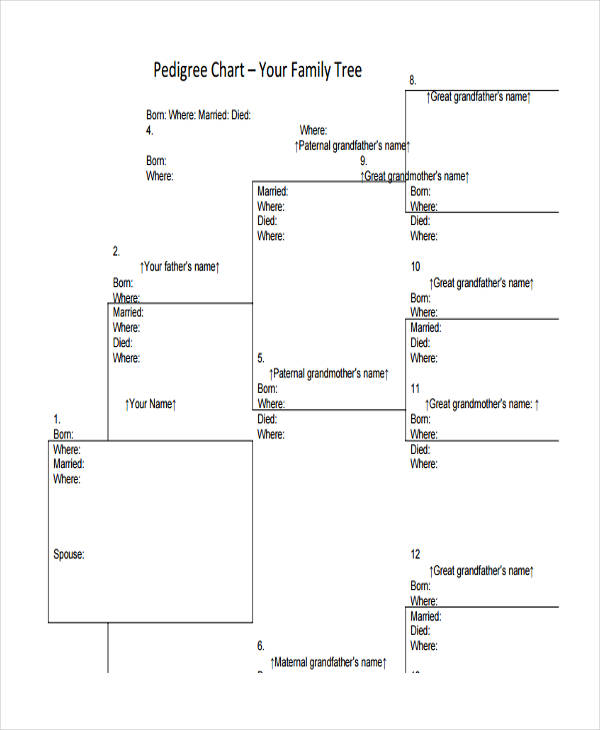
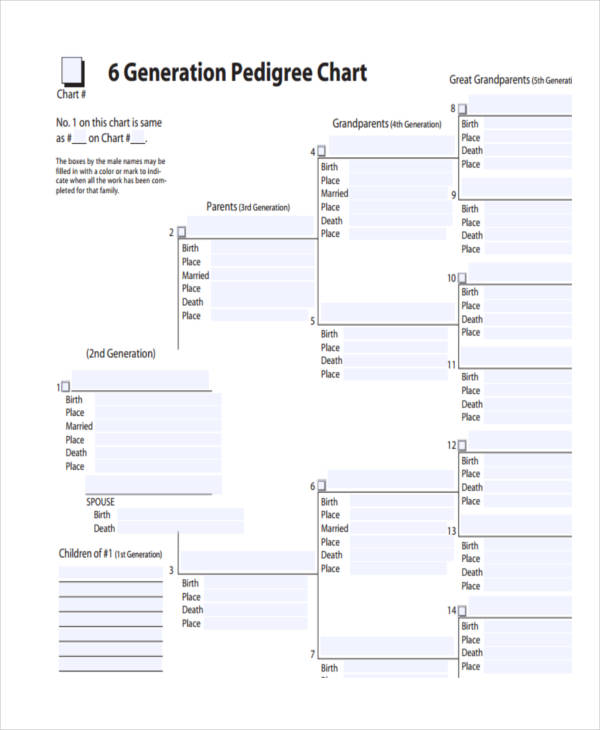
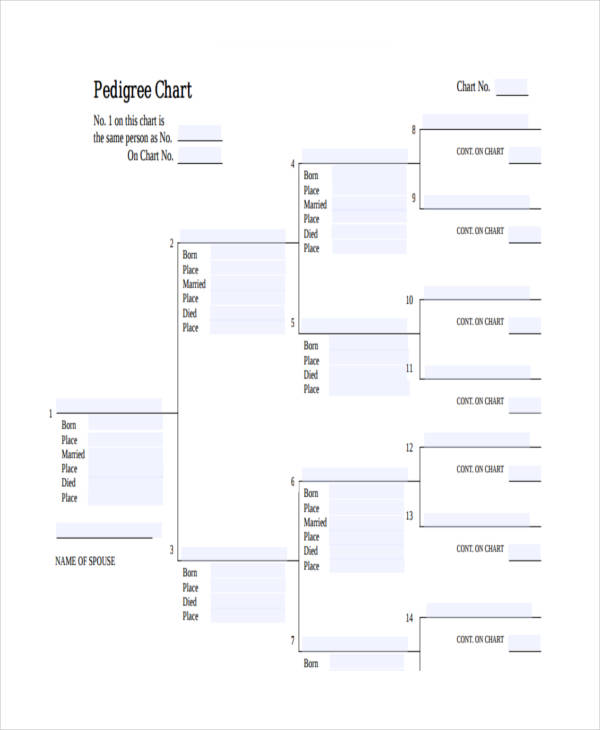
A pedigree chart shows the occurrence and appearance of a particular gene or organism from one generation to the next.
Commonly, this relates to the genes of humans, show dogs, and race horses. This term is coined from the French word pied de gue, which literally means crane’s foot. This is termed as such because the typical and split lines resemble the thin leg and foot of a crane. This chart uses a standardized set of symbols, with squares representing males and circles representing females. You might be interested in measurement chart examples & samples.
A bubble chart is a chart that displays three dimensions of a certain data. It is appropriate when your data has three data series that each contain a certain value.
The triplet of the data is often plotted as a disk, expressing two of the vi values through the disk’s xy location and the third one through its size. This chart is helpful in understanding social, medical, economical, and other scientific relationships. This can be considered a variation of the scatter plot, only that the data points are replaced with bubbles. You may also see blood chart examples & samples.
A polar area diagram is similar to a pie chart, except for its sectors with equal angles and differ in how far each sector extends from the center of the circle.
The chart is often used to plot cyclic phenomena or counting the deaths in each month for a year. Its first known use was by André-Michel Guerry, which he called courbes circulaires, in an 1829 paper which shows seasonal and daily variation in wind direction over the year and births and deaths by hour of the day. You may also like exercise chart examples & samples.
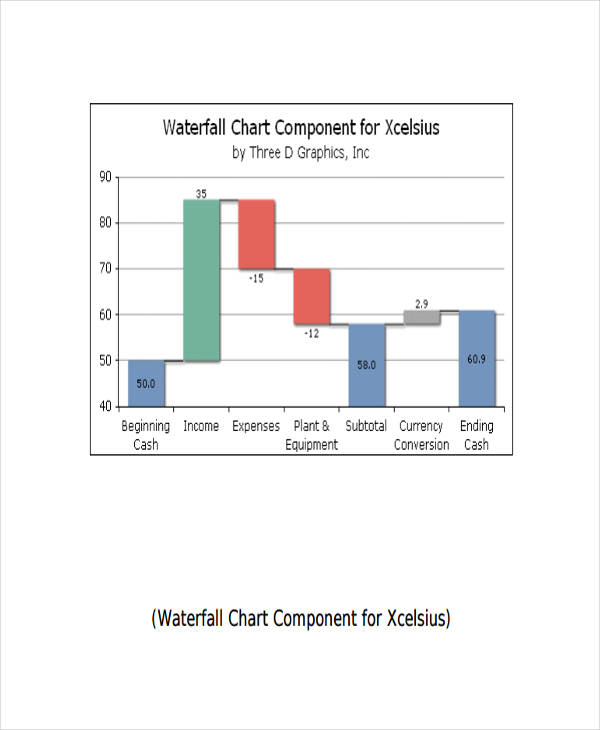
A waterfall chart is data visualization that helps in understanding the cumulative effect of sequentially introduced positive or negative values which can either be time-based or category-based. It is also known as a flying bricks chart or Mario chart because of its apparent suspension of bricks in midair. You may also see height and weight chart examples & samples.
Complexity can be added by incorporating multiple total columns and values that cross the axis. These charts were popularized by consulting firm McKinsey & Company in its presentations to its clients.
A radar chart is a graphical presentation of multivariate data in the form of a two-dimensional chart with three or more quantitative variables on its axes. This is also called web chart, spider chart, star chart, polar chart, cobweb chart, irregular polygon, polar chart, or Kiviat diagram. This consists of a sequence of equi-angular spokes, the so-called radii, with each spoke representing one variable. You may also like diet chart examples & samples.
The data length of a spoke is proportional to the magnitude of the variable and a line is drawn connecting the data values for each spoke, giving the chart a star-like appearance.
A tree map or treemap displays hierarchical data in a nested rectangles. Each branch is tiled with smaller rectangles that represent sub-branches. Leaf nodes are colored to show a separate dimension of the data and has an area proportional to a specified dimension of the data. You may also check out business flow chart examples & samples.
Tree maps are useful because they present correlations of the tree structure through the different colors so that one can immediately see the patterns that may seem difficult to understand using the raw data.
A stream graph or streamgraph is a stacked area graph that is displaced around a central axis, resulting in a flowing, organic shape and was popularized by Lee Byron in a February 2008 New York Times article. Stream graphs are helpful especially in deciphering the graph and exploring its data and are better for giving a more general view of the data. They work significantly better as an interactive piece rather than a static or printed graphics. You might be interested in measurement chart examples & samples.
A GapChart is a chart for displaying time series data by using non-overlapped thick curves.
At each time step, a curve represents the transition part of the chart which can partially overlap but never totally. This was credited to Fred Vernier and Charles Perin. They were assisted by Jeremy Boy, helping them to improve the original design to its current form. This can be used in sports championship points and rankings as well as in finance in comparing stocks or fund yields. You may also see weekly chart examples & samples.
An open-high-low-close chart, often abbreviated as OHLC, is a chart that is usually used to illustrate movements in the price of a financial instrument over time.
The vertical line represents the price range over one unit of time. The left tick marks indicate the opening price for that time period while the right tick marks represent the closing price for that time period. This can be modified in a way that bars may be shown in different hues depending on whether prices increase or decrease during that period. You may also like exercise chart examples & samples.
A candlestick chart, also called Japanese candlestick chart, is a financial chart describing price movements of a derivative, security, or currency.
This is termed as such because each data is presented in a candlestick-like structure, with each candlestick representing one day, although there are variations in which each candlestick represents longer or shorter than one day. This is used to represent trading patterns over short periods of time and in the analysis of equity and currency price patterns. You may also check out music chart examples & samples.
The Kagi chart is used for tracking price movements and to make decisions on purchasing stock. This is one of the charts that are commonly used by investors in making economic decisions with regard to stocks as they are proven effective in showing a clear path of the price movements. You may also see management flow chart examples & samples.
It is independent of time, and the change in the direction of the trend only occurs when a specific amount is reached. This was developed in Japan during the 1870s when the Japanese stock market started trading.
This is a very small line chart that are drawn without axes or coordinates but still presenting the general shape of the variation in some measurement over time.
Sparklines can be used in determining the trend in the temperature or stock market price, presenting the information in a simple and concise way. These are small enough to be embedded in text as they are intended to be succinct, memorable, and can be easily understood or deciphered by the readers. You may also like nursing flowchart examples & samples.
This is a chart presented in a square diagram used to predict an outcome of a particular cross or breeding experiment. Named after Reginald C.
Punnett, who devised this approach, this is used by biologists to determine the probability of an offspring having a particular genotype, presenting a tabular summary of possible combinations of maternal alleles with paternal alleles to come up with probabilities of a trait of the offspring. This is said to be a visual representation of Mendelian inheritance. You may also check out project flow chart examples & samples.
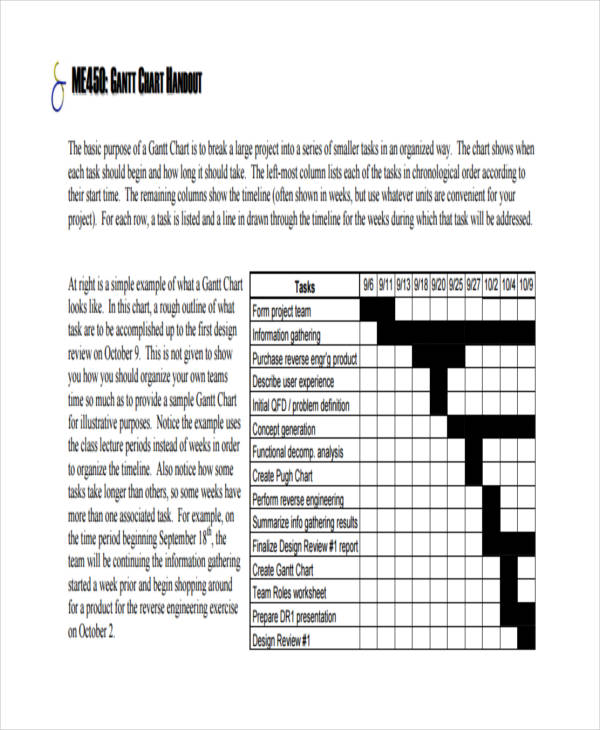
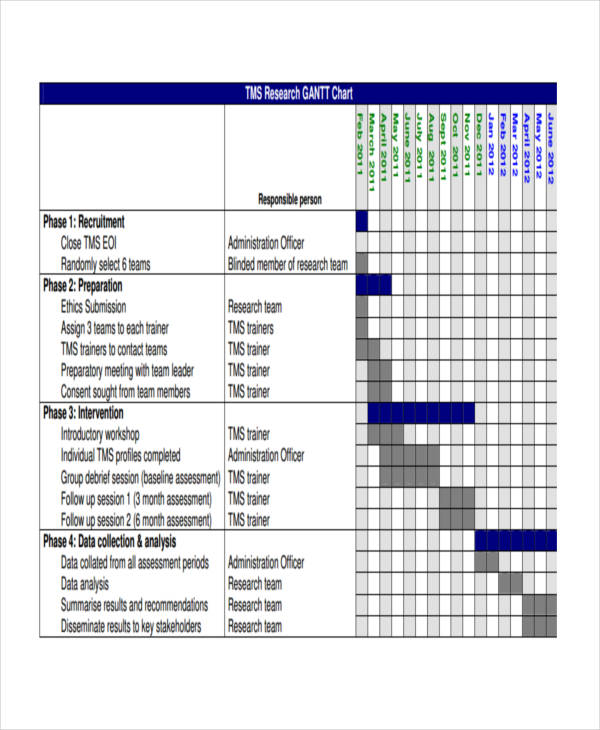
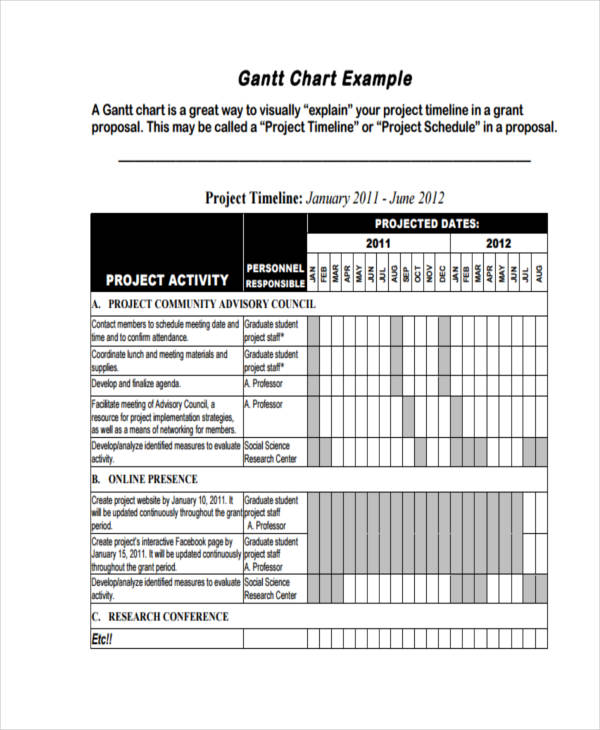
A Gantt chart, named after its inventor, Henry Gantt, illustrates a project schedule as well as the dependency relationships between activities and current schedule status. It usually lists the tasks to be performed on the vertical axis, while listing the time intervals on the horizontal axis, illustrating the start and finish dates of a certain activity. You might be interested in business flow chart examples & samples.
This chart can be used to show current schedule status through shading the portion of the finished task relative to its percentage of completion.
This chart is a political spectrum diagram invented by David Nolan in 1969, which divides human political views into two vectors, the economic opinion and personal opinion, producing a type of Cartesian chart. It was originally termed as philosophy populism but many later renditions of the basic chart have used the label authoritarianism, statism, totalitarianism, or fascism.
The positions are as follows: the top left of the chart is the left-wing political philosophies supporting low economic freedom and high personal freedom; the bottom right is the right-wing political philosophies supporting high economic freedom and low personal freedom; the top right are the libertarians supporting both high economic freedom and personal freedom; the center is the centrism who favors a mixed system balancing both economic and personal freedom with the need for some market regulation as well as personal sacrifice. You may also see event flow chart examples & samples.
The program evaluation and review technique, commonly abbreviated as PERT, is used in project management, designed to analyze and represent the tasks involved in completing a given project and was commonly used in conjunction with the critical path method (CPM), hence popularly called PERT-CEM. This is first developed by the United States Navy in the 1950s. You may also see chore chart examples & samples.
Invented by Phillip H. Smith, this chart is designed for electrical and electronics engineers specializing in radio frequency engineering to help solve problems with regard to transmission lines and matching circuits. It is used to simultaneously display multiple parameters such as admittance, impedance, reflection coefficients, noise figure circles, scattering parameters, constant gain contours, and regions for unconditional stability. You may also like recruitment flow chart examples & samples.
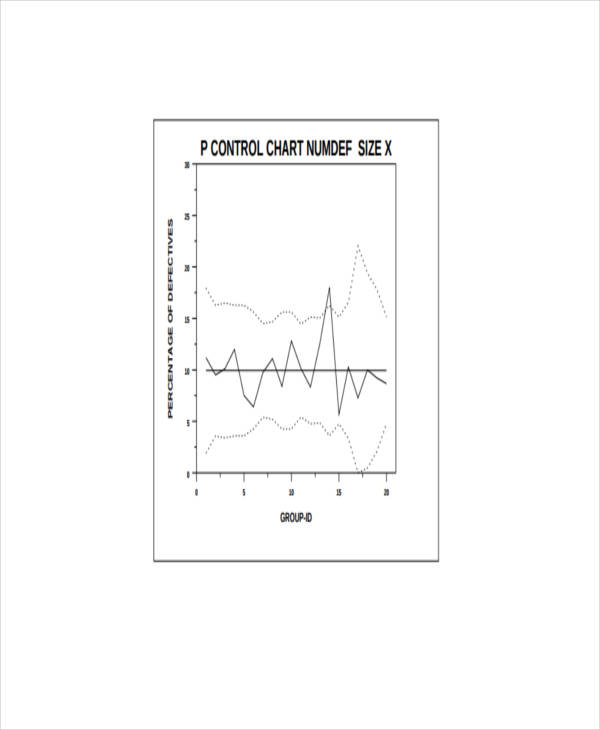
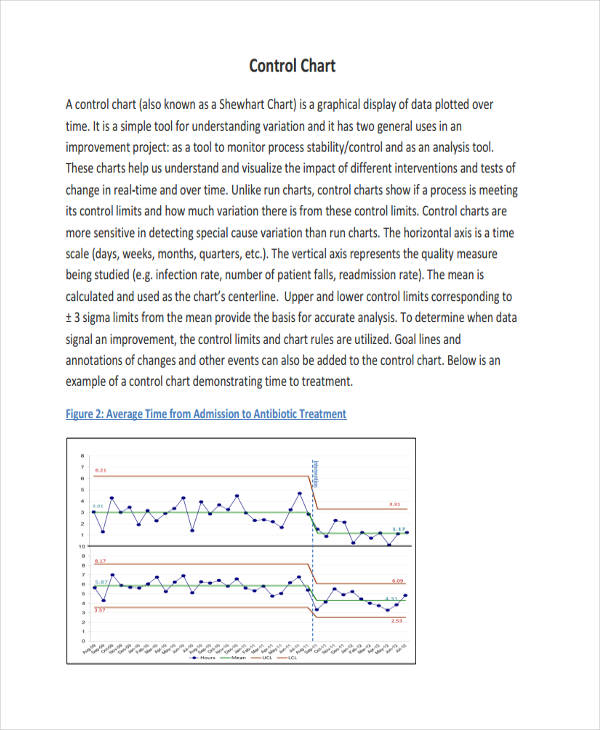
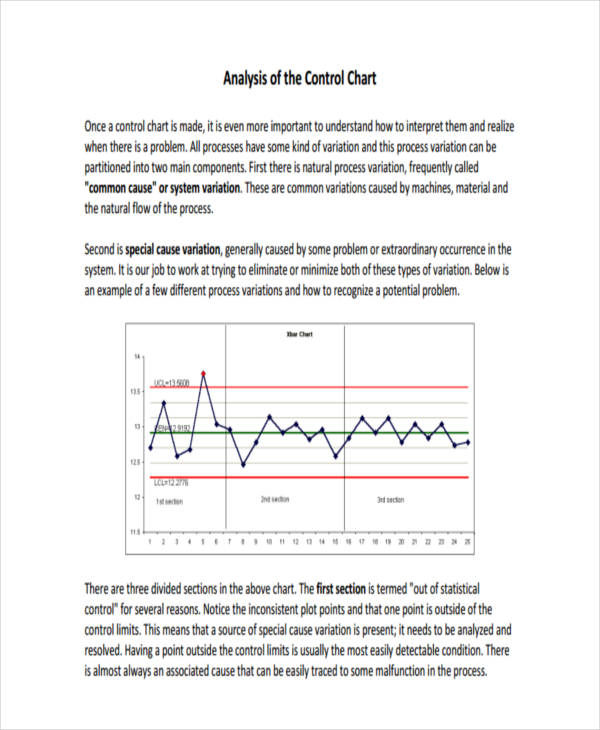
Also known as Shewhart charts which is named after Walter A. Shewhart or process-behavior charts, these charts are a statistical process control tool to determine the state of control in a manufacturing or business process. If analysis of the chart indicates that the process is in control, no corrections are needed. On the other hand, if analysis indicates that the process is not in control, the sources of variation must be identified and it needs to be improved. You may also check out pareto chart examples & samples.
Greninger chart, in crystallography, shows angular relations between zones and planes in a crystal. It is a tool to determine g and d for a fixed sample-to-film distance, keeping track the relative arrangement of the sample to the film, if photographic film is used. When using a Polaroid or instant film, the arrangement of the face of the film in the camera must be noted. You might be interested in marketing flow chart examples & samples.
A heat map or heatmap is a graphical representation of data with the use of different colors. Different color schemes can be used to illustrate the heatmap, but rainbow colormaps are often used, because it is said that humans can perceive more shades of color in a rainbow than they can of gray. You may also see seating chart examples & samples.
However, the changes between colors in a rainbow-colored heatmap would lead to perception of gradients that are not actually present, which may obscure detail rather than enhancing it.
Natal chart, also known as horoscope map, celestial map, sky-map, star-chart, cosmogram, vitasphere, radical chart, radix, chart wheel, or astrological chart, represents the positions of the planets, Moon, Sun, and other astrological bodies the birth of a person. This often refers to an astrologer’s interpretation based on a system of astrology, making predictions that are said to be anchored on celestial influences. You may also like flowchart examples for students.
A nomogram, also called a nomograph, abaque, and alignment chart, is a a two-dimensional diagram designed to perform approximate graphical computation of a mathematical function. Philbert Maurice d’Ocagne, a French engineer, invented the field of nomography in 1884. It was used extensively for many years, providing engineers with fast graphical calculations of complicated formulas. You may also check out chord chart examples & samples.
Named after Vilfredo Pareto, Pareto chart contains both bars and a line graph in which individual values are represented by bars in descending order. The cumulative total is represented by a line.
The left vertical axis usually represents the frequency of occurrence while the right vertical axis represents the cumulative percentage of the total number of occurrences or total of any unit of measure. This chart is helpful in highlighting the most important among a set of factors, the source of defects, the most frequent reasons of customer complaints, and many others. You might be interested in wedding seating chart designs and examples.
A run chart, also known as a run-sequence plot, is a form of line chart that displays observed data in a given time sequence with the data representing an output or performance of a manufacturing or any other business process.
A strip chart is a type of chart that is considered as a good complement to boxplots but can also be a good alternative to boxplots when there is a small sample size. It produces only one dimension of scatter plots of any given data; hence, they are called one-dimensional scatter plots or dot plots. You may also see basic flow chart examples & samples.
A structure chart shows the breakdown of a system to its lowest manageable levels. They are to arrange program modules into a tree in structured programming, with each module represented by a box containing the module’s name.
The structure gives an overall view of the relationships between modules. This chart depicts the size and complexity of the system, the number of functions as well as the modules within each function, and whether each identifiable function can still be broken down into smaller components. You may also like flow chart examples.
A vowel chart is a schematic arrangement of the vowels that can be in a triangular or quadrilateral form. The vertical position represents the vowel closeness while the horizontal position represents the vowel backness. The main features of the vowels do not contain differences in voicing, manner, or articulators, and they only differ in the position of the tongue when voiced. You may also check out chart examples in excel.
A vowel chart provides convenient reference points and specify tongue position when pronouncing a vowel. The highest point of the arch of the tongue is the point of articulation, and the vertical dimension of the vowel diagram is known as vowel high.
Different charts perform different functions. In general, charts are used to summarize raw, complicated data for it to be understandable and easily readable by the readers. There are specific charts that are appropriate for a specific graphical illustration, and one must understand and know well the types of charts for him or her to use an appropriate chart.
Lastly, do not forget to check out the examples of the different types of charts in the previous section.