Flowcharts with this comprehensive guide designed to demystify the process of creating and understanding flowcharts for educators and students alike. Flowcharts are visual representations of processes or workflows, breaking down complex operations into manageable, sequential steps. This guide, enriched with practical examples, aims to equip teachers with the tools to enhance lesson plans and foster an interactive learning environment. By integrating flowcharts into teaching methodologies, educators can simplify complicated concepts, making them more accessible and engaging for students.
What are Flowcharts?
Flowcharts are diagrammatic representations that illustrate a sequence of actions or steps within a process, using distinct symbols to denote different types of actions. Essential in both educational and professional settings, they serve as a powerful tool for simplifying and communicating complex processes. By visually mapping out the path from start to finish, flowcharts help students and professionals alike understand and analyze workflows, making problem-solving more accessible and effective.
Flowchart Tips
Creating an effective flowchart requires understanding its purpose: to visually represent a process or system. Here are essential tips for educators and students to craft clear and informative flowcharts:
- Start with a Clear Objective: Define the process or problem your flowchart will address. A well-defined goal ensures your flowchart remains focused and easy to understand.
- Use Standard Symbols: Stick to universally recognized symbols (e.g., rectangles for processes and diamonds for decisions) to maintain clarity and facilitate comprehension among all users.
- Keep it Simple: Avoid cluttering your flowchart with too much information. Use short, descriptive labels and break down complex processes into manageable steps.
- Maintain Flow Direction: Typically, flowcharts flow from top to bottom or left to right. Consistent direction aids in readability and understanding.
- Check for Accuracy and Completeness: Ensure your flowchart accurately represents the process and includes all necessary steps and decisions. Reviewing and testing the flowchart can uncover potential oversights.
These tips aim to enhance the effectiveness of flowcharts, making them powerful tools for teaching and learning complex processes.
History
The history of flowcharts dates back over a century, marking their significance in simplifying and communicating complex processes. Here are key milestones in the development of flowcharts:
- Early 20th Century Origins: The concept of flowcharts emerged in the early 1920s with industrial engineers Frank and Lillian Gilbreth introducing the “Process Chart” to document workflows.
- Standardization in the 1940s: Flowcharts gained popularity during the 1940s as a tool for simplifying and documenting computer algorithms and manufacturing processes.
- ANSI and ISO Standards: In the 1960s and 1970s, the American National Standards Institute (ANSI) and the International Organization for Standardization (ISO) developed standard symbols and rules for flowchart creation, promoting uniformity and easier interpretation across different fields.
- Digital Evolution: With the advent of personal computers and software in the late 20th century, digital flowchart tools became available, making it easier to create, modify, and share flowcharts.
- Modern Applications: Today, flowcharts are used in education, business, software development, and many other areas to visualize processes, solve problems, and facilitate understanding.
The evolution of flowcharts reflects their enduring value in organizing and presenting information, demonstrating their vital role in both historical and contemporary contexts.
Flowchart Symbols
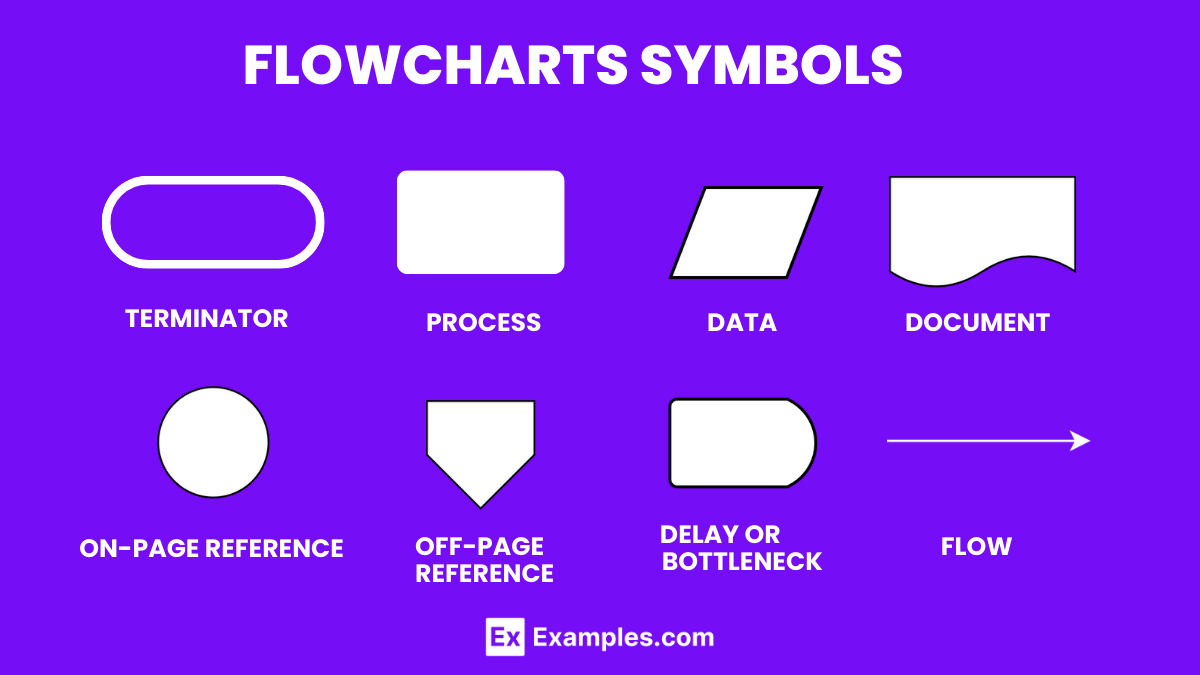
Flowchart symbols are integral to understanding and creating flowcharts, a graphical representation of a process or system. Each symbol has a specific meaning and function, guiding the viewer through the flowchart’s steps with clarity. These symbols include terminals, processes, decisions, and more, each contributing to the detailed depiction of complex procedures. This guide offers insights into the most common flowchart symbols, helping educators and students alike navigate and construct flowcharts effectively, enhancing learning and communication in subjects ranging from computer science to business processes.
Terminal/Terminator
- Represents the start and end points of a flowchart. Shaped like an oval or rounded rectangle, it indicates the process’s initiation or conclusion.
- Example: Marking the beginning of a login process and its successful completion or exit.
Process
- Denotes a step in the process where some action is performed. Shaped as a rectangle, it’s used for most operations within a flowchart.
- Example: A step indicating the action of entering a username and password.
Decision
- A diamond shape that represents a point where a decision must be made, leading to different branches of the process.
- Example: Checking if the entered password is correct; leads to either continuation or a request to re-enter the password.
Document
- Depicts a step that involves a document or report, usually represented by a rectangle with a wavy bottom.
- Example: Generating a report of user login attempts.
Data, or Input/Output
- Parallelogram shape used to represent data entering or exiting the process, such as user input or display messages.
- Example: Inputting user credentials or outputting a login success message.
Stored Data
- Symbolizes data stored for later use, often shown as a cylinder, indicating databases or memory storage.
- Example: Saving user data in a database after successful registration.
Flow Arrow
- Arrows indicate the flow direction from one step to another, showing the process’s sequence.
- Example: Directing from the login decision to the success message.
Comment or Annotation
- Often a bracket or rectangle, provides additional information or clarification about a step without affecting the process flow.
- Example: Annotating a decision symbol with criteria details for clarity.
Predefined Process
- A rectangle with double-struck vertical edges, indicating a sequence of steps that have been predefined.
- Example: A subroutine for validating user credentials, used across multiple flowcharts.
On-page Connector/Reference
- A circle or small label used to connect different parts of a flowchart within the same page, avoiding crossing lines.
- Example: Connecting a long process flow back to an earlier step without drawing a long arrow.
Off-page Connector/Reference
- Similar to on-page connectors but used to link parts of the process that continue on another page, often marked with a page number.
- Example: Directing from a process on one page to a continuation of the process on a different page, ensuring clarity and continuity across the flowchart.
Flowcharts for Computer Programming/Algorithms
Flowcharts serve as a pivotal tool in computer programming and algorithm design, providing a visual representation of the step-by-step execution of a program or process. They help in simplifying complex processes, making it easier for programmers to conceptualize and communicate the logic behind algorithms. Utilizing standardized symbols and arrows, flowcharts offer a universal language for mapping out the flow of data, decision-making processes, and operational sequences, thereby enhancing understanding and facilitating efficient coding practices.
- Sequential Flowchart
- Represents a straightforward process that follows a linear sequence of steps. Ideal for simple programs where actions are performed in a direct sequence, making it clear and easy to follow.
- Conditional Flowchart
- Used for algorithms that include decision-making processes. It visually breaks down the paths a program can take based on certain conditions, illustrating how different scenarios lead to different outcomes.
- Loop Flowchart
- Depicts the iteration of a set of instructions until a specific condition is met. Essential for understanding repetitive processes and how they are controlled within programming.
- Data Flow Diagram
- Focuses on the movement of data through a system rather than detailed process steps. It’s crucial for visualizing how information is processed and stored across various components.
- System Flowchart
- Provides an overview of an entire system, showing the interaction between various subsystems. It’s useful for getting a big-picture understanding of complex systems and their operational flow.
Types of Flowcharts
Flowcharts are categorized based on their purpose and the complexity of the processes they depict. Each type serves a specific role in breaking down and analyzing different aspects of system processes or programming algorithms, ensuring clarity and precision in planning and problem-solving.
- Process Flowchart
- Details every step involved in a process, offering a bird’s-eye view of a procedure. It’s instrumental in identifying redundancies and streamlining operational workflows.
- Workflow Chart
- Illustrates the flow of tasks and responsibilities across roles or departments, highlighting how work progresses in an organizational context.
- Swimlane Flowchart
- Organizes activities into lanes that represent different departments or individuals, clarifying roles and responsibilities within complex processes.
- Decision Flowchart
- Specifically designed to map out the decision-making process, showing various outcomes based on different decisions. It’s particularly useful in planning and strategic analysis.
- Programming Flowchart
- Tailored for software development, this type outlines the sequence of operations in a computer program, making algorithm logic clear and understandable for developers.
How to Plan and Draw a Basic Flowchart
Planning and drawing a basic flowchart involves a clear understanding of the process or system to be depicted. Start by identifying the purpose of the flowchart, which helps in outlining the steps or operations involved. Gather all necessary information about the process, including its start, end, and the various decisions or actions in between. Use standard symbols like ovals for start/end points, rectangles for steps, and diamonds for decisions. Arrange these symbols in the order of the process flow and connect them with arrows to indicate the direction of flow. This methodical approach simplifies complex processes, making it easier for students and teachers alike to visualize and understand workflows, decision-making processes, or algorithms.
Flowchart Basic Procedure
- Identify the Process
- Begin with a clear definition of the process to be charted. For educators, this could be a student’s journey through a learning module, from introduction to assessment.
- Gather Necessary Information
- Collect all relevant details about the process steps, including inputs, outputs, and decision points. This could involve understanding how assessments influence the next steps in a student’s learning path.
- Define Start and End Points
- Mark the beginning and the end of the process clearly. In educational terms, this might be the enrollment in a course and the final evaluation or certification.
- Use Standard Symbols
- Apply universally recognized flowchart symbols to represent different elements (actions, decisions, start/end). For instance, using a diamond shape to denote a decision point, like choosing an elective.
- Draft and Connect Symbols
- Lay out the symbols in sequential order according to the process flow. Connect them with arrows to illustrate the direction of each step or decision. This could visualize a student’s progression options after a midterm assessment.
By adhering to these guidelines, teachers can effectively plan and draw basic flowcharts, enhancing the learning experience by providing students with clear, visual representations of processes. This method not only aids in understanding but also in retaining complex information, fostering a deeper comprehension of the subject matter.
Benefits of Flowchart
Flowcharts are invaluable tools that simplify the understanding of complex processes by breaking them down into clear, step-by-step diagrams. They enhance communication, streamline problem-solving, and facilitate decision-making by visually representing the sequence of actions or steps in a process. This graphical representation is essential in education, where teachers use flowcharts to explain intricate subjects more effectively, and students leverage them to organize information and improve their learning strategies.
- Clarifies Complex Processes
- Flowcharts break down complicated procedures into understandable segments, making it easier to grasp how processes unfold.
- Enhances Problem-Solving
- By visually mapping out a problem, flowcharts help identify bottlenecks and inefficiencies, leading to more effective solutions.
- Improves Communication
- They provide a universal language that simplifies the explanation of complex ideas, enhancing understanding among diverse audiences.
- Facilitates Documentation and Planning
- Flowcharts are crucial in documenting stages of a process for future reference and planning, ensuring consistency and efficiency.
- Supports Efficient Decision Making
- The visual layout of decision paths allows for easier analysis and quicker decision-making by clearly showing outcomes of different choices.
How the Flow Charts are Used in Different Fields
Flowcharts are versatile tools utilized across various fields to map out processes, making them indispensable in education, business, programming, manufacturing, and management. By offering a visual representation of sequential steps, they assist in planning, analyzing, and executing complex tasks.
- Education
- Teachers use flowcharts to illustrate scientific processes and historical events, simplifying learning for students.
- Software Development
- Programmers create flowcharts to plan algorithms before coding, ensuring logical sequence and functionality.
- Business Process Management
- Businesses implement flowcharts to outline workflows, optimizing operations and enhancing productivity.
- Manufacturing
- In manufacturing, flowcharts detail production processes, from raw materials to finished products, identifying potential areas for improvement.
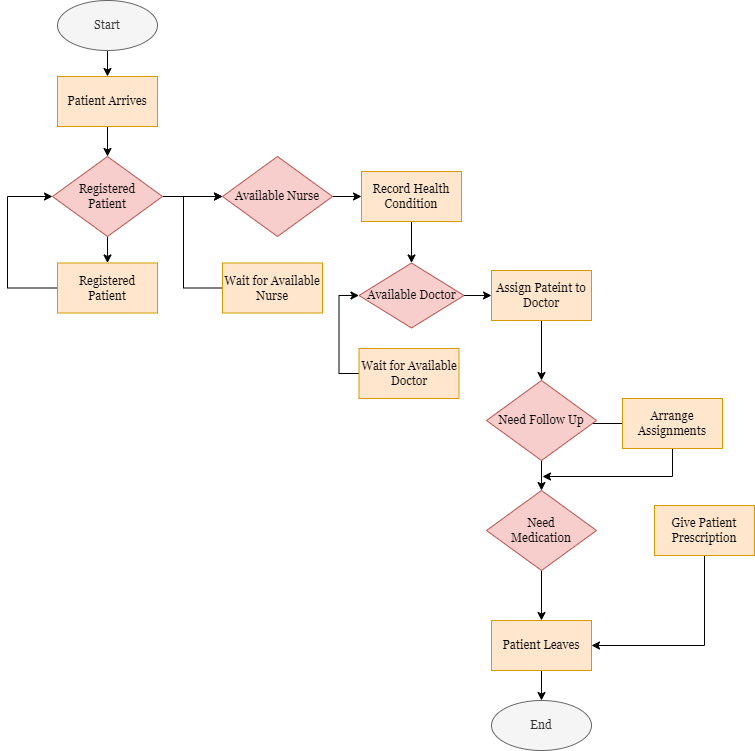
- Healthcare
- Healthcare professionals use flowcharts for patient care pathways, ensuring standardized treatment protocols are followed.
When and Where to Use Flowcharts
Flowcharts are most effective when detailing the sequence of steps in a process, making them crucial in planning, analysis, education, and problem-solving. Their use is particularly beneficial when a visual representation can facilitate understanding, communication, or documentation of processes.
- Problem Solving
- Ideal for dissecting and solving complex problems by visually organizing possible solutions and outcomes.
- Process Documentation
- Essential for recording the steps in a process, serving as a guide for current operations and a blueprint for training materials.
- Educational Purposes
- In educational settings, flowcharts help explain complex concepts, aiding students in visual learning and comprehension.
- System Design and Analysis
- Crucial in the initial stages of system design, flowcharts help in understanding, analyzing, and communicating system requirements.
- Quality Control
- Used to ensure quality and compliance in manufacturing and service delivery by outlining standard operating procedures.
In conclusion, Flowcharts serve as an indispensable tool in both educational and professional settings, simplifying complex processes into understandable, step-by-step visual representations. They aid teachers in illustrating procedural concepts clearly, thereby enhancing students’ comprehension and ability to follow logical sequences. Embracing flowcharts in teaching methodologies not only improves communication but also fosters critical thinking and problem-solving skills among students, making learning more engaging and effective.