Preparing for the CFA Exam requires a thorough understanding of “Understanding Business Cycles,” a key element in economic analysis. Mastery of the phases, causes, and effects of business cycles is essential. This knowledge aids in making informed financial decisions and understanding macroeconomic fluctuations, crucial for achieving a high CFA score.
Learning Objective
In studying “Understanding Business Cycles” for the CFA Exam, you should aim to comprehend the different phases of business cycles, including expansion, peak, contraction, and trough. Analyze the economic indicators that predict and reflect these phases, such as GDP growth rates, unemployment levels, and inflation rates. Evaluate the underlying theories explaining the causes of business cycles, such as Keynesian and Monetarist perspectives. Additionally, explore how these cycles impact investment strategies, market sentiment, and policy making. Apply this knowledge to interpret macroeconomic data, predict economic trends, and make informed investment decisions under varying economic conditions.
Introduction to Business Cycles
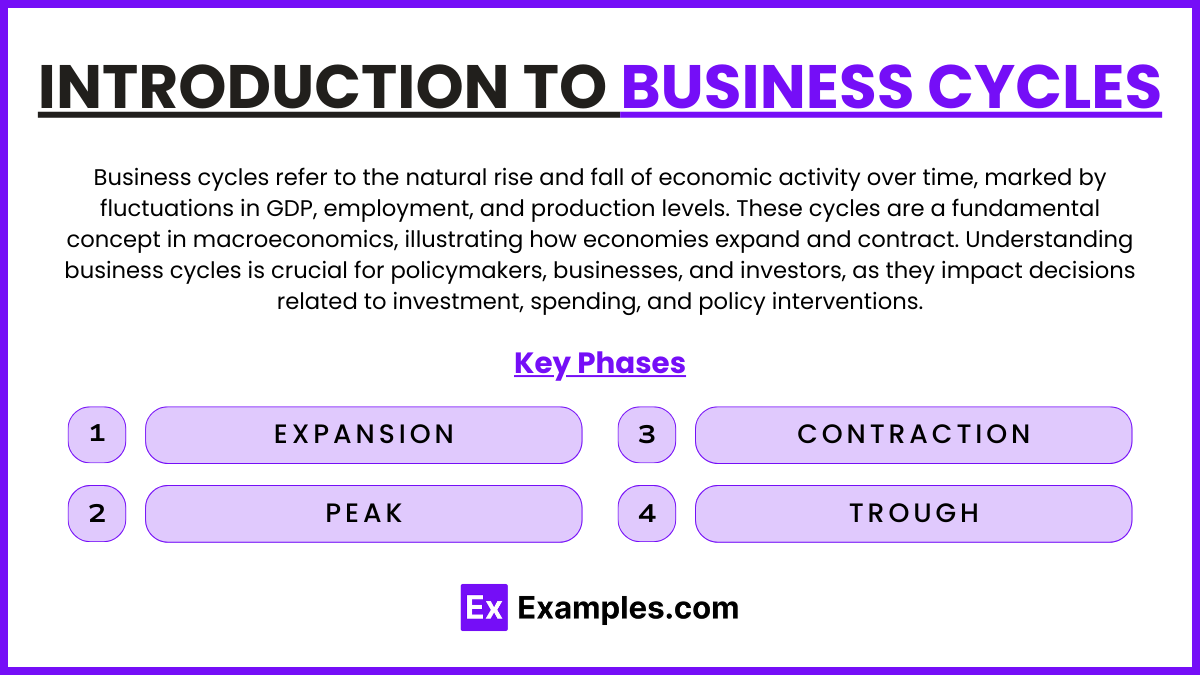
Business cycles refer to the natural rise and fall of economic activity over time, marked by fluctuations in GDP, employment, and production levels. These cycles are a fundamental concept in macroeconomics, illustrating how economies expand and contract. Understanding business cycles is crucial for policymakers, businesses, and investors, as they impact decisions related to investment, spending, and policy interventions.
Key Phases of the Business Cycle
- Expansion: This phase is characterized by increasing economic activity, with rising GDP, higher employment, and growing consumer demand. Businesses invest in production, and optimism prevails in the market.
- Peak: The peak marks the height of economic growth. At this stage, resources are fully utilized, inflation may rise, and growth begins to slow as the economy reaches its limits.
- Contraction (Recession): Economic activity declines, GDP falls, and unemployment rises as consumer and business spending decrease. This phase can range from mild to severe, depending on various factors.
- Trough: The lowest point of economic activity, the trough marks the end of the recession. It’s a turning point, as the economy begins to recover and move back into expansion.
Economic Indicators and Business Cycles
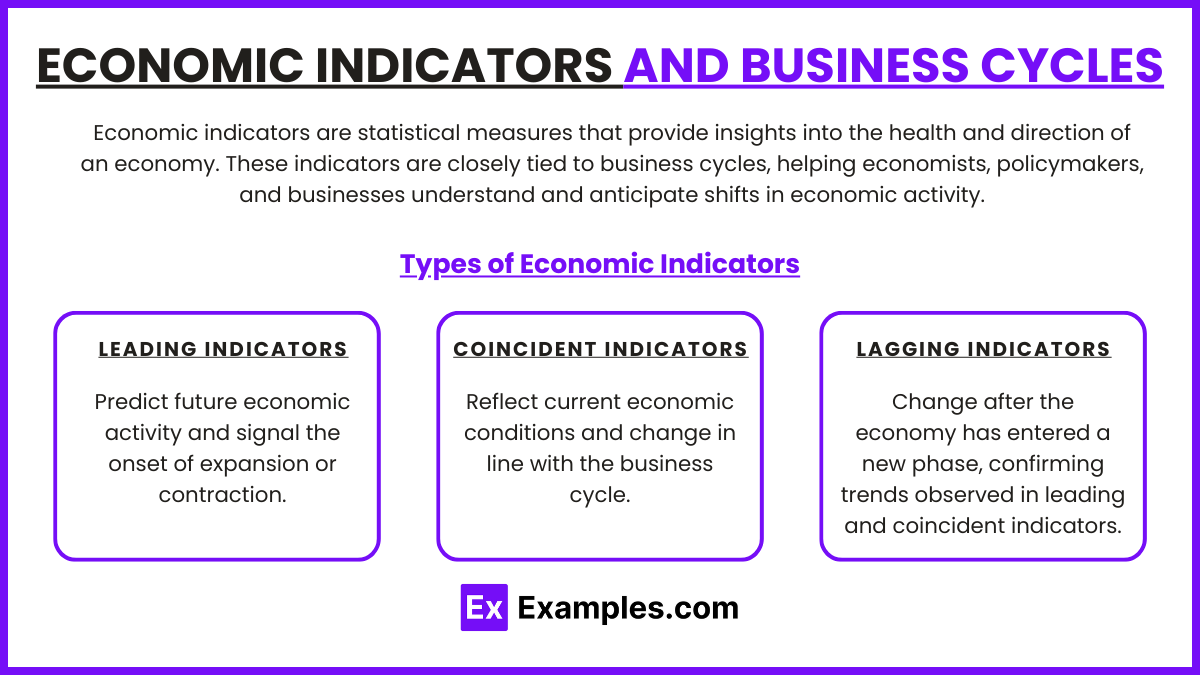
Economic indicators are statistical measures that provide insights into the health and direction of an economy. These indicators are closely tied to business cycles, helping economists, policymakers, and businesses understand and anticipate shifts in economic activity. Here’s how key economic indicators relate to the different phases of the business cycle:
Types of Economic Indicators
- Leading Indicators: Predict future economic activity and signal the onset of expansion or contraction.
- Examples: Stock market performance, new orders for durable goods, and consumer confidence index.
- Business Cycle Role: Useful for forecasting changes in the economy, as these indicators often shift before the business cycle phase changes.
- Coincident Indicators: Reflect current economic conditions and change in line with the business cycle.
- Examples: GDP, employment levels, and retail sales.
- Business Cycle Role: Coincident indicators confirm the current phase of the business cycle, whether it’s expansion, peak, contraction, or trough.
- Lagging Indicators: Change after the economy has entered a new phase, confirming trends observed in leading and coincident indicators.
- Examples: Unemployment rate, consumer price index (CPI), and business spending.
- Business Cycle Role: Provide confirmation of economic trends after they occur, useful for assessing the cycle’s long-term impact.
Theories Behind Business Cycles
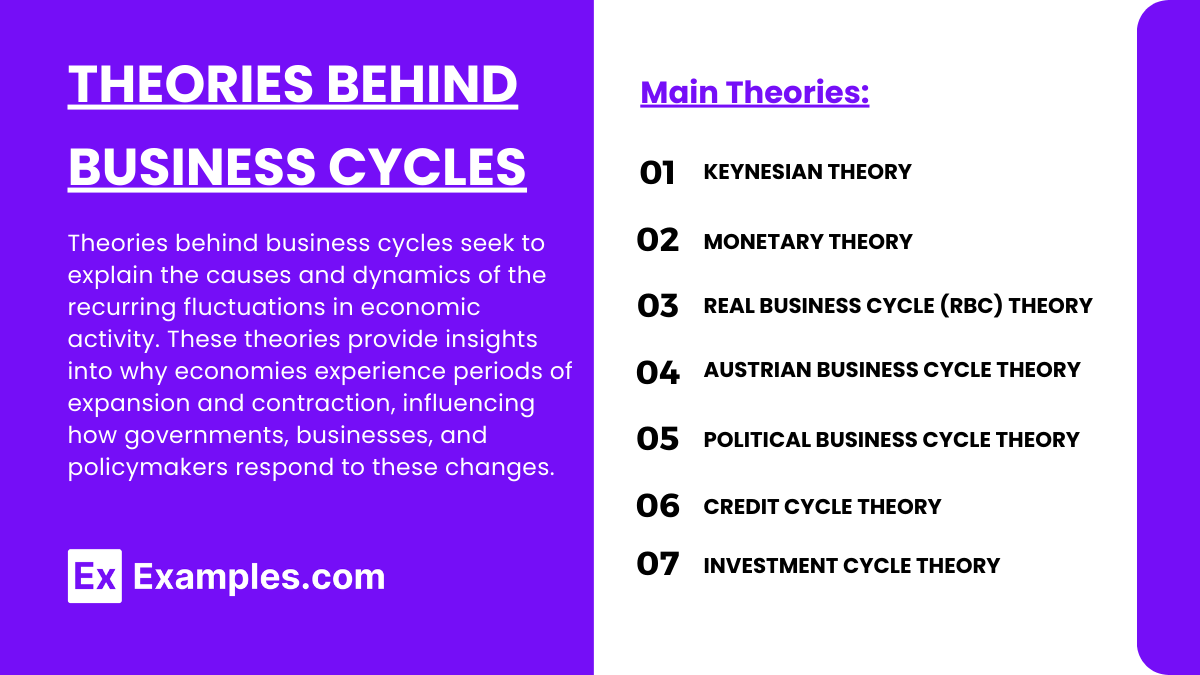
Theories behind business cycles seek to explain the causes and dynamics of the recurring fluctuations in economic activity. These theories provide insights into why economies experience periods of expansion and contraction, influencing how governments, businesses, and policymakers respond to these changes. Here are the main theories explaining business cycles:
1. Keynesian Theory
- Cause: Fluctuations in aggregate demand lead to expansions and recessions.
- Policy: Advocates government intervention (e.g., spending and tax cuts) to stimulate demand during downturns.
2. Monetary Theory
- Cause: Changes in money supply impact interest rates, investment, and economic activity.
- Policy: Recommends careful management of money supply and interest rates to avoid inflation and deflation.
3. Real Business Cycle (RBC) Theory
- Cause: Real shocks like technological changes affect productivity and economic cycles.
- Policy: Suggests minimal intervention, as cycles are seen as natural adjustments to real shocks.
4. Austrian Business Cycle Theory
- Cause: Artificially low interest rates cause excessive borrowing and misallocated resources.
- Policy: Advocates limiting central bank interventions to prevent asset bubbles.
5. Political Business Cycle Theory
- Cause: Politically motivated policies before elections can create short-term economic growth.
- Policy: Suggests avoiding election-driven fiscal policies that destabilize the economy.
6. Credit Cycle Theory
- Cause: Changes in credit availability drive expansions and contractions.
- Policy: Calls for careful regulation of lending practices to prevent excessive credit growth.
7. Investment Cycle Theory
- Cause: Changes in investment amplify economic cycles.
- Policy: Supports stabilizing investment, like infrastructure spending during downturns.
Business Cycles and Investment Strategies
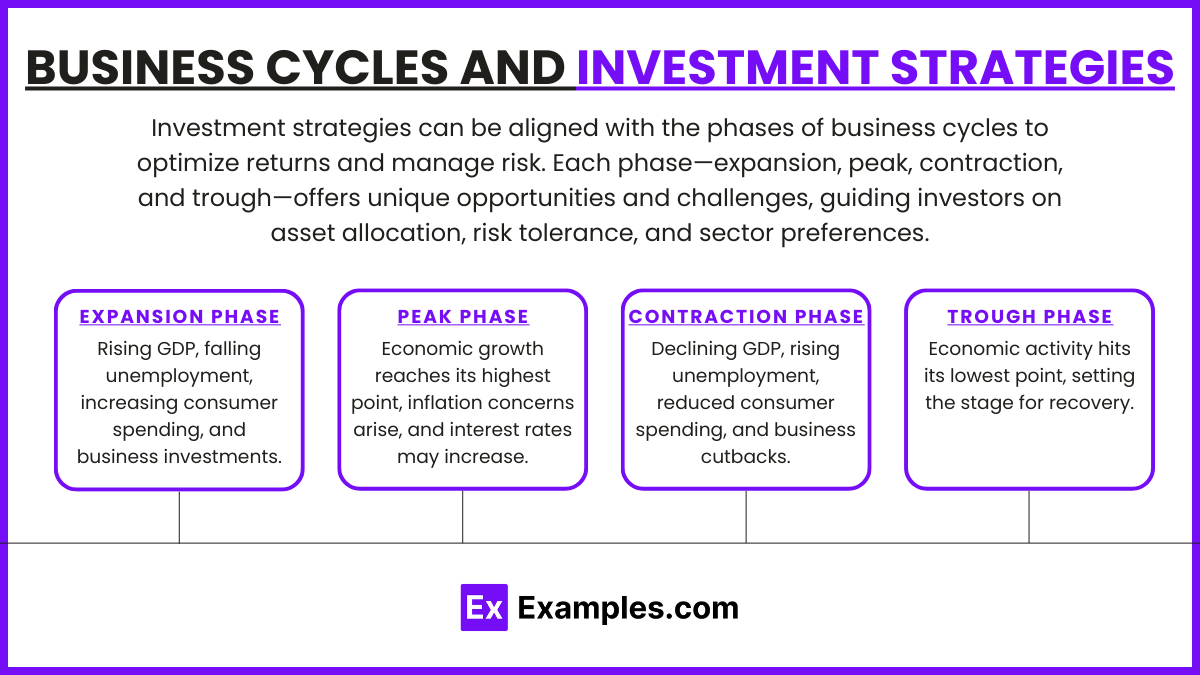
Investment strategies can be aligned with the phases of business cycles to optimize returns and manage risk. Each phase—expansion, peak, contraction, and trough—offers unique opportunities and challenges, guiding investors on asset allocation, risk tolerance, and sector preferences.
1. Expansion Phase
- Rising GDP, falling unemployment, increasing consumer spending, and business investments.
- Investment Strategy: Focus on growth assets such as stocks, especially in sectors like technology, consumer discretionary, and industrials that thrive in a growing economy. Investors may also favor small-cap stocks due to their higher growth potential in strong economic conditions.
2. Peak Phase
- Economic growth reaches its highest point, inflation concerns arise, and interest rates may increase.
- Investment Strategy: Shift to defensive stocks, like those in utilities, healthcare, and consumer staples, as these sectors tend to remain stable despite economic slowdowns. Reducing exposure to high-risk assets and moving toward cash or short-term bonds can help protect against potential market declines.
3. Contraction (Recession) Phase
- Declining GDP, rising unemployment, reduced consumer spending, and business cutbacks.
- Investment Strategy: Favor safer assets such as bonds, particularly government bonds, which typically perform well as interest rates fall during recessions. Defensive sectors (e.g., healthcare and utilities) remain strong choices, and dividend-paying stocks can provide income stability.
4. Trough Phase
- Economic activity hits its lowest point, setting the stage for recovery.
- Investment Strategy: Prepare to shift back into growth assets as the economy begins to recover. Cyclical sectors (e.g., consumer discretionary, financials, and technology) offer potential for significant returns. Investors may consider increasing equity exposure gradually as leading indicators show signs of recovery.
Examples
Example 1: The Great Recession (2007-2009)
- Analyze the economic indicators leading up to the recession, the role of the housing market crash, and the subsequent global financial crisis. Discuss the response of monetary and fiscal policies during the contraction and recovery phases.
Example 2: The Dot-Com Bubble (1999-2000)
- Explore the rapid expansion and burst of the dot-com bubble, focusing on the excessive speculation in tech stocks and the impact of interest rate adjustments by the Federal Reserve. Evaluate the aftermath and recovery process for the tech sector and broader economy.
Example 3: The 1970s Oil Crisis and Stagflation
- Examine how the oil price shocks of the 1970s contributed to stagflation, characterized by high inflation and stagnant economic growth. Discuss the Keynesian and Monetarist responses to the crisis and their implications on business cycle theory.
Example 4: Asian Financial Crisis (1997-1998)
- Study the causes of the financial crisis in Asia, including the role of fixed exchange rates, high external debt, and the withdrawal of foreign capital. Analyze the economic impact across different countries and the recovery strategies employed.
Example 5: COVID-19 Economic Impact (2020-Present)
- Investigate the unprecedented economic downturn caused by the COVID-19 pandemic, including the impact on employment, supply chains, and GDP growth rates. Discuss the global economic response, including stimulus measures and the role of central banks in mitigating the economic damage.
Practice Questions
Question 1
What is typically considered a leading indicator of economic activity?
A. Corporate profits
B. Consumer price index
C. Gross Domestic Product (GDP)
D. Building permits
Answer:
D. Building permits
Explanation:
Building permits are considered a leading indicator because they reflect future construction activity, which indicates developers’ expectations about economic conditions. An increase in building permits suggests positive expectations and a likely expansion in economic activity.
Question 2
Which theory attributes business cycle fluctuations to external shocks rather than to internal market processes?
A. Keynesian theory
B. Monetarist theory
C. Real Business Cycle theory
D. Supply-side economics
Answer:
C. Real Business Cycle theory
Explanation:
Real Business Cycle (RBC) theory argues that business cycle fluctuations are the result of external shocks, such as changes in technology or supply, rather than monetary or demand-driven factors. This perspective views cycles as responses to real, rather than nominal, shocks.
Question 3
During an economic contraction, which fiscal policy is most likely to be pursued by the government to stimulate growth?
A. Increasing taxes
B. Reducing government spending
C. Increasing government spending
D. Imposing new trade tariffs
Answer:
C. Increasing government spending
Explanation:
Keynesian economics suggests that during a contraction, the government should engage in expansionary fiscal policy, such as increasing government spending. This injection of spending can help stimulate demand in the economy, leading to increased production and employment, thus helping to mitigate the effects of the downturn.

