Advanced Techniques encompass sophisticated tools and methodologies that deepen technical analysis, enhancing the ability to interpret and forecast market movements. This topic delves into complex indicators, such as Fibonacci retracements, Elliott Wave Theory, and advanced charting patterns, to provide insights into potential price behavior. It also covers quantitative methods, including statistical measures and algorithmic trading approaches, to improve the precision of analysis. Mastery of these advanced techniques is essential for developing a comprehensive toolkit, allowing for refined analysis and informed decision-making in dynamic market environments.
Learning Objectives
In studying “Advanced Techniques” for the CMT, you should learn to apply sophisticated analytical methods to enhance market analysis and trading decisions. Focus on mastering advanced charting techniques, such as multiple timeframe analysis and candlestick pattern recognition, to gain insights into market trends and reversals. Understand the use of quantitative tools, including moving averages, oscillators, and trend-following indicators, in optimizing entry and exit points. Evaluate the application of statistical methods, like regression and correlation analysis, to understand asset relationships and market dynamics. Additionally, practice integrating these techniques with risk management principles to develop robust trading strategies that adapt to changing market conditions.
Applying Sophisticated Analytical Methods for Market Analysis and Trading Decisions
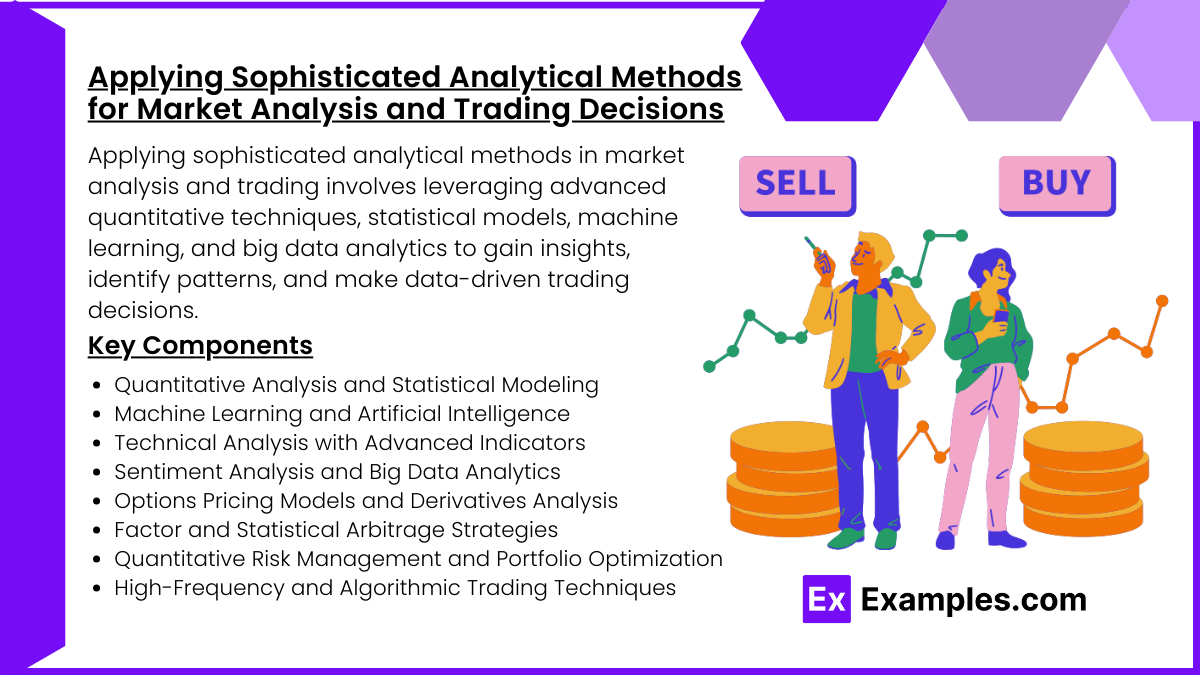
Applying sophisticated analytical methods in market analysis and trading involves leveraging advanced quantitative techniques, statistical models, machine learning, and big data analytics to gain insights, identify patterns, and make data-driven trading decisions. These methods provide a systematic approach to understanding market dynamics, enabling traders and investors to gain an edge in increasingly complex and fast-moving markets. Here are some of the key sophisticated analytical methods and their applications in market analysis and trading:
1. Quantitative Analysis and Statistical Modeling
- Time Series Analysis: This involves analyzing historical price data to forecast future trends. Techniques like autoregressive integrated moving average (ARIMA), exponential smoothing, and GARCH (Generalized Autoregressive Conditional Heteroskedasticity) are commonly used for volatility and price prediction.
- Factor Models: Factor models, such as the Fama-French Three-Factor Model, are used to explain asset returns based on multiple risk factors like size, value, and market risk. These models help in portfolio construction and risk assessment.
- Monte Carlo Simulation: Monte Carlo simulations assess potential outcomes by simulating thousands of scenarios, providing insights into risks and potential returns. This is particularly useful for options pricing, portfolio risk management, and scenario analysis.
- Use Cases: Quantitative models are widely used in risk management, asset pricing, and trading strategies that aim to capitalize on price patterns, momentum, or mean reversion.
2. Machine Learning and Artificial Intelligence
- Supervised Learning: Algorithms like regression, decision trees, and neural networks are trained on historical market data to predict future prices, volatility, or trends. Common supervised learning applications include stock price prediction, risk assessment, and classification of bullish or bearish market signals.
- Unsupervised Learning: Techniques like clustering (e.g., k-means clustering) are used to identify hidden patterns or group similar data points without predefined labels. This can be used for market segmentation, anomaly detection, or identifying correlations across assets.
- Reinforcement Learning: Reinforcement learning models, such as deep Q-networks (DQNs), use reward-based learning to develop optimal trading strategies over time. These models are especially useful for algorithmic trading, where strategies adapt based on performance in real trading conditions.
- Natural Language Processing (NLP): NLP techniques analyze unstructured data, like news articles, social media, and earnings calls, to gauge sentiment and anticipate market reactions. This helps in sentiment analysis and real-time decision-making.
- Use Cases: Machine learning and AI are widely used for algorithmic trading, high-frequency trading, sentiment analysis, and predictive analytics, enabling faster and more accurate trading decisions.
3. Technical Analysis with Advanced Indicators
- Algorithmic Chart Pattern Recognition: Algorithms can detect chart patterns (e.g., head and shoulders, double tops/bottoms) more systematically and consistently than manual analysis. Automated pattern recognition helps identify trading opportunities across multiple assets.
- Momentum Indicators: Advanced momentum indicators like the Relative Strength Index (RSI), Moving Average Convergence Divergence (MACD), and Bollinger Bands are often used to generate buy/sell signals based on price trends and reversals.
- Ichimoku Cloud and Parabolic SAR: These advanced indicators provide insights into support/resistance, trend direction, and momentum, helping traders make more nuanced trading decisions.
- Use Cases: Technical indicators are commonly used in day trading, swing trading, and algorithmic trading strategies, especially when combined with machine learning for adaptive signal generation.
4. Sentiment Analysis and Big Data Analytics
- Sentiment Indicators: Analyzing sentiment on social media platforms, financial news, and analyst reports helps capture the market’s mood and forecast short-term movements. Sentiment analysis tools aggregate and quantify positive or negative sentiment to help gauge crowd psychology.
- Big Data Processing: Large volumes of data, such as historical price data, macroeconomic indicators, and alternative data (e.g., satellite images of retail parking lots, credit card transaction data), can provide unique insights into asset performance.
- Alternative Data Sources: Alternative data, including social media trends, web traffic data, and corporate credit card data, provides deeper insights into company performance and consumer behavior.
- Use Cases: Big data and sentiment analysis are used for macroeconomic analysis, stock selection, and trend forecasting, enabling faster reaction to shifts in investor sentiment and potential arbitrage opportunities.
5. Options Pricing Models and Derivatives Analysis
- Black-Scholes Model: The Black-Scholes model is widely used for pricing European options, based on factors like volatility, time to expiration, and interest rates. It helps in determining fair value and assessing mispriced options.
- Binomial and Trinomial Trees: These models break down the option pricing process into multiple time steps, making them suitable for American options, which can be exercised before expiration.
- Greeks Analysis: Greeks (delta, gamma, theta, vega, and rho) quantify how option prices respond to changes in underlying factors. They are essential for managing and hedging options portfolios.
- Use Cases: Options pricing models are critical in derivative trading, volatility trading, and hedging strategies, allowing traders to identify arbitrage opportunities and optimize portfolio risk.
6. Factor and Statistical Arbitrage Strategies
- Pair Trading: A type of statistical arbitrage, pair trading involves identifying two correlated assets and taking opposite positions based on expected convergence or divergence in their prices. For instance, if two highly correlated stocks deviate in price, traders buy the undervalued one and short the overvalued one.
- Mean Reversion Strategies: Mean reversion models assume that asset prices will revert to their historical mean, creating opportunities to profit from temporary mispricings. Techniques like Z-score analysis help quantify deviations from the mean.
- Multi-Factor Models: By incorporating multiple factors such as momentum, value, size, and volatility, traders can build diversified portfolios that are optimized for risk-adjusted returns.
- Use Cases: Factor models and statistical arbitrage are popular in quantitative hedge funds and algorithmic trading firms, as they capitalize on market inefficiencies and anomalies.
7. Quantitative Risk Management and Portfolio Optimization
- Value at Risk (VaR): VaR models estimate the potential loss of an investment or portfolio over a specific time frame at a given confidence level. This is useful for assessing and limiting risk exposure in volatile markets.
- Conditional Value at Risk (CVaR): Also known as Expected Shortfall, CVaR measures the average loss that occurs beyond the VaR threshold, providing a more comprehensive view of tail risk.
- Optimization Techniques: Optimization models, such as mean-variance optimization and Black-Litterman models, help construct portfolios with optimal risk-return characteristics by determining asset weights based on expected returns and volatility.
- Use Cases: Risk management and optimization models are used by institutional investors, hedge funds, and portfolio managers to mitigate risks and maximize returns under uncertain market conditions.
8. High-Frequency and Algorithmic Trading Techniques
- Market Microstructure Analysis: High-frequency traders analyze market microstructure, including order flow, bid-ask spreads, and latency, to identify profitable trading opportunities based on price patterns and market inefficiencies.
- Latency Arbitrage: In latency arbitrage, traders take advantage of minor time differences in market data feeds to execute trades before other participants can react, gaining a slight edge in price execution.
- Order Flow and Liquidity Analysis: Advanced algorithms analyze real-time order flow and liquidity to detect large institutional trades or price shifts, allowing high-frequency traders to capture quick profits.
- Use Cases: High-frequency and algorithmic trading strategies are primarily employed by hedge funds and proprietary trading firms, as they require extensive technical infrastructure, low-latency networks, and substantial capital.
Advanced Charting Techniques
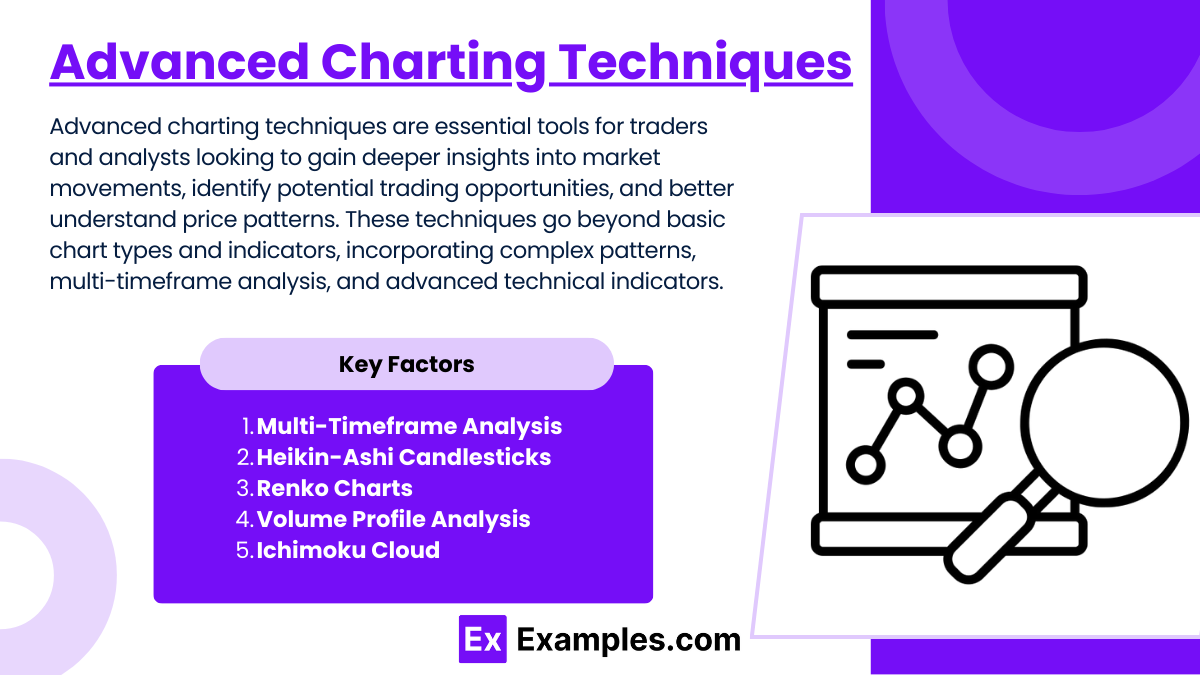
Advanced charting techniques are essential tools for traders and analysts looking to gain deeper insights into market movements, identify potential trading opportunities, and better understand price patterns. These techniques go beyond basic chart types and indicators, incorporating complex patterns, multi-timeframe analysis, and advanced technical indicators. Here’s an overview of some advanced charting techniques and how they are applied in market analysis:
1. Multi-Timeframe Analysis
- Overview: Multi-timeframe analysis involves analyzing price action across different timeframes (e.g., daily, weekly, monthly) to get a more comprehensive view of market trends and momentum.
- Technique: Traders typically start by analyzing a longer-term chart to identify the primary trend and then move to shorter-term charts to time entries and exits more accurately. For example, a trader may confirm a long-term uptrend on the weekly chart and look for entry signals on the daily or hourly chart.
- Application: This approach helps traders avoid going against the primary trend and increases the likelihood of entering trades with favorable risk-to-reward ratios.
2. Heikin-Ashi Candlesticks
- Overview: Heikin-Ashi candlesticks are a modified version of traditional candlesticks that smooth out price action by averaging price data, making it easier to identify trends.
- Technique: Heikin-Ashi charts show trends more clearly by filtering out small fluctuations, making it easier to determine whether a trend is up, down, or consolidating.
- Application: Traders use Heikin-Ashi to identify trend strength and potential reversals. The charts are particularly helpful in identifying consistent trends, as they reduce the noise that may lead to premature exits.
3. Renko Charts
- Overview: Renko charts are built using price movement rather than time, with each “brick” on the chart representing a set price increment.
- Technique: A new brick is only added when the price moves by a specific amount, either up or down, which helps eliminate noise and focuses purely on price movement.
- Application: Renko charts are effective for identifying support and resistance levels and simplifying trend analysis. They work well in trending markets and are often used in conjunction with indicators like moving averages to confirm entries and exits.
4. Volume Profile Analysis
- Overview: Volume profile analysis shows the amount of trading activity at different price levels, helping traders identify areas of high buying and selling interest, or “value areas.”
- Technique: The profile is displayed vertically along the price axis, showing the volume traded at each price level. Key levels include the point of control (POC) where the most volume has been traded and value areas that indicate where 70% of the volume is concentrated.
- Application: Traders use volume profile to find support and resistance levels, identify price levels where the market might stall or reverse, and determine areas of potential entry or exit.
5. Ichimoku Cloud
- Overview: The Ichimoku Cloud, or Ichimoku Kinko Hyo, is an advanced indicator combining five lines that provide insights into trend direction, support/resistance, and momentum.
- Technique: The cloud (kumo) represents support and resistance, while the Tenkan-sen and Kijun-sen lines provide shorter-term signals. The Chikou Span acts as a lagging line, showing the current price relative to past price action.
- Application: The Ichimoku Cloud is used to assess overall trend strength and identify potential reversals. Traders often enter trades when prices break out above or below the cloud, especially if the cloud is thick (indicating strong support or resistance).
Using Quantitative Tools for Entry and Exit Optimization
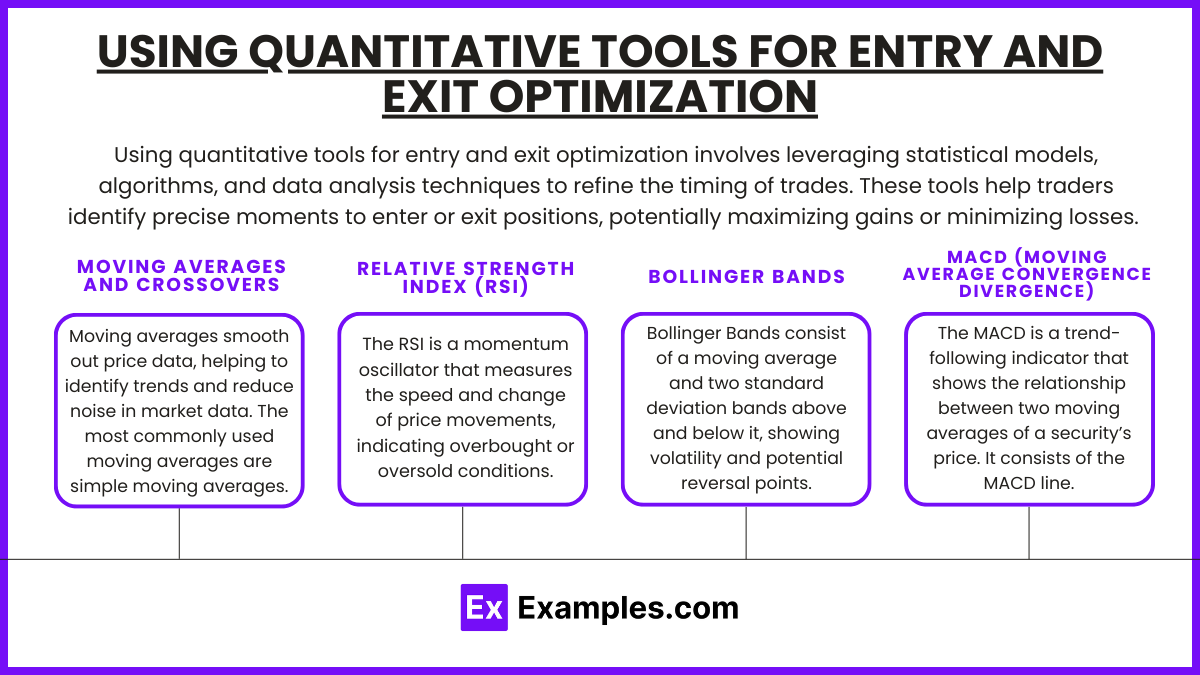
Using quantitative tools for entry and exit optimization involves leveraging statistical models, algorithms, and data analysis techniques to refine the timing of trades. These tools help traders identify precise moments to enter or exit positions, potentially maximizing gains or minimizing losses. Here’s a look at some of the most effective quantitative tools and techniques for optimizing trade entries and exits:
1. Moving Averages and Crossovers
- Overview: Moving averages smooth out price data, helping to identify trends and reduce noise in market data. The most commonly used moving averages are simple moving averages (SMA) and exponential moving averages (EMA).
- Technique: Moving average crossovers, such as the 50-day and 200-day SMA crossover, can signal potential entry and exit points. When a shorter moving average crosses above a longer one, it often indicates a bullish signal (entry), while a crossover below signals a bearish move (exit).
- Optimization: Traders use backtesting to optimize the period lengths of moving averages based on historical performance, adjusting them to better capture trends and minimize false signals.
2. Relative Strength Index (RSI)
- Overview: The RSI is a momentum oscillator that measures the speed and change of price movements, indicating overbought or oversold conditions.
- Technique: RSI values above 70 suggest overbought conditions (potential exit), while values below 30 indicate oversold conditions (potential entry). Some traders also use divergences between price and RSI to spot potential reversals.
- Optimization: Adjusting the RSI period (default is 14) based on asset volatility can increase accuracy. Combining RSI with other indicators, like moving averages, can help confirm signals and reduce false entries or exits.
3. Bollinger Bands
- Overview: Bollinger Bands consist of a moving average and two standard deviation bands above and below it, showing volatility and potential reversal points.
- Technique: When prices touch or break above the upper band, it may signal overbought conditions (exit), while touching the lower band may indicate oversold conditions (entry). Bollinger Bands also help detect breakouts when bands expand or contract.
- Optimization: Traders can adjust the period and the standard deviation multiplier based on asset volatility, using historical backtesting to find the most effective settings. Combining Bollinger Bands with RSI or MACD can improve timing precision.
4. MACD (Moving Average Convergence Divergence)
- Overview: The MACD is a trend-following indicator that shows the relationship between two moving averages of a security’s price. It consists of the MACD line, signal line, and histogram.
- Technique: A crossover of the MACD line above the signal line indicates a bullish signal (entry), while a crossover below the signal line suggests a bearish signal (exit). The histogram’s movement also helps identify trend strength and potential reversals.
- Optimization: The default MACD settings (12, 26, 9) can be modified for different timeframes or asset classes. Optimizing these parameters based on backtesting can yield better entry and exit points.
Statistical Methods for Understanding Asset Relationships and Market Dynamics
Statistical methods play a crucial role in understanding asset relationships and market dynamics by providing insights into correlations, causations, and patterns among different financial instruments and economic variables. These methods help traders, analysts, and portfolio managers make informed decisions about asset allocation, risk management, and trading strategies. Here’s an overview of key statistical methods used to understand asset relationships and market dynamics:
1. Correlation Analysis
- Overview: Correlation measures the degree of linear relationship between two variables, with values ranging from -1 (perfect negative correlation) to +1 (perfect positive correlation). A value close to 0 indicates no linear relationship.
- Application: Correlation analysis helps in understanding how different assets move in relation to one another. For example, stocks and bonds often exhibit negative correlation, making them good diversification candidates.
- Techniques: Pearson’s correlation coefficient is commonly used for linear relationships, while Spearman’s rank correlation is used for non-linear relationships.
- Limitations: Correlation does not imply causation, and correlations can vary over time, especially during market crises when assets may become more correlated due to systemic risk.
2. Covariance and Covariance Matrix
- Overview: Covariance measures the direction of the relationship between two assets’ returns. A positive covariance means that returns tend to move in the same direction, while a negative covariance indicates they move inversely.
- Application: A covariance matrix is used in portfolio construction to assess how assets interact with each other, helping to identify diversification benefits and reduce portfolio risk.
- Techniques: Covariance is calculated using historical returns, and the covariance matrix is often used in conjunction with optimization techniques like mean-variance optimization.
- Limitations: Like correlation, covariance does not imply causation and can be volatile in times of market stress.
3. Regression Analysis
- Overview: Regression analysis examines the relationship between a dependent variable and one or more independent variables, helping to explain how changes in one variable influence another.
- Application: Linear regression models are widely used in finance to analyze factors affecting asset prices, like how changes in interest rates influence stock prices. Multiple regression can assess the impact of several variables on an asset.
- Techniques: Ordinary Least Squares (OLS) regression is a common method, but more advanced techniques like Ridge and Lasso regression are also used for better accuracy and variable selection.
- Limitations: Regression assumes a linear relationship, which may not always hold in finance. Multicollinearity among variables can also reduce model reliability.
4. Autocorrelation and Time Series Analysis
- Overview: Autocorrelation measures how current values in a time series relate to past values, identifying patterns such as trends or seasonality.
- Application: Autocorrelation is key in time series analysis for identifying momentum or mean reversion patterns. Positive autocorrelation indicates momentum, while negative autocorrelation can indicate mean reversion.
- Techniques: Statistical methods like the autocorrelation function (ACF), partial autocorrelation function (PACF), and autoregressive models (e.g., ARIMA) help detect these patterns in asset prices or economic indicators.
- Limitations: Time series analysis assumes that historical patterns will continue, which may not be true during structural breaks or economic shocks.
5. Principal Component Analysis (PCA)
- Overview: PCA is a dimensionality reduction technique that identifies the most significant factors (principal components) explaining the variance in a dataset. It reduces complex datasets into fewer, more interpretable components.
- Application: PCA helps in identifying underlying drivers of market movements by isolating factors that explain most of the variance among multiple assets. It’s particularly useful in bond markets, where yields are influenced by factors like economic growth and interest rates.
- Techniques: PCA decomposes data into principal components ranked by their explanatory power. In finance, the first few components often explain most of the variance in returns.
- Limitations: PCA assumes linear relationships and may not capture non-linear relationships between assets. Interpretability of components can also be challenging.
6. Factor Analysis and Multi-Factor Models
- Overview: Factor analysis identifies latent factors that explain asset returns, often used to assess how various factors impact portfolios.
- Application: Multi-factor models, like the Fama-French Three-Factor Model or Carhart Four-Factor Model, explain asset returns based on factors such as market risk, size, value, and momentum.
- Techniques: Factor analysis relies on statistical methods like maximum likelihood estimation or principal axis factoring to extract common factors from the data.
- Limitations: Factor models assume that relationships are stable over time, which may not be true in dynamic markets. Selection of relevant factors can also vary by asset class and market conditions.
Examples
Example 1: Finite Element Analysis (FEA)
FEA is an advanced technique used in engineering to simulate and analyze physical phenomena, such as stress, heat, and fluid flow, in complex structures. By breaking down a large system into smaller, manageable elements, engineers can predict how the material will behave under different conditions. This method is widely used in aerospace, automotive, and civil engineering for designing safe and efficient structures.
Example 2: Quantum Computing
Quantum computing leverages the principles of quantum mechanics to process information in fundamentally different ways compared to classical computers. Techniques like superposition and entanglement enable quantum computers to solve complex problems much faster than traditional computers, particularly in fields such as cryptography, materials science, and optimization problems. This advanced technique holds the potential to revolutionize industries that rely on high-performance computation.
Example 3: Machine Learning and AI Algorithms
Machine learning and artificial intelligence (AI) algorithms are advanced techniques used to analyze large datasets and make predictions without explicit programming. In fields such as finance, healthcare, and marketing, machine learning models like neural networks and decision trees are used to detect patterns, optimize processes, and improve decision-making. These techniques have become critical in transforming industries and automating complex tasks.
Example 4: Genomic Editing (CRISPR-Cas9)
CRISPR-Cas9 is an advanced genetic engineering technique that allows for precise modification of DNA within living organisms. This technique has opened new doors in medicine, agriculture, and biotechnology by enabling scientists to edit genes at specific locations, leading to potential cures for genetic disorders, enhanced crops, and advancements in personalized medicine.
Example 5: Spectroscopic Imaging Techniques
Spectroscopic imaging, including techniques like Raman spectroscopy and infrared spectroscopy, is used to analyze the molecular composition of materials. These advanced techniques allow scientists and engineers to examine the chemical structure, composition, and properties of substances in non-destructive ways. They are applied in industries ranging from pharmaceuticals to materials science, providing valuable insights into product quality and material characteristics.
Practice Questions
Question 1
Which of the following is a primary use of Finite Element Analysis (FEA)?
A) To simulate fluid dynamics in an open system
B) To break down complex structures into smaller, simpler elements for stress analysis
C) To predict stock market trends
D) To analyze genetic sequences in molecular biology
Correct Answer: B) To break down complex structures into smaller, simpler elements for stress analysis.
Explanation: Finite Element Analysis (FEA) is an advanced technique used in engineering to model complex structures and analyze their behavior under various conditions such as stress, temperature, and pressure. It works by breaking down the structure into smaller elements, making it easier to analyze the performance of the material or system. Options A, C, and D are unrelated to the specific purpose of FEA.
Question 2
What is the primary advantage of using Quantum Computing over classical computing?
A) It requires less energy to run
B) It can perform complex calculations significantly faster
C) It uses binary digits to store information
D) It is widely available for consumer use
Correct Answer: B) It can perform complex calculations significantly faster.
Explanation: Quantum computing utilizes quantum bits (qubits) that take advantage of quantum superposition and entanglement, enabling the processing of information much faster than classical computers. This ability to solve complex problems in fields like cryptography and materials science is its key advantage. While quantum computing has many potential applications, it is not yet widely available for consumer use, which makes option D incorrect.
Question 3
In which field is CRISPR-Cas9 most commonly used?
A) To simulate weather patterns
B) To edit genes for medical and agricultural purposes
C) To optimize supply chain management
D) To analyze economic trends
Correct Answer: B) To edit genes for medical and agricultural purposes.
Explanation: CRISPR-Cas9 is a revolutionary genetic editing tool used to precisely modify DNA in living organisms. It has immense applications in medicine, such as gene therapy for genetic disorders, and agriculture, such as improving crop resistance to diseases. This technique is transformative in the fields of biotechnology and molecular biology, making option B the correct answer. Options A, C, and D are unrelated to the use of CRISPR-Cas9.

