Objective rules in technical trading systems are predefined, systematic guidelines designed to enhance consistency and remove emotional biases from trading decisions. By relying on clear entry and exit criteria, position sizing, and risk management protocols, these rules create a disciplined framework for trading. Evaluating these rules involves rigorous backtesting and performance analysis, ensuring they are not only theoretically sound but also effective in real-world scenarios. This evaluation process helps identify potential pitfalls, such as overfitting or market impact, and fosters the development of robust, adaptable trading strategies.
Learning Objectives
In studying “Objective Rules and Their Evaluation” for the CMT Exam, you should learn to understand the foundations of objective, rule-based trading systems and their role in systematic trading. Evaluate various methods for designing rules, including entry and exit signals, risk management, and position sizing. Examine the importance of rigorous backtesting, forward testing, and optimization in assessing rule effectiveness. Analyze common pitfalls such as overfitting, look-ahead bias, and ignoring market conditions, and explore methods to mitigate these issues. Additionally, apply your understanding by interpreting and critiquing example strategies, focusing on how objective rules can lead to consistent, unbiased trading outcomes.
Objective Rules in Technical Trading Systems
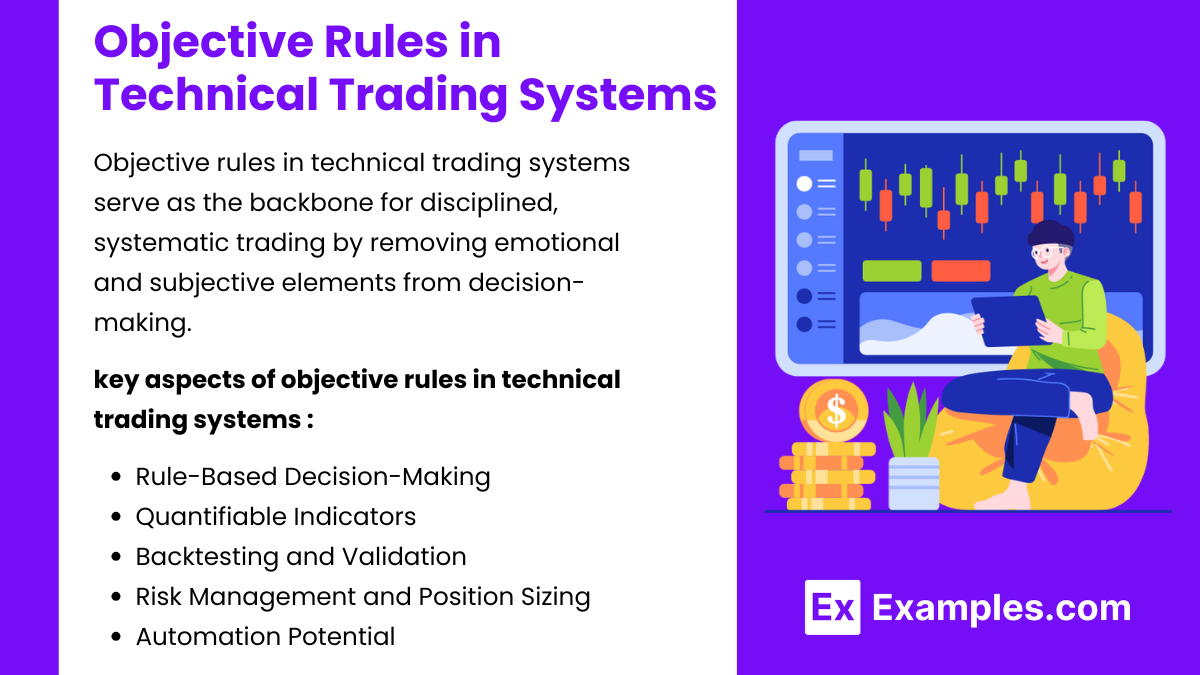
Objective rules in technical trading systems serve as the backbone for disciplined, systematic trading by removing emotional and subjective elements from decision-making. These rules rely on clearly defined criteria, such as technical indicators (e.g., moving averages, RSI), price patterns (e.g., double tops, triangles), or statistical measures, to establish specific conditions for entering or exiting trades. By adhering to these guidelines, traders can consistently apply the same methods across different market conditions, leading to more predictable outcomes and minimizing the risk of impulsive or emotionally driven trades. This systematic approach enhances trading consistency, reduces cognitive load, and helps traders remain aligned with long-term strategies, ultimately improving risk management and fostering steady, objective decision-making.
Here are some key aspects of objective rules in technical trading systems:
- Rule-Based Decision-Making : Objective rules provide a structured framework that specifies entry, exit, and risk management criteria based on technical indicators and market conditions. Rules can be based on technical indicators (e.g., moving averages, Relative Strength Index), chart patterns, or volume signals. These rules remove personal bias and enable consistent decision-making, essential in reducing errors and emotional trading.
- Quantifiable Indicators : Objective rules often rely on quantifiable technical indicators, such as moving averages, RSI, or MACD, that can be systematically measured and applied. Indicators provide specific signals (e.g., “buy when the 50-day moving average crosses above the 200-day moving average”) to standardize trading decisions.
- Backtesting and Validation : Objective rules allow for backtesting on historical data, providing a basis for evaluating the system’s effectiveness and performance over time. Backtesting helps traders understand how the rules would have performed under various market conditions, enabling refinement and adjustment before real-time trading.
- Risk Management and Position Sizing : Objective rules often incorporate risk management measures, such as stop-loss levels, maximum drawdowns, or position-sizing criteria. Clear risk management rules limit potential losses, helping to protect capital and maintain a disciplined approach in fluctuating markets.
- Automation Potential : Objective rules facilitate automation, allowing traders to use algorithmic or programmatic trading systems. Automation can help execute trades more efficiently and with precision, especially when rapid responses to market conditions are needed.
Key Components of Objective Rules
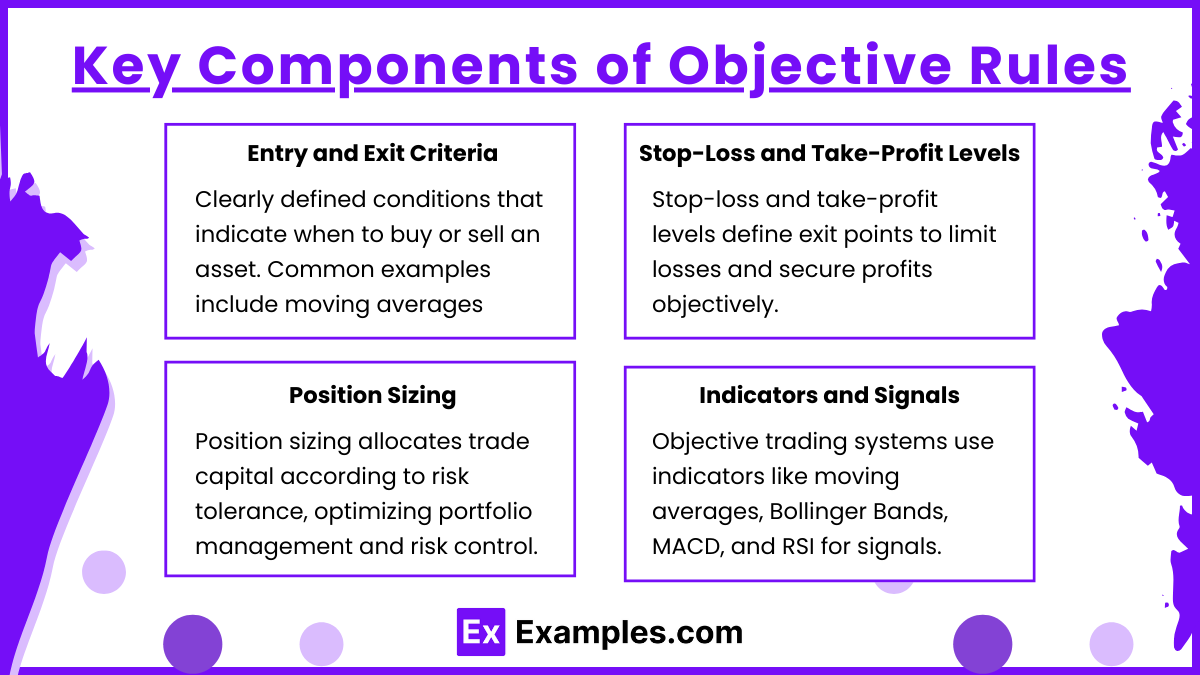
- Entry and Exit Criteria: Clearly defined conditions that indicate when to buy or sell an asset. Common examples include moving averages (e.g., a “golden cross” when a shorter-term moving average crosses above a longer-term moving average) or relative strength index (RSI) thresholds.
- Stop-Loss and Take-Profit Levels: Pre-set points for exiting trades to manage risk. Objective rules often incorporate stop-loss orders to minimize losses and take-profit orders to lock in gains, enforcing disciplined exits.
- Position Sizing: Determines the amount of capital allocated to each trade based on the trader’s risk tolerance and portfolio management strategy. This helps avoid over-leveraging and preserves capital.
- Indicators and Signals: Objective trading systems use technical indicators such as moving averages, Bollinger Bands, MACD, or RSI to generate signals. For instance, a moving average crossover system might buy when the short-term average crosses above the long-term average, signaling an uptrend.
Evaluation of Objective Rules
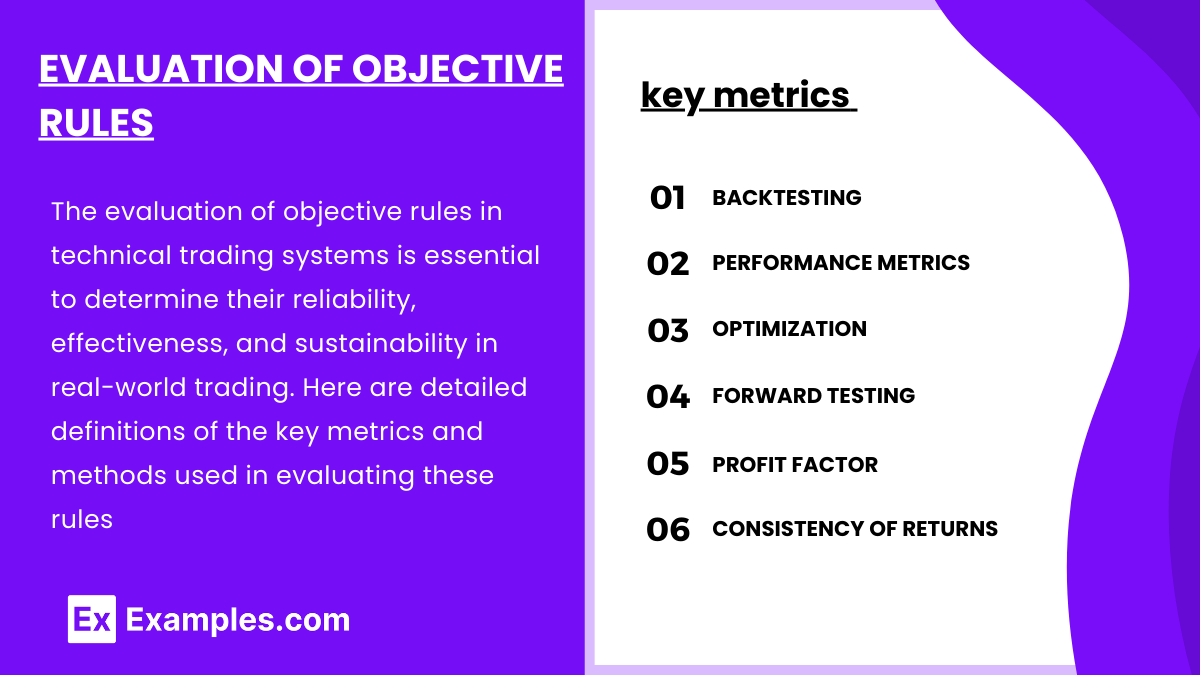
Evaluating objective rules is critical to determine their effectiveness and reliability. This process involves several key metrics and statistical tests:
- Backtesting: This is the practice of applying trading rules to historical data to evaluate how they would have performed in the past. Backtesting helps assess profitability, risk exposure, and overall strategy robustness.
- Performance Metrics:
- Win Rate: The percentage of profitable trades out of total trades. A high win rate is favorable but not the only indicator of a successful system.
- Risk-to-Reward Ratio: Measures the potential reward for each unit of risk taken. A high ratio is preferable, as it indicates the strategy could provide substantial returns for each dollar at risk.
- Drawdown: The peak-to-trough decline in a portfolio’s value, indicating risk levels. Traders aim to minimize drawdown to avoid substantial losses.
- Sharpe Ratio: Evaluates risk-adjusted returns by comparing the average return of the strategy to its volatility. A higher Sharpe Ratio suggests better risk-adjusted performance.
- Optimization: Fine-tuning parameters, such as moving average lengths or RSI thresholds, to maximize performance. However, over-optimization (also known as curve-fitting) can lead to unreliable results in real-world trading, as it may only fit past data and fail to adapt to new market conditions.
- Forward Testing (Paper Trading): Testing the strategy on live, simulated market conditions to verify that backtested results hold up in real trading environments. Forward testing helps traders identify potential adjustments before risking real capital.
- Profit Factor: The ratio of gross profits to gross losses in a trading system. A profit factor greater than 1 indicates profitability, with higher values suggesting a more robust system. This metric helps determine if the strategy can consistently generate profits over time.
- Consistency of Returns: Measures the stability of returns over time, often through metrics like monthly or quarterly return variance. Consistent returns with low variance are desirable, as they indicate a reliable strategy that performs well across various market conditions.
Common Pitfalls in Objective Rule Evaluation
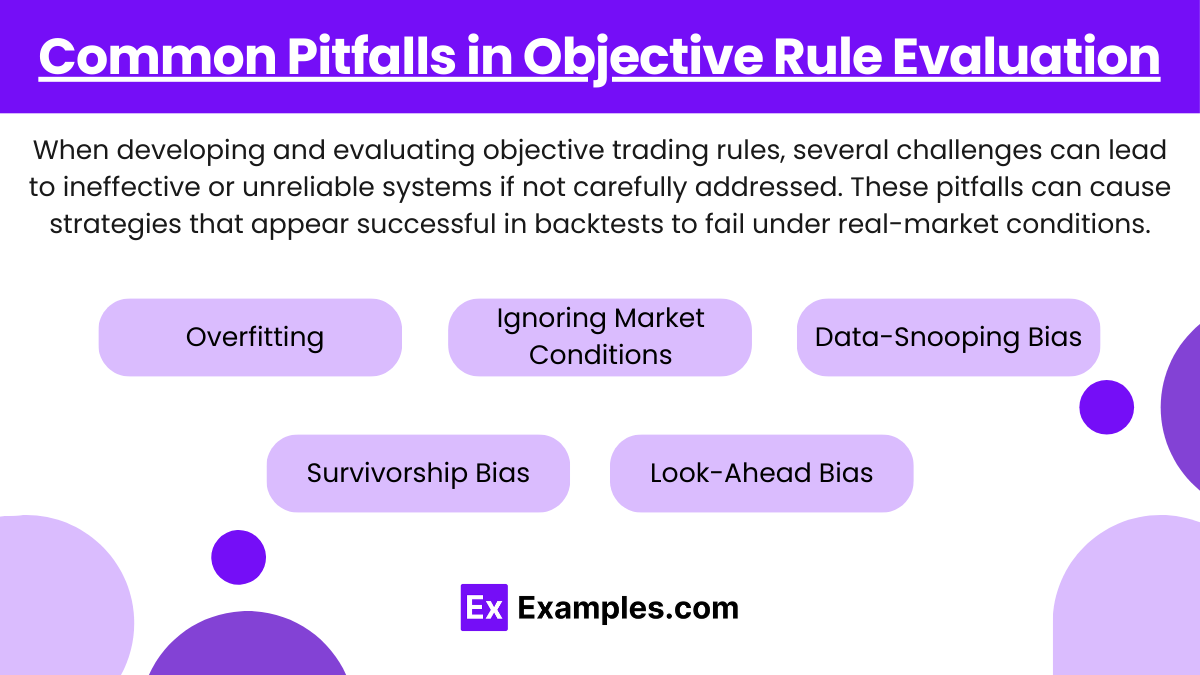
When developing and evaluating objective trading rules, several challenges can lead to ineffective or unreliable systems if not carefully addressed. These pitfalls can cause strategies that appear successful in backtests to fail under real-market conditions.
- Overfitting
Overfitting, also known as curve-fitting, occurs when a trading rule is excessively optimized to perform well on historical data but struggles in actual trading environments. This issue arises when a strategy is too closely tailored to specific patterns or outliers in past data, making it vulnerable to changes in market conditions.- Example: A strategy that includes too many parameters, such as a custom combination of moving averages, Bollinger Bands, and RSI thresholds for specific asset prices, may work perfectly on past data but fail to adapt when market volatility shifts.
- Prevention: Use cross-validation techniques that test the rule on multiple, non-overlapping historical periods, helping to ensure robustness. Avoid excessive parameter adjustments that only enhance performance in historical data and prioritize simpler models that capture broader trends.
- Ignoring Market Conditions
Markets operate in various regimes—trending, ranging, or highly volatile—each of which may affect a trading rule’s performance. A strategy that succeeds in a bull market might fail in a bear market or during periods of low volatility.- Example: A trend-following rule that performs well in a trending market might generate false signals during a ranging or sideways market.
- Prevention: Develop rules that can adapt to different market conditions or incorporate a filtering mechanism to identify market regimes. For instance, traders might use the Average Directional Index (ADX) to identify when markets are trending versus ranging and adapt their strategies accordingly.
- Data-Snooping Bias
Data-snooping bias occurs when a trader unwittingly tailors a strategy based on patterns discovered in historical data, leading to results that may not hold in live trading. This bias results from over-relying on specific data periods or markets to derive conclusions.- Example: A trading rule that works on a particular year’s data might not generalize to other periods. This could happen if a strategy is optimized for a high-volatility period but fails during a stable period.
- Prevention: Divide data into training and testing sets to avoid relying solely on one dataset. Use walk-forward analysis, which tests a strategy on one period, re-optimizes, and then tests on another, providing a more realistic view of the strategy’s adaptability.
- Survivorship Bias
Survivorship bias occurs when only successful data is analyzed, leading to skewed results. For instance, focusing only on companies still listed on an index ignores those that failed or were delisted.- Example: Backtesting a strategy on a stock index without including companies that were removed may result in overly optimistic performance.
- Prevention: Use data that includes all stocks, including delisted ones, to ensure the backtest reflects a realistic trading environment. Ensure datasets include all historical entities, not just current ones.
- Look-Ahead Bias
Look-ahead bias occurs when information that wasn’t available at the time is inadvertently used in the backtest, leading to inflated performance.- Example: Using quarterly earnings information released after a trade date to predict returns on a prior date.
- Prevention: Ensure all data inputs in a backtest strictly follow a timeline that only includes information available at each trading decision point. Avoid using indicators that rely on future data points.
Examples
Example 1: Moving Average Crossover Strategy
This popular strategy involves using two moving averages (MA), typically one short-term and one long-term. An objective rule might state that a buy signal occurs when the short-term MA (e.g., 50-day) crosses above the long-term MA (e.g., 200-day), indicating a potential uptrend. Conversely, a sell signal is generated when the short-term MA crosses below the long-term MA, signaling a possible downtrend.
Evaluation : Moving average crossover strategies are straightforward and widely applicable across various asset classes. They work well in trending markets but tend to underperform in range-bound markets, where frequent crossovers can generate false signals. Backtesting this strategy across different market cycles can provide insight into its reliability, with particular attention to transaction costs due to the potentially high turnover.
Example 2: Relative Strength Index (RSI) Overbought/Oversold Strategy
RSI is a momentum oscillator that ranges from 0 to 100, with readings above 70 typically considered overbought and below 30 considered oversold. An objective trading rule might state that a trader should enter a long position when the RSI falls below 30 and subsequently crosses back above this threshold, indicating a potential price reversal. Conversely, a short position might be initiated when the RSI rises above 70 and then crosses back below.
Evaluation : The RSI overbought/oversold strategy can be effective for catching reversals, especially in volatile or range-bound markets. However, in strong trending markets, RSI can remain overbought or oversold for extended periods, leading to premature signals. Evaluating the rule in different market regimes helps traders understand its reliability and identify optimal RSI thresholds for different asset classes.
Example 3: Breakout Trading Strategy
A breakout strategy involves entering a trade when the price moves outside a defined support or resistance level. An objective rule might specify buying when the price closes above a resistance level (e.g., the previous month’s high) or selling short when the price closes below a support level (e.g., the previous month’s low). This strategy assumes that a breakout from established levels will lead to a continued move in the breakout direction.
Evaluation : Breakout strategies can perform well in trending markets but are prone to false breakouts in range-bound conditions. Traders often use volume confirmation to validate breakouts; for instance, higher-than-average volume on a breakout day may suggest stronger follow-through. Backtesting across various timeframes and with volume filters can improve the reliability of this strategy by reducing the impact of false signals.
Example 4: Bollinger Bands Mean Reversion Strategy
Bollinger Bands plot a security’s moving average along with two bands representing a specified number of standard deviations away from this average. An objective rule in a mean reversion system might involve buying when the price touches or dips below the lower Bollinger Band (suggesting an oversold condition) and selling when the price reaches or exceeds the upper band (indicating overbought conditions).
Evaluation : This strategy tends to work well in sideways markets, where prices oscillate within a predictable range. However, in strong trending markets, prices may repeatedly hit the upper or lower bands, generating false mean-reversion signals. Backtesting the rule in varying market environments and adding stop-loss levels can help mitigate these risks and increase the effectiveness of Bollinger Bands as part of a broader system.
Example 5: MACD Signal Line Crossover Strategy
The Moving Average Convergence Divergence (MACD) indicator consists of the difference between two exponential moving averages (EMAs) and a signal line, which is an EMA of the MACD line. An objective rule for this strategy might state to buy when the MACD line crosses above the signal line (indicating a bullish reversal) and sell when the MACD line crosses below the signal line (indicating a bearish reversal).
Evaluation : MACD crossover strategies are widely used for identifying trend reversals, particularly in trending markets. However, they may generate false signals in low-volatility or range-bound markets. Evaluating the rule through backtesting helps determine the ideal EMAs for the MACD and signal line, as different combinations can enhance its performance based on the asset and timeframe. Fine-tuning the crossover thresholds can also reduce the number of false signals.
Practice Questions
Question 1
Which of the following best describes “overfitting” in the context of evaluating objective trading rules?
A. Creating rules based on general market trends that are applicable to multiple markets
B. Developing trading rules that perform well on historical data but fail in real market scenarios
C. Adjusting trading rules to account for changes in market conditions over time
D. Optimizing a trading strategy to reduce transaction costs and slippage
Answer: B
Explanation : Overfitting occurs when a trading strategy is overly optimized to fit historical data, capturing specific patterns or noise that may not generalize well to future, real-world scenarios. While such rules might appear effective during backtesting, they often fail to perform in live trading because they are tailored to past market behaviors rather than adaptable to future changes. This pitfall highlights the importance of avoiding excessive optimization on historical data, which can lead to strategies that lack robustness across different market conditions.
Question 2
Which of the following is NOT a common pitfall in the evaluation of objective trading rules?
A. Data-Snooping Bias
B. Look-Ahead Bias
C. Incorporating real-world transaction costs in backtesting
D. Ignoring market conditions in strategy design
Answer: C
Explanation : Incorporating real-world transaction costs, such as commissions, spreads, and slippage, is a crucial step in evaluating a trading strategy. Ignoring these costs can lead to overestimated profitability in backtesting. In contrast, data-snooping bias, look-ahead bias, and ignoring market conditions are genuine pitfalls. Data-snooping bias involves tailoring rules to specific historical datasets, which may not generalize. Look-ahead bias occurs when future data is mistakenly used in backtesting, skewing results. Ignoring market conditions means failing to adapt a strategy to different market environments, which can lead to poor real-world performance.
Question 3
Why is “forward testing” considered an essential step in the evaluation of objective trading rules?
A. It allows traders to modify rules to match past market data
B. It tests the trading strategy in simulated live market conditions without real capital risk
C. It replaces the need for backtesting with historical data
D. It maximizes profits by optimizing the rules for recent market trends
Answer: B
Explanation : Forward testing, also known as paper trading, is essential because it tests the performance of a strategy in a simulated live environment without putting actual capital at risk. This step allows traders to validate that the objective rules hold up in real-time conditions, offering an additional layer of evaluation beyond backtesting. Unlike backtesting, forward testing doesn’t use historical data; instead, it applies the strategy in a real market environment, helping traders identify any limitations or adjustments needed before live trading. This process can prevent issues like overfitting and ensures the strategy remains adaptable and robust.

