Markets, Instruments, Data, and the Technical Analyst form the backbone of technical analysis, providing insights into how various markets and instruments operate. This topic covers the structures of equity, fixed-income, and derivatives markets, as well as the data sources that contribute to price analysis, including market breadth and volume. It emphasizes the tools and methodologies technical analysts use to interpret price action and identify trends, which are essential for forecasting and making informed trading decisions. A strong grasp of these elements is crucial for navigating market complexities and applying technical analysis effectively in a professional setting.
Learning Objectives
In studying “Markets, Instruments, Data, and the Technical Analyst” for the CMT, you should learn to understand the role of technical analysis in evaluating financial markets, including how price and volume data are used to assess market trends and conditions. Recognize different types of financial instruments, such as stocks, bonds, commodities, and derivatives, and understand their unique characteristics and trading environments. Develop proficiency in gathering and analyzing historical data to identify patterns and forecast market movements. Evaluate the tools and techniques commonly employed by technical analysts, including chart types, indicators, and oscillators, to interpret market behavior. Additionally, understand the principles of market psychology and sentiment, which influence price action and trading decisions.
Understanding the Role of Technical Analysis in Financial Markets
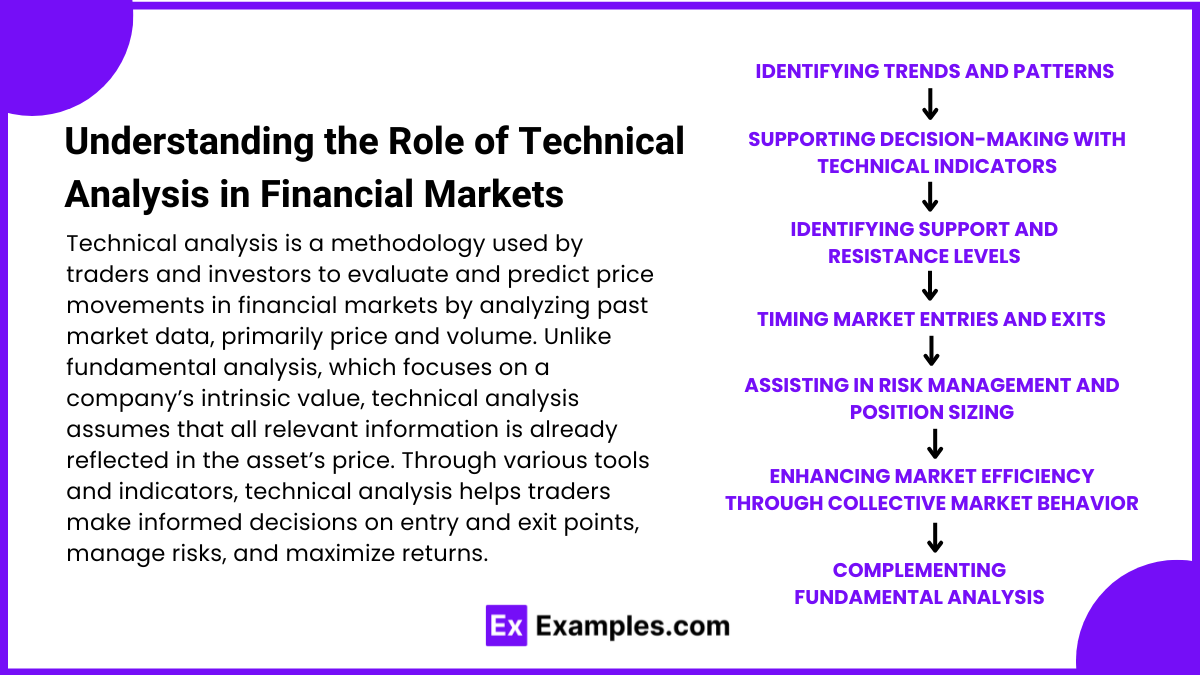
Technical analysis is a methodology used by traders and investors to evaluate and predict price movements in financial markets by analyzing past market data, primarily price and volume. Unlike fundamental analysis, which focuses on a company’s intrinsic value, technical analysis assumes that all relevant information is already reflected in the asset’s price. Through various tools and indicators, technical analysis helps traders make informed decisions on entry and exit points, manage risks, and maximize returns. Here’s an overview of the role of technical analysis in financial markets and its impact on trading strategies.
1. Identifying Trends and Patterns
One of the primary goals of technical analysis is to identify price trends and patterns. Understanding the direction and strength of a trend helps traders align their strategies with market momentum.
- Role: Detecting trends and patterns allows traders to anticipate future price movements based on past behavior, enhancing the probability of profitable trades.
- Outcome: Traders can follow trends (uptrend, downtrend, or sideways) and use them to decide whether to buy, sell, or hold an asset.
Example: A trader identifies a bullish trend using moving averages and chooses to enter a long position, expecting prices to continue rising.
2. Supporting Decision-Making with Technical Indicators
Technical analysis uses a wide array of indicators, such as moving averages, Relative Strength Index (RSI), and Bollinger Bands, to analyze price movements and momentum. These indicators provide additional insights into market conditions.
- Role: Indicators help traders evaluate overbought or oversold conditions, momentum shifts, and potential price reversals.
- Outcome: By using indicators, traders can refine their entry and exit points, making decisions that are more aligned with market conditions.
Example: A trader uses RSI to assess whether a stock is overbought (indicating a potential price drop) or oversold (indicating a potential price increase) and adjusts their trade strategy accordingly.
3. Identifying Support and Resistance Levels
Support and resistance levels are key price points where an asset’s price tends to pause, reverse, or experience increased buying or selling pressure. Identifying these levels is crucial for setting strategic buy and sell points.
- Role: Support and resistance levels help traders predict potential reversals or breakouts, allowing them to plan trades around these critical price points.
- Outcome: Understanding support and resistance aids in setting stop-loss and take-profit levels, helping manage risk effectively.
Example: A trader identifies a resistance level where a stock has historically faced selling pressure. They choose to sell when the stock approaches this level, anticipating a potential price reversal.
4. Timing Market Entries and Exits
Technical analysis helps traders determine the optimal moments to enter or exit a trade by analyzing short-term price patterns, volume, and momentum.
- Role: Timing is critical in trading, and technical analysis offers insights into when market sentiment may shift, allowing traders to capitalize on price movements.
- Outcome: Effective timing rA) Prices are expected to decline.educes the risk of entering too early or exiting too late, maximizing returns.
Example: A trader uses a crossover of moving averages (e.g., when the short-term moving average crosses above the long-term moving average) as a buy signal, entering the market at an opportune time.
5. Assisting in Risk Management and Position Sizing
Technical analysis is also valuable for risk management, helping traders set appropriate stop-loss and take-profit levels based on historical price movements and volatility.
- Role: By understanding price volatility and trends, traders can better manage risk by setting exit points that protect against excessive losses.
- Outcome: Risk management using technical analysis tools supports disciplined trading and helps traders avoid large losses.
Example: A trader places a stop-loss order slightly below a support level to limit potential losses if the price falls below that threshold, protecting their position.
6. Enhancing Market Efficiency through Collective Market Behavior
Technical analysis contributes to market efficiency by reflecting collective trader behavior. Since many traders rely on technical analysis, price patterns often self-reinforce as traders react to the same signals.
- Role: As more traders act on similar patterns and indicators, prices reflect shared market sentiment, contributing to efficient price discovery.
- Outcome: Market efficiency improves as price movements reflect the aggregation of trader actions based on technical analysis.
Example: Many traders see a breakout above a resistance level as a bullish signal and start buying, driving the price up and validating the breakout prediction.
7. Complementing Fundamental Analysis
While technical analysis focuses on price action, it can be used alongside fundamental analysis to form a well-rounded trading strategy. Technical analysis is often used for timing trades, while fundamental analysis may be used for selecting assets based on intrinsic value.
- Role: By combining the predictive elements of technical analysis with the valuation focus of fundamental analysis, traders can strengthen their decision-making process.
- Outcome: The dual approach of technical and fundamental analysis provides a more comprehensive view, allowing for both informed asset selection and optimized trade timing.
Example: An investor identifies a fundamentally strong stock and uses technical analysis to time the purchase when the stock is oversold, maximizing potential gains.
Recognizing Different Types of Financial Instruments
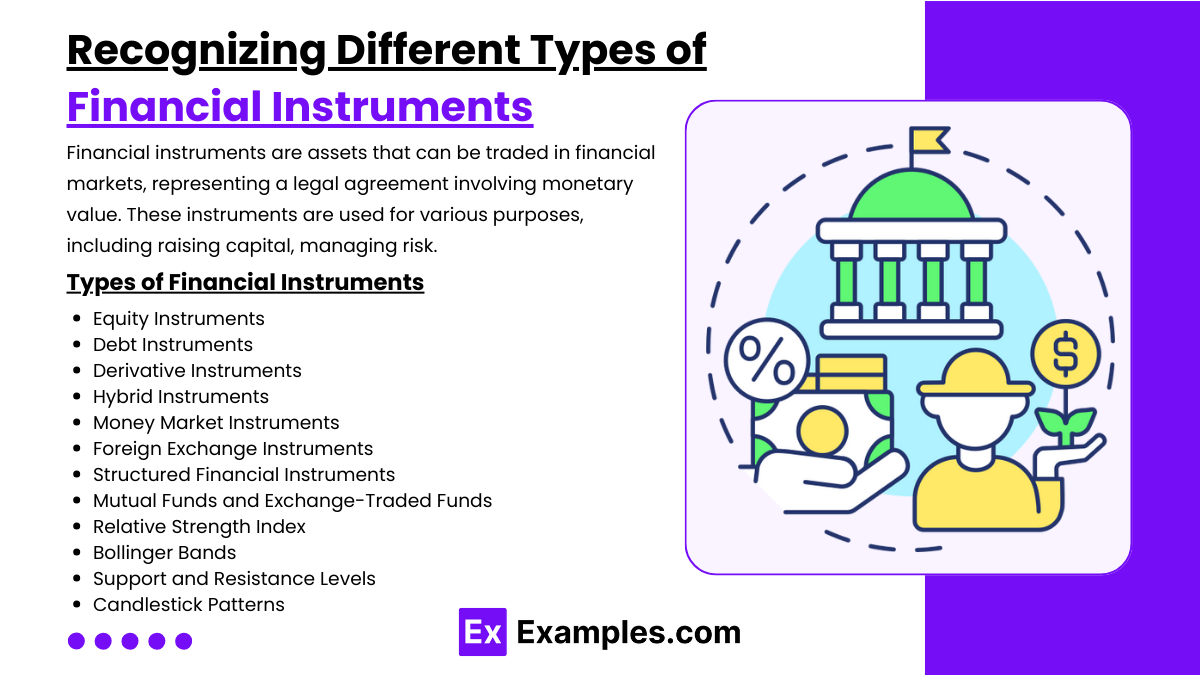
Financial instruments are assets that can be traded in financial markets, representing a legal agreement involving monetary value. These instruments are used for various purposes, including raising capital, managing risk, and facilitating investment. Understanding the different types of financial instruments is essential for investors, traders, and financial professionals as they each have distinct characteristics, risk levels, and purposes. Here’s an overview of the primary types of financial instruments:
Types of Financial Instruments
- Equity Instruments: Represent ownership in a company, entitling holders to a share of profits and, often, voting rights. Examples include common and preferred stocks.
- Debt Instruments: Involve lending money to an entity (like a corporation or government) in exchange for regular interest payments and repayment of the principal. Examples include bonds and debentures.
- Derivative Instruments: Contracts whose value is derived from an underlying asset, such as stocks, bonds, or commodities. Common derivatives include options and futures, often used for hedging risks or speculation.
- Hybrid Instruments: Combine characteristics of both debt and equity, offering benefits like fixed income with the potential for conversion to equity. Examples include convertible bonds and preferred convertible stocks.
- Money Market Instruments: Short-term, highly liquid debt securities with lower risk, typically maturing within a year. These are used for short-term funding and include Treasury bills and commercial paper.
- Foreign Exchange Instruments: Facilitate currency transactions, including spot and forward contracts, commonly used for hedging against currency risk in international trade.
- Structured Financial Instruments: Customized products combining different assets to meet specific investor needs, often with tailored risk and return characteristics. Examples include collateralized debt obligations (CDOs) and mortgage-backed securities (MBS).
- Mutual Funds and Exchange-Traded Funds (ETFs): Pooled investments offering diversification across multiple assets. Mutual funds are professionally managed and traded at the end of tMoving Averages: Moving averages smooth out price data to help identify the direction of a trend. Common types include the simple moving average (SMA) and exponential moving average (EMA). Moving averages also help in spotting trend reversals when different time frames cross.
- Relative Strength Index (RSI): The RSI is an oscillator that measures the speed and change of price movements to identify overbought and oversold conditions. An RSI above 70 often indicates overbought conditions, while below 30 signals oversold.
- Bollinger Bands: Bollinger Bands are volatility indicators that plot two standard deviations above and below a moving average. These bands help assess price volatility and potential breakout points.
- MACD (Moving Average Convergence Divergence): The MACD indicator shows the relationship between two moving averages and helps identify trend changes and momentum shifts. The MACD line crossing above the signal line is generally a bullish sign, while crossing below is bearish.
- Support and Resistance Levels: Support and resistance levels are horizontal lines where prices have historically reversed or paused. These levels are crucial for setting entry and exit points and anticipating price reactions.
- Candlestick Patterns: Candlestick patterns represent price action and reveal market sentiment. Patterns like doji, engulfing, and hammer can indicate potential reversals or continuations in price trends.
- Fibonacci Retracement: Fibonacci retracement levels are used to predict potential support and resistance areas during a price pullback. These levels are based on key Fibonacci ratios (e.g., 38.2%, 50%, and 61.8%).he day, while ETFs trade on stock exchanges like individual stocks.
- Insurance Products: Contracts that provide protection against risks such as life, health, or property loss. Some insurance products, like annuities and certain life insurance policies, also offer investment components.
- Cryptocurrency: Digital assets that operate on decentralized blockchain networks, primarily used for digital payments, investment, and speculative purposes. Examples include Bitcoin and Ethereum.
Gathering and Analyzing Historical Data for Pattern Recognition
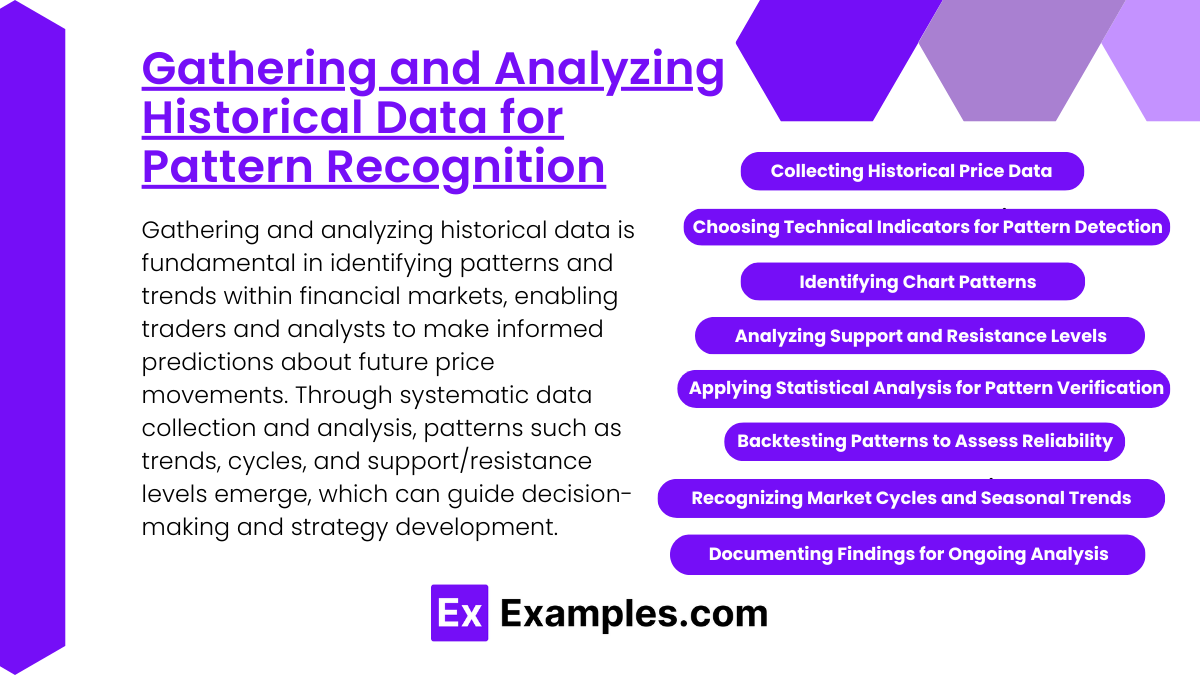
Gathering and analyzing historical data is fundamental in identifying patterns and trends within financial markets, enabling traders and analysts to make informed predictions about future price movements. Through systematic data collection and analysis, patterns such as trends, cycles, and support/resistance levels emerge, which can guide decision-making and strategy development. Here’s a step-by-step overview of how to gather and analyze historical data for pattern recognition:
Collecting Historical Price Data: Gathering historical price data provides the foundation for analyzing trends and identifying patterns. This data typically includes open, high, low, close prices, and trading volume, offering insight into market movements over time.
Example: A trader collects five years of daily price data for a stock to understand its long-term trends and volatility.
Choosing Technical Indicators for Pattern Detection: Technical indicators, like moving averages and the Relative Strength Index (RSI), help identify trends, momentum shifts, and potential price reversals. These indicators add structure to raw price data, making it easier to spot meaningful patterns.
Example: An analyst applies a 50-day moving average to track trend changes in a stock, observing crossover points as potential buy or sell signals.
Identifying Chart Patterns: Chart patterns, such as head-and-shoulders, double tops, flags, and triangles, visually represent recurring price behaviors and indicate potential trend continuations or reversals.
Example: A trader identifies a head-and-shoulders pattern in a stock chart, suggesting a potential reversal from an uptrend to a downtrend.
Analyzing Support and Resistance Levels: Support and resistance levels are price points where an asset’s price frequently pauses, reverses, or encounters buying or selling pressure. Recognizing these levels helps traders set strategic entry and exit points.
Example: By identifying a consistent support level in historical data, an analyst uses it as a potential buy signal when the stock price approaches this level again.
Applying Statistical Analysis for Pattern Verification: Statistical analysis confirms patterns by testing their consistency and significance. Tools like regression analysis and standard deviation calculations help assess the reliability of observed patterns.
Example: An analyst uses regression analysis to verify that a stock’s price tends to revert to its mean, supporting a mean-reversion trading strategy.
Backtesting Patterns to Assess Reliability: Backtesting involves testing identified patterns on historical data to evaluate their effectiveness in past scenarios, which helps validate the reliability of patterns and strategies before applying them in live markets.
Example: A trader backtests a moving average crossover strategy to see how well it would have performed on historical price data.
Recognizing Market Cycles and Seasonal Trends: Market cycles and seasonal trends are recurring patterns influenced by economic factors or market behavior, helping traders predict periods of growth, contraction, or sector rotation.
Example: Observing that retail stocks often perform well in the fourth quarter, a trader positions themselves accordingly to capture potential gains.
Documenting Findings for Ongoing Analysis: Documenting patterns, entry/exit points, and results allows traders to refine strategies over time and adjust them to evolving market conditions.
Example: A trader logs each identified pattern and its success rate, building a record that helps improve future trading decisions based on past performance.
Evaluating Tools and Techniques Used by Technical Analysts
Technical analysts use a variety of tools and techniques to study past price movements, volume, and patterns, with the aim of predicting future price trends and optimizing trading strategies. Here’s an overview of some of the most popular tools and techniques in technical analysis:
- Moving Averages: Moving averages smooth out price data to help identify the direction of a trend. Common types include the simple moving average (SMA) and exponential moving average (EMA). Moving averages also help in spotting trend reversals when different time frames cross.
- Relative Strength Index (RSI): The RSI is an oscillator that measures the speed and change of price movements to identify overbought and oversold conditions. An RSI above 70 often indicates overbought conditions, while below 30 signals oversold.
- Bollinger Bands: Bollinger Bands are volatility indicators that plot two standard deviations above and below a moving average. These bands help assess price volatility and potential breakout points.
- MACD (Moving Average Convergence Divergence): The MACD indicator shows the relationship between two moving averages and helps identify trend changes and momentum shifts. The MACD line crossing above the signal line is generally a bullish sign, while crossing below is bearish.
- Support and Resistance Levels: Support and resistance levels are horizontal lines where prices have historically reversed or paused. These levels are crucial for setting entry and exit points and anticipating price reactions.
- Candlestick Patterns: Candlestick patterns represent price action and reveal market sentiment. Patterns like doji, engulfing, and hammer can indicate potential reversals or continuations in price trends.
- Fibonacci Retracement: Fibonacci retracement levels are used to predict potential support and resistance areas during a price pullback. These levels are based on key Fibonacci ratios (e.g., 38.2%, 50%, and 61.8%).
Examples
Example 1: Stock Markets and Price Charts
Technical analysts utilize price charts from stock markets to identify trends and patterns in stock prices. For instance, a technical analyst may analyze a stock’s historical price movements using candlestick charts, which provide insights into market sentiment and potential future movements. This analysis helps traders make informed decisions about buying or selling stocks.
Example 2: Forex Trading and Currency Pairs
In the foreign exchange (Forex) market, technical analysts focus on currency pairs, such as EUR/USD or GBP/JPY. By examining price movements, support and resistance levels, and technical indicators like moving averages, analysts can predict currency trends and volatility. This analysis is crucial for forex traders seeking to capitalize on fluctuations in exchange rates.
Example 3: Commodities and Volume Analysis
Technical analysts also study commodities, such as gold, oil, and agricultural products. They analyze volume data alongside price changes to gauge the strength of price movements. For example, if the price of gold rises significantly with increasing trading volume, it may indicate strong bullish sentiment, leading traders to consider entering long positions.
Example 4: Bond Markets and Yield Curves
In the bond market, technical analysts examine yield curves to assess interest rate trends and the potential direction of bond prices. By analyzing the shapes of yield curves—normal, inverted, or flat—analysts can derive insights into market expectations regarding economic growth and inflation, aiding investment strategies in fixed-income securities.
Example 5: Technical Indicators and Signals
Technical analysts employ various indicators, such as the Relative Strength Index (RSI), Moving Average Convergence Divergence (MACD), and Bollinger Bands, to generate buy and sell signals. For instance, a technical analyst might use the RSI to identify overbought or oversold conditions in a stock, providing actionable insights for timing trades effectively in the market.
Practice Questions
Question 1
What is the primary focus of a technical analyst when evaluating market trends?
A) The underlying value of assets
B) Historical price movements and patterns
C) Economic indicators and news events
D) Fundamental analysis of company financials
Correct Answer: B) Historical price movements and patterns.
Explanation: Technical analysts primarily focus on historical price movements and patterns in the market. They believe that past price behavior can provide insights into future price trends. By analyzing charts and using technical indicators, they aim to identify trends, support and resistance levels, and potential reversal points, allowing them to make informed trading decisions. In contrast, options A, C, and D are more aligned with fundamental analysis, which evaluates the intrinsic value of assets based on economic data and financial statements.
Question 2
Which of the following tools is commonly used by technical analysts to identify potential buy and sell signals?
A) Economic reports
B) Financial ratios
C) Candlestick charts
D) Earnings announcements
Correct Answer: C) Candlestick charts.
Explanation: Candlestick charts are a popular tool among technical analysts for visualizing price movements over time. Each candlestick represents the open, close, high, and low prices for a specific period, allowing analysts to observe patterns that may indicate future market behavior. Candlestick patterns, such as “doji” or “hammer,” can suggest potential buy or sell signals. Options A, B, and D refer to tools used in fundamental analysis rather than technical analysis.
Question 3
In technical analysis, what does it mean when a market is described as being “overbought”?
A) Prices are expected to decline.
B) Prices are expected to rise.
C) The market has reached a new high.
D) Trading volume is decreasing.
Correct Answer: A) Prices are expected to decline.
Explanation: When a market is described as “overbought,” it indicates that the prices have risen significantly and may have surpassed their intrinsic value, suggesting a potential correction or decline. Technical analysts often use indicators like the Relative Strength Index (RSI) to identify overbought conditions. An overbought market indicates that there may be excessive buying pressure, which often leads to a pullback in prices. In contrast, options B, C, and D do not accurately reflect the implications of an overbought condition in technical analysis.

