Understanding “Price Trends and Volume” is essential for the CMT Exam, as it involves analyzing how price movements and trading volume interact to signal potential market shifts. Mastery of trend identification, volume analysis, and their combined implications on market sentiment enables informed predictions, aiding technical analysts in making strategic investment decisions.
Learning Objective
In studying “Price Trends and Volume” for the CMT Exam, you should learn to analyze how price movement and trading volume interact to indicate market sentiment and potential reversals. Examine key principles behind price trend identification, including support and resistance levels, trendlines, and moving averages. Evaluate volume analysis techniques such as volume spikes, accumulation, and distribution patterns to assess the strength of price movements. Additionally, explore how these concepts are applied in charting tools like candlestick patterns and volume indicators. Apply this knowledge to interpreting market behavior and make informed predictions in CMT practice scenarios.
Understanding Price Trends
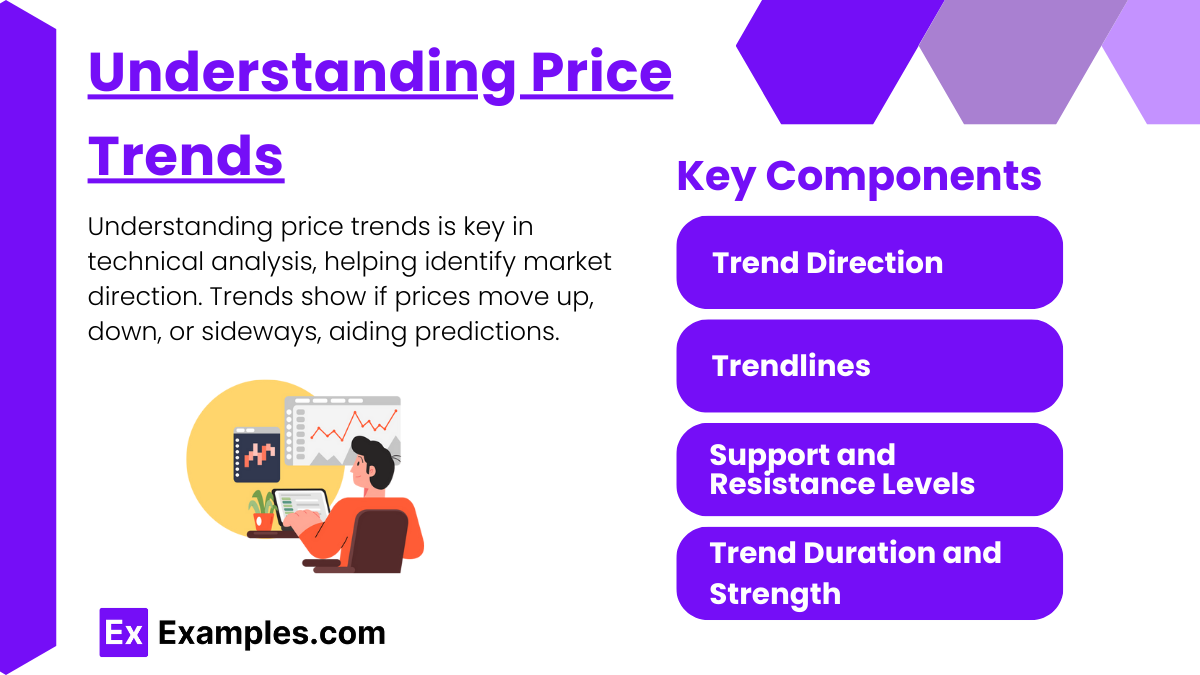
Understanding price trends is fundamental for technical analysis, as it helps identify the general direction of a market or asset over time. A trend represents the trajectory of prices over a period, showing whether prices are moving upward (uptrend), downward (downtrend), or sideways (consolidation). By recognizing these patterns, technical analysts can make more informed predictions about future price movements.
Key Components in Price Trends
- Trend Direction:
- Uptrend: Characterized by higher highs and higher lows, indicating consistent buying pressure.
- Downtrend: Marked by lower highs and lower lows, signaling sustained selling pressure.
- Sideways or Range-Bound: Prices move within a narrow range, suggesting balance between buyers and sellers with no strong directional movement.
- Trendlines:
- Drawing trendlines helps visualize the direction and strength of a trend. An upward trendline is drawn by connecting successive higher lows, while a downward trendline connects lower highs. These lines act as dynamic support and resistance, providing insight into potential reversal points.
- Support and Resistance Levels:
- Support is a price level where demand is strong enough to prevent further price decline, while resistance is a level where selling pressure is likely to cap further price rises. Observing how price reacts to these levels can help predict future trend behavior, as breaking through support or resistance often signals trend continuation or reversal.
- Trend Duration and Strength:
- Trends can be categorized by their duration: short-term, intermediate, or long-term. Analyzing the strength of a trend—often indicated by volume or velocity of price change—can reveal the reliability of the trend. Strong trends with high volume tend to last longer, while weak trends are more prone to reversal.
Importance of Recognizing Trends
Recognizing trends allows traders to align their strategies with the current market direction. Trading in the direction of the trend, a practice known as “trend following,” can enhance profitability by reducing the likelihood of counter-trend losses. Moreover, understanding trends enables the identification of strategic entry and exit points, helping traders maximize their gains and manage risks effectively
Role of Volume in Technical Analysis
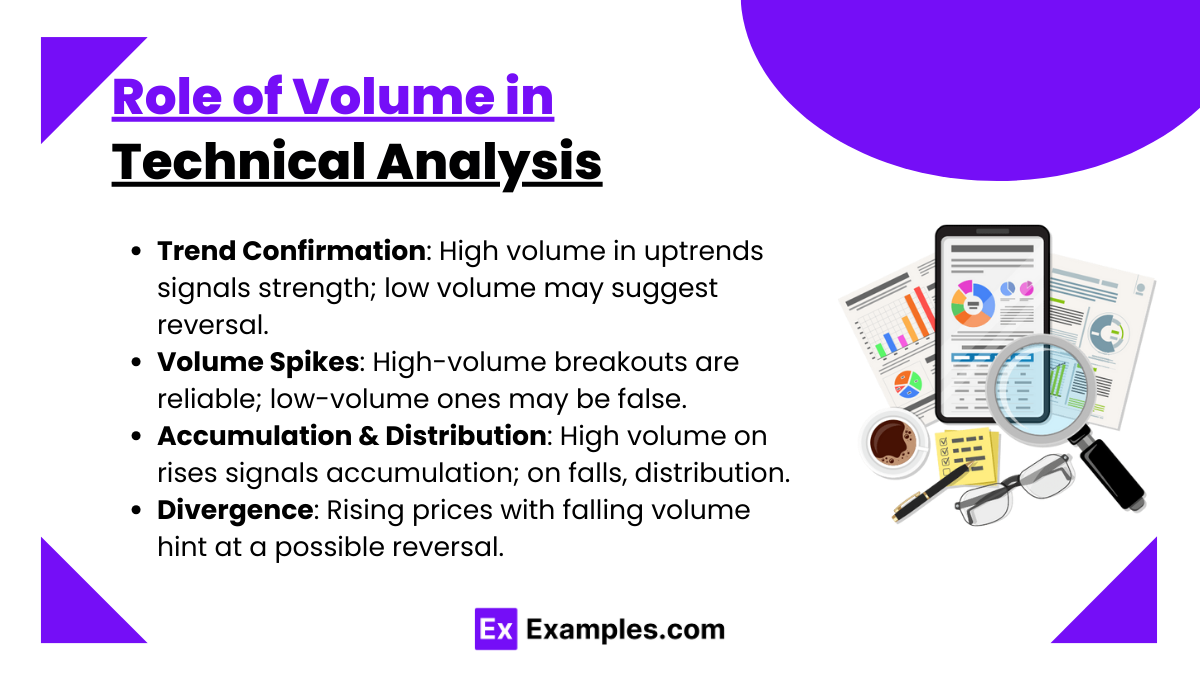
The role of volume in technical analysis is to confirm price movements and gauge the strength of trends. Volume represents the number of shares or contracts traded over a specific period, indicating the level of market activity. Higher volume typically suggests stronger conviction in a price move, while low volume may signal a weaker or temporary movement.
Key Aspects of Volume in Analysis
- Trend Confirmation:
- Volume helps confirm trends. For example, in an uptrend, rising prices accompanied by increasing volume suggest strong buying interest and a likely continuation. Conversely, if an uptrend occurs with declining volume, it may indicate weakening interest, signaling a potential reversal.
- Volume Spikes:
- Sudden increases, or spikes, in volume can signal key market events, such as breakouts from support or resistance levels. A breakout with high volume is more reliable and suggests a true shift, while low-volume breakouts are more likely to be false or short-lived.
- Accumulation and Distribution:
- High volume during price increases indicates accumulation, where buyers dominate, often seen before an uptrend. High volume during price decreases, known as distribution, signals selling pressure and potential downtrends.
- Divergence:
- Volume divergence occurs when price movement is not supported by volume. For example, if prices are rising but volume is decreasing, it may suggest that fewer participants are driving the price, hinting at a possible reversal
Integrating Price and Volume Indicators
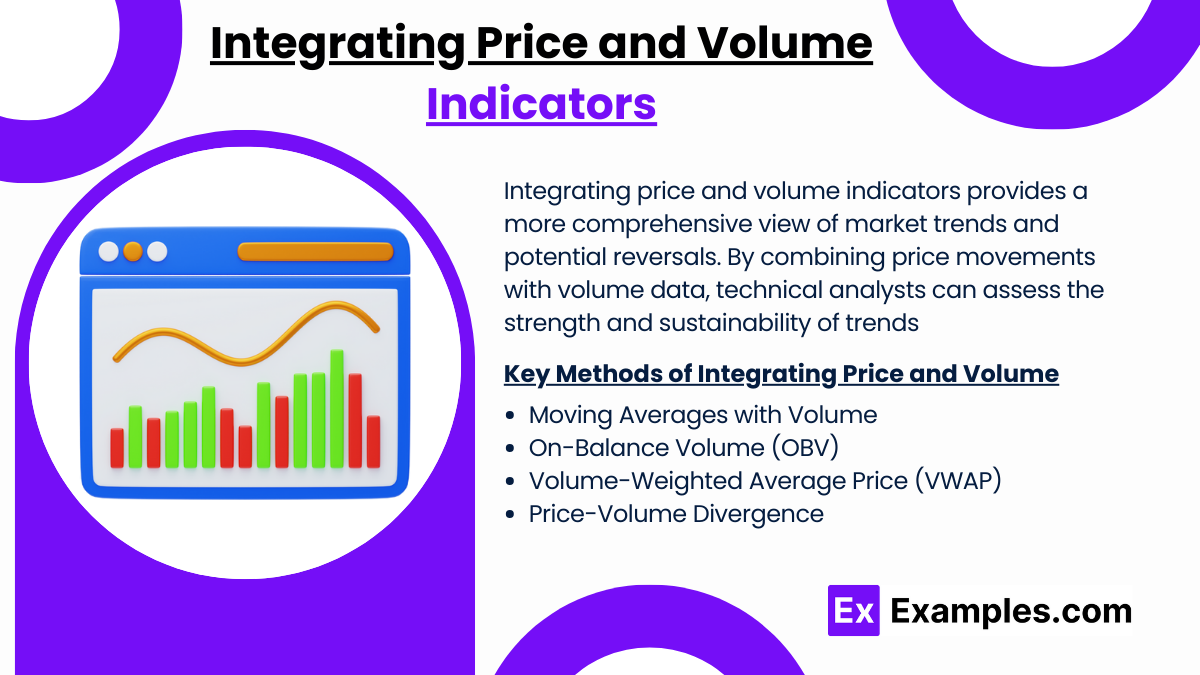
Integrating price and volume indicators provides a more comprehensive view of market trends and potential reversals. By combining price movements with volume data, technical analysts can assess the strength and sustainability of trends.
Key Methods of Integrating Price and Volume
- Moving Averages with Volume:
- Moving averages smooth out price data to reveal trends over time. When combined with volume, they help confirm these trends. For instance, if price crosses above a moving average with rising volume, it signals a strong bullish trend. If volume is low, the move may lack conviction.
- On-Balance Volume (OBV):
- OBV is a cumulative volume indicator that adds volume on up days and subtracts it on down days. It reflects whether volume is flowing in or out of an asset. Rising OBV with rising prices confirms an uptrend, while falling OBV with rising prices may indicate a weakening trend.
- Volume-Weighted Average Price (VWAP):
- VWAP combines price and volume to show the average price at which an asset has traded throughout the day, weighted by volume. It’s often used as a benchmark; if prices are above VWAP, it suggests bullish sentiment, while prices below VWAP indicate bearish sentiment.
- Price-Volume Divergence:
- Divergence between price and volume indicators, such as when prices rise but volume declines, can signal a potential trend reversal. This divergence suggests that fewer participants are supporting the price move, indicating a weaker trend
Application of Price and Volume in Market Analysis

The application of price and volume in market analysis allows traders to assess market sentiment, confirm trends, and make informed trading decisions. By analyzing both price movements and volume, traders gain insights into the strength and reliability of price trends.
Key Applications
- Trend Confirmation:
- Price trends accompanied by strong volume are more likely to be sustainable. For example, if an uptrend shows high volume, it confirms strong buying interest. Conversely, if an uptrend is accompanied by low volume, it may be weak and vulnerable to reversal.
- Identifying Reversals:
- Volume helps signal potential trend reversals. When price moves against a prevailing trend with high volume, it can indicate a reversal. For instance, a significant price drop with high volume after an uptrend suggests a shift to bearish sentiment.
- Breakout Validation:
- Breakouts above resistance or below support are more reliable when accompanied by high volume. A breakout with strong volume confirms genuine interest and increases the likelihood of a continued move, whereas a low-volume breakout may indicate a false signal.
- Market Sentiment Analysis:
- High volume during specific price movements reflects the conviction of market participants, showing their enthusiasm or fear. This sentiment insight helps traders understand whether a trend is driven by strong belief or merely speculative moves.
By applying price and volume analysis, traders can validate trends, spot potential reversals, and gauge market sentiment for more strategic trading decisions
Examples
Example 1
In an uptrend, if price consistently makes higher highs and is accompanied by increasing volume, it suggests a strong bullish sentiment, indicating that the trend is likely to continue.
Example 2
During a downtrend, if prices make lower lows with rising volume, this signifies strong selling pressure. This is often seen as a confirmation of the downtrend, suggesting it may persist.
Example 3
If a stock breaks above a resistance level with a spike in volume, this breakout is more likely to be genuine, as high volume indicates strong buying interest and increases the probability of further upward movement.
Example 4
In a consolidation phase, if price remains range-bound but volume begins to increase, it could signal an impending breakout. Monitoring the direction of the breakout with volume will help confirm the next trend.
Example 5
When price rises, but volume declines, it may indicate a weakening trend. This divergence between price and volume can be an early signal that the uptrend is losing momentum and could potentially reverse
Practice Questions
Question 1
What does increasing volume during a price uptrend typically indicate?
A) Weakening buying interest
B) Strong buying interest
C) Potential trend reversal
D) Lack of market participation
Answer: B) Strong buying interest
Explanation: Increasing volume in an uptrend signals that more participants are buying, reinforcing the trend and suggesting it is likely to continue. High volume supports the strength of the uptrend.
Question 2
A stock breaks above its resistance level, but volume remains low. What does this situation most likely suggest?
A) A strong and reliable breakout
B) A likely continuation of the trend
C) A possible false breakout
D) Increased bullish sentiment
Answer: C) A possible false breakout
Explanation: A breakout with low volume may indicate weak interest, suggesting the move may not be sustainable. Without strong volume, the breakout is more likely to be a false signal and prone to reversal.
Question 3
If prices are rising while volume is decreasing, what does this divergence often indicate?
A) A continuation of the trend
B) A potential trend reversal
C) Increased buying pressure
D) Strong market sentiment
Answer: B) A potential trend reversal
Explanation: When prices rise but volume declines, it suggests fewer participants are supporting the trend. This divergence often indicates that the trend is losing strength, which can be a signal of an impending reversal

