Preparing for the CMT Exam requires a comprehensive understanding of “Concepts in Cycle Theory,” a crucial component of technical analysis. Mastery of market cycles, including their phases and timing, is essential. This knowledge provides insights into market trends, timing for entry and exit points, and overall market behavior, critical for achieving a high CMT score.
Learning Objective
In studying “Concepts in Cycle Theory” for the CMT Exam, you should learn to understand the foundational concepts and applications of cycle theory in market analysis. Analyze how different market cycles, including business, economic, and stock cycles, influence market behavior and price movements. Evaluate the principles behind identifying and measuring cycles, such as amplitude, period, and phase. Additionally, explore how these cycles can be used to forecast market trends and turning points. Apply this knowledge to enhance your ability to make informed trading decisions by aligning strategies with cyclical movements, thus improving market entry and exit timing based on cyclical indicators.
Introduction to Cycle Theory
Cycle theory is a fascinating concept in economics and financial markets that examines the patterns and rhythms through which markets and economic activities rise and fall. It provides insights into the cyclical nature of market behavior, influenced by various economic indicators, investor sentiment, and external macroeconomic factors. Understanding cycle theory can significantly aid investors and economists in forecasting future movements and making informed decisions.
Foundations of Cycle Theory
- Business Cycles: These consist of periods of expansion (growth in GDP, employment, and production), peak, contraction (recession), and trough. Economists like to identify these cycles to predict changes in economic policies and business conditions.
- Stock Market Cycles: These refer to long-term price patterns that emerge in financial markets. These can include bull markets (periods of rising prices) and bear markets (periods of falling prices).
- Real Estate Cycles, Commodity Cycles, and Interest Rate Cycles: Specific sectors like real estate, commodities, and the bond market also exhibit cyclical behavior influenced by broader economic factors and sector-specific drivers.
Types of Market Cycles
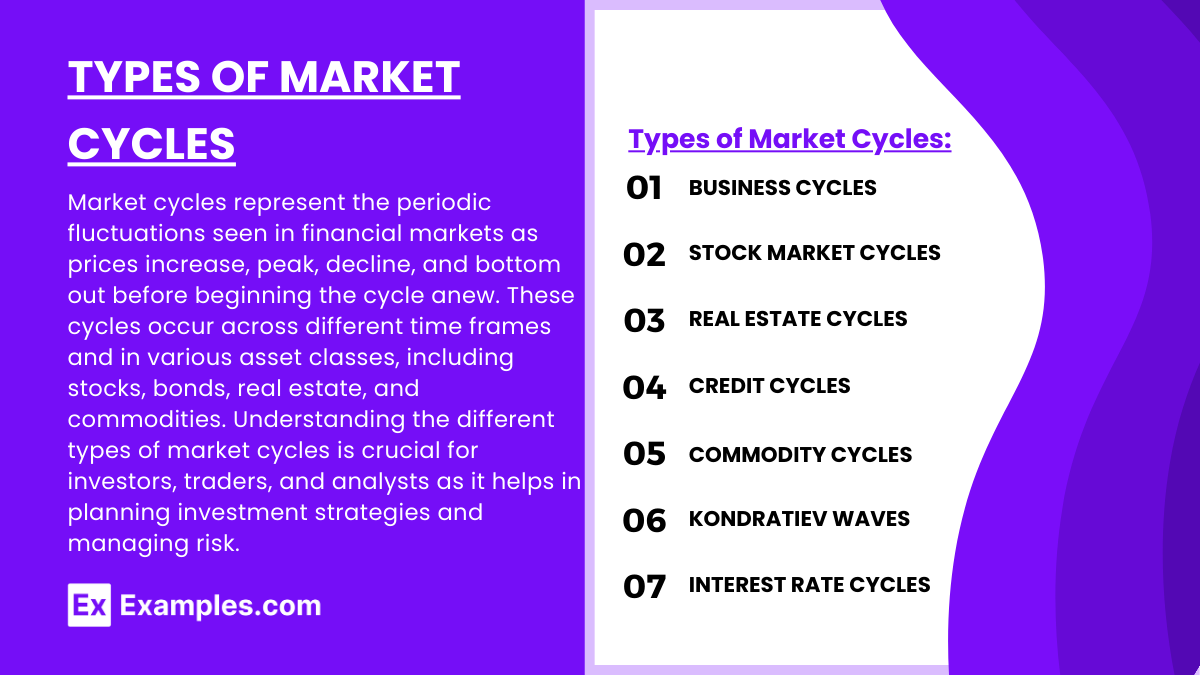
Market cycles represent the periodic fluctuations seen in financial markets as prices increase, peak, decline, and bottom out before beginning the cycle anew. These cycles occur across different time frames and in various asset classes, including stocks, bonds, real estate, and commodities. Understanding the different types of market cycles is crucial for investors, traders, and analysts as it helps in planning investment strategies and managing risk. Here’s an overview of the primary types of market cycles:
1. Business Cycles
- Phases: Expansion, Peak, Contraction (Recession), and Trough.
- Impact: Affects economic indicators like GDP, employment, and consumer spending, influencing all sectors of the economy.
2. Stock Market Cycles
- Bull Markets: Characterized by a rise in stock prices by 20% or more, driven by economic strength and investor optimism.
- Bear Markets: Marked by a decrease in stock prices by 20% or more, often triggered by economic slowdowns and investor pessimism.
3. Real Estate Cycles
- Phases: Recovery, Expansion, Hyper Supply, and Recession.
- Drivers: Influenced by interest rates, economic conditions, and regulatory changes.
4. Credit Cycles
- Expansion: Increased lending and relaxed credit standards that boost economic activity.
- Contraction: Tightened credit and higher interest rates that may slow economic growth.
5. Commodity Cycles
- Influences: Driven by global supply and demand, technological changes, and macroeconomic factors.
- Examples: Oil price cycles influenced by geopolitical events, OPEC policies, and shifts in energy consumption.
6. Kondratiev Waves
- Description: Long economic cycles lasting 40-60 years, driven by technological innovations and significant societal changes.
7. Interest Rate Cycles
- Rising Rates: Typically in strong economies to manage growth and control inflation.
- Falling Rates: Usually in weaker economies to stimulate borrowing and investment.
Identifying Cycles
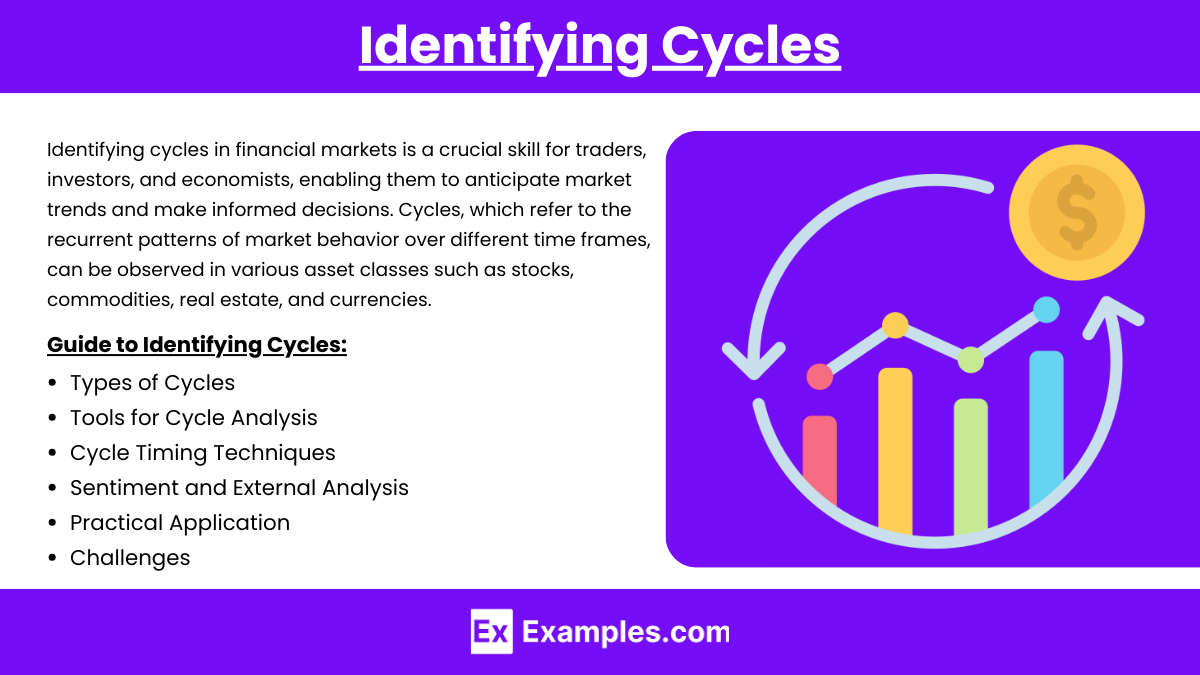
Identifying cycles in financial markets is a crucial skill for traders, investors, and economists, enabling them to anticipate market trends and make informed decisions. Cycles, which refer to the recurrent patterns of market behavior over different time frames, can be observed in various asset classes such as stocks, commodities, real estate, and currencies. Here’s a guide to identifying cycles:
1. Types of Cycles
- Business Cycles: Fluctuations in economic activity, including expansion and contraction phases.
- Stock Market Cycles: Periods of bull (rising) and bear (falling) markets.
- Commodity Cycles: Driven by changes in supply and demand, often influenced by external factors.
- Interest Rate Cycles: The rise and fall of interest rates affecting the economy and financial markets.
2. Tools for Cycle Analysis
- Historical Data: Analyze past trends to identify cycle patterns and durations.
- Moving Averages: Utilize to smooth out price data and highlight underlying trends.
- Technical Indicators: RSI for detecting overbought/oversold conditions, and MACD for momentum and trend changes.
3. Cycle Timing Techniques
- Elliott Wave Theory: Identifies cyclical wave patterns in market price movements.
- Gann Angles: Geometric tools for predicting future price movements based on time and price.
- Cycle Lines: Chart tools that project the duration of future cycles based on historical cycles.
4. Sentiment and External Analysis
- Market Sentiment Tools: Use indicators like the Put/Call Ratio and VIX to gauge market sentiment.
- Economic Indicators: Monitor GDP growth, employment stats, and other economic data to predict economic cycles.
5. Practical Application
- Backtesting: Test cycle theories against historical data to gauge their predictive accuracy.
- Real-Time Monitoring: Continuously observe market indicators to spot the beginnings or endings of cycles.
6. Challenges
- Multiple Overlapping Cycles: Be aware of intersecting cycles that can complicate analysis.
- External Shocks: Unexpected geopolitical or economic events can disrupt established cycle patterns.
Cycle-Based Trading Strategies
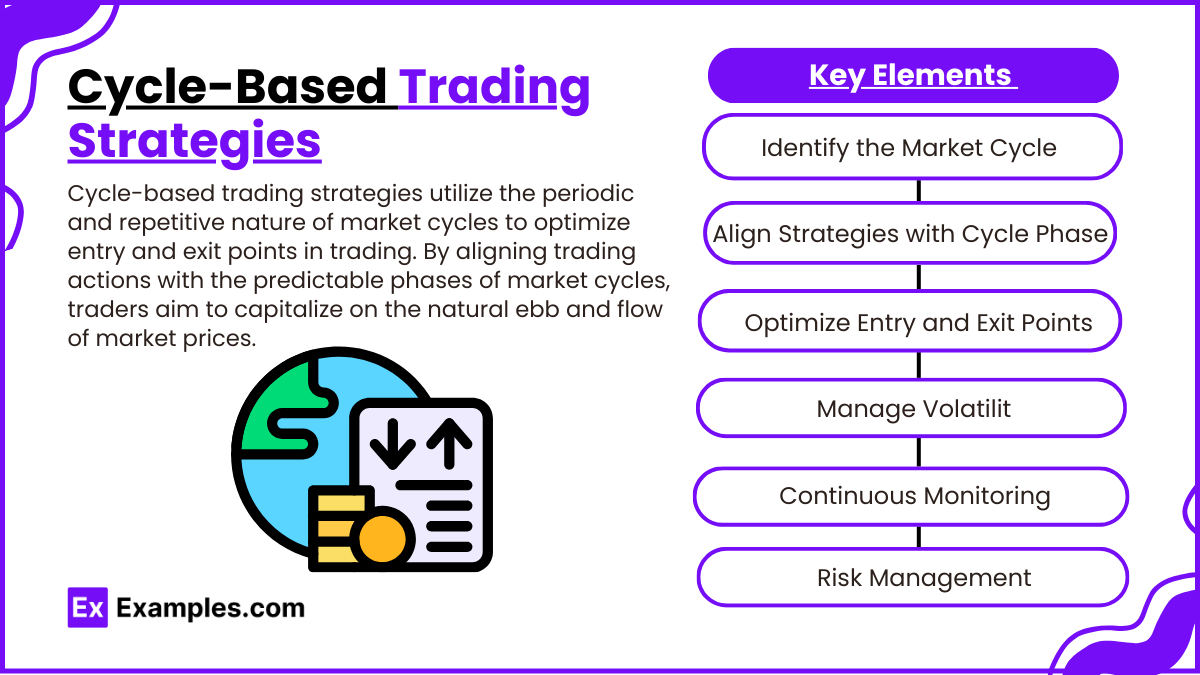
Cycle-based trading strategies utilize the periodic and repetitive nature of market cycles to optimize entry and exit points in trading. By aligning trading actions with the predictable phases of market cycles, traders aim to capitalize on the natural ebb and flow of market prices. Here’s how to implement cycle-based trading strategies effectively:
Key Elements of Cycle-Based Trading Strategies:
- Identify the Market Cycle:
- Utilize technical indicators like moving averages, RSI, and MACD to identify current market phases (expansion, peak, contraction, trough).
- Align Strategies with Cycle Phase:
- Bull Phases: Implement buying strategies focusing on assets that typically gain value during economic growth.
- Bear Phases: Consider short-selling or defensive assets like bonds, which tend to hold value or increase during market downturns.
- Optimize Entry and Exit Points:
- Use cyclical indicators to determine optimal entry and exit points, enhancing returns by timing the market more effectively.
- Manage Volatility:
- Adjust trading strategies based on volatility levels, using tools like Bollinger Bands to set appropriate risk levels and stop-loss orders.
- Continuous Monitoring and Adjustment:
- Regularly update strategies based on real-time economic data and market indicators to adapt to new information or shifts in market cycles.
- Risk Management:
- Incorporate risk management practices by adjusting position sizes and employing strategic stop-loss settings to protect against unexpected market moves.
Examples
Example 1: Business Cycle Influence on Sector Performance
During the expansion phase of the business cycle, sectors like consumer discretionary and technology often outperform due to increased consumer spending and investment in innovation. Conversely, during recession phases, defensive sectors like utilities and consumer staples typically perform better as they are less sensitive to economic downturns.
Example 2: Elliott Wave Theory in Stock Market Trends
A technical analyst uses Elliott Wave Theory to predict future price movements in the NASDAQ index. By identifying a completed five-wave advance followed by a three-wave correction, the analyst predicts the onset of another five-wave uptrend, suggesting a strategic buying opportunity.
Example 3: Seasonal Patterns in Commodity Markets
In agricultural commodities, prices often exhibit seasonal patterns. For instance, wheat prices may rise during the planting season due to speculative demand and fall after the harvest is complete when the market absorbs the new supply, demonstrating a predictable cyclical behavior.
Example 4: Four-Year Presidential Election Cycle Impact on Equities
Historical analysis shows that U.S. stock markets tend to perform better in the third year of a presidential term. Traders might increase equity exposure based on this cycle theory, anticipating policy decisions that aim to stimulate the economy ahead of elections.
Example 5: Interest Rate Cycles Affecting Bond Prices
Interest rates generally move in longer-term cycles influenced by central bank policies. When rates are cut during an economic slowdown, bond prices rise as the fixed returns become more attractive relative to new bonds issued at lower rates. Conversely, when rates rise, existing bond prices fall. Understanding this cycle can help bond traders time their market entries and exits more effectively.
Practice Questions
Question 1
What does the peak phase of a business cycle typically indicate?
A. Economic contraction is imminent
B. The economy is at its most robust point
C. Expansion policies by the government
D. Interest rates are at their lowest
Answer:
A. Economic contraction is imminent
Explanation:
The peak phase of a business cycle indicates that the economy has reached its maximum output and economic contraction is likely imminent. This phase is characterized by high levels of production, employment, and consumer spending, but these will typically decrease as the economy begins to cool down and enter the contraction phase.
Question 2
Which of the following is a common tool used in cycle analysis to identify the frequency of cycles in a time series data?
A. Fibonacci retracement
B. Bollinger Bands
C. Spectral analysis
D. Moving average convergence divergence (MACD)
Answer:
C. Spectral analysis
Explanation:
Spectral analysis is a statistical technique used in cycle analysis to identify the frequency of cycles within time series data. This tool helps analysts decompose a series into its sinusoidal components, providing a clear view of the periodicities that dominate the movement in the data, which is crucial for forecasting and modeling based on cycles.
Question 3
Which cycle theory would suggest that stock prices are influenced by natural and predictable rhythms found in nature?
A. Efficient Market Hypothesis
B. Random Walk Theory
C. Elliott Wave Theory
D. Modern Portfolio Theory
Answer:
C. Elliott Wave Theory
Explanation:
Elliott Wave Theory suggests that stock prices move in natural and predictable rhythmic patterns which can be observed and forecasted. According to this theory, markets move in repetitive cycles, which are influenced by investor psychology and external conditions. This theory posits that these movements are not random but instead follow a discernible order within a series of waves.

