Preparing for the CMT Exam requires a solid grasp of “Trend Systems Part 1,” a core aspect of technical analysis. Mastery of trend identification, trend lines, and trend-following indicators is vital. Understanding these concepts aids in predicting market movements, enhancing trading strategies, and is essential for a high score on the CMT Exam.
Learning Objective
In studying “Trend Systems Part 1” for the CMT Exam, you should develop a deep understanding of how trends are identified and utilized in technical analysis. Learn to distinguish between different types of trends, such as short-term, intermediate, and long-term trends, and understand the significance of trend lines and channels. Master the application of various trend-following indicators like moving averages and MACD. Evaluate the principles underlying these tools and their practical implications in trading strategies. Additionally, analyze real-world charts to identify trends and interpret their potential impacts on market behavior, preparing you for practical and theoretical questions on the CMT Exam.
Understanding Trend Types

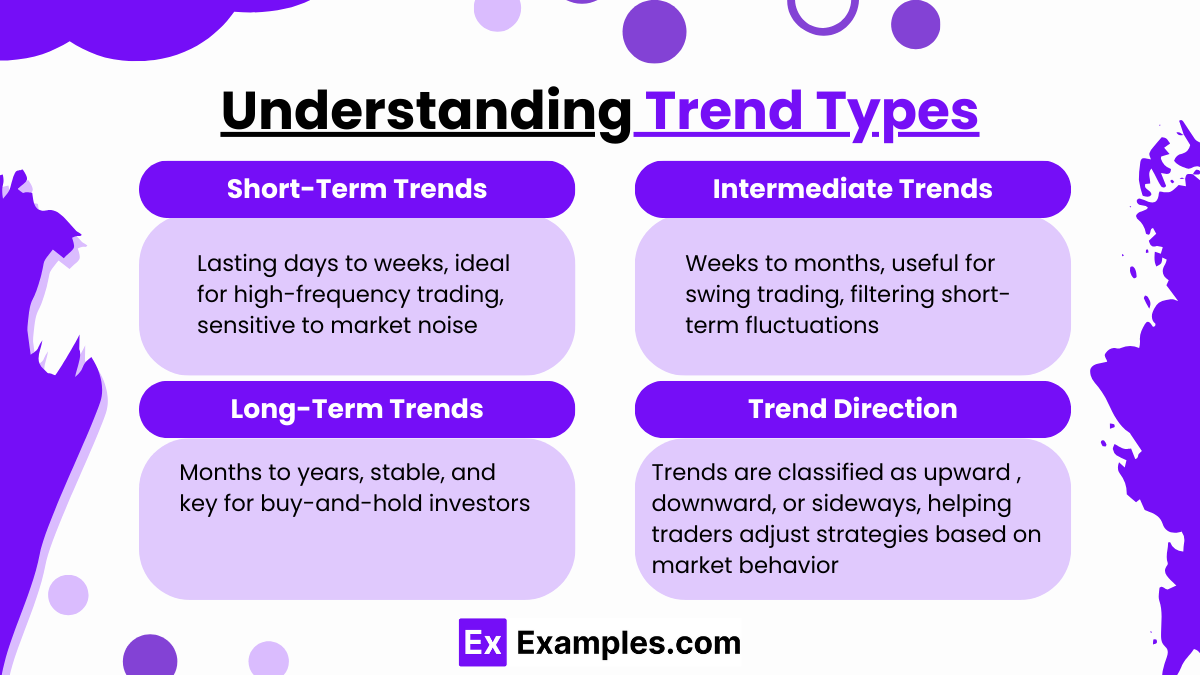
Understanding trend types is fundamental to technical analysis in the CMT Exam. Trends reflect the general direction of price movements over a given period and are crucial in predicting future price behavior. Trends are typically categorized by duration: short-term, intermediate, and long-term, each serving different purposes in market analysis and trading strategy.
- Short-Term Trends
Short-term trends, often lasting from a few days to several weeks, are useful for day-to-day trading decisions and are highly sensitive to market noise and volatility. They can shift quickly, requiring traders to use fast-reacting indicators, such as shorter moving averages, to stay aligned with immediate market movements. While short-term trends may not indicate the overall market direction, they are valuable for high-frequency trading or short-term strategies. - Intermediate Trends
Intermediate trends span from several weeks to a few months and represent the medium-term outlook in a market. These trends are often considered “primary trends” in that they filter out the minor fluctuations seen in shorter time frames. Intermediate trends are valuable for swing traders who aim to capitalize on market moves within this time frame. They also help confirm the direction of the overall trend and are often analyzed in conjunction with long-term trends. - Long-Term Trends
Long-term trends, lasting from several months to years, reflect the underlying direction of the market or asset over an extended period. These trends help investors distinguish between temporary fluctuations and the asset’s general movement. Long-term trends are critical for buy-and-hold investors, as they indicate market sentiment over time. They are typically less affected by short-term news and economic events, providing a stable foundation for long-term investment decisions. - Trend Direction and Classification
Trends are also classified based on their direction: upward (bullish), downward (bearish), and sideways (consolidation). An upward trend consists of higher highs and higher lows, signaling investor optimism. A downward trend shows lower highs and lower lows, indicating bearish sentiment. A sideways trend occurs when price moves within a horizontal range, suggesting market indecision. Recognizing these classifications helps traders adapt their strategies according to the market’s current behavior
Trend Line Construction and Analysis

Trend line construction and analysis are foundational techniques in technical analysis, helping traders identify and follow market trends. A trend line is a straight line drawn on a price chart to connect key highs or lows, highlighting the direction and strength of a trend. By analyzing these lines, traders can identify potential support and resistance levels and make more informed trading decisions. Here’s a closer look at how to construct and interpret trend lines effectively.
- Drawing Accurate Trend Lines
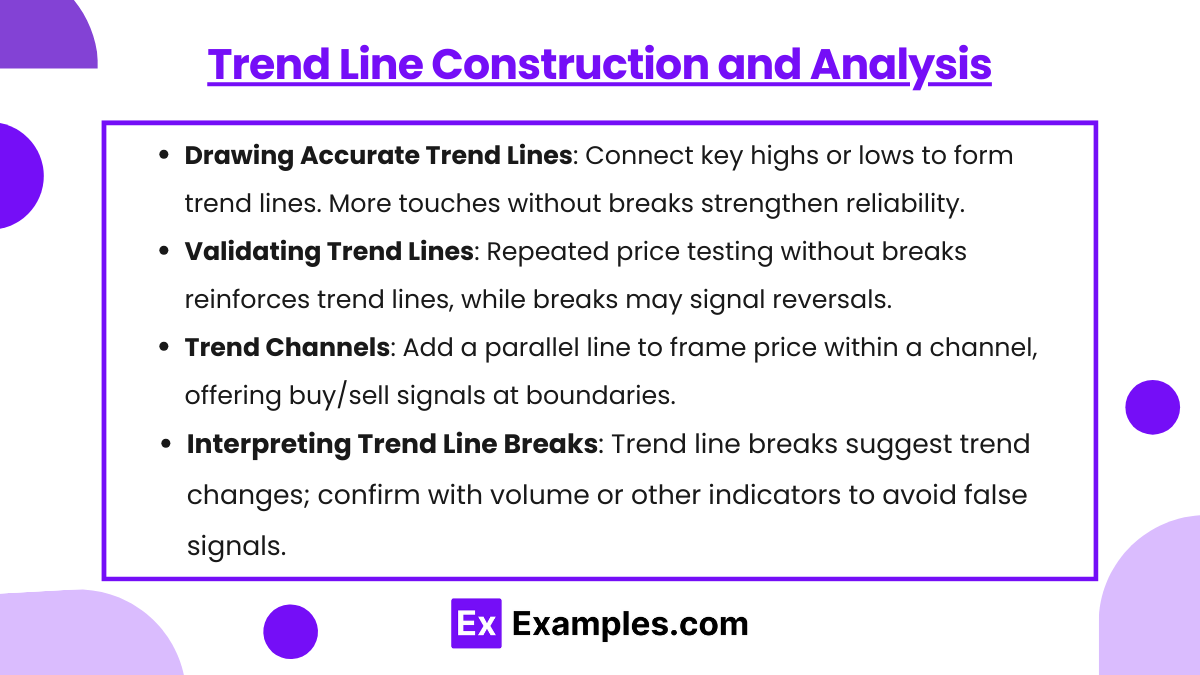
Trend lines are created by connecting at least two significant price points on a chart. For an uptrend line, connect two or more rising lows, forming a line that shows the market’s support level. For a downtrend line, connect two or more declining highs, indicating resistance. The more times a price touches the trend line without breaking it, the stronger and more reliable the trend line becomes. Ensuring accuracy in drawing trend lines requires identifying clear price peaks and troughs, avoiding minor fluctuations or “market noise” that can distort the line’s relevance. - Validating Trend Lines
A trend line is more reliable when price tests it multiple times without breaking through. For instance, an uptrend line gains strength with each bounce off the line, as it signals consistent buying pressure at those levels. A trend line that’s tested frequently and holds its position becomes a stronger indicator of the trend’s continuation. Conversely, if the price breaks a trend line with a significant close below (for an uptrend) or above (for a downtrend), it can signal a potential trend reversal or weakening momentum. - Trend Channels
Trend channels are created by adding a parallel line to a trend line, on the opposite side of the price action. This secondary line helps identify both the primary trend’s support (the main trend line) and resistance (the parallel line), framing price movement within a “channel.” Channels can be ascending, descending, or horizontal, depending on the trend’s direction. Within the channel, price tends to oscillate between support and resistance, giving traders potential buy signals near the lower boundary and sell signals near the upper boundary. - Interpreting Trend Line Breaks
When the price breaks a trend line, it often indicates a potential change in trend direction. A break of an uptrend line, for instance, suggests that the buying pressure supporting the trend has weakened, possibly leading to a reversal or a sideways trend. Similarly, breaking a downtrend line can indicate a shift from selling to buying pressure. Analysts look for additional confirmation, such as increased volume or other technical indicators, to confirm that the trend break is significant and not a temporary fluctuation.
Trend-Following Indicators

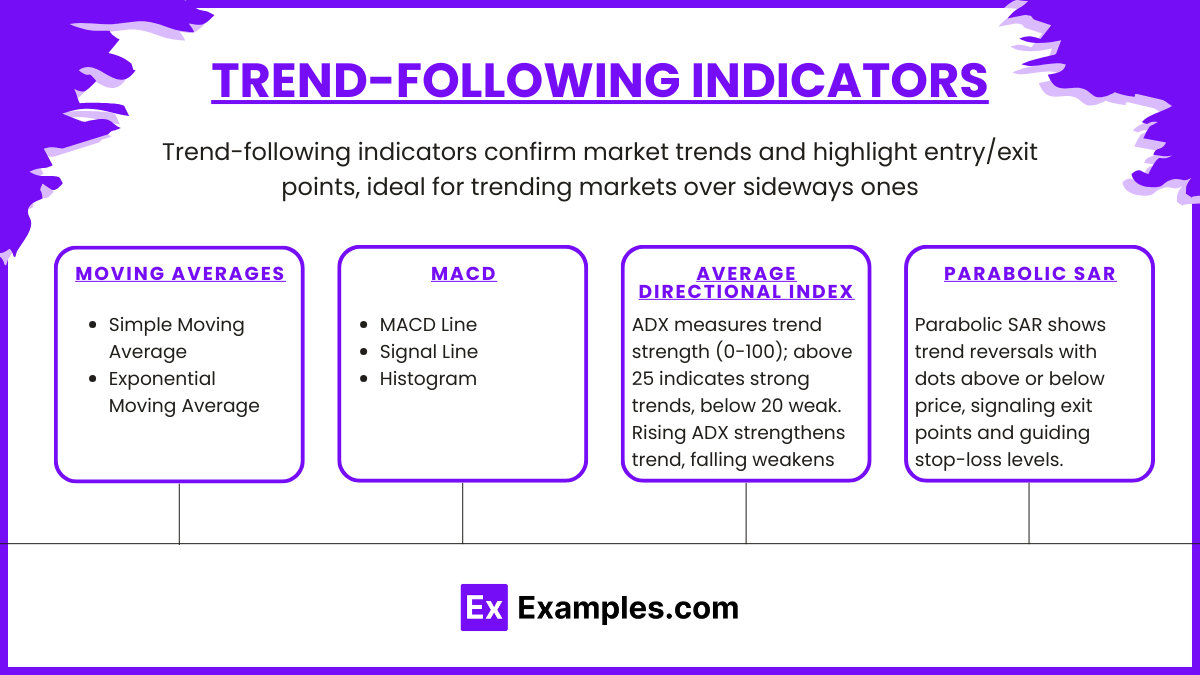
Trend-following indicators are essential tools in technical analysis, helping traders and analysts confirm and follow market trends. These indicators are designed to highlight the prevailing direction of a trend and assist in identifying key points for potential entry or exit from trades. Unlike oscillators, which are often used in range-bound or sideways markets, trend-following indicators work best in trending markets. Here’s a breakdown of some popular trend-following indicators and their applications.
- Moving Averages
Moving averages (MAs) are among the most widely used trend-following indicators. They smooth out price data over a specified period, making it easier to observe the underlying trend. There are two main types:- Simple Moving Average (SMA): Calculates the average price over a set period by equally weighting each price point. For example, a 50-day SMA adds the closing prices of the last 50 days and divides by 50. SMAs are useful for spotting overall trends but may lag due to equal weighting.
- Exponential Moving Average (EMA): Puts more weight on recent prices, allowing it to respond more quickly to price changes than the SMA. This sensitivity makes the EMA particularly helpful for short-term traders who want to detect trend reversals earlier.
- Moving Average Convergence Divergence (MACD)
The MACD is a versatile trend-following and momentum indicator that shows the relationship between two moving averages of a security’s price, typically the 12-day EMA and the 26-day EMA. MACD consists of three main components:- MACD Line: The difference between the 12-day and 26-day EMAs.
- Signal Line: A 9-day EMA of the MACD line, plotted on top of the MACD to indicate buy or sell signals.
- Histogram: Shows the difference between the MACD line and the Signal line, helping identify when the MACD is above or below the signal line, signaling bullish or bearish momentum.
- Average Directional Index (ADX)
The ADX measures the strength of a trend, regardless of direction, on a scale from 0 to 100. Values above 25 typically suggest a strong trend, while values below 20 indicate a weak or no trend. The ADX is often used in conjunction with two directional indicators: +DI (positive directional indicator) and -DI (negative directional indicator), which help identify the trend’s direction. When the ADX is rising, it shows that the trend’s strength is increasing, while a declining ADX indicates a weakening trend. Traders use ADX to confirm whether a trend-following strategy is appropriate or if they should switch to a range-bound approach. - Parabolic SAR (Stop and Reverse)
The Parabolic SAR is a trend-following indicator that highlights potential points where a trend might reverse. It appears on a chart as a series of dots positioned either above or below the price. When the dots are below the price, it signals an uptrend; when they are above the price, it signals a downtrend. As the trend continues, the dots move closer to the price, eventually leading to a “stop and reverse” point when the dots switch sides, suggesting a potential trend reversal. The Parabolic SAR is often used for setting stop-loss levels, as it provides clear guidance on when to exit a trade if the trend changes.
Applying Trends to Market Analysis

Applying trends in market analysis helps traders make informed, strategic decisions by aligning with the market’s direction. Key aspects include:
- Trend-Based Trading Strategies: Traders follow trends to guide buying in uptrends and short-selling or cautious strategies in downtrends.
- Entry and Exit Points: Trends help define optimal points for entering or exiting trades, using tools like trend lines and moving averages.
- Risk Adjustment by Trend Strength: Gauging trend strength with indicators like ADX allows traders to adjust risk levels, taking larger positions in strong trends and smaller ones in weak trends.
- Chart Interpretation: Analyzing real-world charts over different time frames enables traders to spot primary and secondary trends, helping adapt to potential trend reversals or retracements.
Examples
Example 1
A stock has been in an uptrend, consistently making higher highs and higher lows. To identify a trend line, a trader connects the lows, forming a support line. This trend line helps the trader predict potential buying opportunities when the price approaches the line.
Example 2
A trader uses the 50-day and 200-day moving averages on a daily chart. When the 50-day moving average crosses above the 200-day moving average (a “golden cross”), the trader interprets this as a strong bullish signal and considers entering a long position.
Example 3
A downtrend in a stock is identified by connecting several descending highs, forming a resistance trend line. The trader watches for price movements near this line to determine if the downtrend will continue or if a breakout might signal a reversal.
Example 4
Using the MACD indicator, a trader observes that the MACD line has crossed above the Signal line, indicating a potential upward trend. The trader uses this trend-following signal to buy, expecting the trend to continue upward.
Example 5
In a strong trend, a trader applies the Average Directional Index (ADX) to measure trend strength. An ADX value above 25 confirms that the trend is strong, giving the trader confidence to hold their position longer or increase their investment within the trend’s direction.
Practice Questions
Question 1
Which of the following best describes the purpose of a trend line in technical analysis?
A) To identify potential entry and exit points
B) To predict future price reversals only
C) To provide real-time stock alerts
D) To calculate a stock’s intrinsic value
Answer: A) To identify potential entry and exit points
Explanation:
A trend line in technical analysis is used to connect significant price points (like highs or lows) in order to identify the direction of a trend. By observing price movements near this line, traders can determine potential entry and exit points aligned with the trend’s direction. Trend lines do not predict reversals only, provide real-time alerts, or calculate intrinsic value.
Question 2
In an uptrend, which of the following patterns is expected?
A) Lower highs and lower lows
B) Higher highs and higher lows
C) Lower lows only
D) No consistent pattern
Answer: B) Higher highs and higher lows
Explanation:
An uptrend is characterized by a series of higher highs and higher lows, which indicate increasing prices over time. This pattern shows that buying demand is greater than selling pressure. Lower highs and lower lows describe a downtrend, and inconsistent patterns do not represent a trend.
Question 3
Which indicator is commonly used to measure the strength of a trend?
A) Moving Average Convergence Divergence (MACD)
B) Relative Strength Index (RSI)
C) Average Directional Index (ADX)
D) Bollinger Bands
Answer: C) Average Directional Index (ADX)
Explanation:
The ADX is specifically designed to measure the strength of a trend, regardless of direction. A higher ADX value indicates a stronger trend, while a lower value suggests a weak or no trend. MACD, RSI, and Bollinger Bands serve different purposes, primarily identifying momentum or overbought/oversold conditions.


