Preparing for the CMT Exam requires a comprehensive understanding of “Candlestick Analysis,” a key aspect of technical analysis. This concept highlights the importance of studying candlestick patterns to decode market sentiment and forecast price movements. By analyzing the shape, size, and sequence of candlesticks, traders can identify bullish and bearish trends, potential reversals, and continuation signals. Candlestick Analysis enables traders to interpret price action effectively, offering valuable insights into market psychology and momentum. Mastery of this technique equips traders with the ability to refine entry and exit strategies, increasing the accuracy and reliability of trading decisions.
Learning Objectives
In studying Candlestick Analysis for the CMT Exam, you should learn to understand its importance in interpreting price movements and market psychology through candlestick patterns. Effective candlestick analysis involves identifying patterns such as doji, hammers, engulfing patterns, and shooting stars to predict potential price reversals or continuations. This process includes analyzing the relationship between open, high, low, and close prices to uncover market sentiment. Techniques such as combining candlestick patterns with volume analysis, support/resistance levels, and trend indicators enhance the reliability of predictions. Mastery of candlestick analysis is crucial for improving decision-making precision and achieving success in the CMT Exam.
What is Candlestick Analysis?
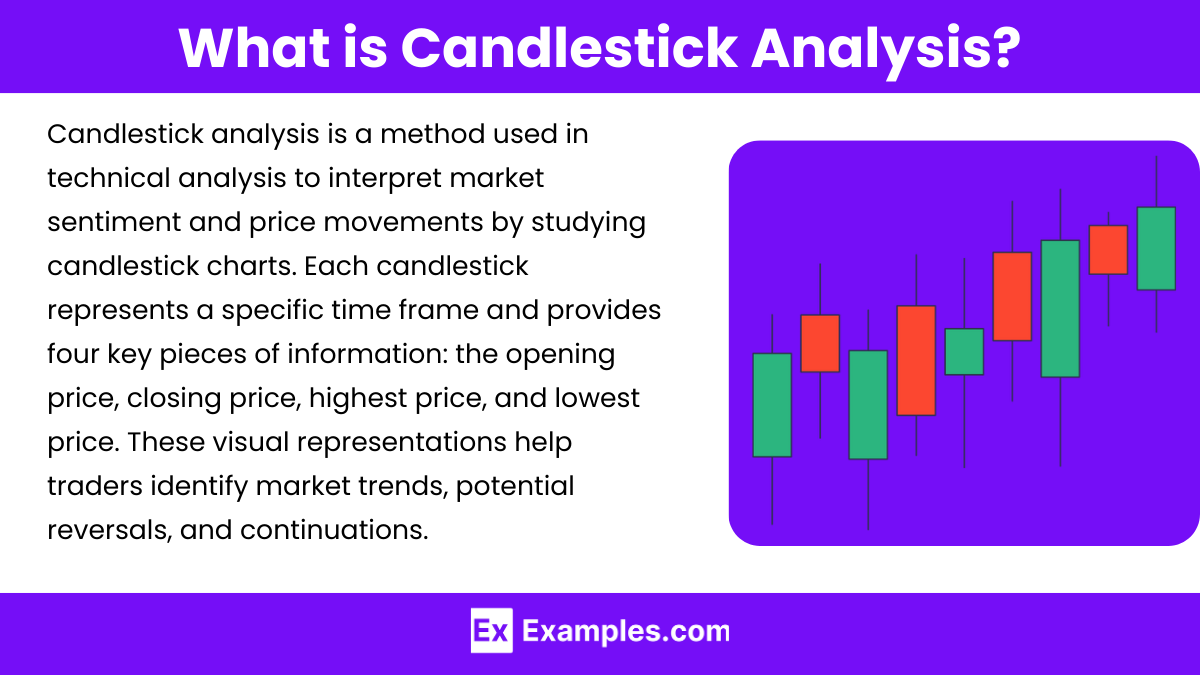
Candlestick analysis is a method used in technical analysis to interpret market sentiment and price movements by studying candlestick charts. Each candlestick represents a specific time frame and provides four key pieces of information: the opening price, closing price, highest price, and lowest price. These visual representations help traders identify market trends, potential reversals, and continuations.
Strategies of Candlestick Analysis
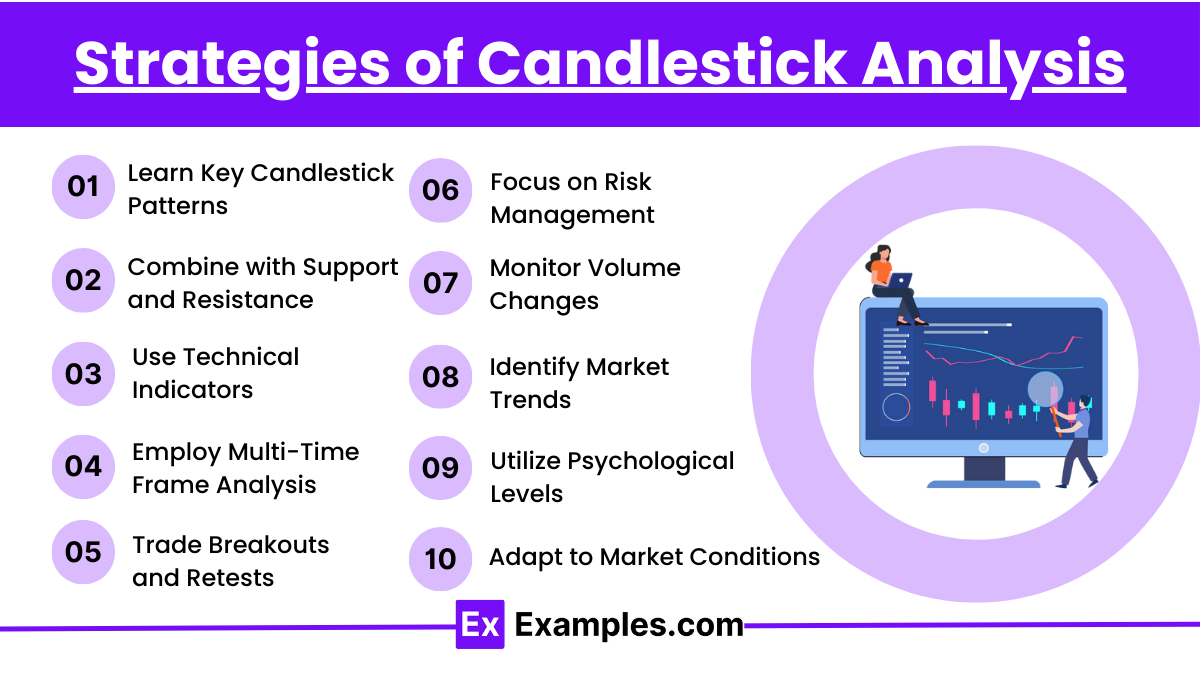
- Learn Key Candlestick Patterns
Focus on recognizing major bullish, bearish, and neutral candlestick patterns to identify market sentiment. - Combine with Support and Resistance
Use candlestick patterns at critical support or resistance levels to confirm potential reversals or continuations. - Use Technical Indicators
Pair candlestick patterns with indicators like RSI, moving averages, or volume to validate signals. - Employ Multi-Time Frame Analysis
Cross-check patterns on higher and lower time frames for stronger confirmation of trends or reversals. - Trade Breakouts and Retests
Look for candlestick confirmation during breakout or retest of significant price levels for entry signals. - Focus on Risk Management
Set stop-losses based on candlestick ranges and adjust position sizing to limit risk. - Monitor Volume Changes
Validate candlestick patterns with volume spikes, indicating stronger market conviction. - Identify Market Trends
Align candlestick patterns with the prevailing trend for higher-probability trades. - Utilize Psychological Levels
Watch for candlestick patterns forming near key psychological price levels like round numbers. - Adapt to Market Conditions
Continuously refine your strategies based on changing market dynamics and historical performance.
Purposes of Candlestick Analysis
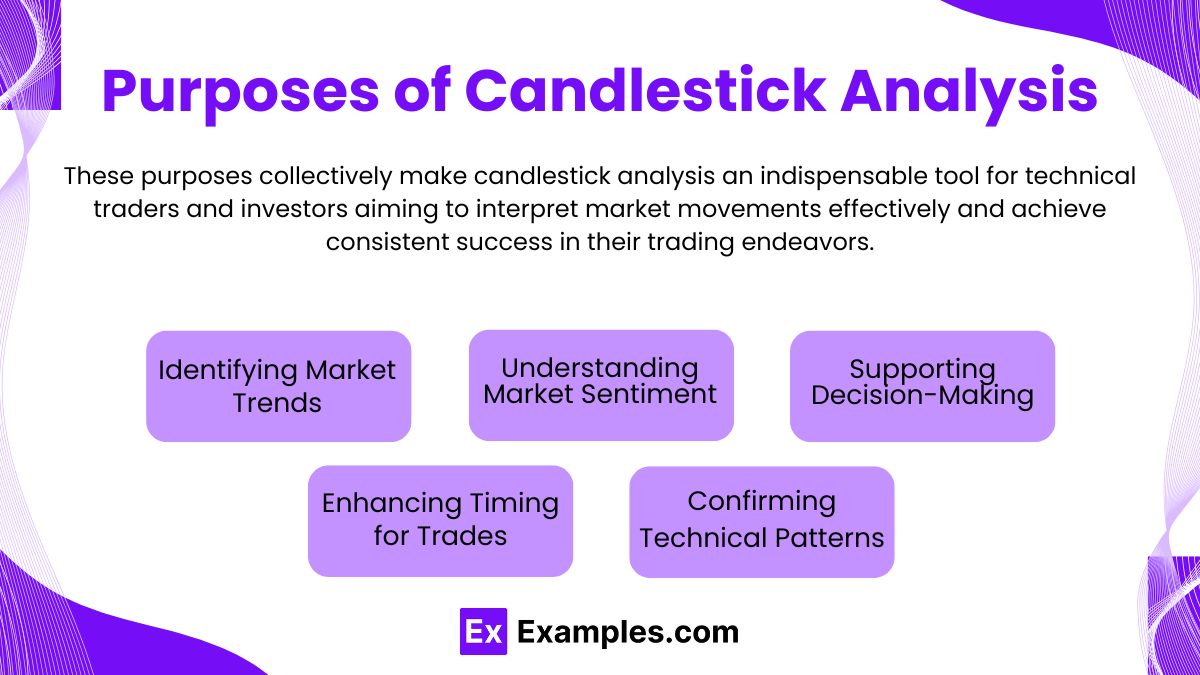
These purposes collectively make candlestick analysis an indispensable tool for technical traders and investors aiming to interpret market movements effectively and achieve consistent success in their trading endeavors.
- Identifying Market Trends
Candlestick analysis plays a crucial role in recognizing bullish or bearish market trends. By studying the patterns formed by candlesticks, traders can determine whether the market is moving upward, downward, or consolidating. This helps in aligning trades with the prevailing trend, which increases the likelihood of successful outcomes. - Understanding Market Sentiment
Candlesticks provide visual representation of market sentiment, showcasing how buyers and sellers interact over a specific time frame. For instance, a long bullish candle may indicate strong buying pressure, while a bearish engulfing pattern may reveal a shift in sentiment toward selling. This insight into market psychology is vital for effective trading strategies. - Supporting Decision-Making
Candlestick patterns offer valuable clues about potential price movements, enabling traders to make more informed decisions. For example, reversal patterns like the hammer or shooting star can signal potential changes in market direction, helping traders decide whether to enter, hold, or exit positions. - Enhancing Timing for Trades
The analysis of candlestick patterns can provide precise timing for trade execution. By identifying patterns that signal market reversals or continuations, traders can pinpoint the best moments to enter or exit a trade, optimizing their risk-to-reward ratio and improving overall trading performance. - Confirming Technical Patterns
Candlestick analysis complements other technical tools and indicators, serving as a confirmation mechanism. For example, if a head-and-shoulders pattern is identified, a bearish candlestick pattern occurring near the neckline can validate the expected downward movement. This multi-layered analysis strengthens the reliability of trading strategies.
Techniques of Candlestick Analysis
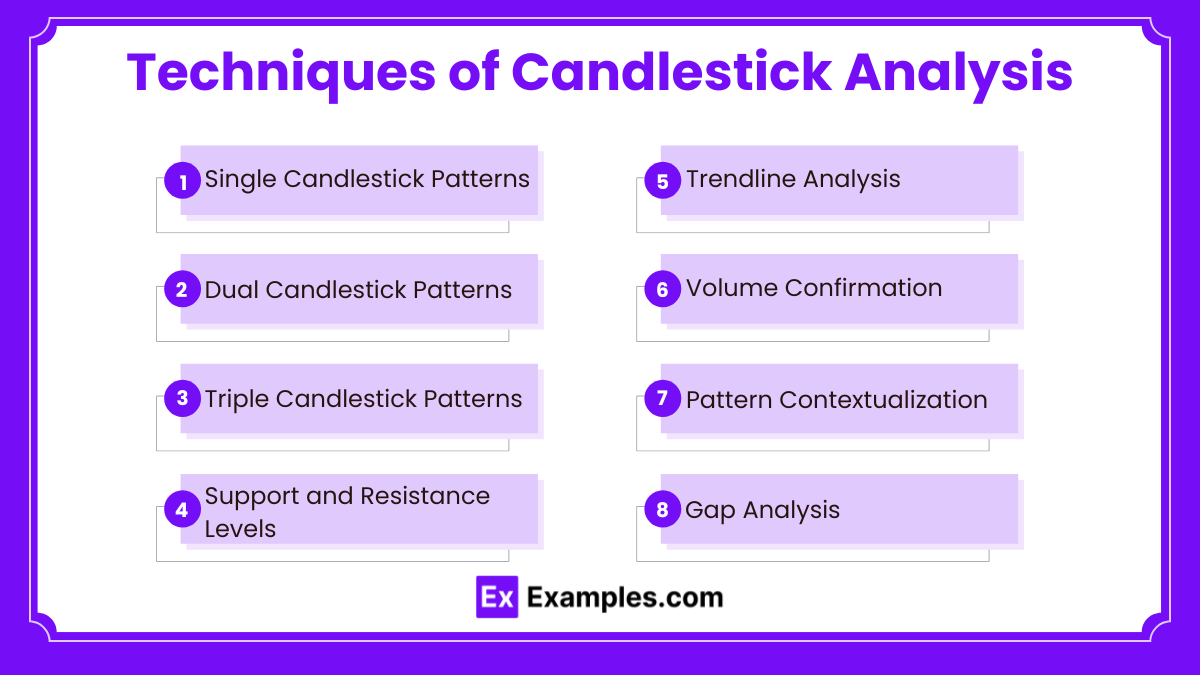
- Single Candlestick Patterns: Analyzing individual candlesticks like Doji, Hammer, or Shooting Star to predict market reversals or continuations.
- Dual Candlestick Patterns: Examining two-candlestick combinations, such as Bullish Engulfing or Bearish Harami, to identify potential trend changes.
- Triple Candlestick Patterns: Using three-candlestick formations like Morning Star, Evening Star, or Three White Soldiers to confirm trend reversals.
- Support and Resistance Levels: Incorporating candlesticks at key price levels to confirm breakout or reversal signals.
- Trendline Analysis: Observing candlestick behavior near trendlines to gauge strength or weakness in ongoing trends.
- Volume Confirmation: Verifying candlestick patterns with volume data to enhance reliability.
- Pattern Contextualization: Analyzing candlestick patterns in the context of broader market trends to avoid false signals.
- Gap Analysis: Evaluating gaps alongside candlestick patterns (e.g., Rising Window or Falling Window) for additional insight.
Examples
Example 1. Identifying Trend Reversals
Candlestick analysis is often used to detect trend reversals in financial markets. For instance, a “Hammer” candlestick pattern at the end of a downtrend suggests that selling pressure is weakening, and buyers are gaining control, indicating a potential upward reversal. Conversely, an “Evening Star” at the top of an uptrend signals a bearish reversal, warning traders of a possible downturn.
Example 2. Confirming Market Sentiment
Traders leverage candlestick patterns to confirm prevailing market sentiment. A “Bullish Engulfing” pattern, where a small bearish candle is followed by a larger bullish candle, reflects strong buying momentum. This pattern reinforces a bullish outlook, particularly when it occurs near support levels, giving traders confidence to initiate long positions.
Example 3. Setting Entry and Exit Points
Candlestick analysis aids in determining precise entry and exit points for trades. For example, when a “Doji” candlestick appears during a strong trend, it signals market indecision and potential trend exhaustion. Traders can use this signal to exit their current positions or prepare for a potential reversal.
Example 4. Analyzing Support and Resistance Levels
Patterns like “Piercing Line” and “Dark Cloud Cover” are used to validate support and resistance levels. If a “Piercing Line” forms near a support zone, it confirms that buyers are defending the level, suggesting a potential price increase. On the other hand, a “Dark Cloud Cover” near resistance indicates sellers are overpowering buyers, likely leading to a price drop.
Example 5. Short-Term Trading Strategies
Day traders and scalpers often rely on candlestick analysis for quick decision-making. For example, a “Shooting Star” appearing in a shorter time frame (e.g., 5-minute chart) can indicate a rapid rejection of higher prices, providing a signal for traders to go short. This pattern is especially effective when combined with other technical indicators like moving averages or volume analysis.
Practice Questions
Question 1
What does a long upper shadow on a candlestick typically indicate in candlestick analysis?
a) Strong buying pressure during the period
b) Strong selling pressure during the period
c) A period of low volatility
d) Indecision between buyers and sellers
Correct Answer: b) Strong selling pressure during the period
Explanation:
A long upper shadow on a candlestick indicates that the price rose significantly during the session but fell back before the close, showing that sellers regained control after an initial buying effort. This often signals resistance or bearish sentiment as buyers were unable to sustain the higher price level.
Question 2
Which candlestick pattern is considered a strong bullish reversal signal?
a) Shooting Star
b) Hammer
c) Doji
d) Bearish Engulfing
Correct Answer: b) Hammer
Explanation:
The Hammer is a single candlestick pattern characterized by a small real body near the top of the trading range and a long lower shadow. It typically forms after a downtrend, signaling a potential reversal as buyers regain strength, pushing prices higher from the session’s low. Confirmation of the reversal occurs when the next candle closes above the Hammer’s high.
Question 3
In candlestick analysis, what does the “Doji” candlestick represent?
a) A continuation of the current trend
b) A strong reversal signal
c) Market indecision or equilibrium
d) A sign of high volatility
Correct Answer: c) Market indecision or equilibrium
Explanation:
The Doji candlestick is formed when the open and close prices are nearly the same, creating a small or non-existent real body. This pattern signifies a balance between buyers and sellers and often appears during periods of market indecision. While it does not directly indicate a reversal, its significance depends on its position in the trend—after a strong trend, it can suggest exhaustion and a potential change in direction.

