Preparing for the CMT Exam requires a solid grasp of charting techniques, including understanding data intervals, which is fundamental for technical analysis. Mastery of data intervals helps interpret time frames, price movements, and trends accurately. This knowledge enhances insights into market behavior, supporting precise decision-making, essential for achieving a high CMT score.
Learning Objective
In studying “Charts – Understanding Data Intervals” for the CMT Exam, you should aim to understand the importance of selecting appropriate data intervals in technical analysis. Learn how different intervals, such as daily, weekly, and monthly, affect the interpretation of trends, patterns, and price movements. Analyze how varying data intervals impact the visibility of short-term fluctuations versus long-term trends. Evaluate the applications of these intervals in various trading strategies and the insights they provide for different market conditions. Additionally, explore how interval selection influences chart patterns, volume analysis, and technical indicators to enhance data-driven decision-making in financial markets.
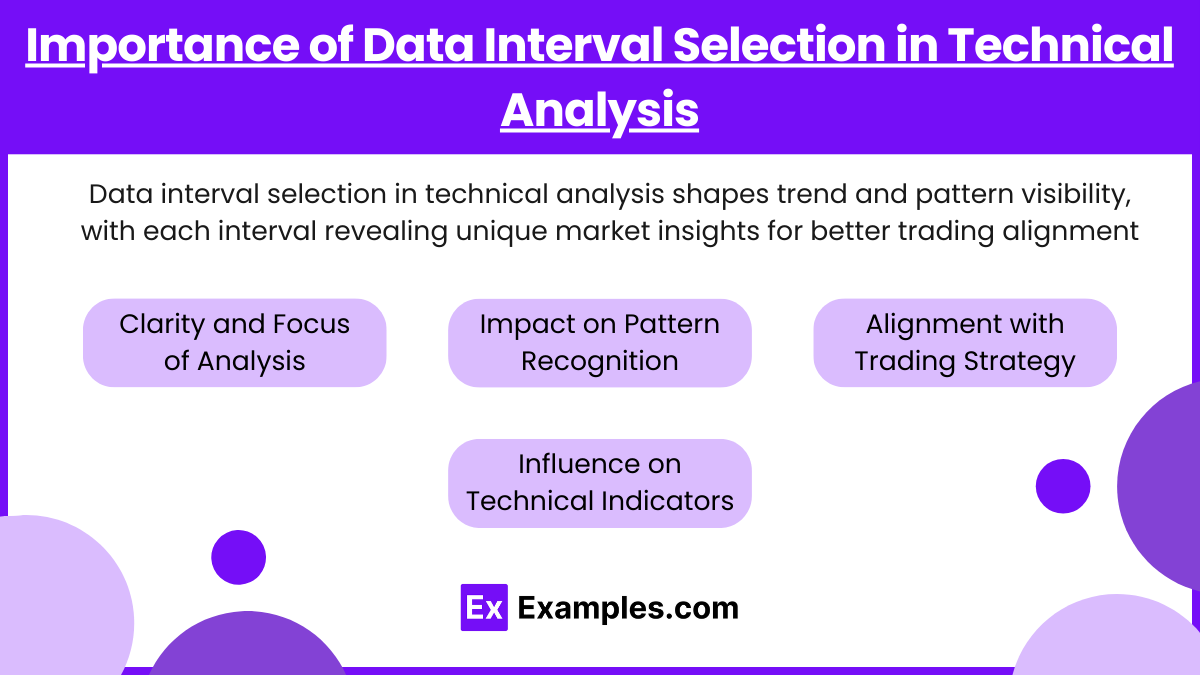
Importance of Data Interval Selection in Technical Analysis

Data interval selection is foundational in technical analysis because it directly impacts how price trends, patterns, and movements are visualized and interpreted on charts. A data interval is the timeframe at which price data points are recorded and displayed, such as one-minute, hourly, daily, weekly, or monthly intervals. Each interval type serves a unique purpose, providing insights into specific aspects of market behavior, so selecting the correct interval is crucial for aligning chart analysis with trading objectives.
- Clarity and Focus of Analysis: Shorter intervals (e.g., minute or hourly) show high levels of price detail, highlighting short-term price movements and intra-day volatility, which is especially useful for day traders. In contrast, longer intervals (e.g., daily, weekly, or monthly) smooth out daily fluctuations, offering a clearer picture of overall market direction and long-term trends, which are valuable to swing and position traders. Choosing the right interval prevents “noise” from obscuring the intended analysis, ensuring clarity.
- Impact on Pattern Recognition: Chart patterns, such as head and shoulders, support and resistance levels, and moving averages, often look different depending on the chosen interval. Patterns that appear in a one-minute interval might signal a short-lived trend, while patterns in a daily interval might indicate a longer-lasting market trend. Therefore, the interval choice can change the interpretation of these patterns and the associated trading decisions.
- Alignment with Trading Strategy: The selection of data intervals should match the trader’s or analyst’s strategy. For instance:
- Scalpers and Day Traders benefit from minute-to-minute data to capture rapid price changes.
- Swing Traders often analyze data in daily or hourly intervals to track multi-day or weekly price swings.
- Long-Term Investors use weekly or monthly data intervals, focusing on sustained trends and long-term projections.
- Influence on Technical Indicators: Technical indicators, such as moving averages, RSI (Relative Strength Index), and MACD (Moving Average Convergence Divergence), are sensitive to the interval they are applied to. For example, a 50-day moving average on a daily chart gives insight into medium-term trends, while the same 50-period moving average on an hourly chart provides a shorter-term trend analysis. Properly choosing the data interval enhances the reliability of indicators and prevents misleading signals
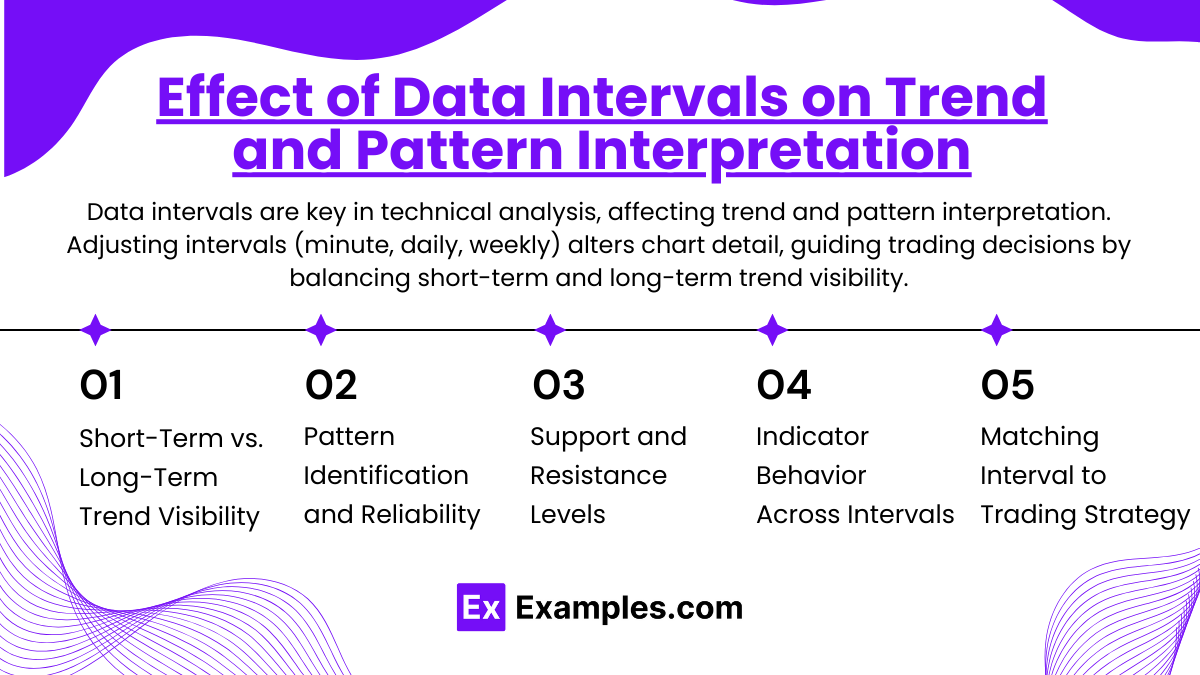
Effect of Data Intervals on Trend and Pattern Interpretation

Data intervals play a pivotal role in shaping the interpretation of trends and chart patterns in technical analysis. By adjusting the interval length—such as minute, hourly, daily, or weekly—analysts can change the level of detail presented on the chart, influencing how price trends and patterns are perceived. This selection impacts the visibility of both short-term fluctuations and long-term trends, ultimately guiding trading decisions.
- Short-Term vs. Long-Term Trend Visibility:
Shorter data intervals, like one-minute or five-minute charts, capture rapid price movements, revealing short-term volatility and brief price trends that day traders or scalpers rely on for quick trades. These intervals display high granularity but can also introduce “noise,” meaning minor price fluctuations that don’t affect the broader market trend. Conversely, longer intervals, such as daily or weekly, smooth out this noise, presenting a more stable and less reactive view of price trends. This perspective is essential for swing traders and long-term investors, as it highlights sustained directional trends over days, weeks, or months. - Pattern Identification and Reliability:
Chart patterns, such as head and shoulders, flags, and double tops, look different depending on the interval selected. Short intervals might reveal fleeting patterns that represent brief market sentiment changes, often too transient for long-term decisions. In contrast, patterns on longer intervals are generally considered more reliable, as they represent sustained market sentiment. For instance, a head and shoulders pattern observed over a weekly interval could signal a major trend reversal, while the same pattern on a one-minute chart might only indicate a minor, temporary shift. - Support and Resistance Levels:
Data intervals impact the identification and strength of support and resistance levels. In shorter intervals, support and resistance lines may appear frequently, but these levels are more likely to break due to transient price movements. On longer intervals, however, these levels become more significant, reflecting broader market consensus and making them stronger psychological barriers. Consequently, an analyst looking for stable entry and exit points might prefer longer intervals to ensure these levels are robust and less prone to sudden breaches. - Indicator Behavior Across Intervals:
Technical indicators, such as moving averages, MACD (Moving Average Convergence Divergence), and RSI (Relative Strength Index), also behave differently across intervals. For example, a 50-period moving average on a one-minute chart is highly sensitive, aligning closely with recent price movements and indicating very short-term momentum. The same moving average on a daily chart, however, smooths out short-term fluctuations, aligning more closely with the longer-term trend. This behavior means that indicators must be interpreted within the context of their interval to provide meaningful insights into market conditions. - Matching Interval to Trading Strategy:
Traders choose intervals based on their specific trading strategies:- Scalpers and Day Traders often use shorter intervals to capture quick price changes.
- Swing Traders benefit from daily or hourly intervals, balancing between capturing short-term trends and filtering out noise.
- Long-Term Investors rely on weekly or monthly intervals to confirm significant trends and avoid reacting to minor, short-term price fluctuations.
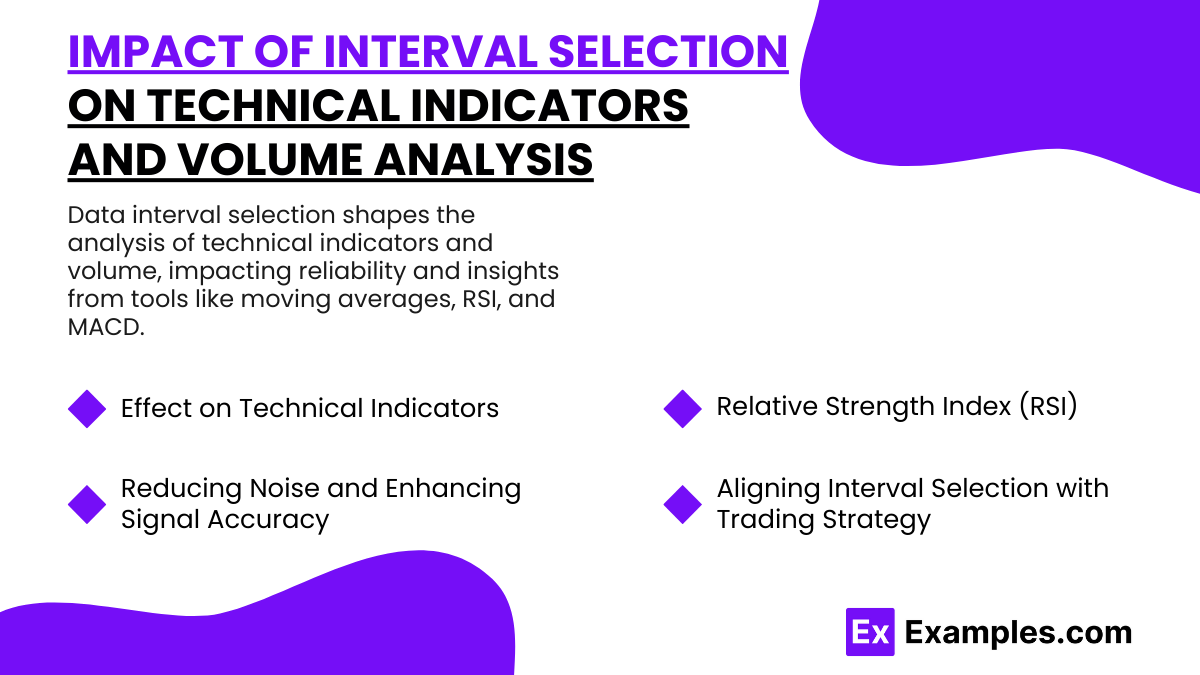
Impact of Interval Selection on Technical Indicators and Volume Analysis

The selection of data intervals significantly influences how technical indicators and volume are analyzed, affecting the insights they provide. Each interval brings a unique perspective, impacting the reliability and interpretation of indicators like moving averages, RSI, MACD, and volume trends, making interval selection crucial for effective analysis and decision-making in trading.
- Effect on Technical Indicators
Technical indicators are highly sensitive to the data interval applied to them. For instance:- Moving Averages: A 50-period moving average on a five-minute chart captures short-term price trends, providing insight into immediate momentum and volatility. However, the same 50-period moving average on a daily chart smooths out short-term fluctuations and highlights broader market trends over a longer period. Choosing the correct interval allows traders to focus on trends that match their trading strategy.
- Relative Strength Index (RSI): RSI on shorter intervals like five or fifteen minutes can generate more frequent signals, often overreacting to minor price changes. On longer intervals, such as daily or weekly, RSI readings are more stable, indicating more significant overbought or oversold conditions that align with larger market movements.
- MACD (Moving Average Convergence Divergence): MACD signals vary based on the interval; short intervals provide faster but potentially noisier signals, while longer intervals show smoother trends, reflecting sustained changes in market momentum.
- Impact on Volume Analysis
Volume analysis is another area where interval selection plays a critical role. Volume levels represent the number of shares or contracts traded over a specific period and can indicate the strength of price movements. However, the relevance of volume data depends on the interval:- Short Intervals: On shorter intervals, volume spikes may show intraday interest, capturing rapid inflows and outflows of capital, useful for day traders. However, these spikes can sometimes be misleading as they may reflect temporary factors rather than significant market sentiment.
- Long Intervals: On longer intervals, volume data provides a clearer picture of overall market participation and interest in a trend. Sustained high volume on a daily or weekly interval often indicates strong support for a trend, whether it is up or down, and is a more reliable confirmation signal for longer-term investors and swing traders.
- Reducing Noise and Enhancing Signal Accuracy
In short intervals, indicators and volume trends tend to be more volatile and can generate false signals or “noise,” especially in fast-moving markets. Shorter intervals can lead to frequent, less reliable indicator crossovers and volume spikes that are not necessarily indicative of major trends. Conversely, longer intervals reduce this noise, providing smoother indicator readings and more stable volume patterns. This helps analysts focus on significant movements, improving signal accuracy and making it easier to identify genuine trends and reversals. - Aligning Interval Selection with Trading Strategy
Choosing the right interval is key to ensuring indicators and volume trends align with the trader’s strategy:- Scalpers and Day Traders: Short intervals (e.g., one-minute, five-minute) help capture quick price and volume changes, identifying rapid shifts in sentiment.
- Swing Traders: Hourly or daily intervals provide a balance between responsiveness and reliability, helping detect trends that last several days to weeks.
- Long-Term Investors: Weekly and monthly intervals reveal enduring trends and major volume shifts, filtering out short-term noise.
Examples
Example 1
A trader analyzing a one-minute interval chart can see high-frequency price changes, making it ideal for capturing rapid price fluctuations and day trading opportunities. However, this interval introduces more “noise,” or minor fluctuations, which can obscure broader trends.
Example 2
On a daily interval chart, patterns like double tops and head-and-shoulders formations appear more reliably, as they represent sustained shifts in market sentiment. This interval is commonly used by swing traders to filter out minor movements and focus on trends that may last days to weeks.
Example 3
A weekly interval chart shows long-term trends and reduces the influence of daily price volatility, making it suitable for long-term investors. This interval highlights major support and resistance levels, which are more reliable for strategic entry and exit points.
Example 4
Volume analysis on a fifteen-minute interval chart helps identify intraday volume spikes, which can indicate a sudden increase in trading interest, useful for day traders. Conversely, volume spikes on a daily interval are more indicative of broader market sentiment.
Example 5
Technical indicators like the MACD provide different insights across intervals. On a five-minute chart, the MACD shows short-term momentum changes, suitable for quick trades, while on a daily interval, the same indicator smooths out short-term fluctuations, showing more stable trends.
Practice Questions
Question 1
Which of the following data intervals is best suited for a day trader looking to capture intraday price fluctuations?
A) Weekly
B) Daily
C) One-minute
D) Monthly
Answer: C) One-minute
Explanation:
Day traders typically use very short intervals, like one-minute charts, to capture rapid price changes within the trading day. This interval provides high granularity and reveals short-term price movements ideal for quick trades. Longer intervals, such as daily or weekly, are better suited for swing or long-term trading strategies.
Question 2
A trader who wants to analyze long-term market trends and avoid short-term fluctuations should use which of the following data intervals?
A) One-minute
B) Five-minute
C) Weekly
D) Ten-minute
Answer: C) Weekly
Explanation:
The weekly interval reduces noise from daily price fluctuations, providing a clearer view of long-term market trends. This interval is typically preferred by long-term investors who aim to avoid short-term volatility and focus on enduring trends, making it suitable for more strategic, long-term trading decisions.
Question 3
Which interval would most likely introduce significant noise, potentially obscuring overall market trends?
A) Monthly
B) Daily
C) One-minute
D) Weekly
Answer: C) One-minute
Explanation:
The one-minute interval is highly granular and captures minute-to-minute price changes, which often include a lot of “noise” or minor fluctuations. While it provides detail useful for day trading, this short interval can make it challenging to see broader market trends. Longer intervals like daily or weekly smooth out these fluctuations, providing a clearer view of the market direction.


