Mastering Multi-Candle Patterns is essential for the CMT Exam, as these patterns reveal crucial insights into market sentiment and trend reversals. Understanding formations like engulfing patterns, doji stars, and morning/evening stars enables analysts to make informed trading decisions. Proficiency in this area is vital for technical analysis expertise and exam success.
Learning Objective
In studying “Multi-Candle Patterns” for the CMT Exam, you should learn to identify and interpret various multi-candle formations, such as engulfing patterns, harami, morning/evening stars, and three white soldiers/black crows. Understand the significance of these patterns in signaling potential trend reversals or continuations within market sentiment. Evaluate how multi-candle formations provide insights into market psychology and trader behavior. Explore the principles behind these patterns and their effectiveness in different market contexts. Apply your knowledge to analyze charts effectively, making informed predictions about price movements to succeed in both exam scenarios and real-world technical analysis.
Overview of Multi-Candle Patterns

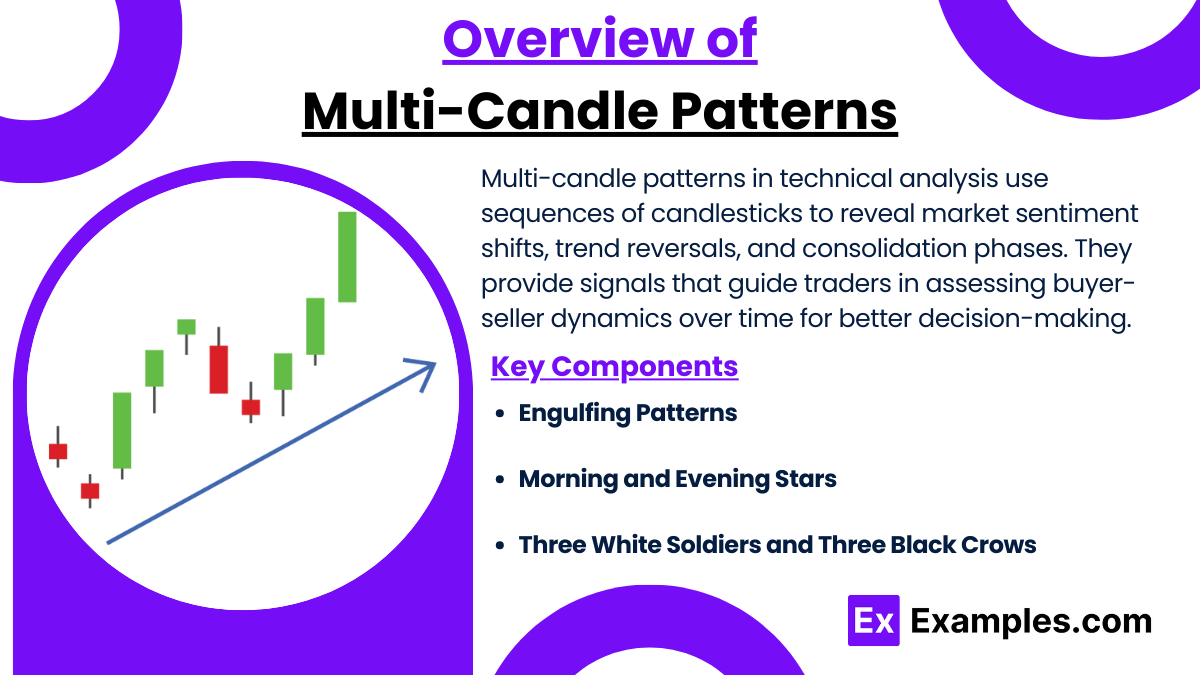
Multi-candle patterns are essential tools in technical analysis, comprising sequences of two or more candlesticks that provide insights into potential market movements. Unlike single-candle patterns, multi-candle formations offer a broader perspective, revealing shifts in trader sentiment, possible trend reversals, and periods of consolidation. These patterns serve as signals that help traders make informed decisions by assessing the relationship between buyers and sellers over multiple trading periods.
Importance in Market Analysis
Multi-candle patterns are highly valuable because they illustrate market psychology in real-time. By examining the relationship between consecutive candles, analysts can understand whether buyers or sellers dominate the market, identify potential entry and exit points, and predict price movements. For example, patterns like bullish or bearish engulfing and morning or evening stars often signal that a trend may reverse, providing early warnings for traders to adjust their strategies.
Key Components of Multi-Candle Patterns
Each multi-candle pattern consists of specific characteristics, such as the relative size and positioning of candlesticks. For example:
- Engulfing Patterns involve one candlestick that “engulfs” the previous candle, indicating a strong shift in momentum.
- Morning and Evening Stars comprise three candles and are typically found at the end of trends, often signaling a trend reversal.
- Three White Soldiers and Three Black Crows are composed of three consecutive candlesticks in the same direction, suggesting strong bullish or bearish momentum.
Understanding these components enables traders to recognize these patterns quickly and apply them to anticipate price trends.
Key Multi-Candle Patterns

Multi-candle patterns are powerful tools in technical analysis, allowing traders to interpret and predict market trends based on groups of consecutive candlesticks. Here are some of the most important multi-candle patterns and their significance in forecasting market movements.
1. Engulfing Patterns
- Bullish Engulfing: This pattern appears at the end of a downtrend and consists of a small bearish candle followed by a large bullish candle that “engulfs” it, covering its entire body. The bullish engulfing pattern signals a potential reversal to the upside, as buying pressure overwhelms selling pressure.
- Bearish Engulfing: Seen at the end of an uptrend, this pattern involves a small bullish candle followed by a larger bearish candle that completely engulfs it. This pattern suggests that sellers are taking control, and the price may reverse downward.
- Interpretation: Engulfing patterns are strong indicators of reversals because they highlight a dramatic change in sentiment, signaling that a prior trend may be losing momentum.
2. Morning and Evening Stars
- Morning Star: This bullish reversal pattern forms at the bottom of a downtrend. It consists of three candles: a large bearish candle, a small-bodied candle (which can be bullish or bearish), and a large bullish candle. The morning star signals that selling pressure is easing and buyers may soon dominate.
- Evening Star: This bearish reversal pattern appears at the end of an uptrend and also consists of three candles: a large bullish candle, a small-bodied candle, and a large bearish candle. The evening star suggests that buying pressure is weakening, and a downward reversal may follow.
- Interpretation: Morning and evening stars are effective in identifying reversal points in trends, especially when they appear in conjunction with high trading volumes, making them essential for signaling entry or exit points in trades.
3. Three White Soldiers and Three Black Crows
- Three White Soldiers: This bullish pattern consists of three consecutive long bullish candles that open within the previous candle’s body and close higher. This formation typically follows a downtrend and indicates strong bullish momentum, suggesting that an uptrend may continue.
- Three Black Crows: This bearish pattern appears at the end of an uptrend and is made up of three long bearish candles with each candle opening within the previous one’s body and closing lower. It signals strong bearish momentum and the likelihood that a downtrend will continue.
- Interpretation: Three white soldiers and three black crows represent sustained market strength (or weakness) over multiple periods, providing strong signals of a trend continuation.
Application of Multi-Candle Patterns in Technical Analysis

Multi-candle patterns play a critical role in technical analysis, providing traders with insights into market sentiment, potential trend reversals, and continuations. Here’s a closer look at how these patterns are applied in technical analysis for effective trading decisions.
1. Identifying Trend Reversals and Continuations
- Trend Reversals: Multi-candle patterns are often used to identify potential reversal points in trends, helping traders predict when a bullish or bearish trend is likely to change direction. For example, a bullish engulfing pattern at the end of a downtrend suggests a shift in sentiment from sellers to buyers, indicating a possible upward reversal. Conversely, patterns like the evening star at the end of an uptrend signal that buyers may be losing control, hinting at an impending downtrend.
- Trend Continuations: Some patterns, such as the three white soldiers (indicating a bullish continuation) and three black crows (indicating a bearish continuation), reinforce an existing trend by showing sustained strength or weakness. Recognizing these continuation patterns allows traders to hold their positions longer, maximizing gains within a trend.
2. Enhancing Entry and Exit Strategies
- Entry Points: Multi-candle patterns provide precise entry signals when combined with other technical indicators or support and resistance levels. For instance, if a morning star appears near a support level, it indicates a solid buying opportunity, as the pattern reinforces the support level’s strength. Traders can use this information to enter long positions with higher confidence.
- Exit Points: Multi-candle patterns are also valuable for identifying exit points. For example, if a trader is in a long position and sees a bearish engulfing pattern near a resistance level, this pattern signals a potential trend reversal. Exiting the trade at this point allows the trader to lock in profits before the market reverses direction.
3. Confirming Signals with Other Indicators
- Combining with Moving Averages: Moving averages are often used in conjunction with multi-candle patterns to confirm signals. For example, a bullish engulfing pattern appearing above the 50-day moving average suggests a stronger upward momentum, adding confidence to a potential buy signal.
- Relative Strength Index (RSI): The RSI can also be paired with multi-candle patterns to validate overbought or oversold conditions. For instance, a bullish engulfing pattern forming when the RSI is below 30 (indicating oversold conditions) provides a stronger buy signal, as both the pattern and the indicator align to suggest a reversal.
4. Practical Use in Real-World Trading
- Multi-candle patterns are frequently used by traders to refine their trading strategies in live markets. By combining these patterns with other technical analysis tools, traders can build more comprehensive strategies that increase accuracy and manage risk better. For example, three black crows appearing during a downtrend can be a signal to add to a short position, while a morning star at a significant support level may encourage a trader to enter a long position with confidence.
- Backtesting and Strategy Development: Multi-candle patterns are also tested and optimized in backtesting strategies. Traders use historical data to assess how these patterns performed in various market conditions, helping them develop strategies that are robust and reliable. By backtesting with multi-candle patterns, traders gain insights into their effectiveness across different time frames and asset classes, refining strategies before applying them to real trades.
Examples
Example 1: Bullish Engulfing Pattern
A bullish engulfing pattern occurs at the end of a downtrend and consists of a small bearish candle followed by a larger bullish candle that completely engulfs the previous one. This pattern indicates a potential reversal to the upside, as the shift from selling to buying pressure suggests buyers are gaining control.
Example 2: Bearish Engulfing Pattern
The bearish engulfing pattern appears at the end of an uptrend, with a small bullish candle followed by a larger bearish candle that engulfs it. This pattern signals a potential trend reversal to the downside, as it shows sellers overpowering buyers, suggesting that the upward momentum is weakening.
Example 3: Morning Star Pattern
A morning star pattern is a three-candle formation that typically appears at the bottom of a downtrend. It consists of a large bearish candle, a small-bodied candle (indicating indecision), and a large bullish candle. This pattern signals a reversal to the upside, as the presence of a bullish candle after indecision shows that buyers are starting to take control.
Example 4: Evening Star Pattern
The evening star pattern is a bearish reversal pattern that appears at the top of an uptrend. It consists of a large bullish candle, a small-bodied candle, and a large bearish candle. This pattern suggests that buying momentum is waning, and sellers are gaining control, indicating a potential trend reversal to the downside.
Example 5: Three White Soldiers
The three white soldiers pattern is a bullish continuation pattern that occurs after a downtrend or consolidation phase. It consists of three consecutive long bullish candles that open within the previous candle’s body and close higher. This pattern indicates strong upward momentum, suggesting that buyers are in control and the uptrend is likely to continue.
Practice Questions
Question 1
Which of the following patterns is typically a bullish reversal signal occurring at the bottom of a downtrend?
A) Bearish Engulfing
B) Three Black Crows
C) Morning Star
D) Evening Star
Answer: C) Morning Star
Explanation: The Morning Star pattern is a three-candle formation that appears at the end of a downtrend and signals a potential reversal to the upside. It consists of a large bearish candle, a small-bodied candle, and a large bullish candle. The pattern suggests that buyers are starting to take control after a period of indecision, which may lead to an upward trend. The other options are either bearish patterns or not specifically indicative of a bullish reversal at the end of a downtrend.
Question 2
In the Three White Soldiers pattern, what do the three consecutive bullish candles indicate?
A) Reversal from a downtrend
B) Continuation of a downtrend
C) Possible consolidation
D) Start of a bearish trend
Answer: A) Reversal from a downtrend
Explanation: The Three White Soldiers pattern consists of three consecutive bullish candles that open within the body of the previous candle and close higher. This pattern generally appears after a downtrend or period of consolidation and indicates strong bullish momentum. It suggests that buyers are in control and that an uptrend may follow. The other options do not accurately describe the typical interpretation of the Three White Soldiers pattern.
Question 3
Which of the following is NOT a characteristic of a Bullish Engulfing Pattern?
A) Appears at the end of an uptrend
B) Consists of two candles
C) Signals a potential reversal to the upside
D) Second candle fully engulfs the body of the first candle
Answer: A) Appears at the end of an uptrend
Explanation: The Bullish Engulfing pattern typically appears at the end of a downtrend and consists of a small bearish candle followed by a larger bullish candle that fully engulfs the previous candle’s body. This formation indicates a potential reversal to the upside. The other options accurately describe characteristics of the Bullish Engulfing pattern.


