Preparing for the CMT Exam involves a thorough understanding of “Momentum and Oscillators,” vital tools in technical analysis. Mastery of momentum indicators and oscillator functions aids in identifying market trends, overbought and oversold conditions, and potential reversals. This knowledge is essential for accurate market timing and strategic trading decisions, crucial for exam success.
Learning Objective
In studying “Momentum and Oscillators” for the CMT Exam, you should learn to understand key momentum indicators, such as the Relative Strength Index (RSI), Moving Average Convergence Divergence (MACD), and Stochastic Oscillator. Analyze how these tools measure market momentum, assess trend strength, and signal potential trend reversals. Evaluate the principles behind these oscillators, including their use in identifying overbought and oversold conditions. Additionally, explore how momentum-based strategies can be applied across different timeframes and market environments, enhancing your ability to make informed trading decisions. Apply this knowledge in CMT practice scenarios to interpret technical analysis results effectively.
Key Momentum Indicators

Momentum indicators are essential tools in technical analysis, used to measure the rate of change or speed of price movements within a particular time frame. They help identify when an asset’s price is accelerating or decelerating, indicating the strength or weakness of a trend. Here are three primary momentum indicators commonly used in technical analysis:
1. Relative Strength Index (RSI)
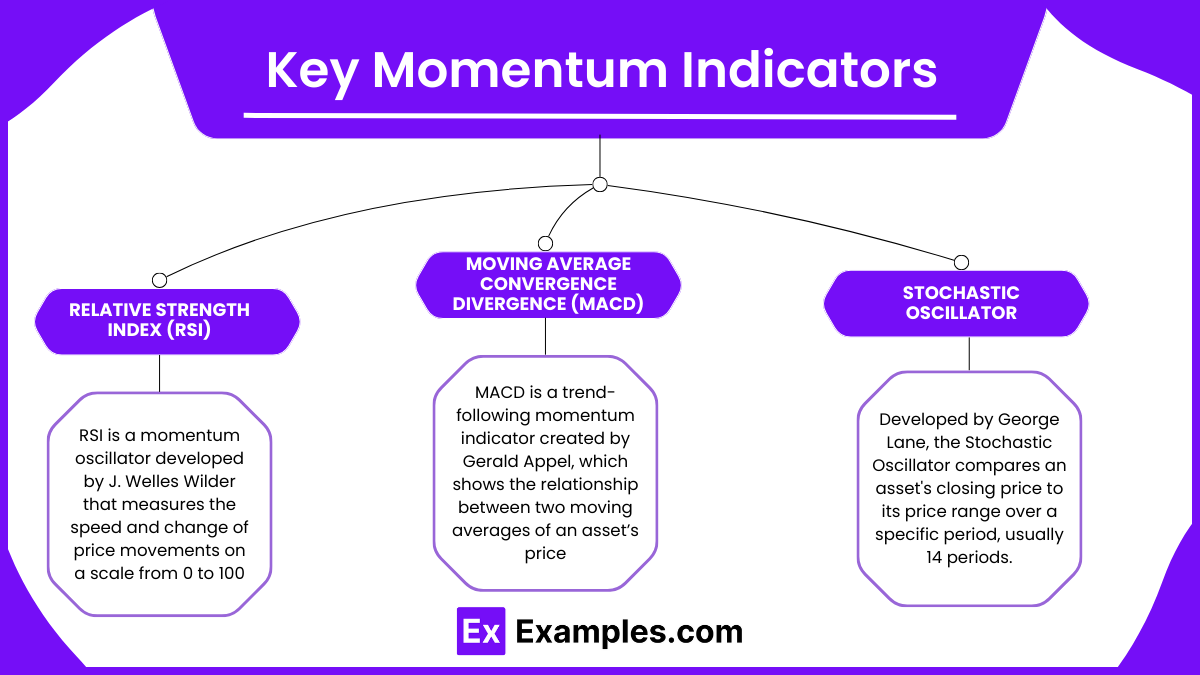
- Description: RSI is a momentum oscillator developed by J. Welles Wilder that measures the speed and change of price movements on a scale from 0 to 100.
- Calculation: RSI is calculated using the average gains and losses over a specified period, often set to 14 days by default. The formula is:

- Interpretation: RSI values above 70 typically indicate an overbought condition, suggesting that the asset may be due for a correction. Conversely, RSI values below 30 indicate an oversold condition, signaling a potential reversal or buying opportunity.
- Uses: Traders use RSI to spot possible reversal points and assess trend strength. Divergences between RSI and price movement, such as a rising RSI in a downtrending market, can signal a potential trend reversal.
2. Moving Average Convergence Divergence (MACD)
- Description: MACD is a trend-following momentum indicator created by Gerald Appel, which shows the relationship between two moving averages of an asset’s price.
- Calculation: MACD is calculated by subtracting the 26-period exponential moving average (EMA) from the 12-period EMA. The result is the MACD line. The nine-period EMA of the MACD line is called the signal line, which is plotted on top of the MACD line and is used to identify buy and sell signals.
- Interpretation: When the MACD line crosses above the signal line, it indicates a potential buy signal. A cross below the signal line suggests a potential sell signal. The distance between the MACD line and the signal line (known as the histogram) also gives an idea of the momentum’s strength.
- Uses: Traders use MACD to identify changes in the direction, strength, and momentum of a trend. MACD is especially useful in trend-following and reversal strategies.
3. Stochastic Oscillator
- Description: Developed by George Lane, the Stochastic Oscillator compares an asset’s closing price to its price range over a specific period, usually 14 periods. It operates on a scale from 0 to 100 and consists of two lines: %K and %D.
- Calculation: The formula for %K (the main line) is:

The %D line is the 3-day simple moving average of %K. - Interpretation: Readings above 80 indicate that an asset is overbought, while readings below 20 suggest that it is oversold. The crossing of %K above %D can signal a buying opportunity, and %K crossing below %D can indicate a selling opportunity.
- Uses: The Stochastic Oscillator is widely used to identify potential trend reversals and overbought/oversold conditions, especially in range-bound markets. Traders often use it in combination with other indicators for confirmation
Assessing Trend Strength and Direction

Assessing the strength and direction of a trend is essential for making informed trading decisions. Momentum indicators, like the Relative Strength Index (RSI), Moving Average Convergence Divergence (MACD), and Stochastic Oscillator, are key tools in evaluating how strong a trend is and whether it is likely to continue or reverse. Properly understanding trend strength and direction can help traders stay in profitable positions or avoid entering trades that are likely to fail.
1. Momentum in Uptrends and Downtrends
- Uptrend Momentum: In an uptrend, momentum indicators are used to gauge how strong the buying pressure is. A strong uptrend is typically characterized by rising prices, and momentum indicators like RSI or MACD can confirm the strength of this price movement.
- RSI in Uptrend: If the RSI remains above 50 and occasionally approaches 70, it suggests that the trend is strong, and there is a consistent buying force driving the price higher. When RSI stays in the upper half of the scale (above 50), it indicates that the bulls are in control.
- MACD in Uptrend: The MACD line above the signal line, especially when the distance between the lines is widening, indicates a strong uptrend. A rising histogram also suggests increasing bullish momentum.
- Downtrend Momentum: Similarly, in a downtrend, momentum indicators measure how strong the selling pressure is. In a strong downtrend, prices are continuously falling, and indicators like RSI and MACD help confirm the weakness of the market.
- RSI in Downtrend: An RSI consistently below 50, and especially below 30, suggests that the market is under significant selling pressure and that the bears are in control. It indicates an ongoing decline, with potential for further downward movement.
- MACD in Downtrend: When the MACD line is consistently below the signal line, and the histogram shows increasing negative values, it signals a strong downtrend. This suggests that selling momentum is dominating the market.
2. Trend Confirmation and Divergence
- Trend Confirmation: Momentum indicators can confirm the direction of the trend. When momentum indicators align with price movements, the trend’s strength is confirmed. For example:
- If a stock is in an uptrend and the RSI is above 50, confirming a strong trend, traders can feel confident that the trend is intact and likely to continue.
- In a downtrend, if MACD remains below its signal line and RSI is below 50, these confirmations suggest a stronger likelihood of the downtrend continuing.
- Divergence: Divergence occurs when the momentum indicator and the price action move in opposite directions, signaling a potential trend reversal.
- Bullish Divergence: A bullish divergence occurs when the price forms lower lows, but the momentum indicator (such as RSI or MACD) forms higher lows. This suggests that although the price is declining, the selling pressure is weakening, potentially signaling a reversal to the upside.
- Bearish Divergence: A bearish divergence occurs when the price forms higher highs, but the momentum indicator forms lower highs. This indicates that while prices are rising, the buying pressure is weakening, signaling a potential reversal to the downside.
3. Assessing Trend Strength
- High Momentum vs. Low Momentum: The strength of a trend is determined by the velocity of price movement. High momentum means the price is moving quickly in a certain direction with strong buying or selling pressure. Conversely, low momentum indicates a slow-moving trend with less force behind the price movement.
- Indicators for Strength:
- RSI: A high RSI (above 70) suggests that the trend is strong, but it could also indicate overbought conditions, suggesting that a pullback or reversal may occur soon.
- MACD: A wider separation between the MACD and its signal line suggests strong momentum in the trend’s direction. Conversely, a narrowing of the MACD and signal line indicates weakening momentum.
- Stochastic Oscillator: If the Stochastic Oscillator remains in the overbought zone (above 80) or oversold zone (below 20) for extended periods, it suggests strong momentum, but a reversal may be near if the oscillator begins to diverge from price action
Overbought and Oversold Conditions

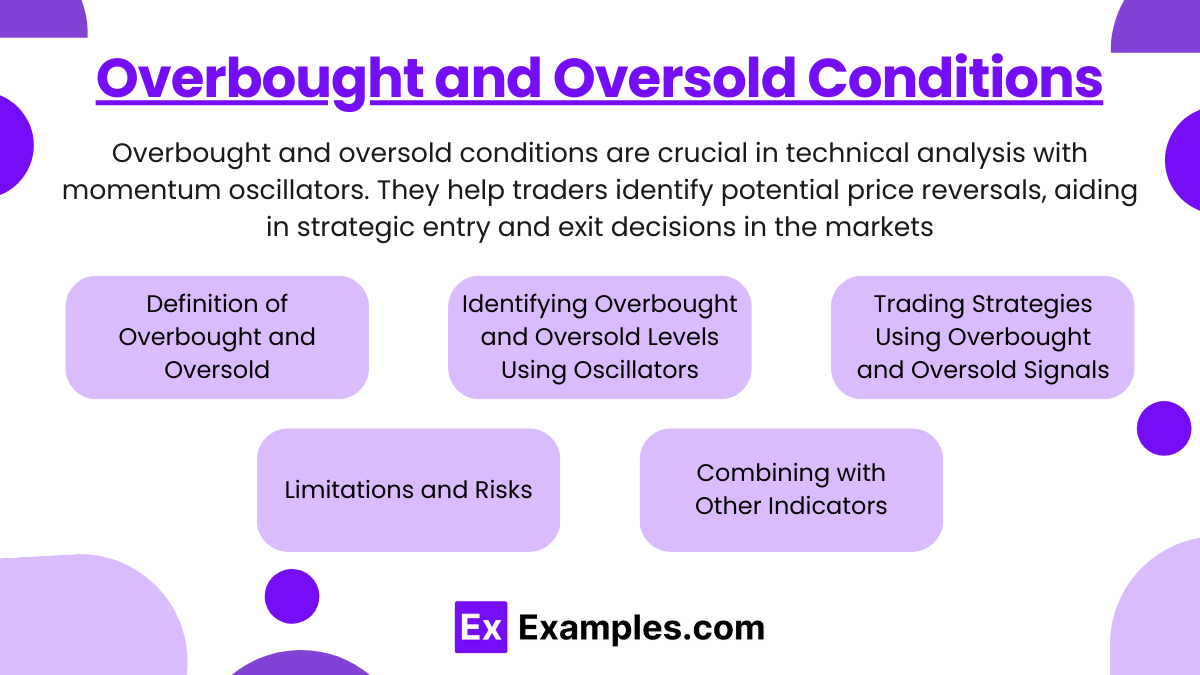
Overbought and oversold conditions are critical concepts in technical analysis, particularly when using momentum oscillators. These conditions help traders identify potential reversal points in the price movement of an asset. Recognizing overbought and oversold levels can aid in making strategic entry and exit decisions in the markets.
1. Definition of Overbought and Oversold
- Overbought Condition:
- An asset is considered overbought when its price has risen significantly over a short period and is trading at levels above its intrinsic or fair value. This suggests that buying pressure may be exhausted, and a correction or pullback could be imminent.
- It indicates that the asset may have been over-purchased by traders, leading to inflated prices that are unsustainable in the short term.
- Oversold Condition:
- An asset is considered oversold when its price has fallen sharply and is trading below its intrinsic value. This condition implies that selling pressure may be overdone, and the asset could be due for a rebound or upward correction.
- It suggests that the asset may have been excessively sold off, potentially creating a buying opportunity.
2. Identifying Overbought and Oversold Levels Using Oscillators
Momentum oscillators are primary tools used to detect overbought and oversold conditions. They oscillate between fixed values, typically ranging from 0 to 100, providing visual representations of these conditions.
- Relative Strength Index (RSI):
- Overbought Level: RSI values above 70 generally indicate that an asset is overbought.
- Oversold Level: RSI values below 30 suggest that an asset is oversold.
- Interpretation: When RSI enters the overbought zone, it may signal that the asset’s price is overextended to the upside and could reverse or consolidate. Conversely, when RSI falls into the oversold zone, it may indicate that the price is excessively depressed and might rebound.
- Stochastic Oscillator:
- Overbought Level: Readings above 80 are considered overbought.
- Oversold Level: Readings below 20 are deemed oversold.
- Interpretation: Similar to RSI, but the Stochastic Oscillator compares the closing price to its price range over a specified period, providing signals of potential reversal when the oscillator crosses certain thresholds.
- Commodity Channel Index (CCI):
- Overbought Level: Values above +100 suggest overbought conditions.
- Oversold Level: Values below -100 indicate oversold conditions.
- Interpretation: CCI measures the deviation of the asset’s price from its statistical mean, helping to identify cyclical trends and potential reversals.
- Williams %R:
- Overbought Level: Readings between -20 and 0.
- Oversold Level: Readings between -80 and -100.
- Interpretation: This oscillator reflects the level of the close relative to the highest high for the look-back period, signaling overbought or oversold conditions accordingly.
3. Trading Strategies Using Overbought and Oversold Signals
- Overbought Strategies:
- Selling or Shorting: Traders may consider selling existing long positions or initiating short positions when overbought signals are identified, anticipating a price decline.
- Wait for Confirmation: It’s advisable to wait for confirmation signals, such as a downturn in the oscillator or bearish chart patterns, before acting on overbought conditions.
- Oversold Strategies:
- Buying or Going Long: Oversold signals may present buying opportunities, as the asset price might rebound from excessively low levels.
- Divergence Signals: Positive divergence between the oscillator and price (price makes new lows while the oscillator makes higher lows) can strengthen the case for entering a long position.
4. Limitations and Risks
- False Signals:
- In strong trending markets, oscillators can remain in overbought or oversold zones for extended periods, providing false signals.
- Relying solely on overbought and oversold readings without considering the broader market context can lead to premature or incorrect trading decisions.
- Market Conditions:
- Range-Bound Markets: Overbought and oversold indicators are more reliable in sideways or range-bound markets where prices fluctuate within a certain range.
- Trending Markets: In strong uptrends or downtrends, overbought and oversold signals may not effectively predict reversals, as the momentum can sustain extreme readings.
5. Combining with Other Indicators
- Confirmation with Trend Analysis:
- Use trend lines, moving averages, or other trend-following indicators to confirm signals from oscillators.
- For example, in an uptrend, consider overbought signals with caution and focus on oversold signals for buying opportunities.
- Divergence Analysis:
- Bullish Divergence: Occurs when the price makes lower lows, but the oscillator makes higher lows, suggesting a potential upward reversal.
- Bearish Divergence: Occurs when the price makes higher highs, but the oscillator makes lower highs, indicating a possible downward reversal.
- Volume Indicators:
- Combining oscillator readings with volume analysis can enhance signal reliability. Increased volume on a reversal signal can add weight to the potential for a significant price move.
Examples
Example 1: Using RSI to Identify Overbought Conditions
A trader observes that the RSI of Stock XYZ has risen above 70, indicating that the stock is potentially overbought. Anticipating a price correction, the trader decides to sell their existing shares or initiate a short position, expecting the price to decline in the near future.
Example 2: MACD Crossover Signaling a Trend Reversal
In analyzing Commodity ABC, the trader notices that the MACD line crosses below the signal line while both are above the zero line. This bearish crossover suggests weakening upward momentum. The trader interprets this as a signal to exit long positions or consider shorting, anticipating a downward trend reversal.
Example 3:Stochastic Oscillator Indicates Oversold Conditions
The Stochastic Oscillator for Currency Pair EUR/USD drops below 20, entering the oversold zone. Simultaneously, there’s a bullish divergence where the price makes lower lows, but the oscillator makes higher lows. The trader takes this as a cue to enter a long position, expecting a price rebound.
Example 4: Combining Momentum Indicators for Confirmation
For Index DEF, the trader sees that both RSI is approaching 30 and MACD is about to cross above the signal line below the zero line. This dual indication suggests a potential bullish reversal. The trader decides to buy, using both indicators to confirm the momentum shift.
Example 5: Divergence Between Price and Momentum Indicator
While analyzing Stock GHI, the trader notices that the price is making higher highs, but the RSI is making lower highs—a bearish divergence. Recognizing this discrepancy, the trader predicts a possible trend reversal and opts to secure profits by closing long positions or initiating shorts.
Practice Questions
Question 1
Which of the following statements best describes the purpose of the Relative Strength Index (RSI) in technical analysis? A) Measures the volatility of an asset’s price over a specific period. B) Assesses the momentum of price movements to identify overbought or oversold conditions. C) Calculates the average price of an asset over a set number of periods. D) Determines the correlation between two different assets.
Answer: B) Assesses the momentum of price movements to identify overbought or oversold conditions.
Explanation: The RSI is a momentum oscillator that measures the speed and change of price movements, oscillating between 0 and 100. It helps traders identify overbought conditions when values are above 70 and oversold conditions when values are below 30, signaling potential reversals.
Question 2
In the Moving Average Convergence Divergence (MACD) indicator, a bullish signal is typically generated when: A) The MACD line crosses below the signal line above the zero line. B) The MACD histogram shows decreasing values below the zero line. C) The MACD line crosses above the signal line below the zero line. D) Both the MACD line and signal line are declining.
Answer: C) The MACD line crosses above the signal line below the zero line.
Explanation: A bullish signal in MACD occurs when the MACD line crosses above the signal line, especially when this crossover happens below the zero line. It indicates a potential upward momentum shift from a bearish trend, suggesting a buying opportunity.
Question 3
Which momentum oscillator compares an asset’s closing price to its price range over a specified period and is most effective in identifying potential trend reversals in range-bound markets? A) Stochastic Oscillator B) Bollinger Bands C) Average Directional Index (ADX) D) On-Balance Volume (OBV)
Answer: A) Stochastic Oscillator
Explanation: The Stochastic Oscillator measures the position of the closing price relative to the high-low range over a set period, typically 14 periods. It is particularly effective in range-bound markets for identifying overbought and oversold conditions, signaling potential trend reversals.


