The Basic Principle of Technical Analysis — The Trend emphasizes the importance of identifying and understanding price movements in financial markets. Trends, characterized as upward, downward, or sideways, reflect the prevailing market sentiment and guide traders in making informed decisions. By analyzing trends through various tools such as trend lines and moving averages, traders can predict potential price movements and adjust their strategies accordingly. Recognizing these patterns is essential for effective trading, enabling market participants to align their actions with the underlying dynamics of the market.
Learning Objectives
In studying “Section I: Theory and History of Technical Analysis: The Basic Principle of Technical Analysis — The Trend” for the CMT Exam, you should learn to identify and differentiate between various types of trends, including uptrends, downtrends, and sideways trends. Analyze how trend lines and channels are utilized to visually represent price movements and assess market sentiment. Evaluate the significance of indicators such as moving averages and volume in confirming trends. Additionally, explore the historical context of trend analysis, including the principles established by pioneers like Charles Dow, and apply this knowledge to interpret market behavior and make informed trading decisions.
In technical analysis, understanding trends is fundamental. A trend is defined as the general direction in which the price of an asset moves over a period. Recognizing trends is crucial for traders as it helps in making informed decisions about buying or selling securities.
Types of Trends

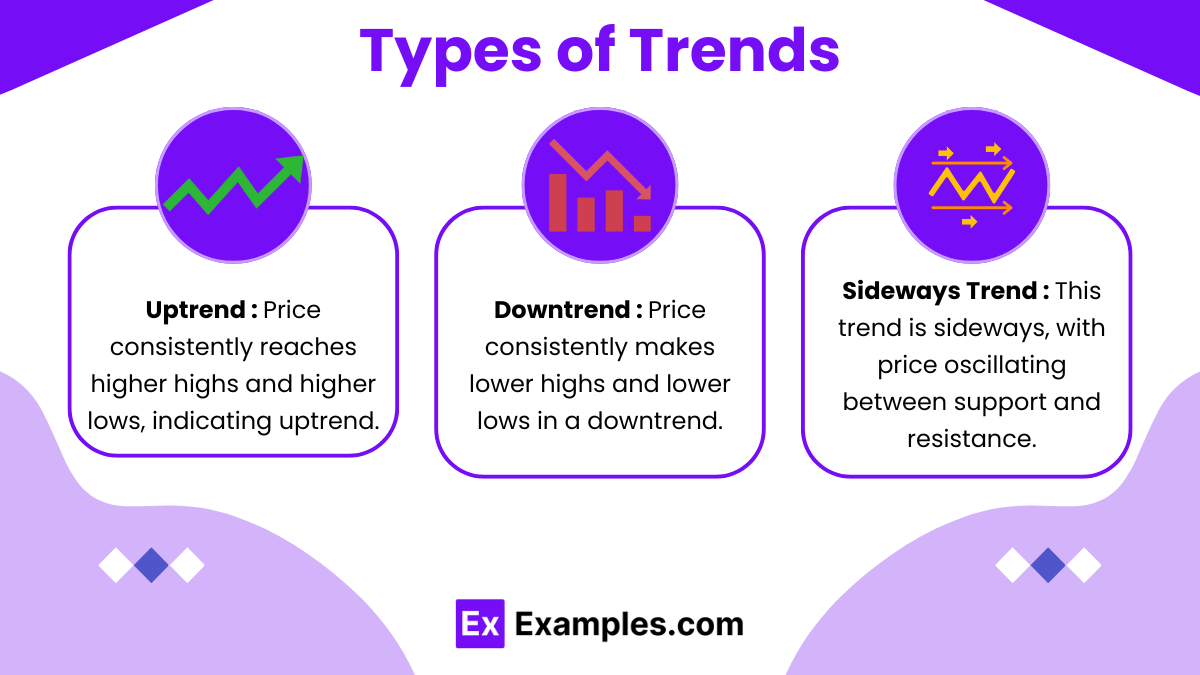
- Uptrend: This occurs when the price consistently reaches higher highs and higher lows. In an uptrend, bullish sentiment prevails, and traders expect further price increases.
- Characteristics:
- Series of higher highs and higher lows.
- Increasing volume often accompanies an uptrend.
- Bullish indicators may include moving averages that slope upward.
- Characteristics:
- Downtrend: This occurs when the price consistently reaches lower highs and lower lows. In a downtrend, bearish sentiment prevails, and traders anticipate further price declines.
- Characteristics:
- Series of lower highs and lower lows.
- Increasing volume may indicate strong selling pressure.
- Bearish indicators may include moving averages that slope downward.
- Characteristics:
- Sideways Trend (Range-bound): This trend occurs when the price moves within a horizontal range, with neither upward nor downward movement dominating. Traders may see opportunities to buy near support and sell near resistance levels.
- Characteristics:
- Prices fluctuate within a defined range.
- Volume may decline as the market consolidates.
- Indicators may provide mixed signals.
- Characteristics:
Trend Analysis

Trend Analysis is the practice of analyzing historical price movements and patterns in financial markets to identify the general direction of an asset’s price over time. By examining upward, downward, or sideways trends, traders and analysts can make informed predictions about future price movements, facilitating strategic decision-making in trading and investing. This analysis often involves the use of various tools, such as trend lines, moving averages, and chart patterns, to assess market sentiment and potential points of entry or exit.
- Trend Lines: A visual representation of trends, trend lines connect significant price points (highs or lows) to help identify the current trend. An upward trend line is drawn by connecting the lows of the price, while a downward trend line connects the highs.
- Channels: These are formed by drawing parallel lines to trend lines. An upward channel has an upper line that connects higher highs and a lower line that connects higher lows, while a downward channel has a similar structure for lower prices.
Importance of Trends

- Market Sentiment: Trends provide insight into market sentiment. Uptrends indicate bullish sentiment, while downtrends suggest bearish sentiment. Understanding these trends helps traders align their strategies with prevailing market moods.
- Timing Entries and Exits: Recognizing the beginning and end of trends can aid in timing trades. Entering a trade in the direction of the trend can enhance the likelihood of a profitable outcome, while exiting at the end of a trend can help lock in profits.
- Risk Management: Understanding trends helps in setting stop-loss orders and managing risk. Traders can position their stop-loss levels outside the trend lines, reducing the chance of premature exits.
- Pattern Recognition: Trends facilitate the identification of chart patterns (e.g., head and shoulders, flags, and triangles) that can signal potential reversals or continuations, aiding in decision-making.
Indicators and Tools for Trend Analysis

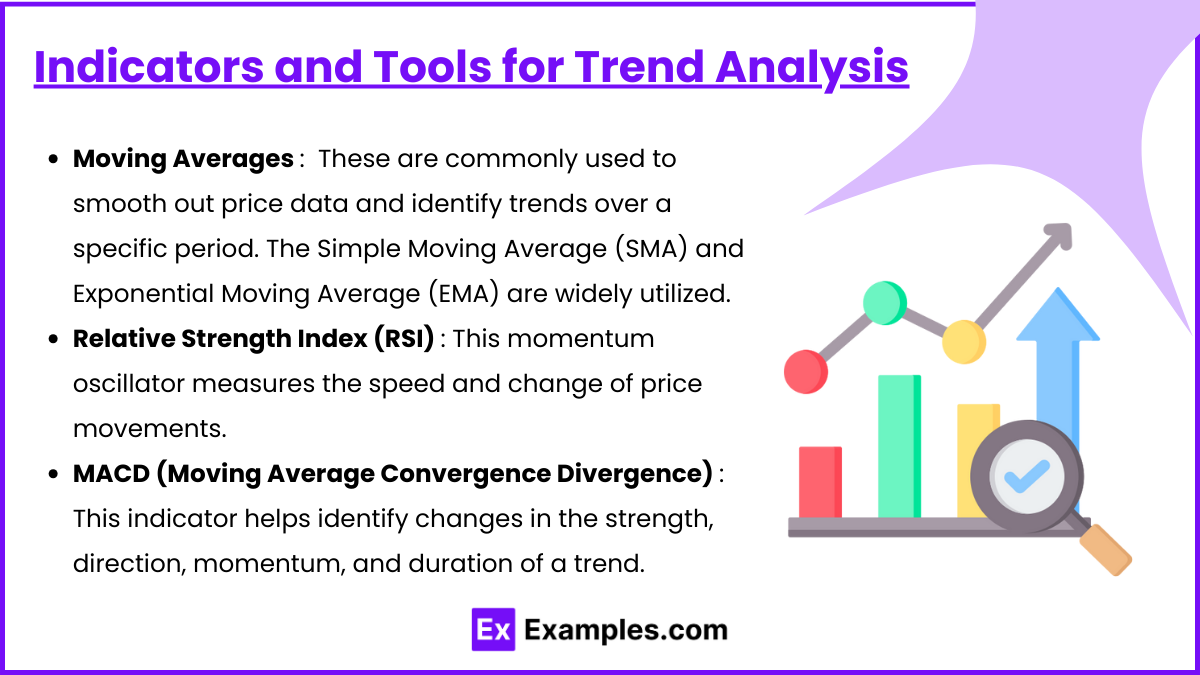
- Moving Averages: These are commonly used to smooth out price data and identify trends over a specific period. The Simple Moving Average (SMA) and Exponential Moving Average (EMA) are widely utilized.
- A crossover of short-term moving averages over long-term averages (Golden Cross) signals a potential uptrend, while the opposite (Death Cross) signals a potential downtrend.
- Relative Strength Index (RSI): This momentum oscillator measures the speed and change of price movements. It ranges from 0 to 100 and is typically used to identify overbought or oversold conditions. An RSI above 70 may indicate an overbought market, while an RSI below 30 may suggest an oversold condition.
- MACD (Moving Average Convergence Divergence): This indicator helps identify changes in the strength, direction, momentum, and duration of a trend. It consists of two moving averages and a histogram that reflects the difference between them.
Examples
Example 1: Identifying an Uptrend in Stock Prices
An investor observes the price movements of Company A over several months. The stock consistently hits higher highs and higher lows, forming an uptrend. The investor uses a trend line to connect the lows, confirming the uptrend. By employing moving averages, the investor sees that the 50-day moving average has crossed above the 200-day moving average, signaling a strong bullish sentiment. The investor decides to enter a long position, anticipating further price increases based on the confirmed uptrend.
Example 2: Recognizing a Downtrend in Commodity Prices
A trader monitors the price of oil and notices that it has been making lower highs and lower lows for an extended period. This consistent price action indicates a downtrend. The trader draws a downward trend line connecting the highs and observes increasing volume on down days, confirming the strength of the bearish trend. With this analysis, the trader decides to short-sell oil futures, expecting the downward trend to continue.
Example 3: Analyzing a Sideways Trend in a Currency Pair
A forex trader analyzes the EUR/USD currency pair and identifies a range-bound market where the price fluctuates between a defined support level at 1.1500 and a resistance level at 1.1800. The trader uses horizontal trend lines to illustrate this sideways trend. The lack of significant price movement prompts the trader to adopt a range-trading strategy, buying near the support level and selling near the resistance level, capitalizing on the predictable price oscillations within the defined range.
Example 4: Utilizing Moving Averages to Confirm Trends
A technical analyst tracks the performance of a tech stock, applying both the 50-day and 200-day moving averages. The analyst observes that the stock’s price has recently crossed above both moving averages, confirming an uptrend. Additionally, the moving averages themselves are sloping upward. The analyst interprets this information as a bullish signal and recommends entering a long position, expecting the trend to persist based on historical performance and trend analysis principles.
Example 5: Historical Context of Dow Theory and Trends
The foundations of trend analysis can be traced back to Charles Dow, who developed the Dow Theory in the early 1900s. Dow posited that markets move in trends, which can be upward, downward, or sideways, and that these trends reflect underlying market sentiment. By analyzing historical price movements of indices such as the Dow Jones Industrial Average, traders began to adopt the practice of identifying primary trends (long-term), secondary trends (intermediate), and minor trends (short-term). Dow’s principles continue to inform modern technical analysis, emphasizing the importance of recognizing and trading with the prevailing market trends.
Practice Questions
Question 1
Which of the following best defines an uptrend?
A) A series of lower highs and lower lows
B) A series of higher highs and higher lows
C) A flat price movement within a defined range
D) A reversal pattern indicating a change in trend direction
Correct Answer: B) A series of higher highs and higher lows
Explanation: An uptrend is characterized by a consistent pattern of higher highs and higher lows in price movements. This indicates that buyers are willing to pay increasingly higher prices, reflecting bullish market sentiment. Recognizing an uptrend allows traders to align their strategies with the prevailing market conditions, typically by taking long positions. In contrast, options A and C describe downtrends and sideways trends, respectively, while option D refers to trend reversal patterns.
Question 2
What tool is commonly used to visualize and confirm the presence of a trend?
A) Relative Strength Index (RSI)
B) Trend line
C) Moving Average Convergence Divergence (MACD)
D) Bollinger Bands
Correct Answer: B) Trend line
Explanation: Trend lines are graphical representations that connect significant price points (such as lows in an uptrend or highs in a downtrend) to illustrate the direction of price movements over time. They help traders visually identify the trend and determine potential areas of support and resistance. While other tools like RSI, MACD, and Bollinger Bands provide valuable information about market conditions, they do not specifically serve as a visual representation of trend direction.
Question 3
In the context of Dow Theory, which of the following statements is true regarding trends?
A) Trends are irrelevant for short-term trading strategies.
B) A primary trend is the longest duration trend, lasting for several months to years.
C) Secondary trends always move against the primary trend.
D) Trends cannot be influenced by external market factors.
Correct Answer: B) A primary trend is the longest duration trend, lasting for several months to years.
Explanation : According to Dow Theory, trends are categorized into primary, secondary, and minor trends. The primary trend represents the long-term direction of the market and can last from several months to years, indicating the overall market sentiment. Secondary trends are shorter-term movements that can act against the primary trend but do not negate its direction. Option A is incorrect as trends are relevant for all trading strategies. Option C is misleading since secondary trends can move in either direction relative to the primary trend. Option D is also incorrect because trends can indeed be influenced by a variety of external factors, including economic events, market news, and geopolitical developments.


