“Breakouts, Stops, and Retracements” is a critical topic for understanding market dynamics in the CMT Exam. This section focuses on identifying breakout points when prices move beyond established support or resistance levels, indicating potential trend changes. Additionally, it covers the importance of stop-loss orders in managing risk and protecting capital. Retracements, particularly Fibonacci levels, are explored as tools for identifying temporary price reversals within ongoing trends. Mastering these concepts enables traders to make informed decisions and effectively navigate the complexities of financial markets.
Learning Objectives
In studying ” Breakouts, Stops, and Retracements ” for the CMT Exam, you should learn to identify and analyze breakout patterns and their significance in trading strategies. Understand how to set stop-loss orders to manage risk effectively and explore various types of stops, including trailing stops. Evaluate the role of retracement levels, particularly Fibonacci levels, in determining potential reversal points within trends. Additionally, apply your knowledge of these concepts to real-world scenarios, enhancing your ability to make informed trading decisions and effectively interpret market signals in practice situations.
Understanding Breakouts
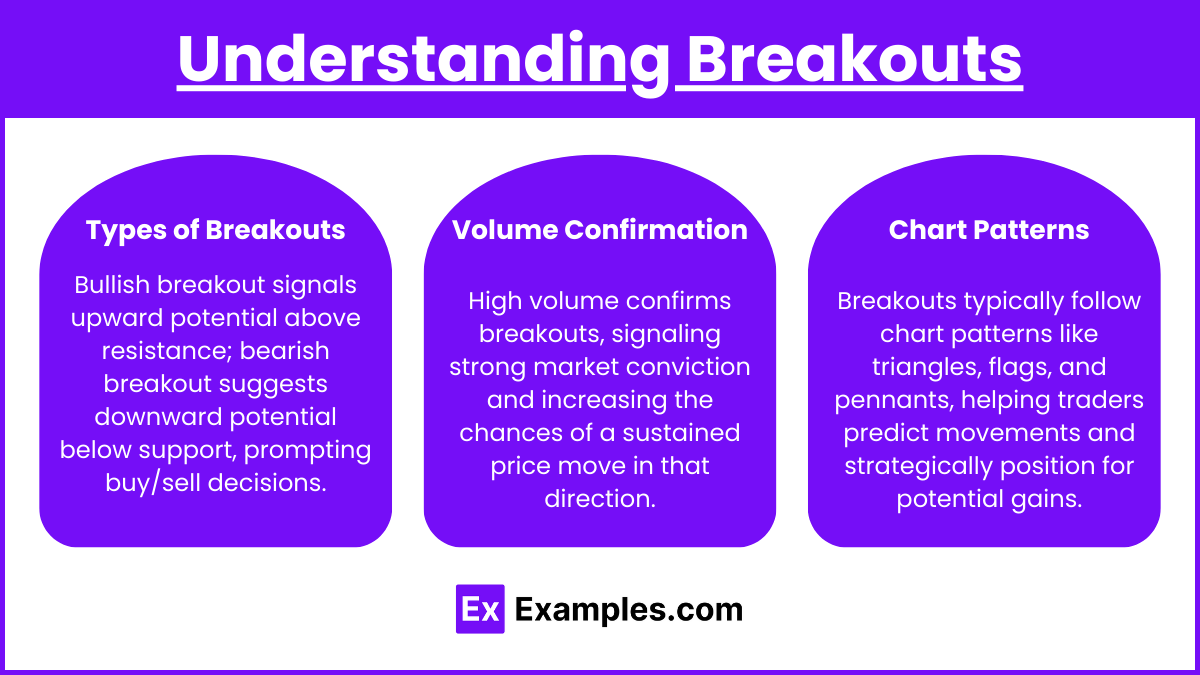
A breakout occurs when the price moves beyond a defined support or resistance level, indicating a potential shift in market sentiment. Breakouts can signal the start of a new trend or a continuation of an existing trend.
- Types of Breakouts:
- Bullish Breakout: This happens when the price breaks above a resistance level, suggesting a potential upward trend. Traders often interpret this as a signal to buy.
- Bearish Breakout: This occurs when the price falls below a support level, indicating a potential downward trend. Traders may view this as a signal to sell or short-sell.
- Volume Confirmation:
- Volume plays a crucial role in confirming breakouts. A breakout accompanied by high volume suggests strong market conviction and increases the likelihood of a sustained price movement. Conversely, a breakout on low volume may indicate weakness and potential for a false breakout.
- Chart Patterns:
- Breakouts often occur following the formation of chart patterns such as triangles, flags, and pennants. Recognizing these patterns can help traders anticipate potential breakouts and position themselves accordingly.
Understanding Stops
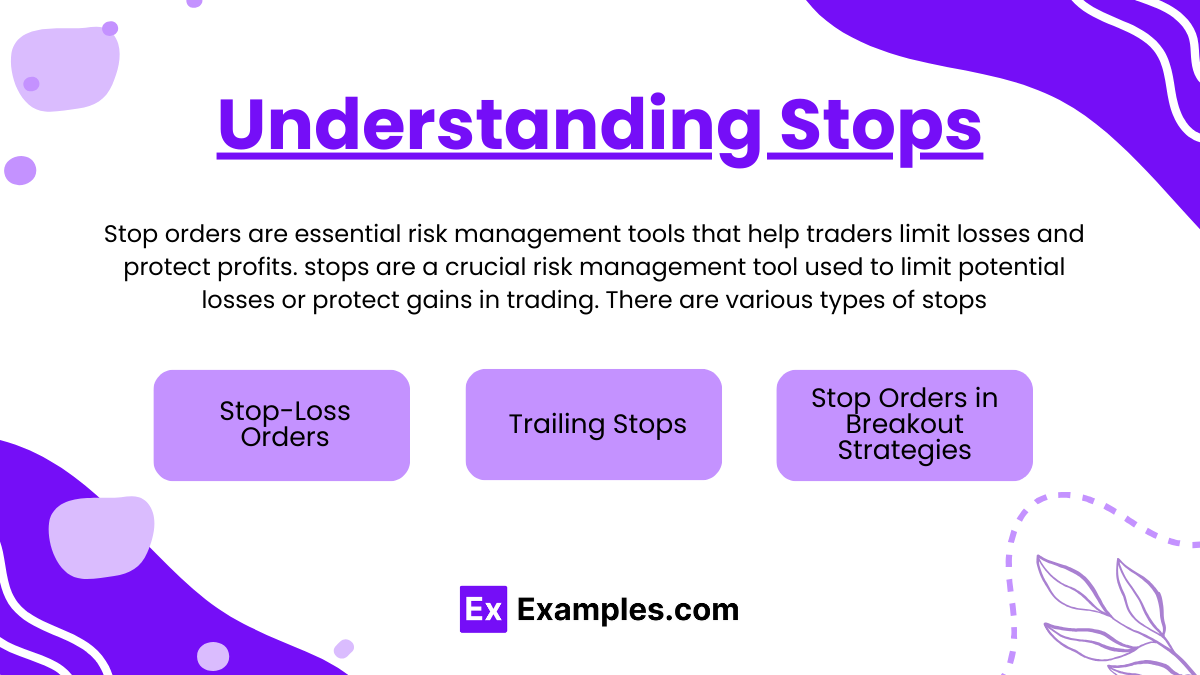
Stop orders are essential risk management tools that help traders limit losses and protect profits. stops are a crucial risk management tool used to limit potential losses or protect gains in trading. Stops are pre-set price levels that trigger automatic orders to close a position, helping traders manage their exposure in volatile markets. Common types include stop-loss orders, which exit a trade if the price moves against the trader’s position, and trailing stops, which adjust with favorable price movements to lock in profits. Understanding stops enables traders to align their strategies with market trends, minimizing risk and safeguarding gains as patterns unfold. There are various types of stops:
- Stop-Loss Orders:
- These orders are placed to sell a security when its price falls to a predetermined level. Stop-loss orders help minimize potential losses by automatically executing a sale if the price moves against the trader’s position.
- Trailing Stops:
- A trailing stop is a dynamic stop-loss order that moves with the market price. It allows traders to lock in profits as the price rises while still providing a safeguard against significant price declines. For example, a trader might set a trailing stop at 5% below the market price.
- Stop Orders in Breakout Strategies:
- Traders often place stop orders just below support levels for bullish breakouts and just above resistance levels for bearish breakouts. This technique helps manage risk in case the breakout fails.
Understanding Retracements
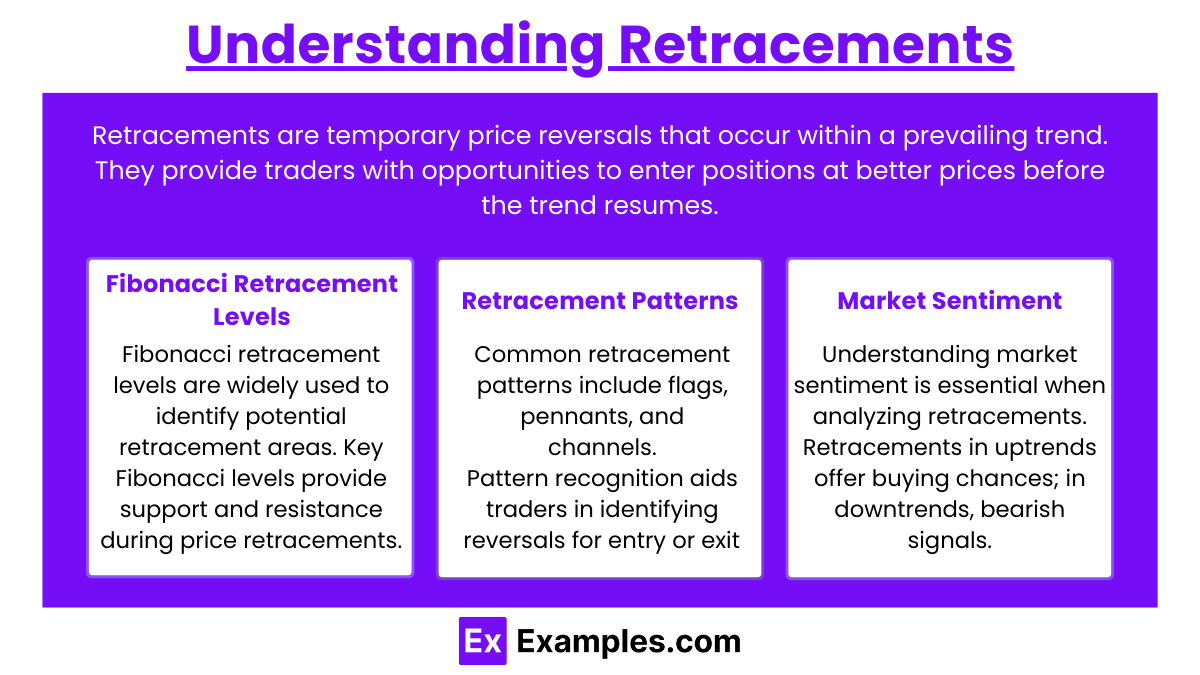
Retracements are temporary price reversals that occur within a prevailing trend. They provide traders with opportunities to enter positions at better prices before the trend resumes.
- Fibonacci Retracement Levels:
- Fibonacci retracement levels are widely used to identify potential retracement areas. Traders often look for price reactions at key Fibonacci levels, such as 23.6%, 38.2%, 50%, 61.8%, and 100%. These levels can act as support or resistance during retracements.
- Retracement Patterns:
- Common retracement patterns include flags, pennants, and channels. Recognizing these patterns helps traders determine potential reversal points and decide whether to enter or exit positions.
- Market Sentiment:
- Understanding market sentiment is essential when analyzing retracements. In a strong uptrend, for instance, retracements may be viewed as buying opportunities, while in a downtrend, they could signal a continuation of the bearish trend.
Practical Applications
- Developing Breakout Strategies:
- Traders should develop strategies that include identifying key support and resistance levels, recognizing chart patterns, and using volume to confirm breakouts. Implementing proper risk management techniques, such as stop-loss orders, is crucial to protect capital.
- Using Stops Effectively:
- Setting stop-loss orders appropriately can significantly impact trading performance. Traders should consider volatility and market conditions when determining stop levels to avoid premature exits.
- Identifying and Capitalizing on Retracements:
- Traders can capitalize on retracements by looking for price action signals at Fibonacci levels or within established patterns. This approach can provide favorable entry points to align with the prevailing trend.
Examples
Example 1: Bullish Breakout from a Resistance Level
A trader monitors a stock that has been trading within a defined range, with resistance at $50. After several attempts to break through this level, the stock finally closes above $50 with a significant increase in volume. Recognizing this bullish breakout, the trader enters a long position, setting a stop-loss order just below the previous resistance level to manage risk. This breakout suggests a potential upward trend, allowing the trader to capitalize on further price increases.
Example 2: Bearish Breakout Below a Support Level
An investor tracks a commodity that has established a support level at $75. After weeks of consolidating around this level, the price suddenly drops below $75 with high volume, signaling a bearish breakout. The investor decides to short-sell the commodity, placing a stop-loss order above the new resistance level at $76 to protect against potential losses if the breakout fails. This strategy allows the investor to take advantage of the anticipated downward movement.
Example 3: Fibonacci Retracement During an Uptrend
A trader identifies an uptrend in a technology stock and observes a pullback after the stock reaches $120. Using Fibonacci retracement levels, the trader notices that the price retraces to the 38.2% level at $115. Recognizing this level as a potential support point, the trader enters a long position, anticipating that the trend will continue upward after the retracement. This approach allows the trader to enter at a favorable price while maintaining a clear stop-loss order below the 50% retracement level.
Example 4: Trailing Stop in a Strong Uptrend
A swing trader holds a position in a stock that has been trending upward consistently, currently priced at $150. To protect profits, the trader sets a trailing stop order at 5% below the highest price reached during the trend. As the stock price rises to $160, the trailing stop adjusts to $152. This strategy allows the trader to lock in profits while still participating in potential further gains, providing a safety net against sudden reversals in price.
Example 5: Double Bottom Pattern and Retracement Entry
A technical analyst observes a double bottom pattern forming in a stock after a downtrend, with the first bottom at $45 and the second bottom at $46. After confirming the pattern with a bullish breakout above the neckline at $50, the analyst anticipates a trend reversal. However, the stock experiences a brief retracement back to the $48 level, aligning with the 50% Fibonacci retracement. The analyst uses this retracement as an entry point for a long position, setting a stop-loss order just below the second bottom to manage risk effectively.
Practice Questions
Question 1
What is a breakout?
A) A price movement that reverses a previous trend
B) A price movement beyond a defined support or resistance level
C) A temporary price fluctuation within a trend
D) A trading strategy that involves holding a position indefinitely
Correct Answer: B) A price movement beyond a defined support or resistance level
Explanation: A breakout occurs when the price of a security moves beyond a defined support or resistance level, indicating a potential shift in market sentiment. A bullish breakout happens when the price rises above resistance, suggesting the start of an upward trend, while a bearish breakout occurs when the price falls below support, indicating a possible downward trend. Options A and C describe different price movements, while option D is not relevant to the definition of a breakout.
Question 2
Which of the following is the purpose of a stop-loss order?
A) To guarantee profits regardless of market conditions
B) To limit potential losses on a trade
C) To ensure a trade is executed at the market price
D) To signal a breakout point
Correct Answer: B) To limit potential losses on a trade
Explanation: A stop-loss order is designed to limit potential losses on a trade by automatically selling a security when its price reaches a predetermined level. This tool helps traders manage risk and protect their capital in volatile markets. While it does not guarantee profits (option A), nor does it ensure execution at market price (option C), it serves the critical function of risk management. Option D misrepresents the purpose of a stop-loss order, as it does not signal breakouts.
Question 3
What does a Fibonacci retracement level indicate?
A) The exact point where a trend will reverse
B) Potential support or resistance levels during a retracement
C) The strength of a breakout in a trend
D) A guaranteed price target for a trade
Correct Answer: B) Potential support or resistance levels during a retracement
Explanation: Fibonacci retracement levels are horizontal lines that indicate potential support and resistance levels based on the Fibonacci sequence. Traders use these levels to identify possible price points where a security might reverse during a retracement within a trend. While they provide valuable insights into potential areas of interest, they do not guarantee reversals (option A), indicate breakout strength (option C), or set definitive price targets (option D). Instead, they serve as tools for traders to assess where price corrections might occur within a broader trend.

