SMART
Problem
-
Solving
Goals
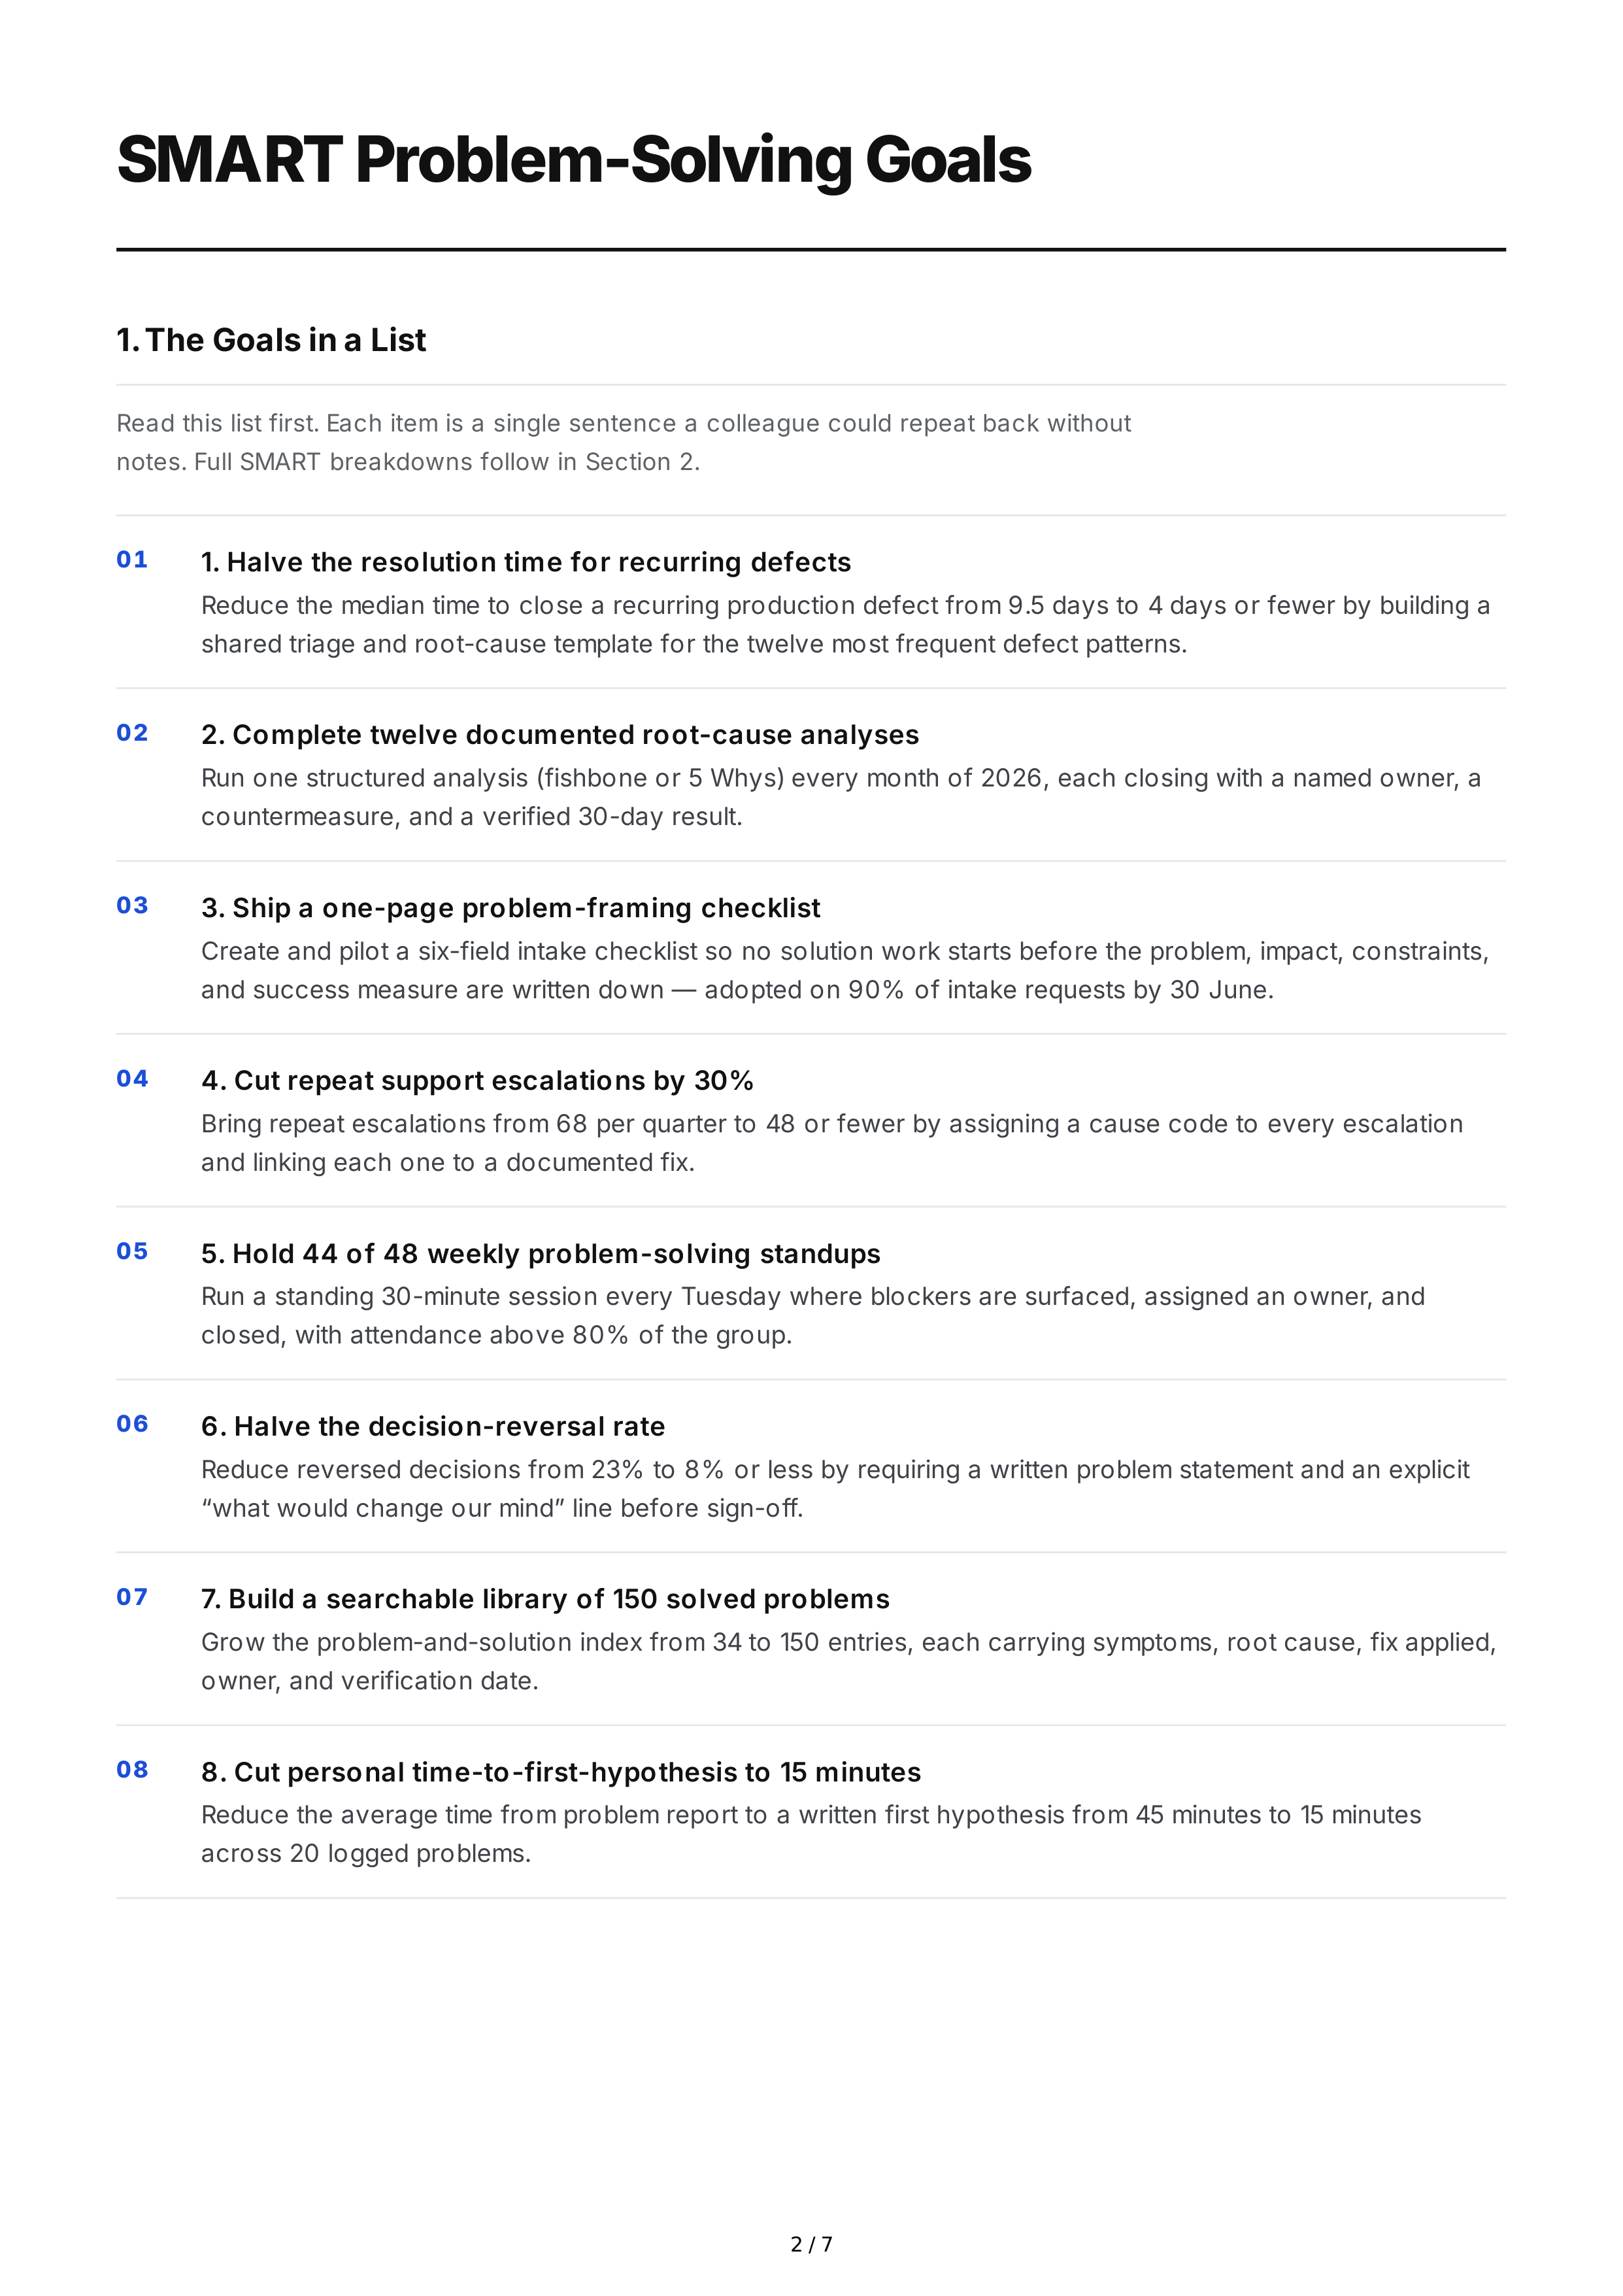
1.
The
Goals
in
a
List
Read
this
list
first
.
Each
item
is
a
single
sentence
a
colleague
could
repeat
back
without
notes
.
Full
SMART
breakdowns
follow
in
Section
2.
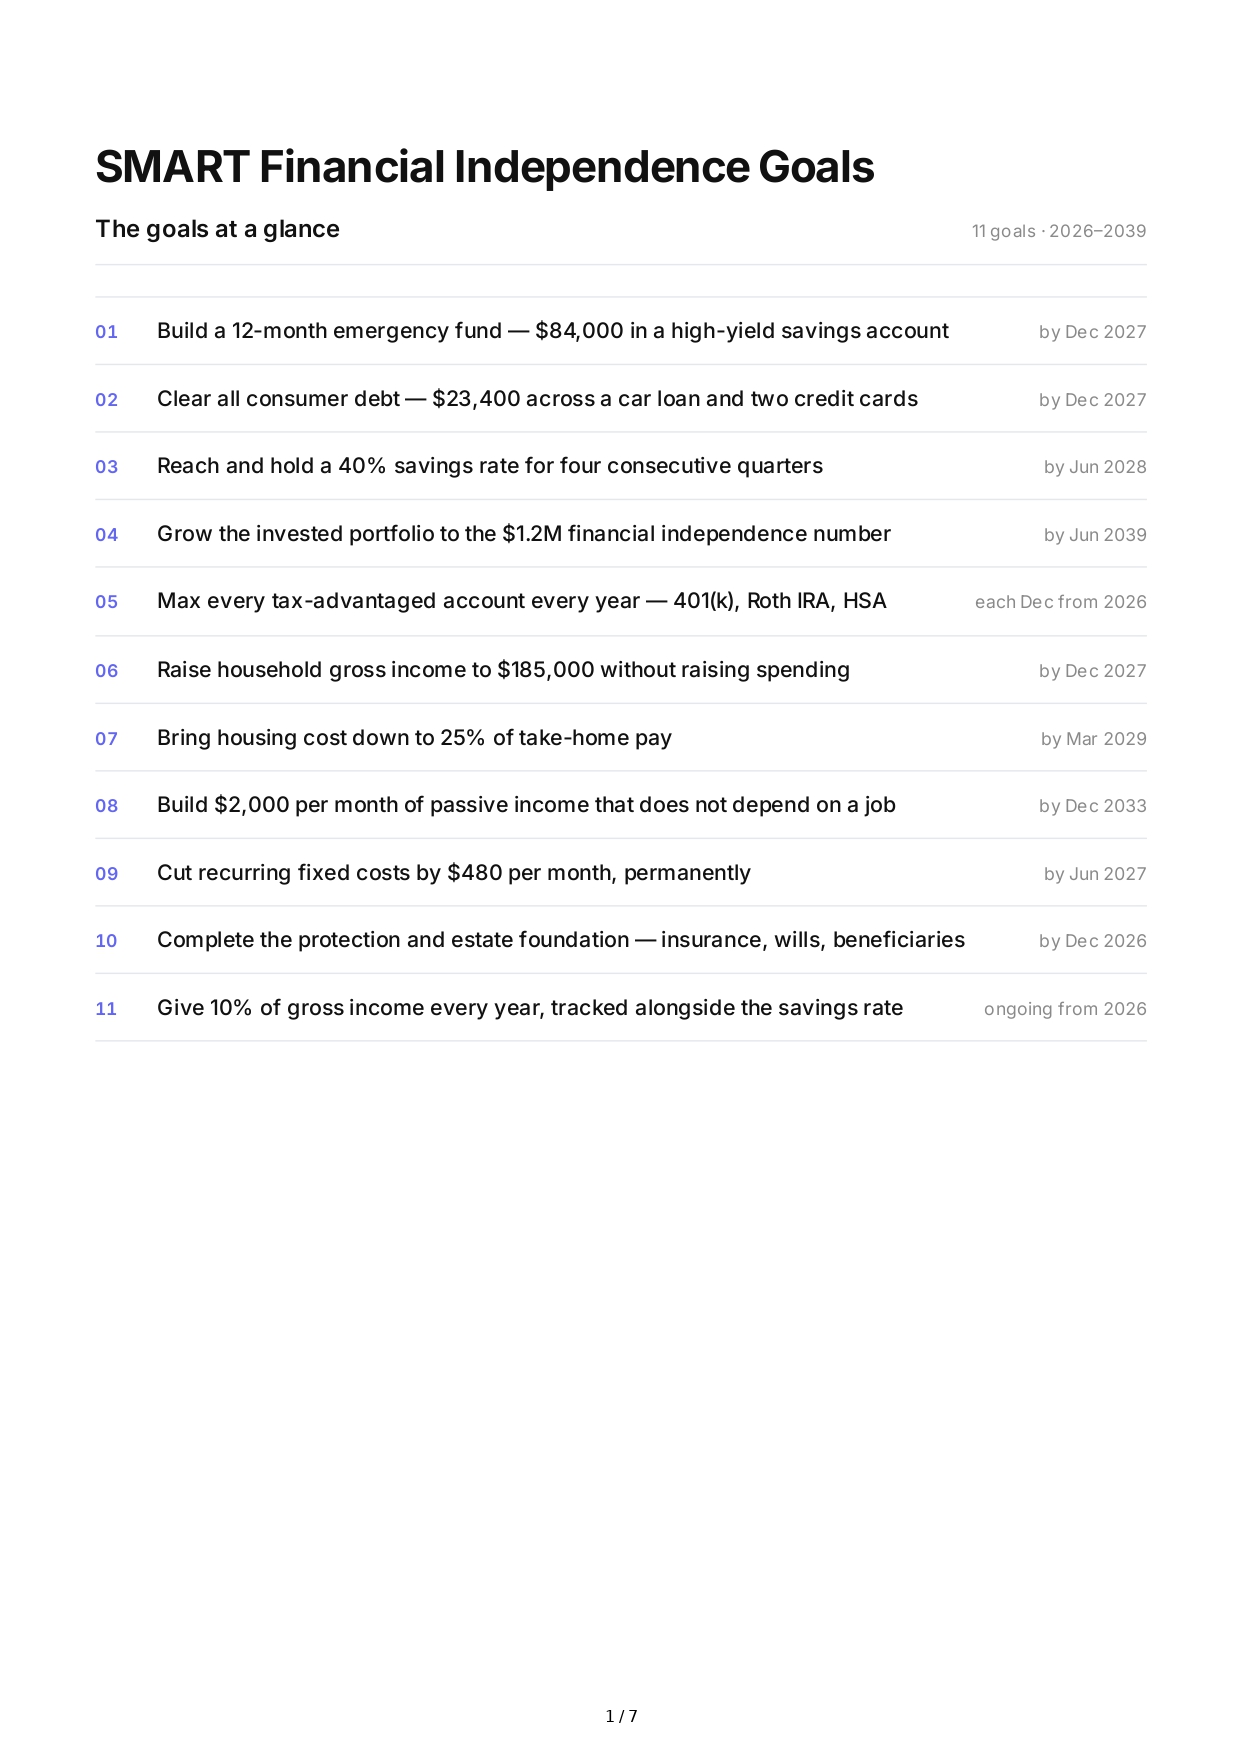
1.
Halve
the
resolution
time
for
recurring
defects
Reduce
the
median
time
to
close
a
recurring
production
defect
from
9.5
days
to
4
days
or
fewer
by
building
a
shared
triage
and
root
-
cause
template
for
the
twelve
most
frequent
defect
patterns
.
01
2.
Complete
twelve
documented
root
-
cause
analyses
Run
one
structured
analysis
(
fishbone
or
5
Whys
)
every
month
of
2026,
each
closing
with
a
named
owner
,
a
countermeasure
,
and
a
verified
30-
day
result
.
02
3.
Ship
a
one
-
page
problem
-
framing
checklist
Create
and
pilot
a
six
-
field
intake
checklist
so
no
solution
work
starts
before
the
problem
,
impact
,
constraints
,
and
success
measure
are
written
down
—
adopted
on
90%
of
intake
requests
by
30
June
.
03
4.
Cut
repeat
support
escalations
by
30%
Bring
repeat
escalations
from
68
per
quarter
to
48
or
fewer
by
assigning
a
cause
code
to
every
escalation
and
linking
each
one
to
a
documented
fix
.
04
5.
Hold
44
of
48
weekly
problem
-
solving
standups
Run
a
standing
30-
minute
session
every
Tuesday
where
blockers
are
surfaced
,
assigned
an
owner
,
and
closed
,
with
attendance
above
80%
of
the
group
.
05
6.
Halve
the
decision
-
reversal
rate
Reduce
reversed
decisions
from
23%
to
8%
or
less
by
requiring
a
written
problem
statement
and
an
explicit
“
what
would
change
our
mind
”
line
before
sign
-
off
.
06
7.
Build
a
searchable
library
of
150
solved
problems
Grow
the
problem
-
and
-
solution
index
from
34
to
150
entries
,
each
carrying
symptoms
,
root
cause
,
fix
applied
,
owner
,
and
verification
date
.
07
8.
Cut
personal
time
-
to
-
first
-
hypothesis
to
15
minutes
Reduce
the
average
time
from
problem
report
to
a
written
first
hypothesis
from
45
minutes
to
15
minutes
across
20
logged
problems
.
08
2 / 7
2.
Goal
Detail
How
to
read
each
breakdown
.
Every
goal
below
is
written
to
the
SMART
standard
so
it
can
be
measured
without
negotiation
:
Specific
—
names
the
exact
behaviour
,
artifact
,
or
metric
being
changed
.
Measurable
—
states
the
baseline
,
the
target
,
and
where
the
number
comes
from
.
Achievable
—
explains
why
the
target
is
reachable
with
current
people
and
capacity
.
Relevant
—
ties
the
goal
to
a
cost
the
team
is
already
paying
.
Time
-
bound
—
fixes
intermediate
checkpoints
and
a
final
verification
date
.
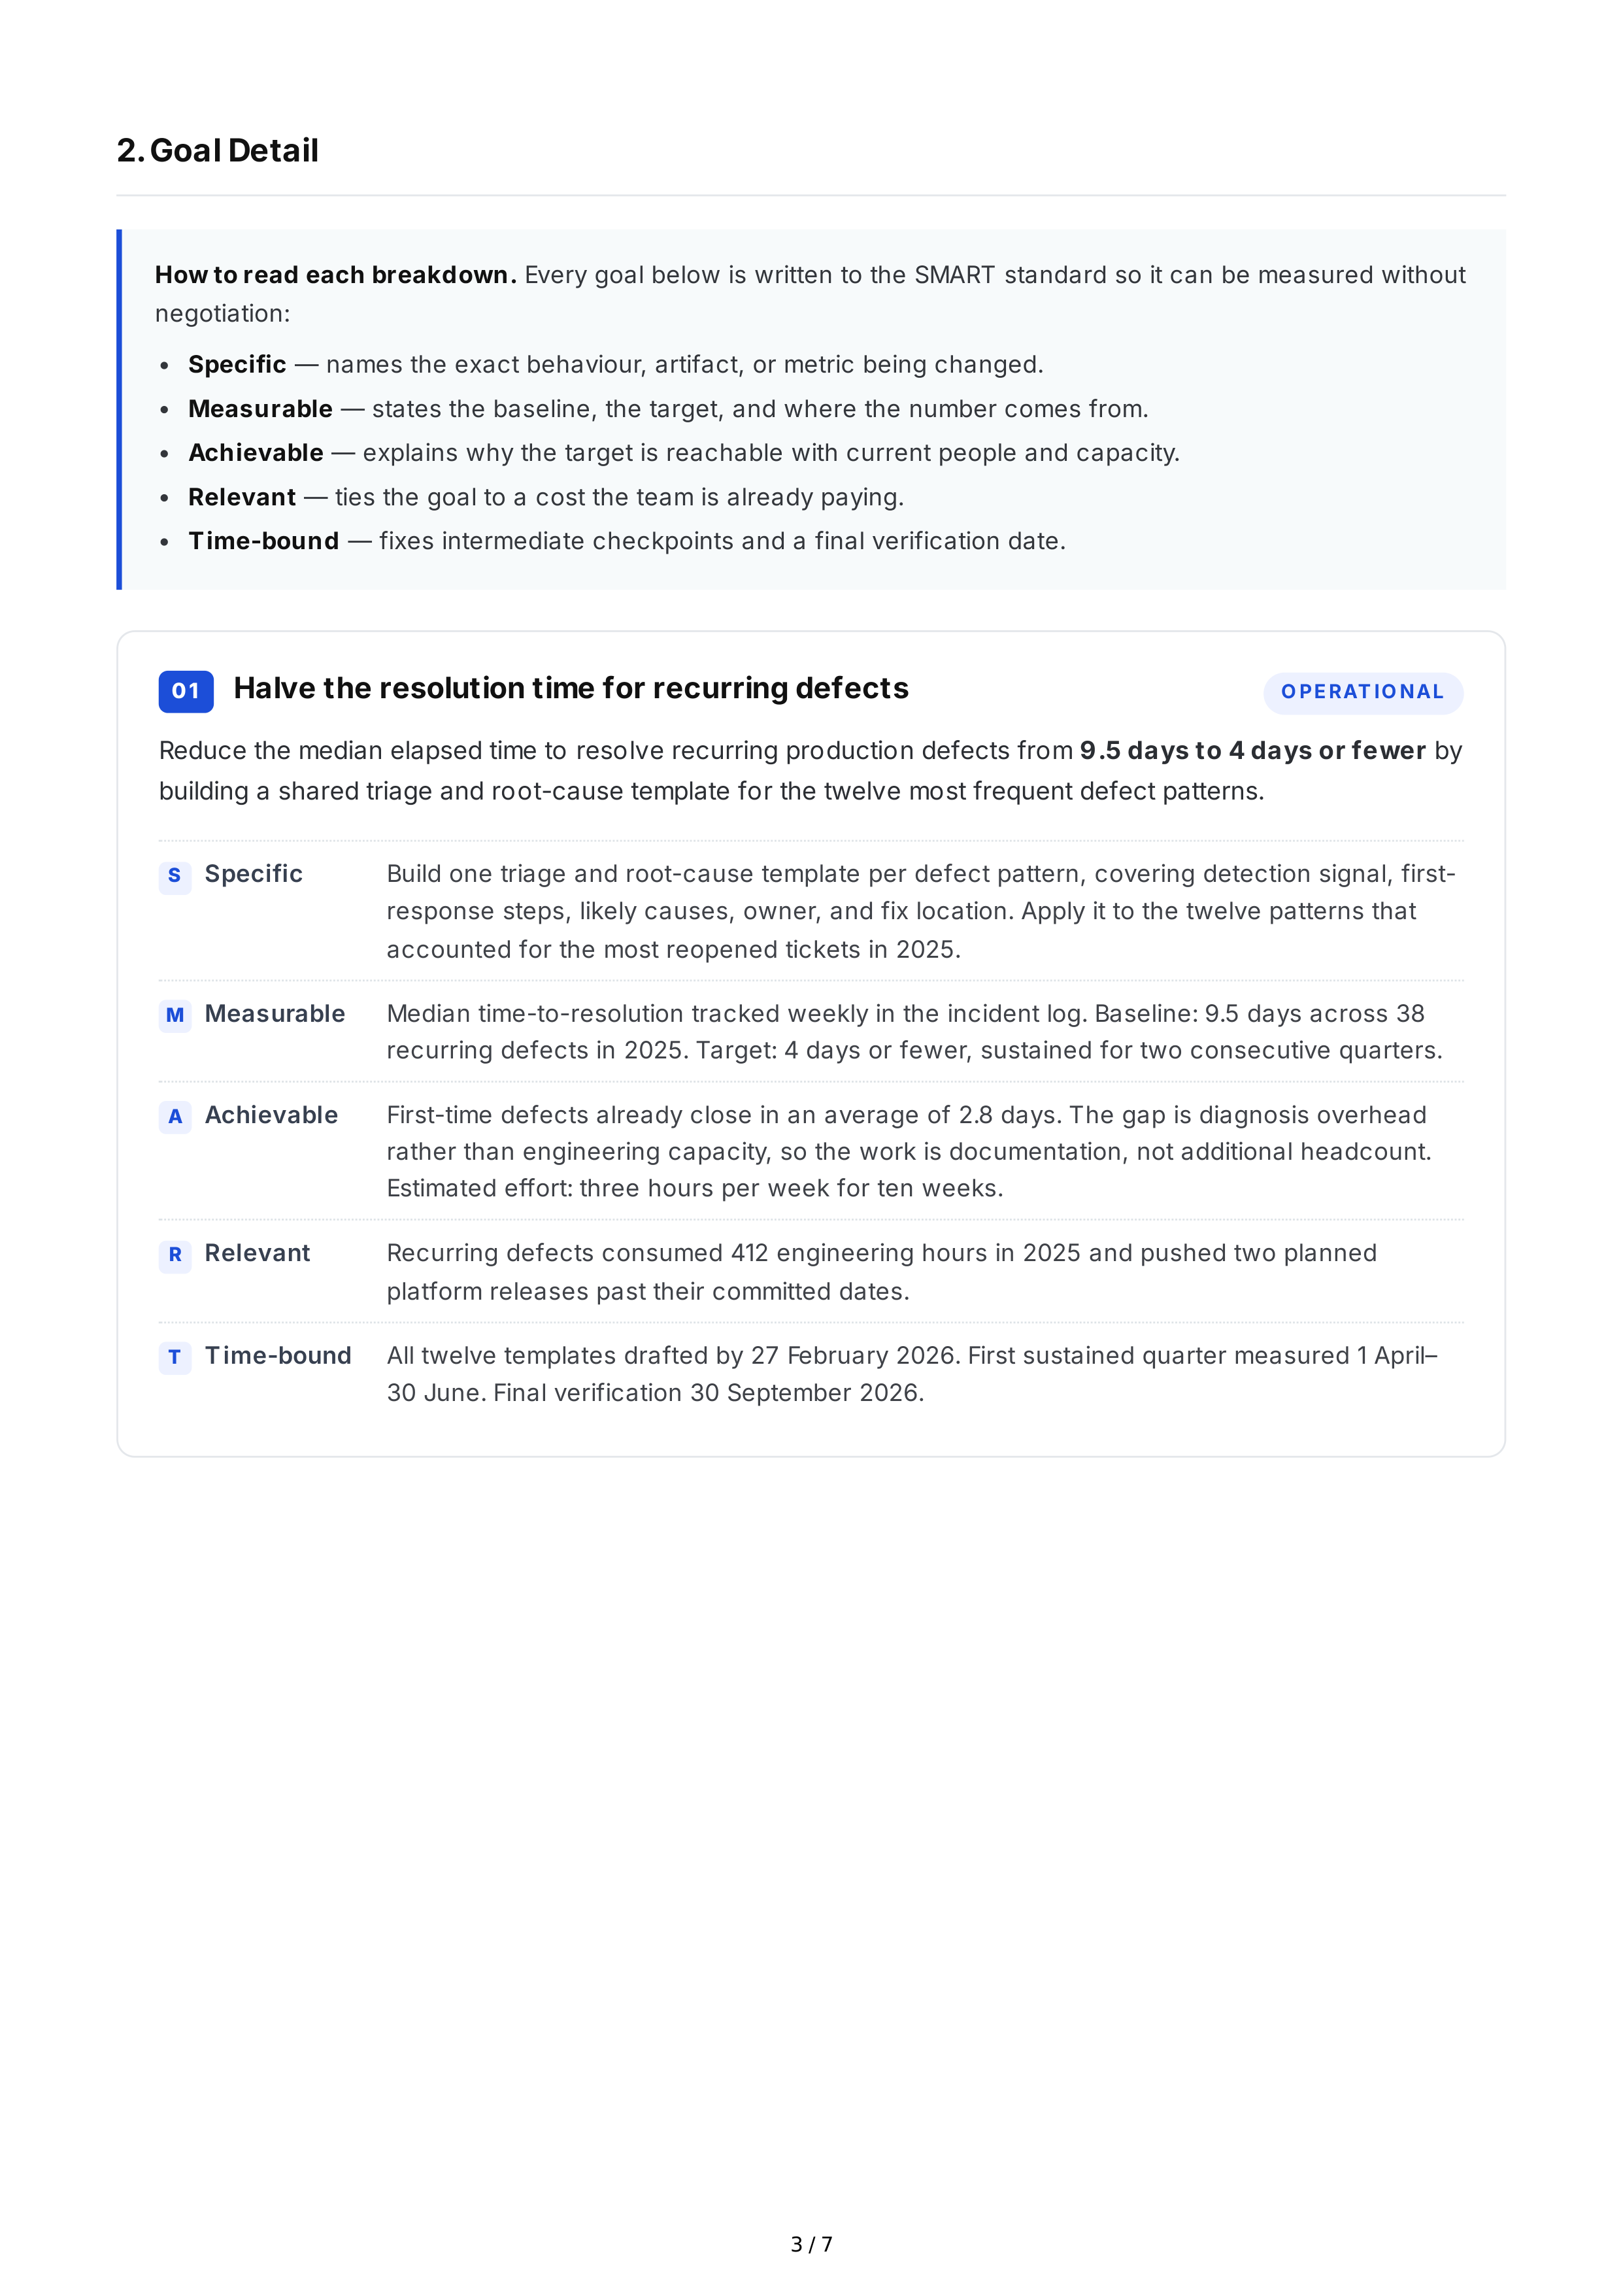
01
Halve
the
resolution
time
for
recurring
defects
O PERAT IO NAL
Reduce
the
median
elapsed
time
to
resolve
recurring
production
defects
from
9.5
days
to
4
days
or
fewer
by
building
a
shared
triage
and
root
-
cause
template
for
the
twelve
most
frequent
defect
patterns
.
S
Specific
Build
one
triage
and
root
-
cause
template
per
defect
pattern
,
covering
detection
signal
,
first
-
response
steps
,
likely
causes
,
owner
,
and
fix
location
.
Apply
it
to
the
twelve
patterns
that
accounted
for
the
most
reopened
tickets
in
2025.
M
Measurable
Median
time
-
to
-
resolution
tracked
weekly
in
the
incident
log
.
Baseline
: 9.5
days
across
38
recurring
defects
in
2025.
Target
: 4
days
or
fewer
,
sustained
for
two
consecutive
quarters
.
A
Achievable
First
-
time
defects
already
close
in
an
average
of
2.8
days
.
The
gap
is
diagnosis
overhead
rather
than
engineering
capacity
,
so
the
work
is
documentation
,
not
additional
headcount
.
Estimated
effort
:
three
hours
per
week
for
ten
weeks
.
R
Relevant
Recurring
defects
consumed
412
engineering
hours
in
2025
and
pushed
two
planned
platform
releases
past
their
committed
dates
.
T
Time
-
bound
All
twelve
templates
drafted
by
27
February
2026.
First
sustained
quarter
measured
1
April
–
30
June
.
Final
verification
30
September
2026.
3 / 7
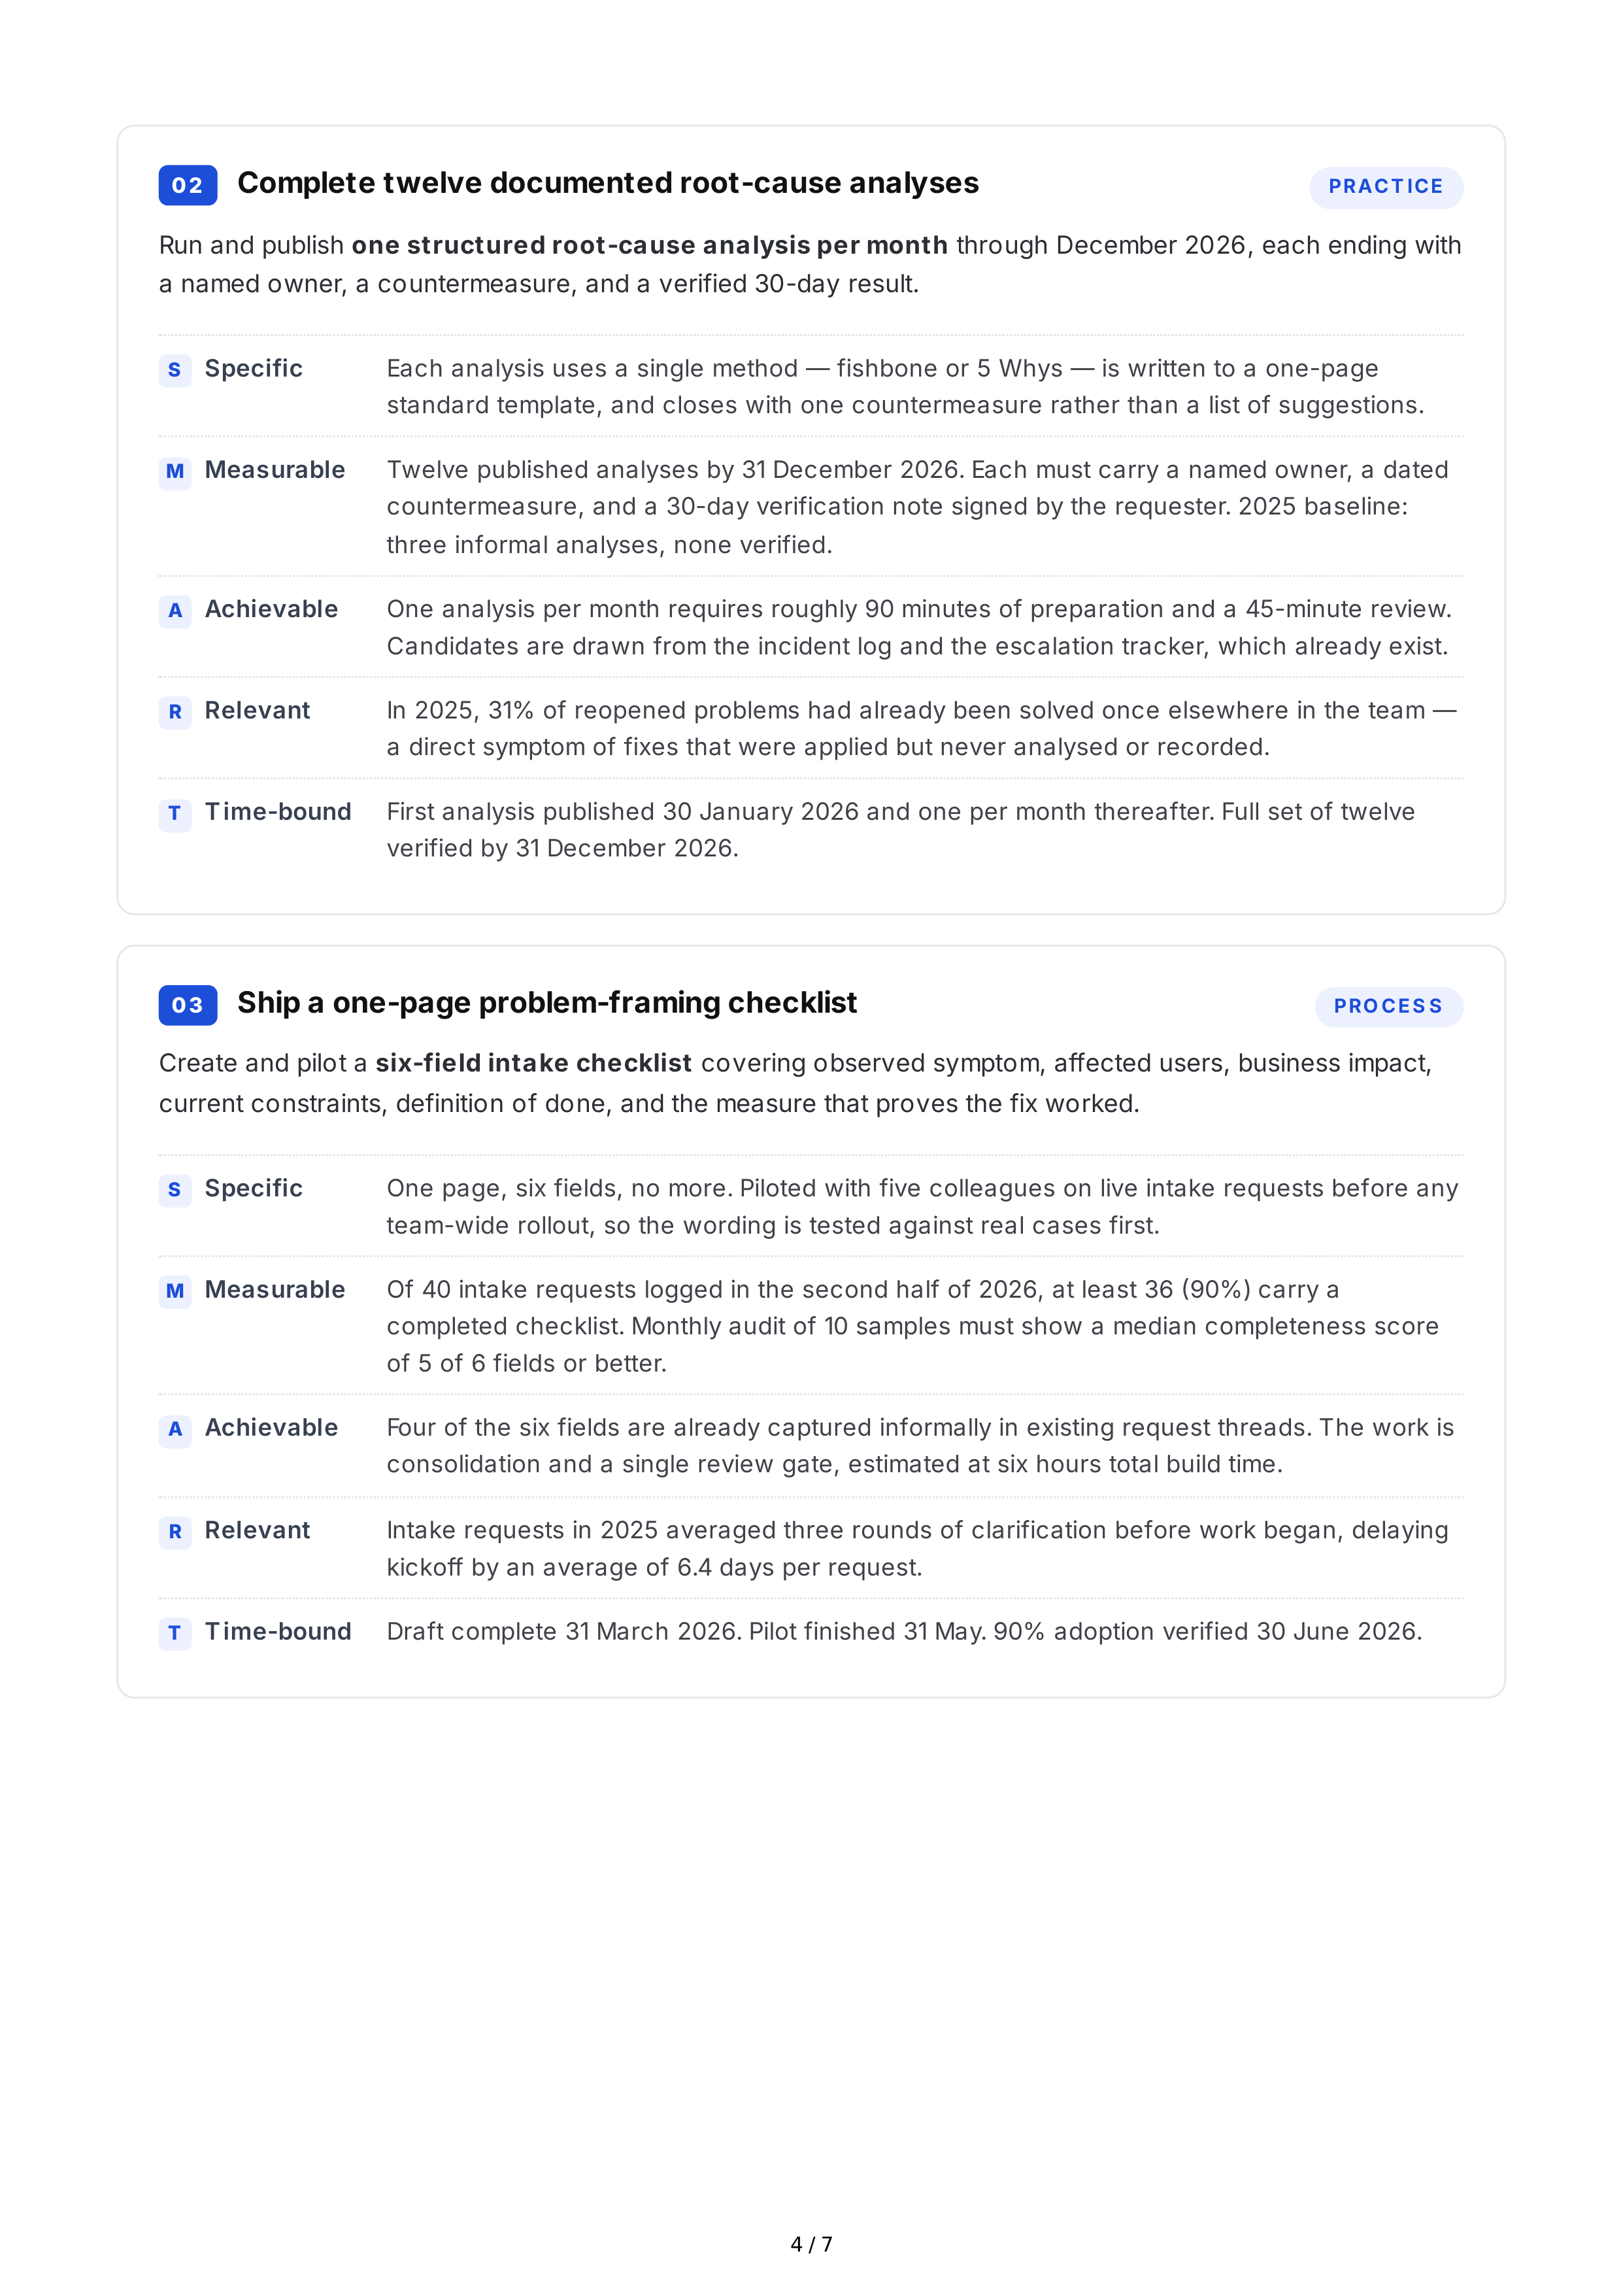
02
Complete
twelve
documented
root
-
cause
analyses
PRACT ICE
Run
and
publish
one
structured
root
-
cause
analysis
per
month
through
December
2026,
each
ending
with
a
named
owner
,
a
countermeasure
,
and
a
verified
30-
day
result
.
S
Specific
Each
analysis
uses
a
single
method
—
fishbone
or
5
Whys
—
is
written
to
a
one
-
page
standard
template
,
and
closes
with
one
countermeasure
rather
than
a
list
of
suggestions
.
M
Measurable
Twelve
published
analyses
by
31
December
2026.
Each
must
carry
a
named
owner
,
a
dated
countermeasure
,
and
a
30-
day
verification
note
signed
by
the
requester
. 2025
baseline
:
three
informal
analyses
,
none
verified
.
A
Achievable
One
analysis
per
month
requires
roughly
90
minutes
of
preparation
and
a
45-
minute
review
.
Candidates
are
drawn
from
the
incident
log
and
the
escalation
tracker
,
which
already
exist
.
R
Relevant
In
2025, 31%
of
reopened
problems
had
already
been
solved
once
elsewhere
in
the
team
—
a
direct
symptom
of
fixes
that
were
applied
but
never
analysed
or
recorded
.
T
Time
-
bound
First
analysis
published
30
January
2026
and
one
per
month
thereafter
.
Full
set
of
twelve
verified
by
31
December
2026.
03
Ship
a
one
-
page
problem
-
framing
checklist
PRO CES S
Create
and
pilot
a
six
-
field
intake
checklist
covering
observed
symptom
,
affected
users
,
business
impact
,
current
constraints
,
definition
of
done
,
and
the
measure
that
proves
the
fix
worked
.
S
Specific
One
page
,
six
fields
,
no
more
.
Piloted
with
five
colleagues
on
live
intake
requests
before
any
team
-
wide
rollout
,
so
the
wording
is
tested
against
real
cases
first
.
M
Measurable
Of
40
intake
requests
logged
in
the
second
half
of
2026,
at
least
36 (90%)
carry
a
completed
checklist
.
Monthly
audit
of
10
samples
must
show
a
median
completeness
score
of
5
of
6
fields
or
better
.
A
Achievable
Four
of
the
six
fields
are
already
captured
informally
in
existing
request
threads
.
The
work
is
consolidation
and
a
single
review
gate
,
estimated
at
six
hours
total
build
time
.
R
Relevant
Intake
requests
in
2025
averaged
three
rounds
of
clarification
before
work
began
,
delaying
kickoff
by
an
average
of
6.4
days
per
request
.
T
Time
-
bound
Draft
complete
31
March
2026.
Pilot
finished
31
May
. 90%
adoption
verified
30
June
2026.
4 / 7
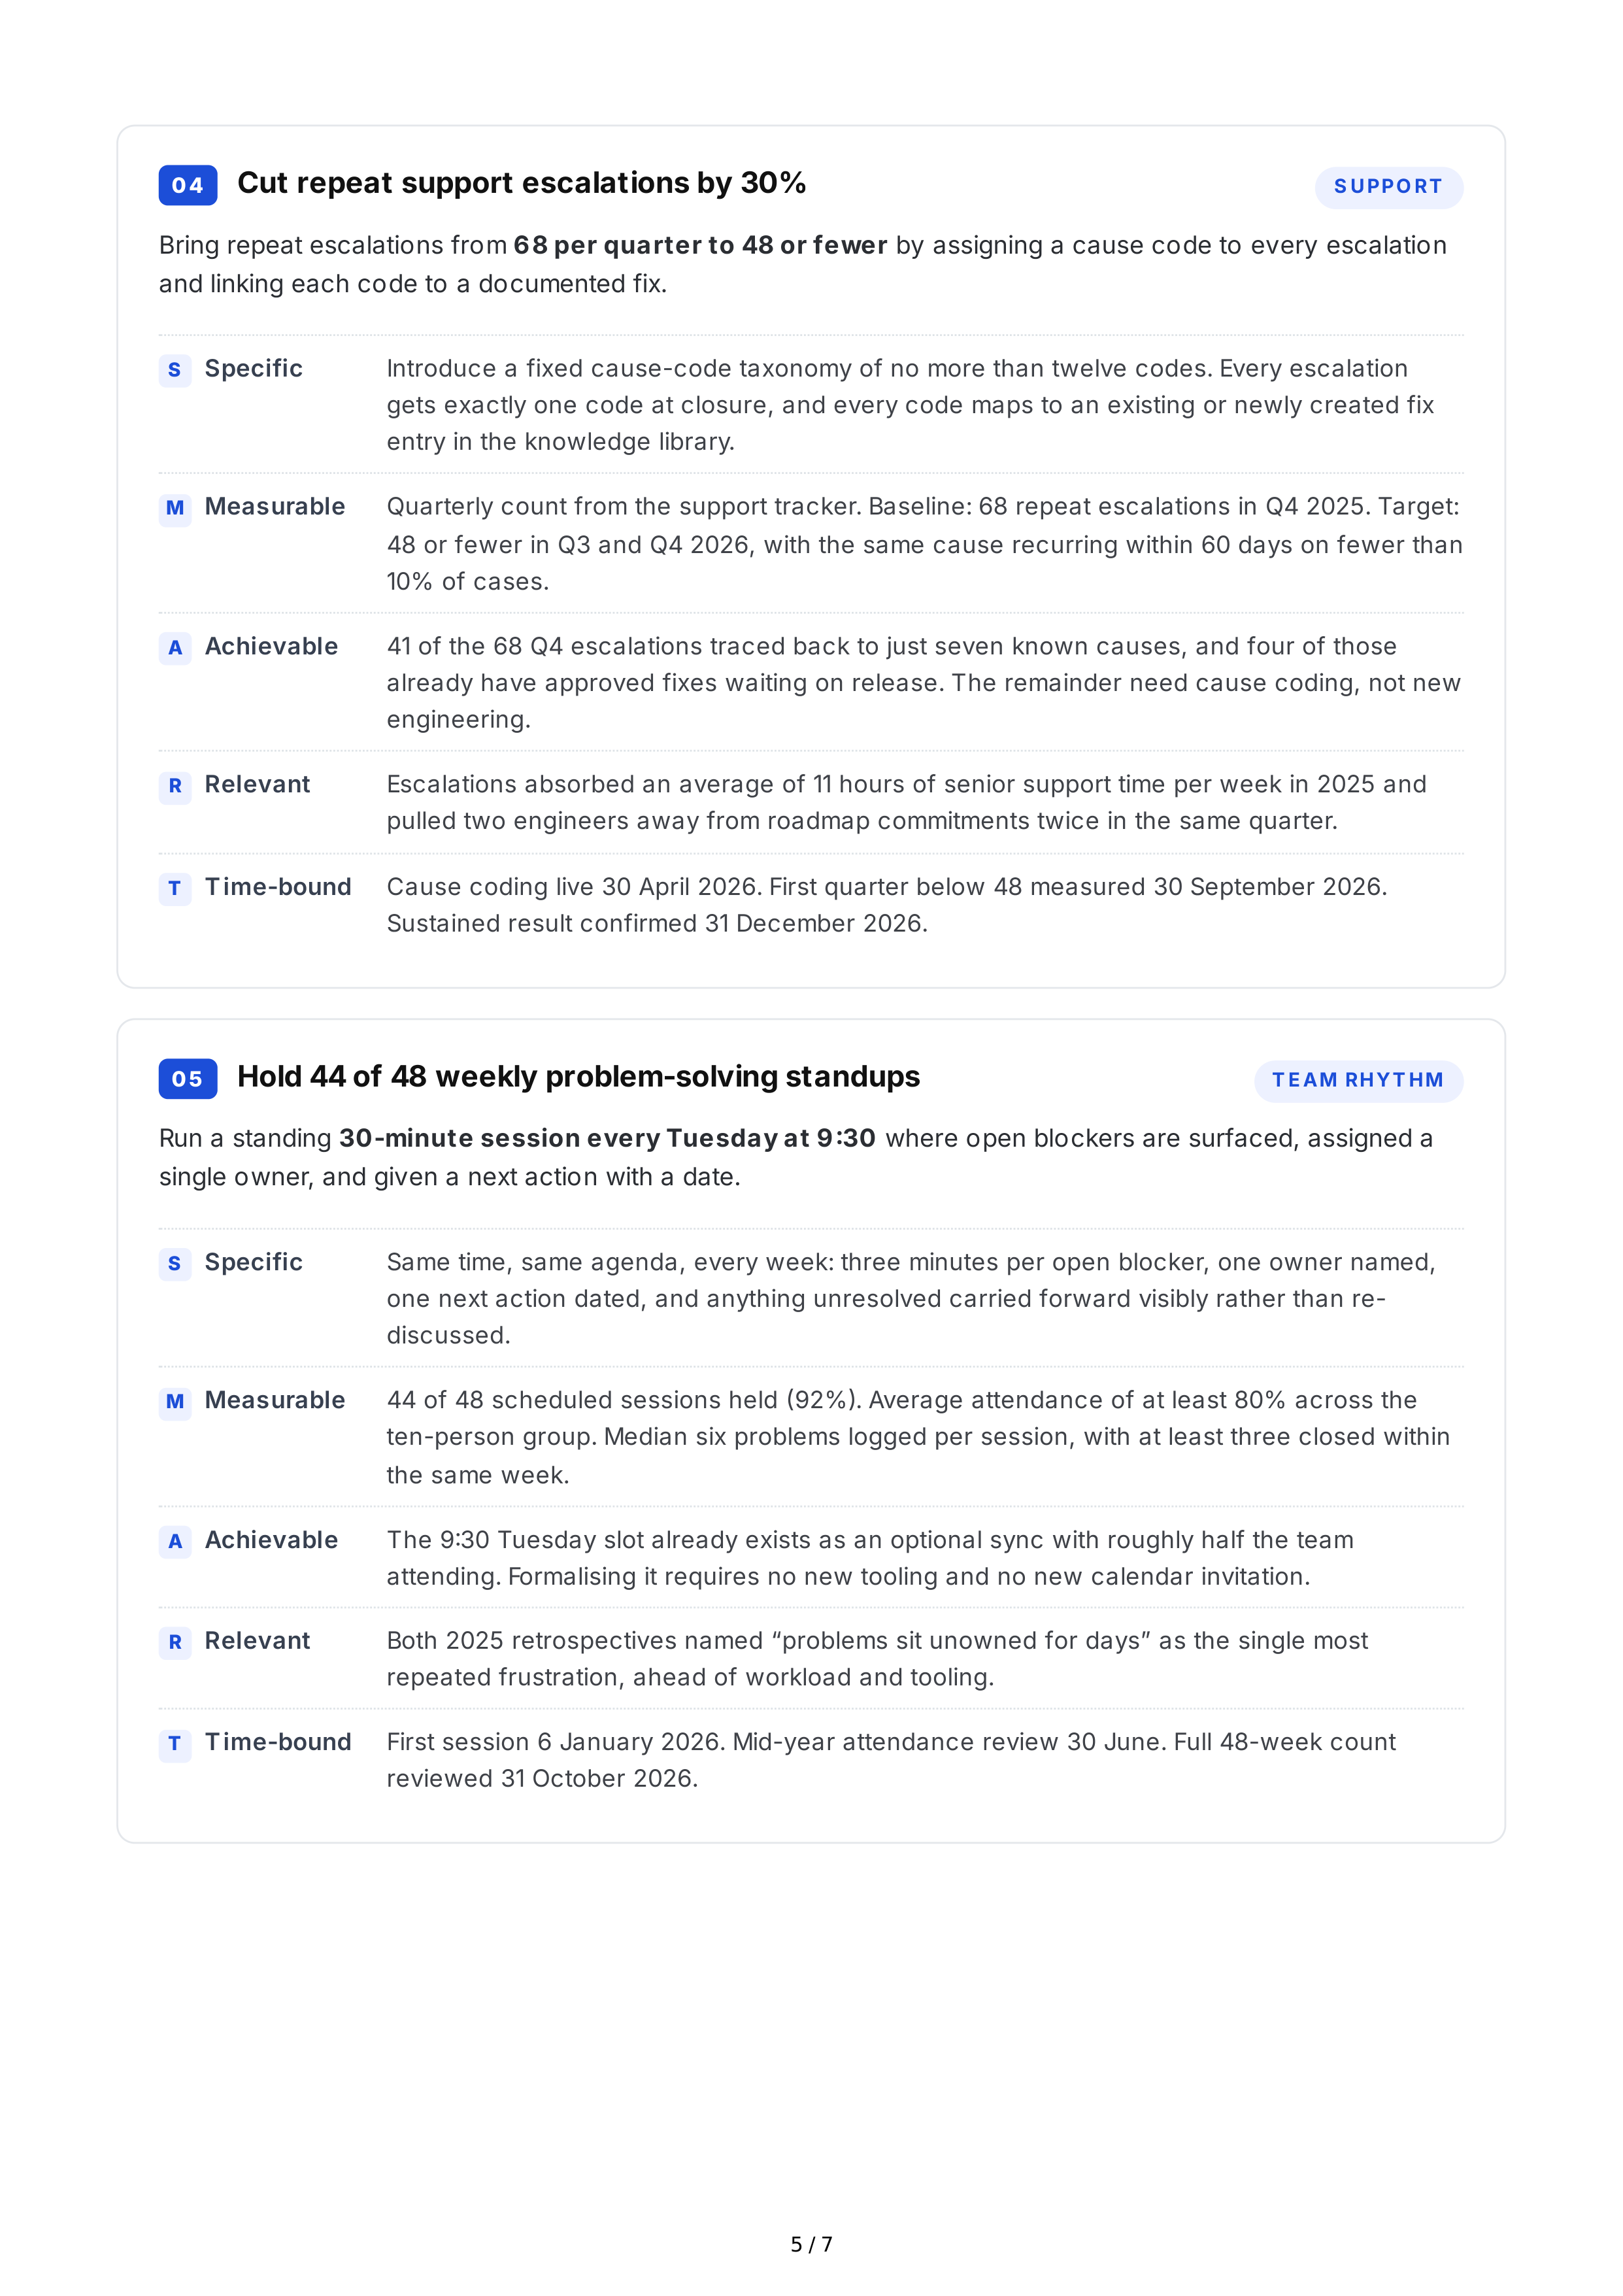
04
Cut
repeat
support
escalations
by
30%
S UPPO RT
Bring
repeat
escalations
from
68
per
quarter
to
48
or
fewer
by
assigning
a
cause
code
to
every
escalation
and
linking
each
code
to
a
documented
fix
.
S
Specific
Introduce
a
fixed
cause
-
code
taxonomy
of
no
more
than
twelve
codes
.
Every
escalation
gets
exactly
one
code
at
closure
,
and
every
code
maps
to
an
existing
or
newly
created
fix
entry
in
the
knowledge
library
.
M
Measurable
Quarterly
count
from
the
support
tracker
.
Baseline
: 68
repeat
escalations
in
Q
4 2025.
Target
:
48
or
fewer
in
Q
3
and
Q
4 2026,
with
the
same
cause
recurring
within
60
days
on
fewer
than
10%
of
cases
.
A
Achievable
41
of
the
68
Q
4
escalations
traced
back
to
just
seven
known
causes
,
and
four
of
those
already
have
approved
fixes
waiting
on
release
.
The
remainder
need
cause
coding
,
not
new
engineering
.
R
Relevant
Escalations
absorbed
an
average
of
11
hours
of
senior
support
time
per
week
in
2025
and
pulled
two
engineers
away
from
roadmap
commitments
twice
in
the
same
quarter
.
T
Time
-
bound
Cause
coding
live
30
April
2026.
First
quarter
below
48
measured
30
September
2026.
Sustained
result
confirmed
31
December
2026.
05
Hold
44
of
48
weekly
problem
-
solving
standups
T EAM
RHYT HM
Run
a
standing
30-
minute
session
every
Tuesday
at
9:30
where
open
blockers
are
surfaced
,
assigned
a
single
owner
,
and
given
a
next
action
with
a
date
.
S
Specific
Same
time
,
same
agenda
,
every
week
:
three
minutes
per
open
blocker
,
one
owner
named
,
one
next
action
dated
,
and
anything
unresolved
carried
forward
visibly
rather
than
re
-
discussed
.
M
Measurable
44
of
48
scheduled
sessions
held
(92%).
Average
attendance
of
at
least
80%
across
the
ten
-
person
group
.
Median
six
problems
logged
per
session
,
with
at
least
three
closed
within
the
same
week
.
A
Achievable
The
9:30
Tuesday
slot
already
exists
as
an
optional
sync
with
roughly
half
the
team
attending
.
Formalising
it
requires
no
new
tooling
and
no
new
calendar
invitation
.
R
Relevant
Both
2025
retrospectives
named
“
problems
sit
unowned
for
days
”
as
the
single
most
repeated
frustration
,
ahead
of
workload
and
tooling
.
T
Time
-
bound
First
session
6
January
2026.
Mid
-
year
attendance
review
30
June
.
Full
48-
week
count
reviewed
31
October
2026.
5 / 7
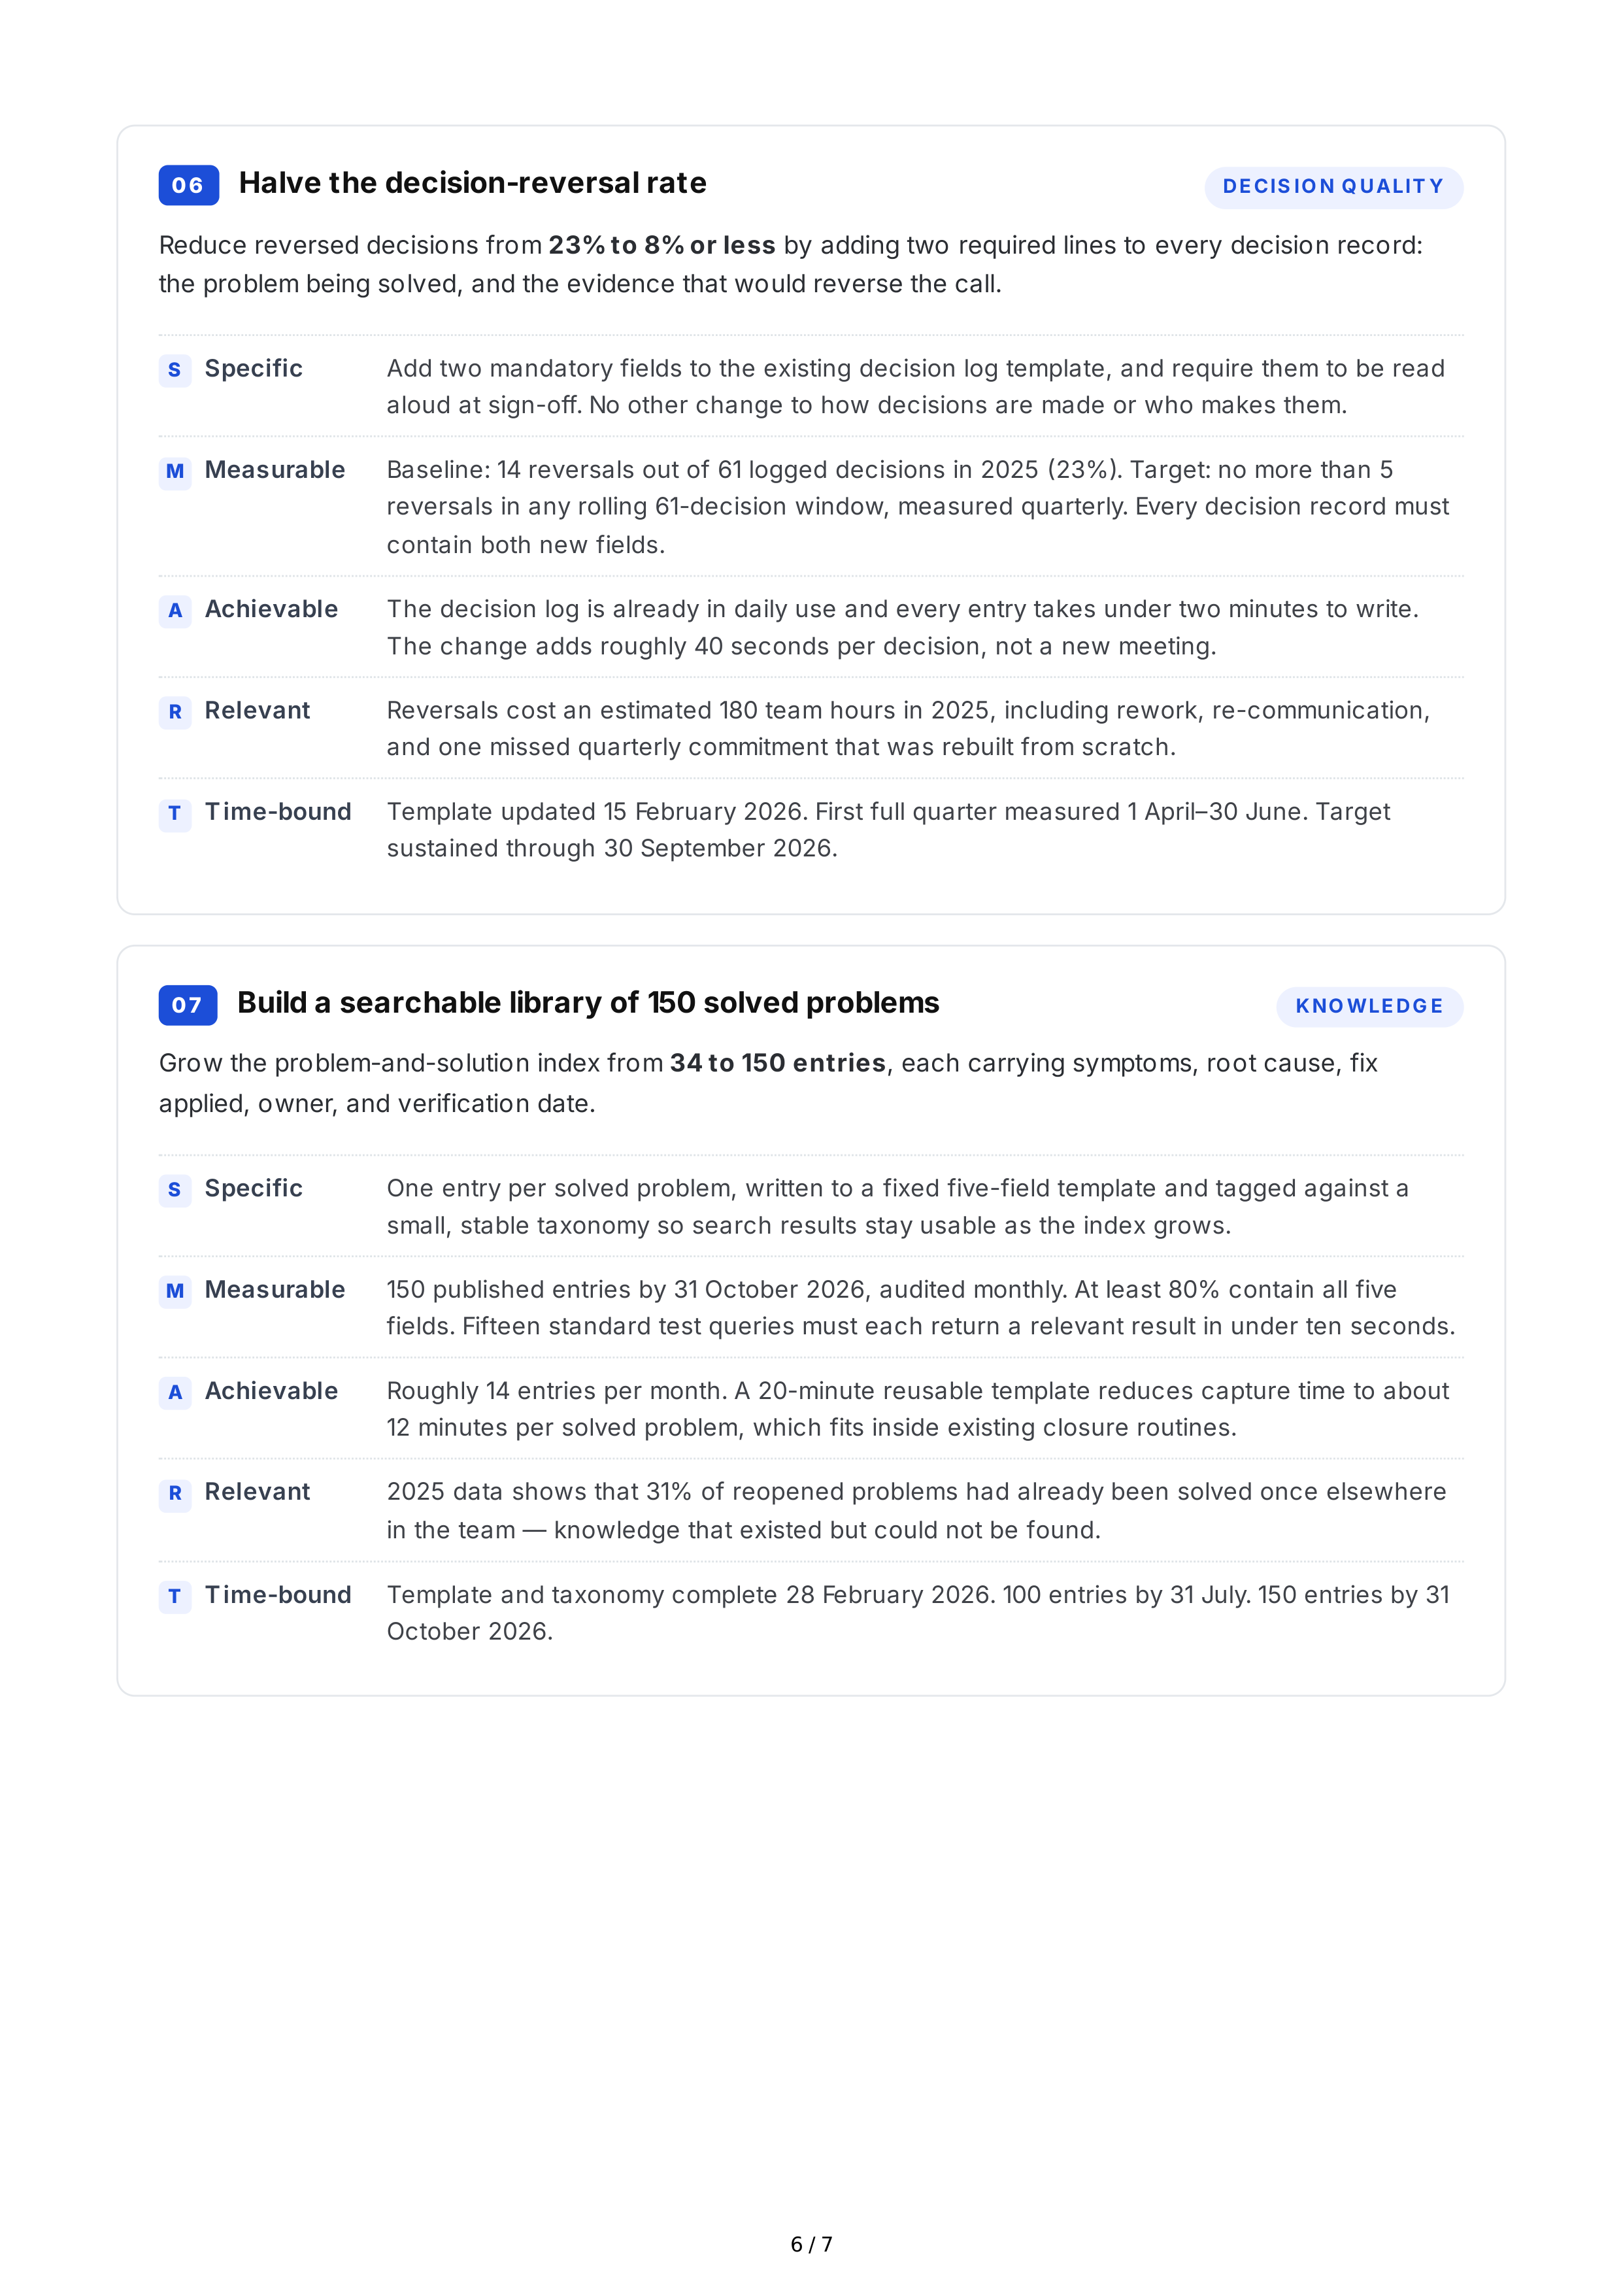
06
Halve
the
decision
-
reversal
rate
DECIS IO N
Q UALIT Y
Reduce
reversed
decisions
from
23%
to
8%
or
less
by
adding
two
required
lines
to
every
decision
record
:
the
problem
being
solved
,
and
the
evidence
that
would
reverse
the
call
.
S
Specific
Add
two
mandatory
fields
to
the
existing
decision
log
template
,
and
require
them
to
be
read
aloud
at
sign
-
off
.
No
other
change
to
how
decisions
are
made
or
who
makes
them
.
M
Measurable
Baseline
: 14
reversals
out
of
61
logged
decisions
in
2025 (23%).
Target
:
no
more
than
5
reversals
in
any
rolling
61-
decision
window
,
measured
quarterly
.
Every
decision
record
must
contain
both
new
fields
.
A
Achievable
The
decision
log
is
already
in
daily
use
and
every
entry
takes
under
two
minutes
to
write
.
The
change
adds
roughly
40
seconds
per
decision
,
not
a
new
meeting
.
R
Relevant
Reversals
cost
an
estimated
180
team
hours
in
2025,
including
rework
,
re
-
communication
,
and
one
missed
quarterly
commitment
that
was
rebuilt
from
scratch
.
T
Time
-
bound
Template
updated
15
February
2026.
First
full
quarter
measured
1
April
–30
June
.
Target
sustained
through
30
September
2026.
07
Build
a
searchable
library
of
150
solved
problems
KNO WLEDG E
Grow
the
problem
-
and
-
solution
index
from
34
to
150
entries
,
each
carrying
symptoms
,
root
cause
,
fix
applied
,
owner
,
and
verification
date
.
S
Specific
One
entry
per
solved
problem
,
written
to
a
fixed
five
-
field
template
and
tagged
against
a
small
,
stable
taxonomy
so
search
results
stay
usable
as
the
index
grows
.
M
Measurable
150
published
entries
by
31
October
2026,
audited
monthly
.
At
least
80%
contain
all
five
fields
.
Fifteen
standard
test
queries
must
each
return
a
relevant
result
in
under
ten
seconds
.
A
Achievable
Roughly
14
entries
per
month
.
A
20-
minute
reusable
template
reduces
capture
time
to
about
12
minutes
per
solved
problem
,
which
fits
inside
existing
closure
routines
.
R
Relevant
2025
data
shows
that
31%
of
reopened
problems
had
already
been
solved
once
elsewhere
in
the
team
—
knowledge
that
existed
but
could
not
be
found
.
T
Time
-
bound
Template
and
taxonomy
complete
28
February
2026. 100
entries
by
31
July
. 150
entries
by
31
October
2026.
6 / 7
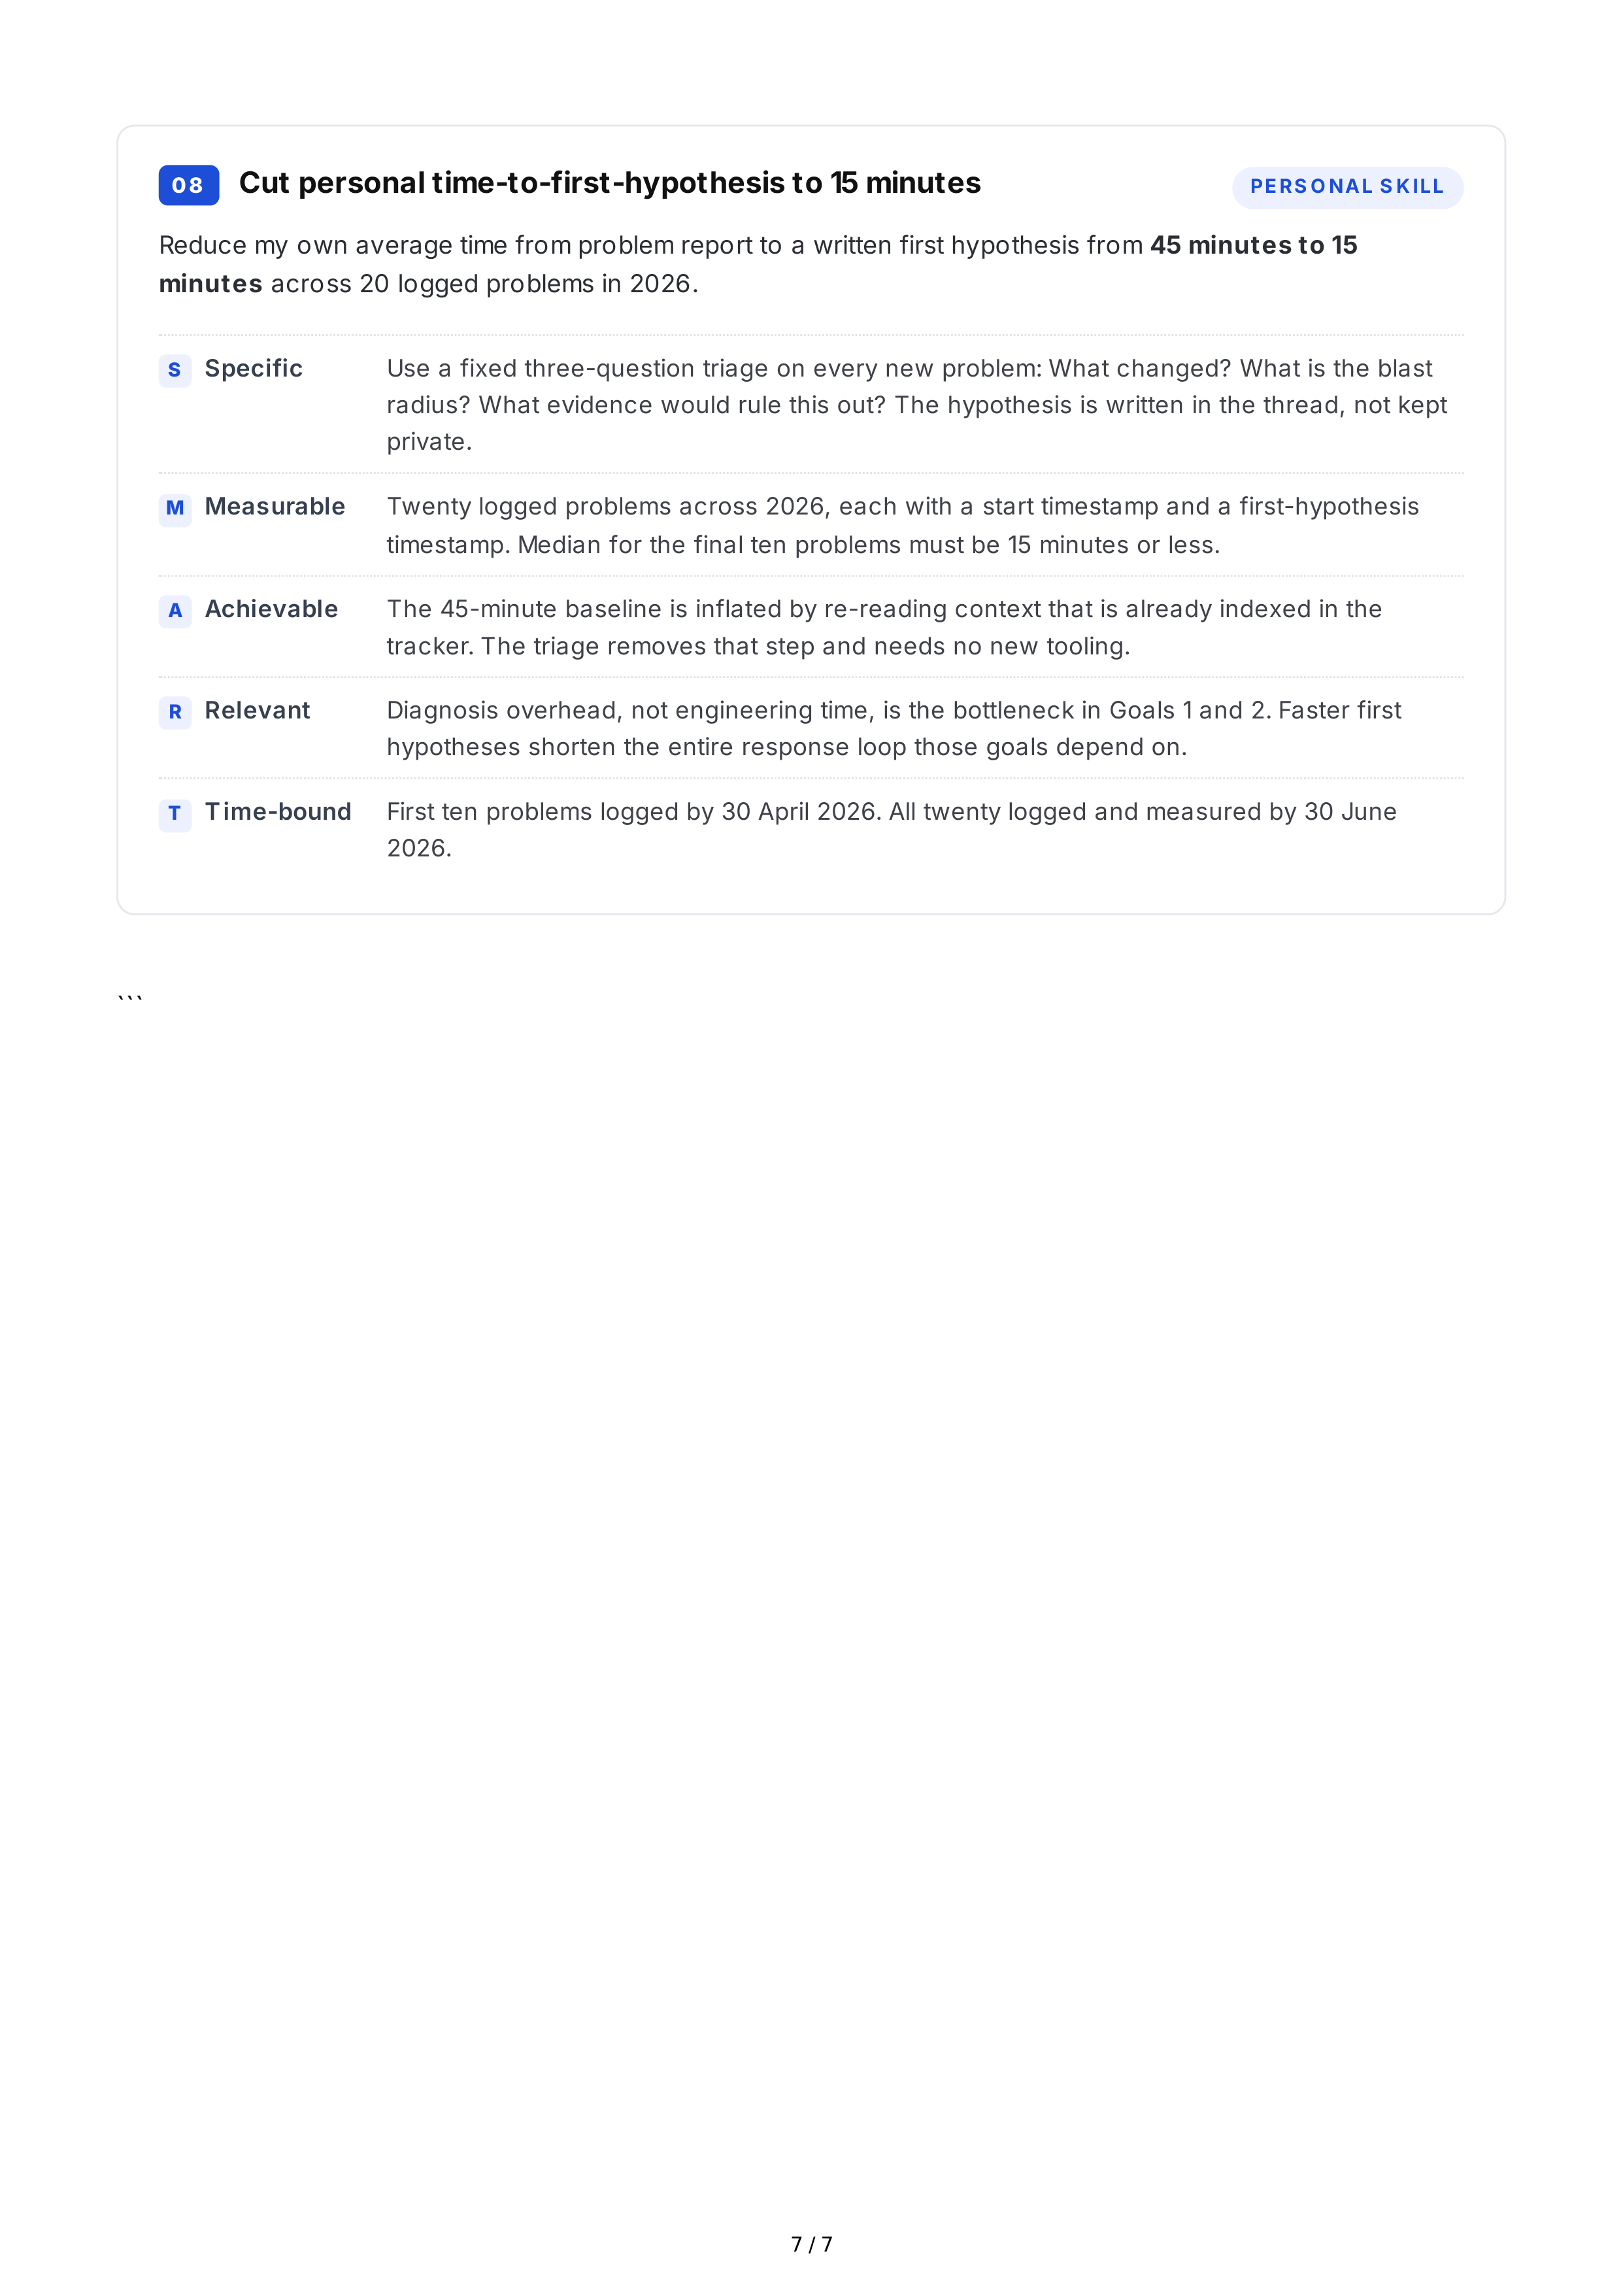
08
Cut
personal
time
-
to
-
first
-
hypothesis
to
15
minutes
PERS O NAL
S KILL
Reduce
my
own
average
time
from
problem
report
to
a
written
first
hypothesis
from
45
minutes
to
15
minutes
across
20
logged
problems
in
2026.
S
Specific
Use
a
fixed
three
-
question
triage
on
every
new
problem
:
What
changed
?
What
is
the
blast
radius
?
What
evidence
would
rule
this
out
?
The
hypothesis
is
written
in
the
thread
,
not
kept
private
.
M
Measurable
Twenty
logged
problems
across
2026,
each
with
a
start
timestamp
and
a
first
-
hypothesis
timestamp
.
Median
for
the
final
ten
problems
must
be
15
minutes
or
less
.
A
Achievable
The
45-
minute
baseline
is
inflated
by
re
-
reading
context
that
is
already
indexed
in
the
tracker
.
The
triage
removes
that
step
and
needs
no
new
tooling
.
R
Relevant
Diagnosis
overhead
,
not
engineering
time
,
is
the
bottleneck
in
Goals
1
and
2.
Faster
first
hypotheses
shorten
the
entire
response
loop
those
goals
depend
on
.
T
Time
-
bound
First
ten
problems
logged
by
30
April
2026.
All
twenty
logged
and
measured
by
30
June
2026.
```
7 / 7