SMART
Project
Management
Goals
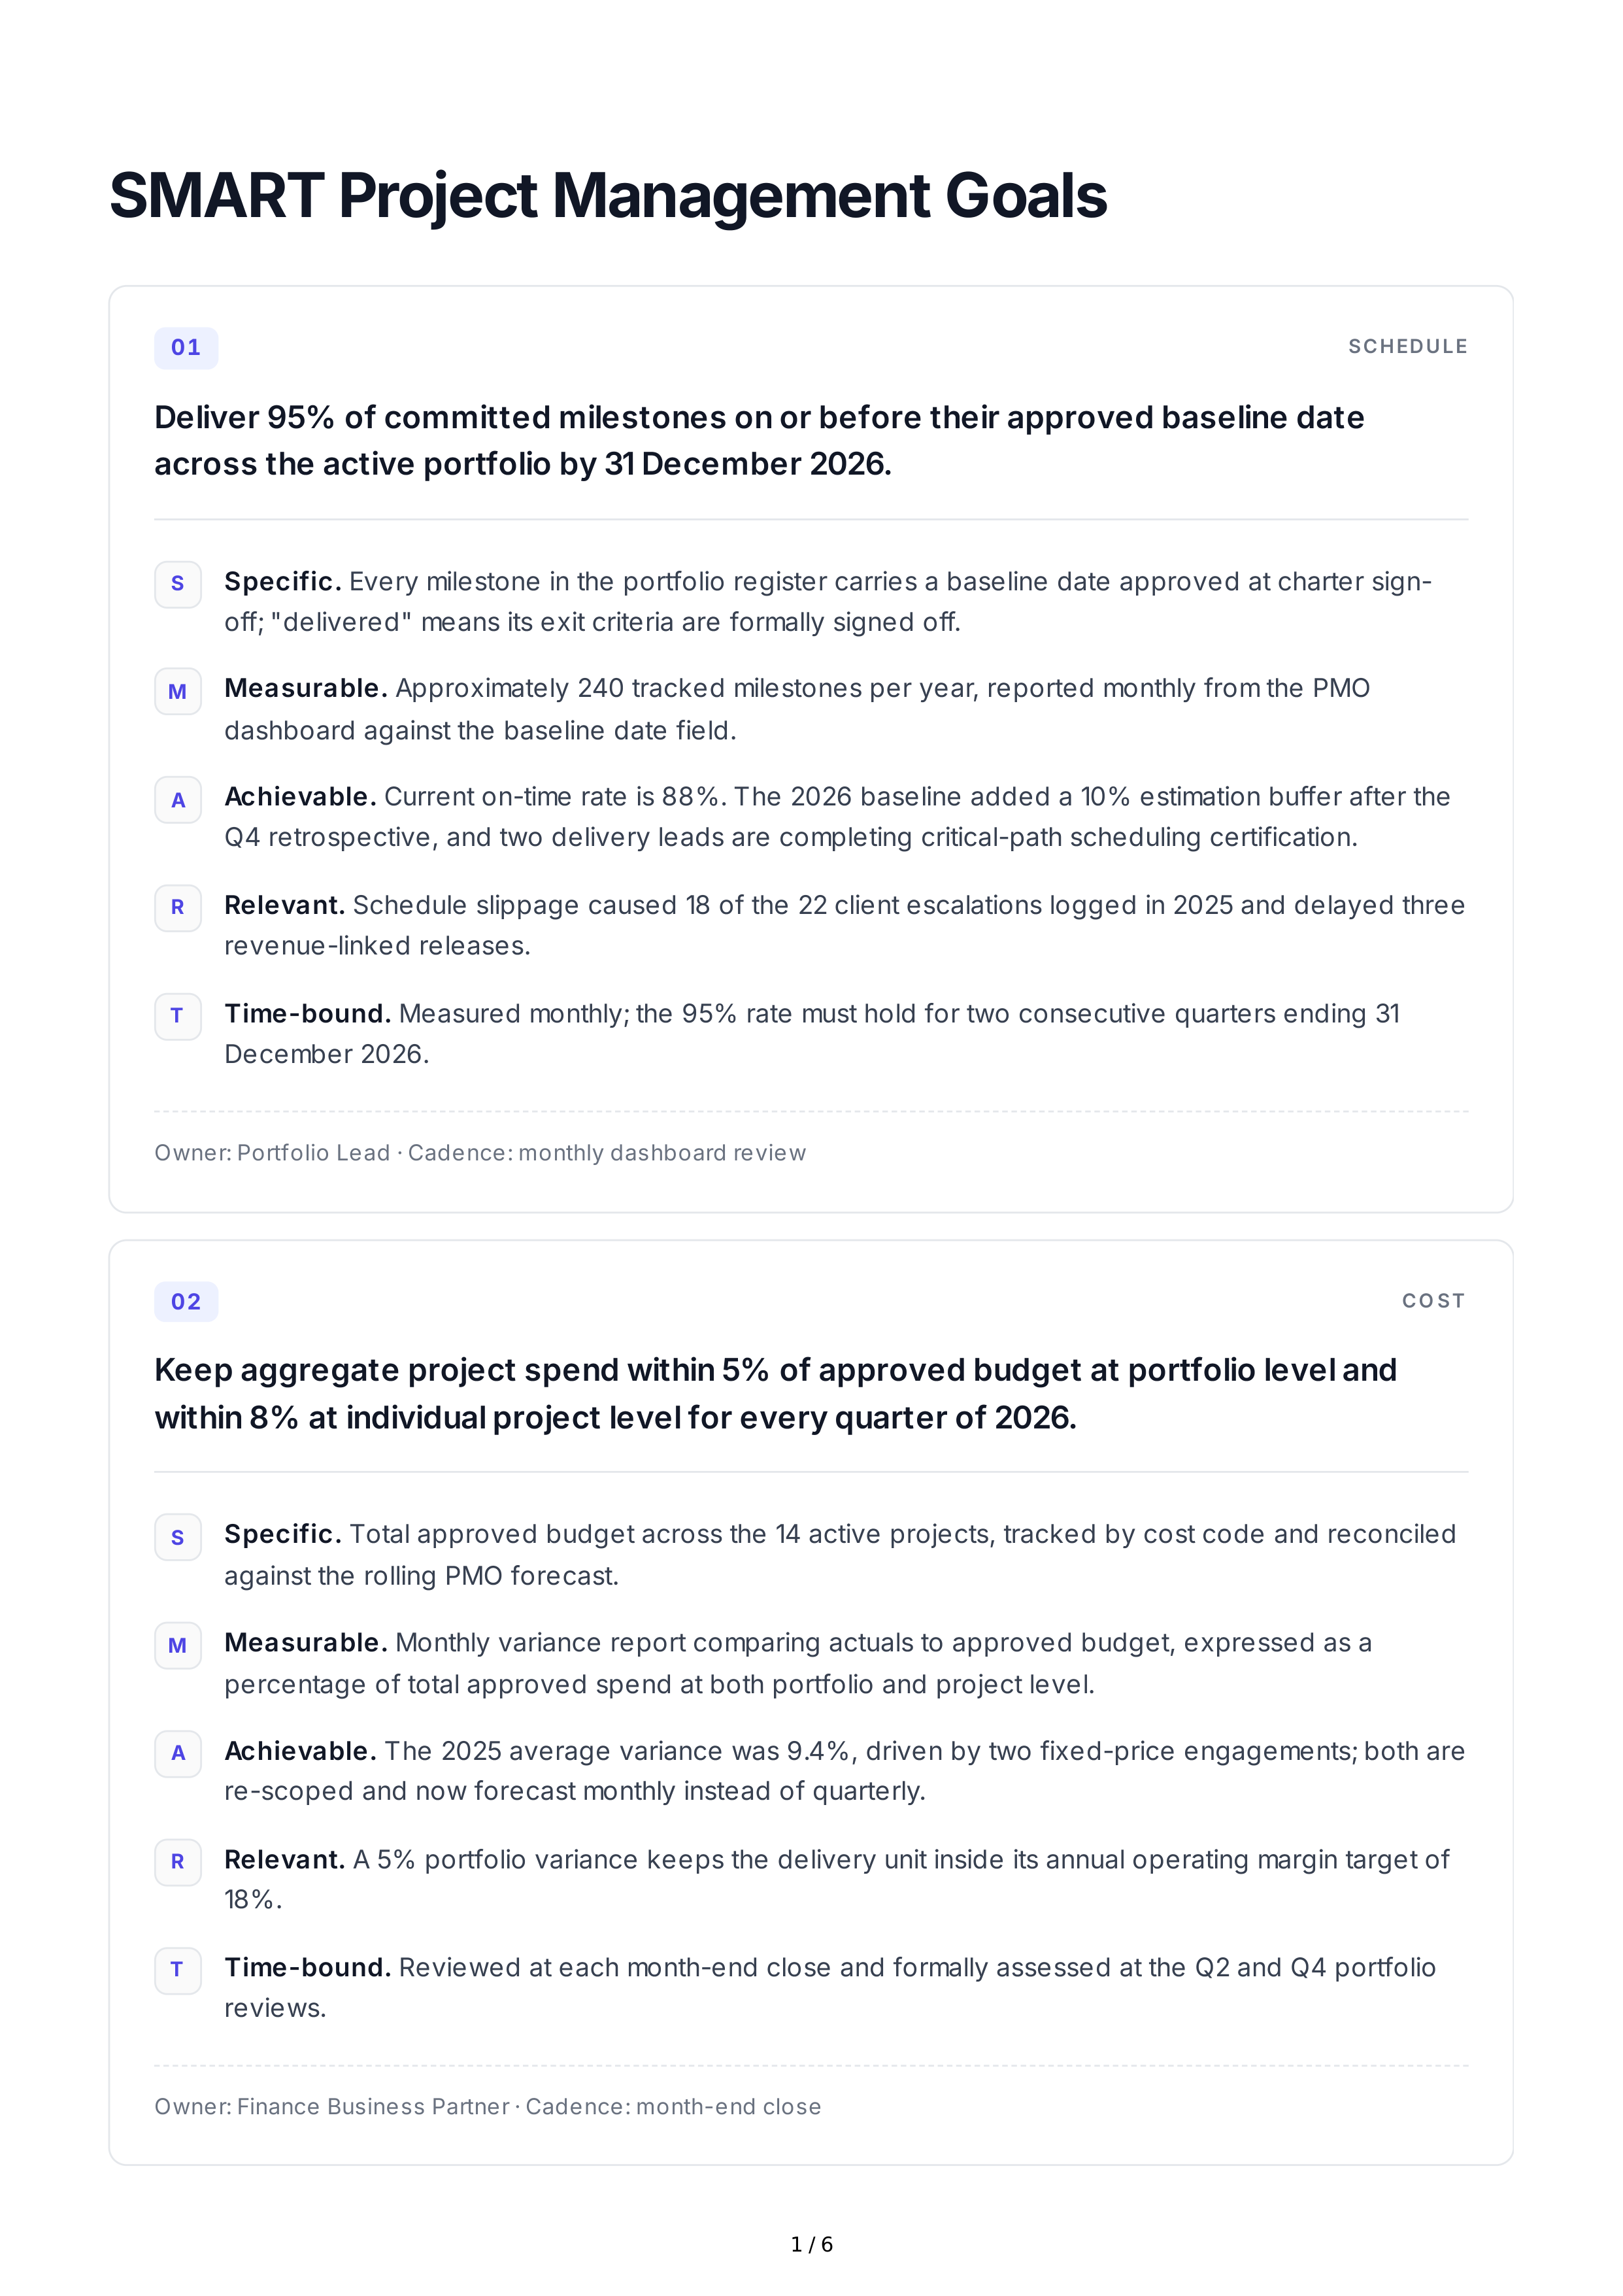
01
SCHEDULE
Deliver
95%
of
committed
milestones
on
or
before
their
approved
baseline
date
across
the
active
portfolio
by
31
December
2026.
S
Specific
.
Every
milestone
in
the
portfolio
register
carries
a
baseline
date
approved
at
charter
sign
-
off
; "
delivered
"
means
its
exit
criteria
are
formally
signed
off
.
M
Measurable
.
Approximately
240
tracked
milestones
per
year
,
reported
monthly
from
the
PMO
dashboard
against
the
baseline
date
field
.
A
Achievable
.
Current
on
-
time
rate
is
88%.
The
2026
baseline
added
a
10%
estimation
buffer
after
the
Q
4
retrospective
,
and
two
delivery
leads
are
completing
critical
-
path
scheduling
certification
.
R
Relevant
.
Schedule
slippage
caused
18
of
the
22
client
escalations
logged
in
2025
and
delayed
three
revenue
-
linked
releases
.
T
Time
-
bound
.
Measured
monthly
;
the
95%
rate
must
hold
for
two
consecutive
quarters
ending
31
December
2026.
Owner
:
Portfolio
Lead
·
Cadence
:
monthly
dashboard
review
02
CO ST
Keep
aggregate
project
spend
within
5%
of
approved
budget
at
portfolio
level
and
within
8%
at
individual
project
level
for
every
quarter
of
2026.
S
Specific
.
Total
approved
budget
across
the
14
active
projects
,
tracked
by
cost
code
and
reconciled
against
the
rolling
PMO
forecast
.
M
Measurable
.
Monthly
variance
report
comparing
actuals
to
approved
budget
,
expressed
as
a
percentage
of
total
approved
spend
at
both
portfolio
and
project
level
.
A
Achievable
.
The
2025
average
variance
was
9.4%,
driven
by
two
fixed
-
price
engagements
;
both
are
re
-
scoped
and
now
forecast
monthly
instead
of
quarterly
.
R
Relevant
.
A
5%
portfolio
variance
keeps
the
delivery
unit
inside
its
annual
operating
margin
target
of
18%.
T
Time
-
bound
.
Reviewed
at
each
month
-
end
close
and
formally
assessed
at
the
Q
2
and
Q
4
portfolio
reviews
.
Owner
:
Finance
Business
Partner
·
Cadence
:
month
-
end
close
1 / 6
03
SCO PE
Hold
unapproved
scope
growth
to
no
more
than
5%
of
baseline
effort
hours
per
project
,
per
quarter
,
throughout
2026.
S
Specific
.
"
Unapproved
scope
"
is
any
deliverable
or
requirement
not
traceable
to
a
signed
change
request
.
Effort
is
measured
in
baseline
hours
from
the
work
breakdown
structure
.
M
Measurable
.
Monthly
traceability
audit
comparing
delivered
items
to
the
requirements
baseline
;
variance
reported
in
hours
and
as
a
percentage
of
baseline
.
A
Achievable
.
Last
year
'
s
audit
found
11%
unapproved
growth
on
an
average
project
.
A
standard
intake
form
and
a
standing
change
board
were
introduced
in
January
.
R
Relevant
.
Uncontrolled
scope
was
the
second
-
largest
cause
of
budget
overruns
and
a
direct
driver
of
team
overtime
.
T
Time
-
bound
.
Quarterly
audits
beginning
Q
1 2026;
the
threshold
must
hold
for
four
consecutive
quarters
.
Owner
:
Business
Analyst
Lead
·
Cadence
:
quarterly
traceability
audit
04
Q UALIT Y
Reduce
rework
hours
caused
by
defects
escaping
to
UAT
or
production
to
under
6%
of
total
delivery
hours
by
30
September
2026.
S
Specific
.
Rework
is
defined
as
hours
booked
to
tasks
correcting
a
defect
found
after
internal
QA
sign
-
off
—
nothing
else
is
counted
in
the
metric
.
M
Measurable
.
Time
-
tracking
category
"
Rework
—
Escaped
Defect
"
as
a
share
of
total
delivery
hours
,
reported
monthly
per
project
and
rolled
up
to
the
portfolio
.
A
Achievable
.
The
current
figure
is
9.8%.
The
automated
regression
suite
introduced
in
March
covers
the
40
highest
-
risk
user
flows
and
removes
roughly
a
third
of
the
likely
rework
pool
.
R
Relevant
.
Every
rework
hour
is
a
non
-
billable
hour
;
the
3.8-
point
reduction
recovers
an
estimated
1,900
hours
a
year
.
T
Time
-
bound
.
Baseline
set
in
January
,
tracked
monthly
,
target
reached
by
30
September
2026.
Owner
:
QA
Manager
·
Cadence
:
monthly
metrics
pack
2 / 6
05
RISK
Log
100%
of
high
-
severity
risks
before
they
affect
a
milestone
,
with
an
approved
mitigation
plan
in
place
within
five
business
days
of
identification
.
S
Specific
.
"
High
-
severity
"
means
a
risk
scored
12
or
above
on
the
standard
5×5
probability
-
impact
matrix
,
with
a
named
risk
owner
assigned
.
M
Measurable
.
Risk
register
audit
capturing
date
identified
,
date
mitigation
approved
,
and
whether
any
milestone
subsequently
slipped
.
A
Achievable
.
The
register
moved
to
a
shared
tool
with
a
fixed
weekly
review
slot
in
January
,
and
risk
owners
are
now
named
at
project
kickoff
rather
than
assigned
retroactively
.
R
Relevant
.
The
three
unmanaged
risks
of
2025
accounted
for
62
days
of
combined
schedule
impact
.
T
Time
-
bound
.
Audited
at
every
monthly
portfolio
review
,
with
a
hard
requirement
of
zero
unmitigated
high
-
severity
risks
at
each
stage
gate
.
Owner
:
Risk
&
Assurance
Lead
·
Cadence
:
weekly
register
review
06
CO MMUNICAT IO N
Issue
a
written
status
report
to
every
project
sponsor
and
steering
group
by
12:00
local
time
each
Monday
,
achieving
100%
on
-
time
delivery
for
the
year
.
S
Specific
.
A
standard
one
-
page
report
covering
RAG
status
,
milestone
movement
,
top
risks
,
decisions
required
and
budget
position
.
M
Measurable
.
Distribution
timestamp
logged
automatically
by
the
reporting
tool
;
on
-
time
means
sent
before
the
Monday
12:00
deadline
.
A
Achievable
.
The
template
and
automated
distribution
were
built
in
December
.
The
current
on
-
time
rate
of
74%
reflects
process
habit
,
not
tooling
limitations
.
R
Relevant
.
Sponsors
rated
reporting
consistency
3.1
out
of
5
in
the
annual
delivery
survey
—
their
single
lowest
score
.
T
Time
-
bound
.
Weekly
across
the
full
year
,
with
a
minimum
95%
on
-
time
rate
in
Q
1
rising
to
100%
by
Q
3.
Owner
:
PMO
Manager
·
Cadence
:
weekly
,
with
quarterly
scoring
review
3 / 6
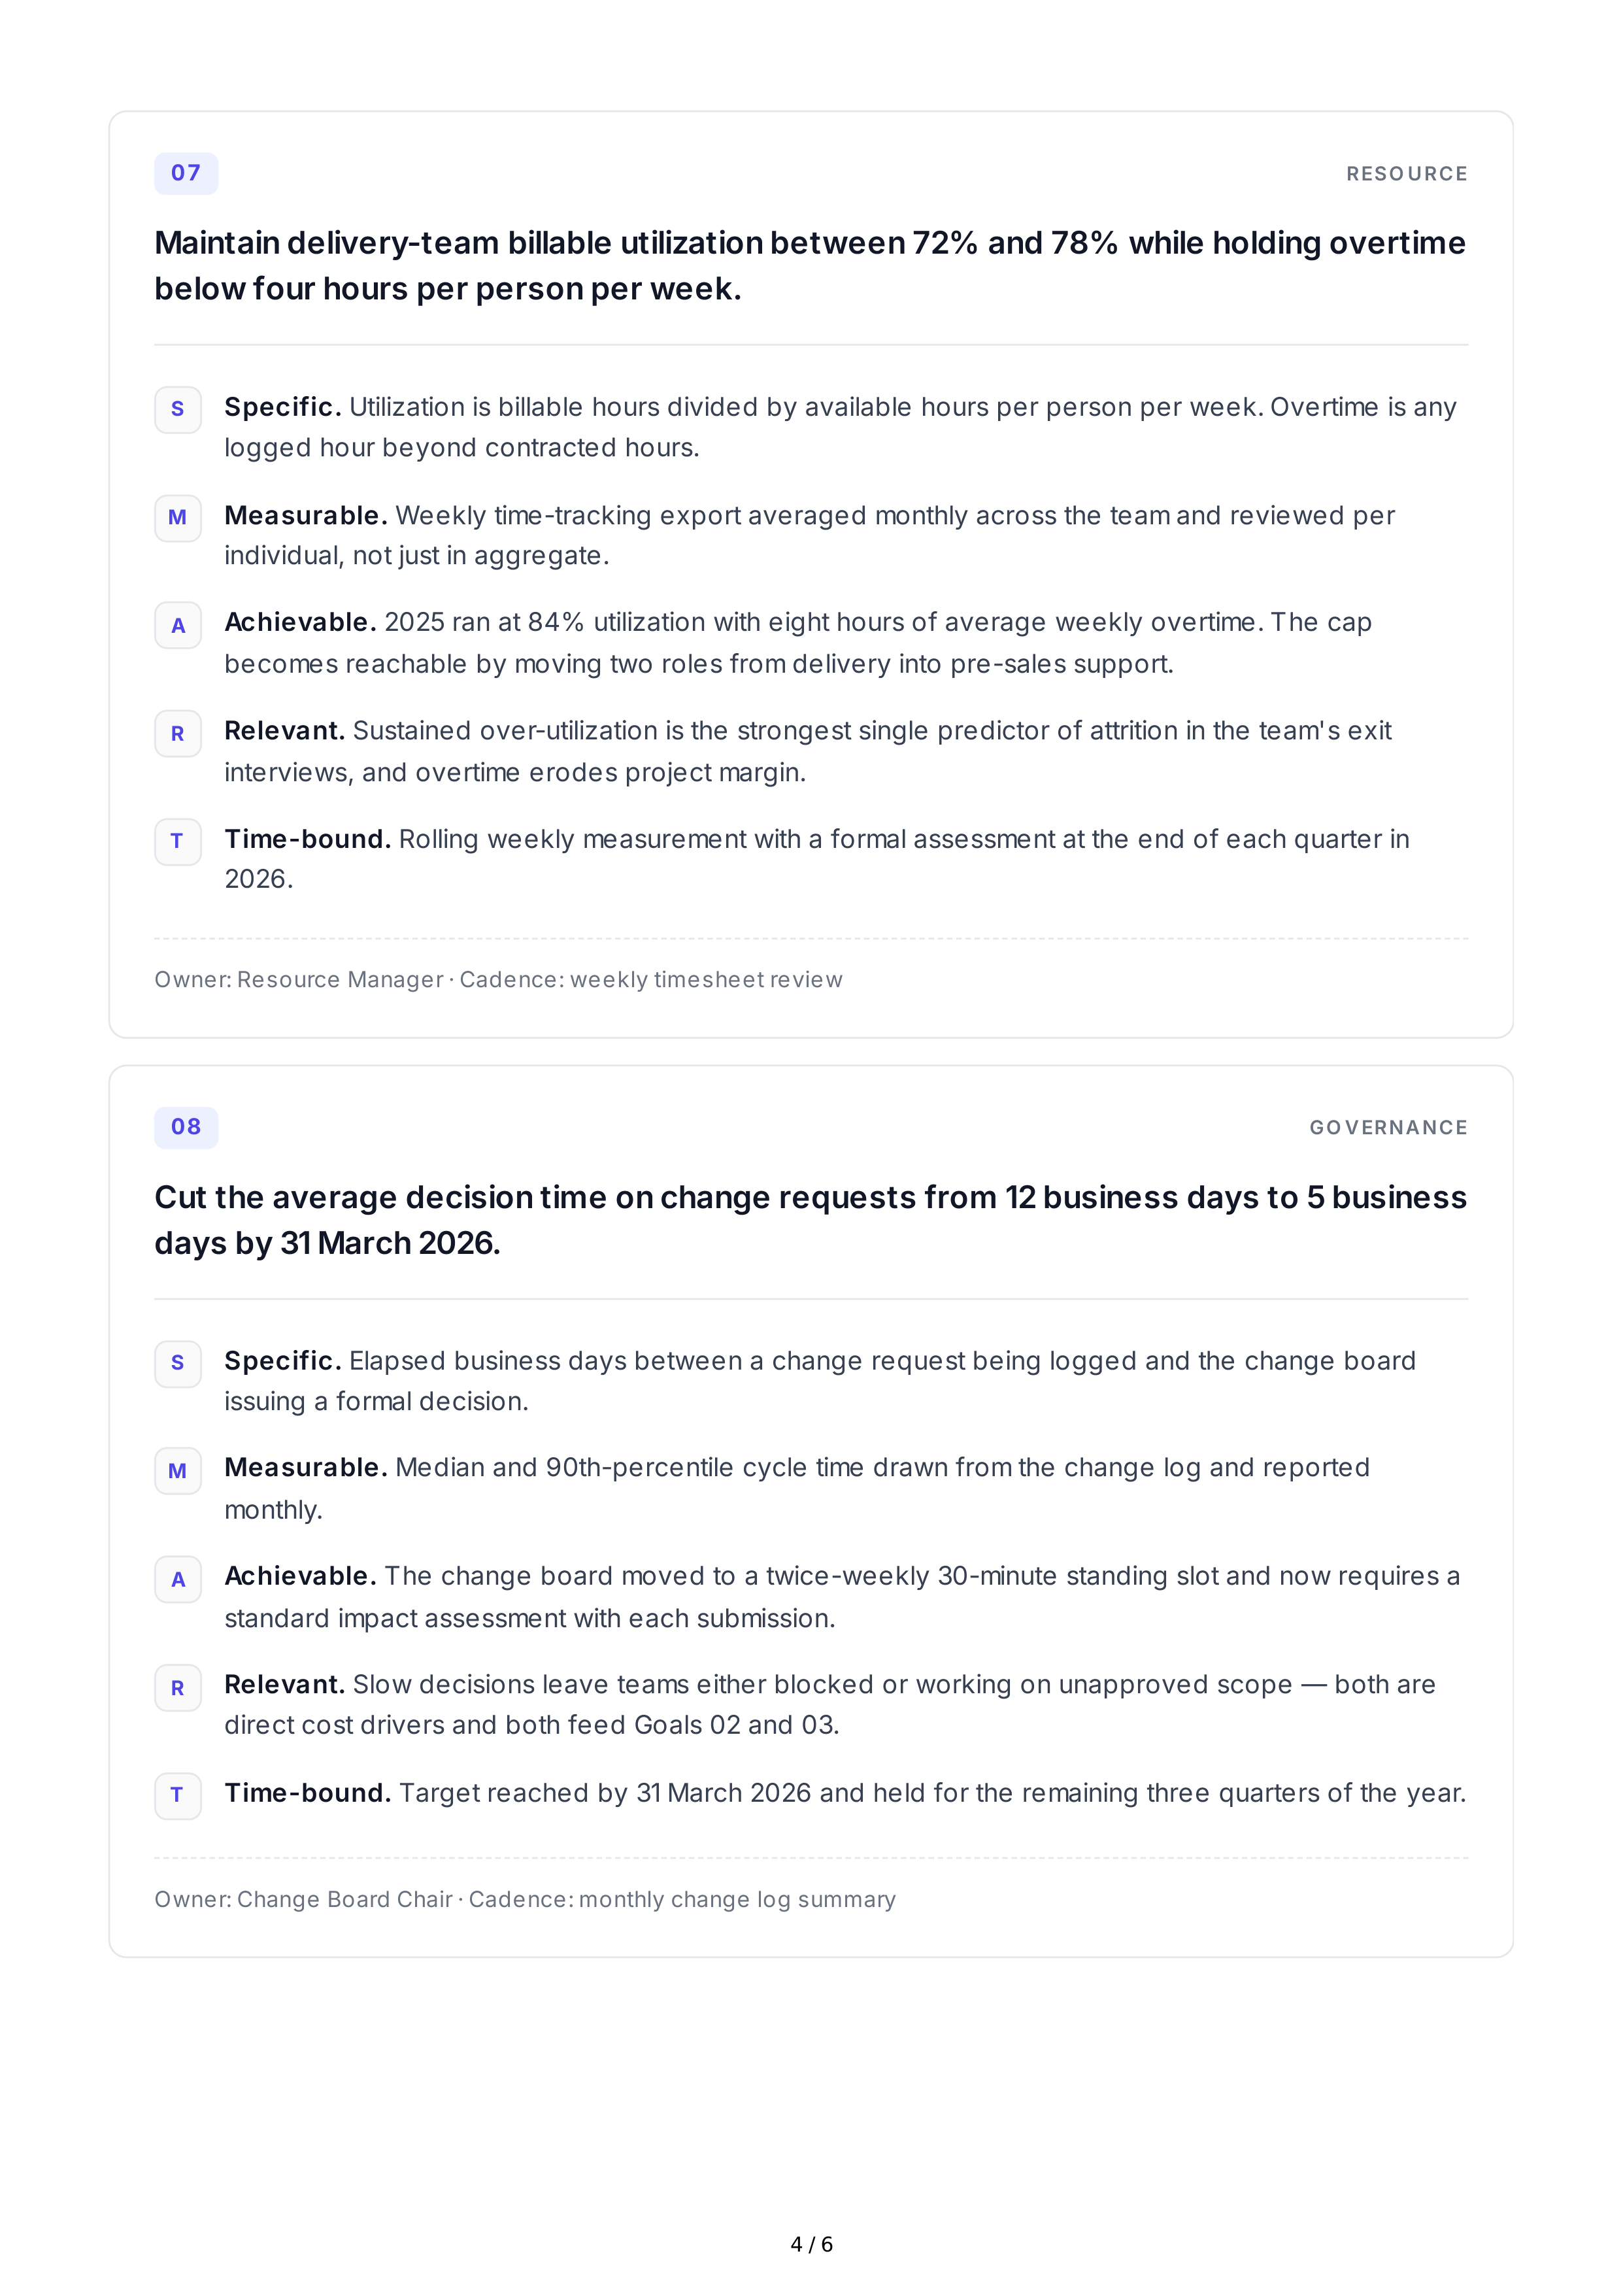
07
RESO URCE
Maintain
delivery
-
team
billable
utilization
between
72%
and
78%
while
holding
overtime
below
four
hours
per
person
per
week
.
S
Specific
.
Utilization
is
billable
hours
divided
by
available
hours
per
person
per
week
.
Overtime
is
any
logged
hour
beyond
contracted
hours
.
M
Measurable
.
Weekly
time
-
tracking
export
averaged
monthly
across
the
team
and
reviewed
per
individual
,
not
just
in
aggregate
.
A
Achievable
.
2025
ran
at
84%
utilization
with
eight
hours
of
average
weekly
overtime
.
The
cap
becomes
reachable
by
moving
two
roles
from
delivery
into
pre
-
sales
support
.
R
Relevant
.
Sustained
over
-
utilization
is
the
strongest
single
predictor
of
attrition
in
the
team
'
s
exit
interviews
,
and
overtime
erodes
project
margin
.
T
Time
-
bound
.
Rolling
weekly
measurement
with
a
formal
assessment
at
the
end
of
each
quarter
in
2026.
Owner
:
Resource
Manager
·
Cadence
:
weekly
timesheet
review
08
GO VERNANCE
Cut
the
average
decision
time
on
change
requests
from
12
business
days
to
5
business
days
by
31
March
2026.
S
Specific
.
Elapsed
business
days
between
a
change
request
being
logged
and
the
change
board
issuing
a
formal
decision
.
M
Measurable
.
Median
and
90
th
-
percentile
cycle
time
drawn
from
the
change
log
and
reported
monthly
.
A
Achievable
.
The
change
board
moved
to
a
twice
-
weekly
30-
minute
standing
slot
and
now
requires
a
standard
impact
assessment
with
each
submission
.
R
Relevant
.
Slow
decisions
leave
teams
either
blocked
or
working
on
unapproved
scope
—
both
are
direct
cost
drivers
and
both
feed
Goals
02
and
03.
T
Time
-
bound
.
Target
reached
by
31
March
2026
and
held
for
the
remaining
three
quarters
of
the
year
.
Owner
:
Change
Board
Chair
·
Cadence
:
monthly
change
log
summary
4 / 6
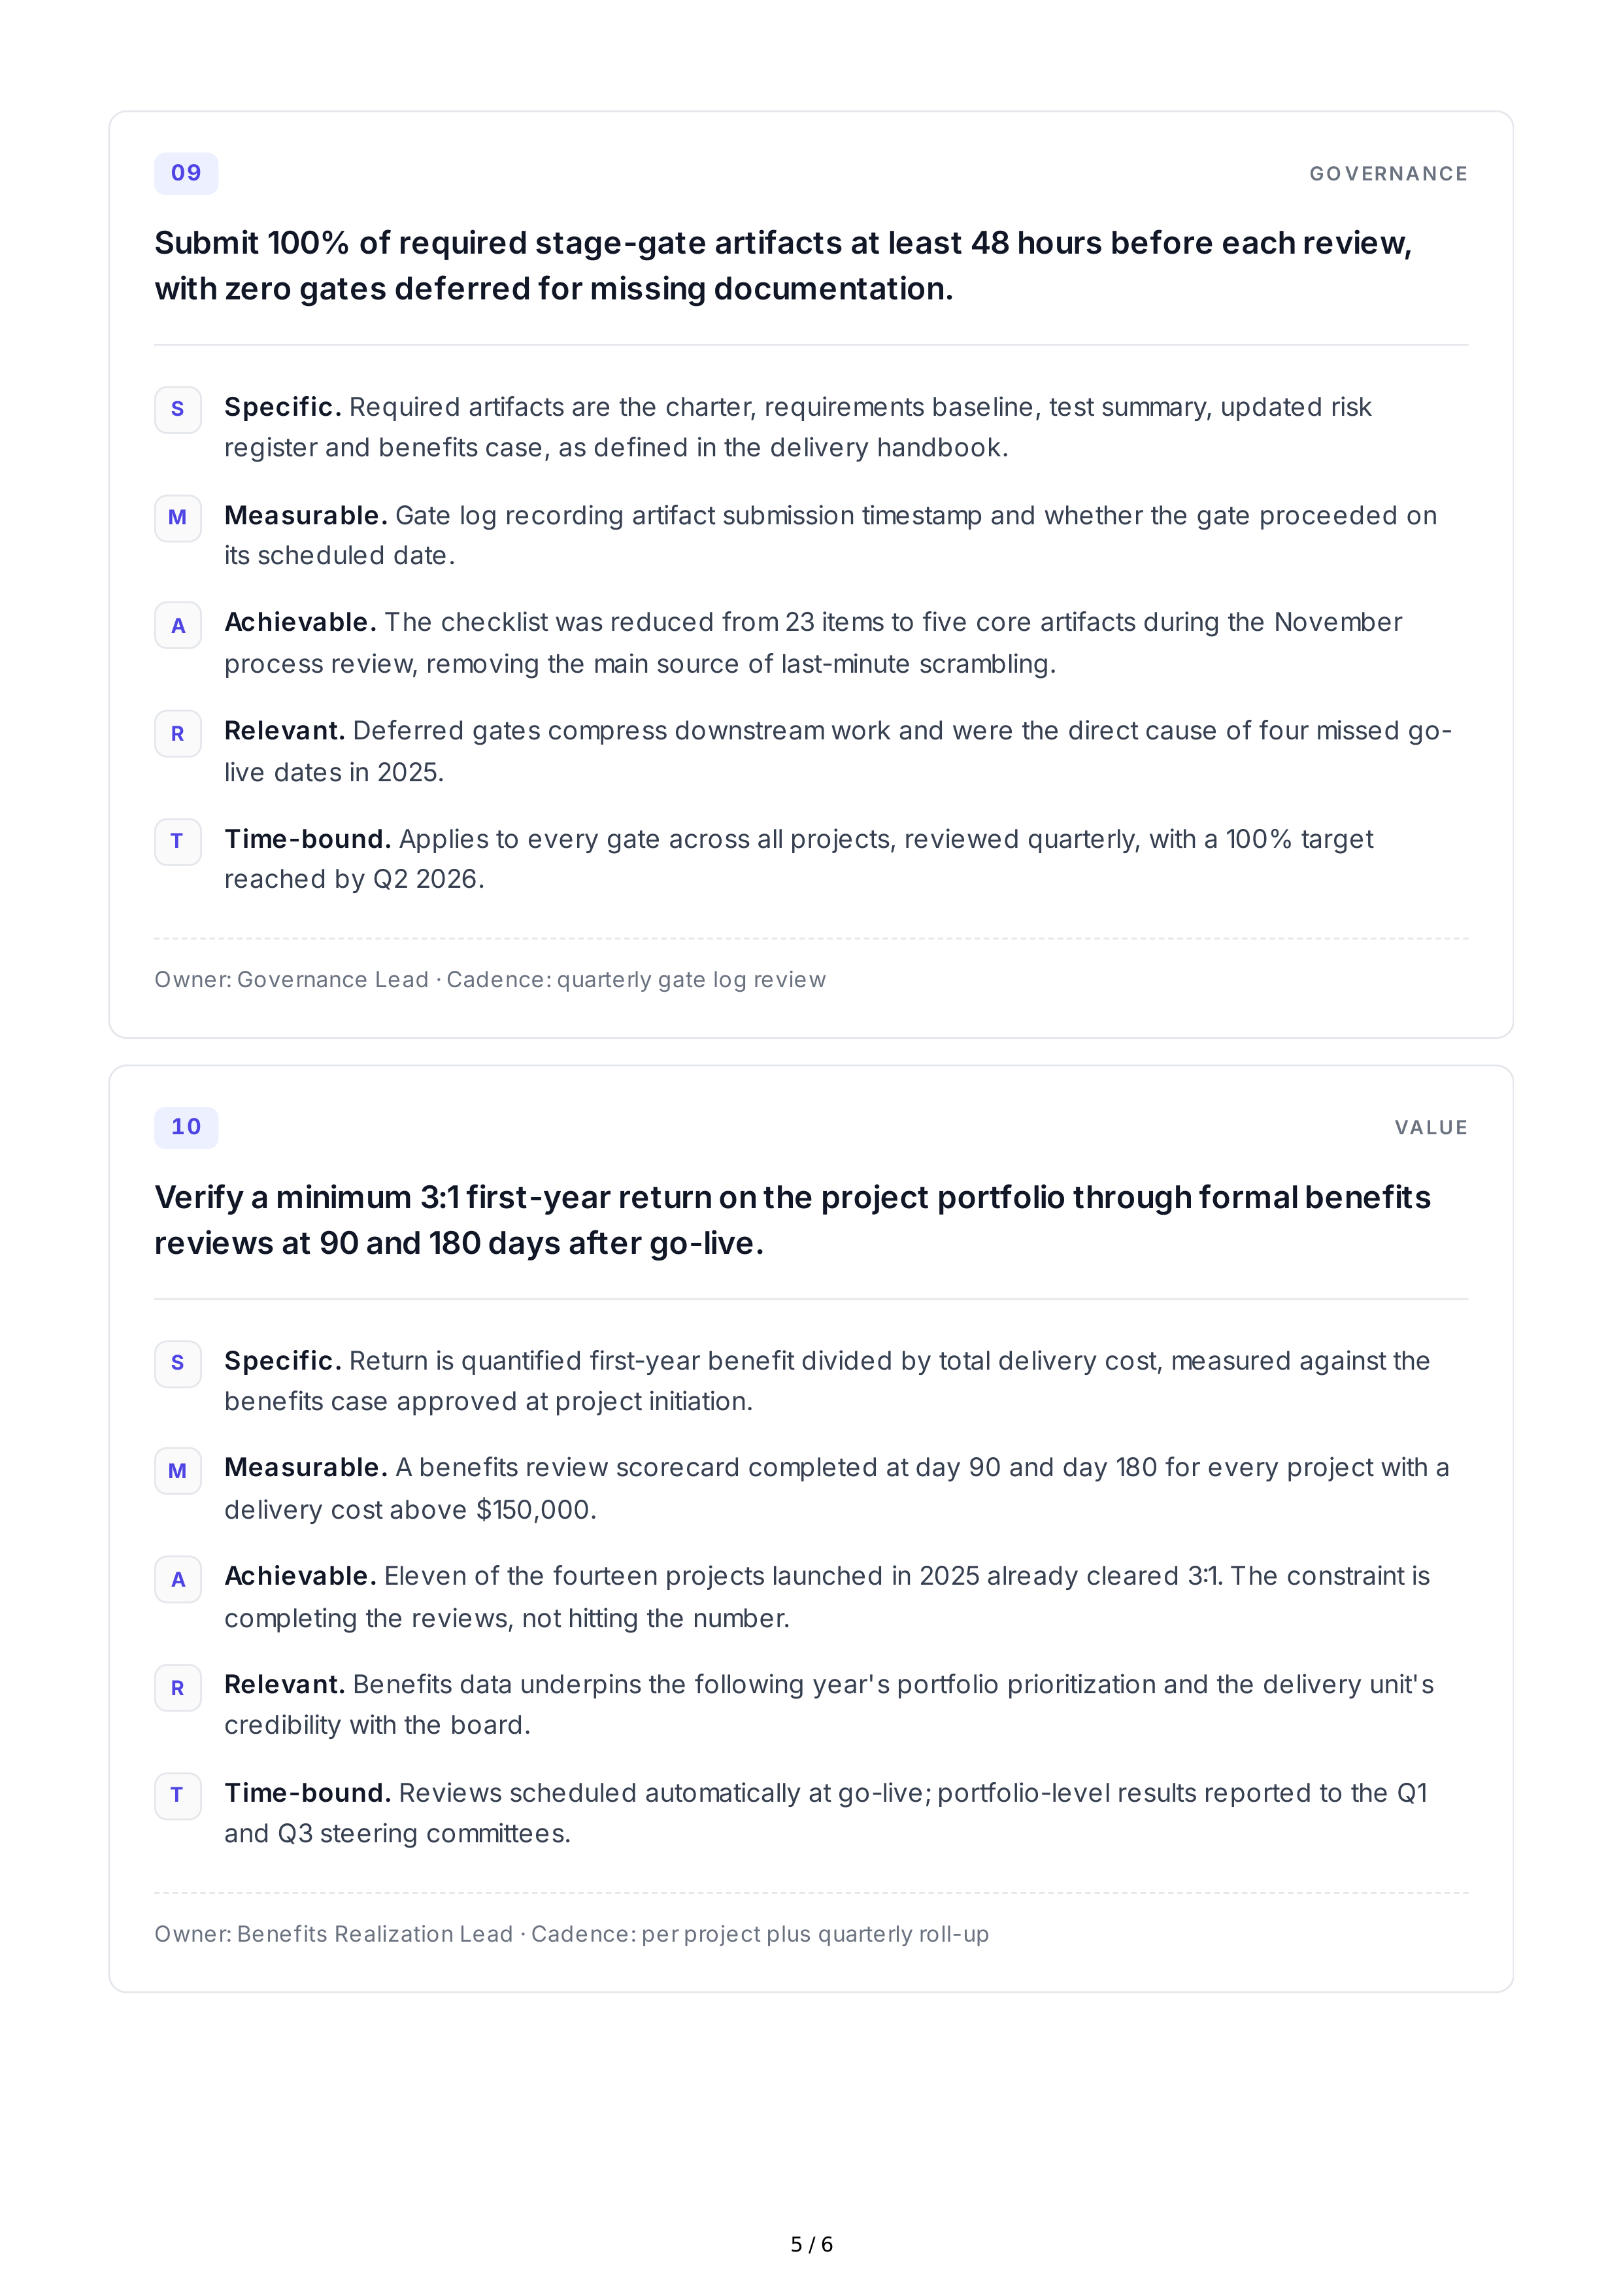
09
GO VERNANCE
Submit
100%
of
required
stage
-
gate
artifacts
at
least
48
hours
before
each
review
,
with
zero
gates
deferred
for
missing
documentation
.
S
Specific
.
Required
artifacts
are
the
charter
,
requirements
baseline
,
test
summary
,
updated
risk
register
and
benefits
case
,
as
defined
in
the
delivery
handbook
.
M
Measurable
.
Gate
log
recording
artifact
submission
timestamp
and
whether
the
gate
proceeded
on
its
scheduled
date
.
A
Achievable
.
The
checklist
was
reduced
from
23
items
to
five
core
artifacts
during
the
November
process
review
,
removing
the
main
source
of
last
-
minute
scrambling
.
R
Relevant
.
Deferred
gates
compress
downstream
work
and
were
the
direct
cause
of
four
missed
go
-
live
dates
in
2025.
T
Time
-
bound
.
Applies
to
every
gate
across
all
projects
,
reviewed
quarterly
,
with
a
100%
target
reached
by
Q
2 2026.
Owner
:
Governance
Lead
·
Cadence
:
quarterly
gate
log
review
10
VALUE
Verify
a
minimum
3:1
first
-
year
return
on
the
project
portfolio
through
formal
benefits
reviews
at
90
and
180
days
after
go
-
live
.
S
Specific
.
Return
is
quantified
first
-
year
benefit
divided
by
total
delivery
cost
,
measured
against
the
benefits
case
approved
at
project
initiation
.
M
Measurable
.
A
benefits
review
scorecard
completed
at
day
90
and
day
180
for
every
project
with
a
delivery
cost
above
$
150,000.
A
Achievable
.
Eleven
of
the
fourteen
projects
launched
in
2025
already
cleared
3:1.
The
constraint
is
completing
the
reviews
,
not
hitting
the
number
.
R
Relevant
.
Benefits
data
underpins
the
following
year
'
s
portfolio
prioritization
and
the
delivery
unit
'
s
credibility
with
the
board
.
T
Time
-
bound
.
Reviews
scheduled
automatically
at
go
-
live
;
portfolio
-
level
results
reported
to
the
Q
1
and
Q
3
steering
committees
.
Owner
:
Benefits
Realization
Lead
·
Cadence
:
per
project
plus
quarterly
roll
-
up
5 / 6
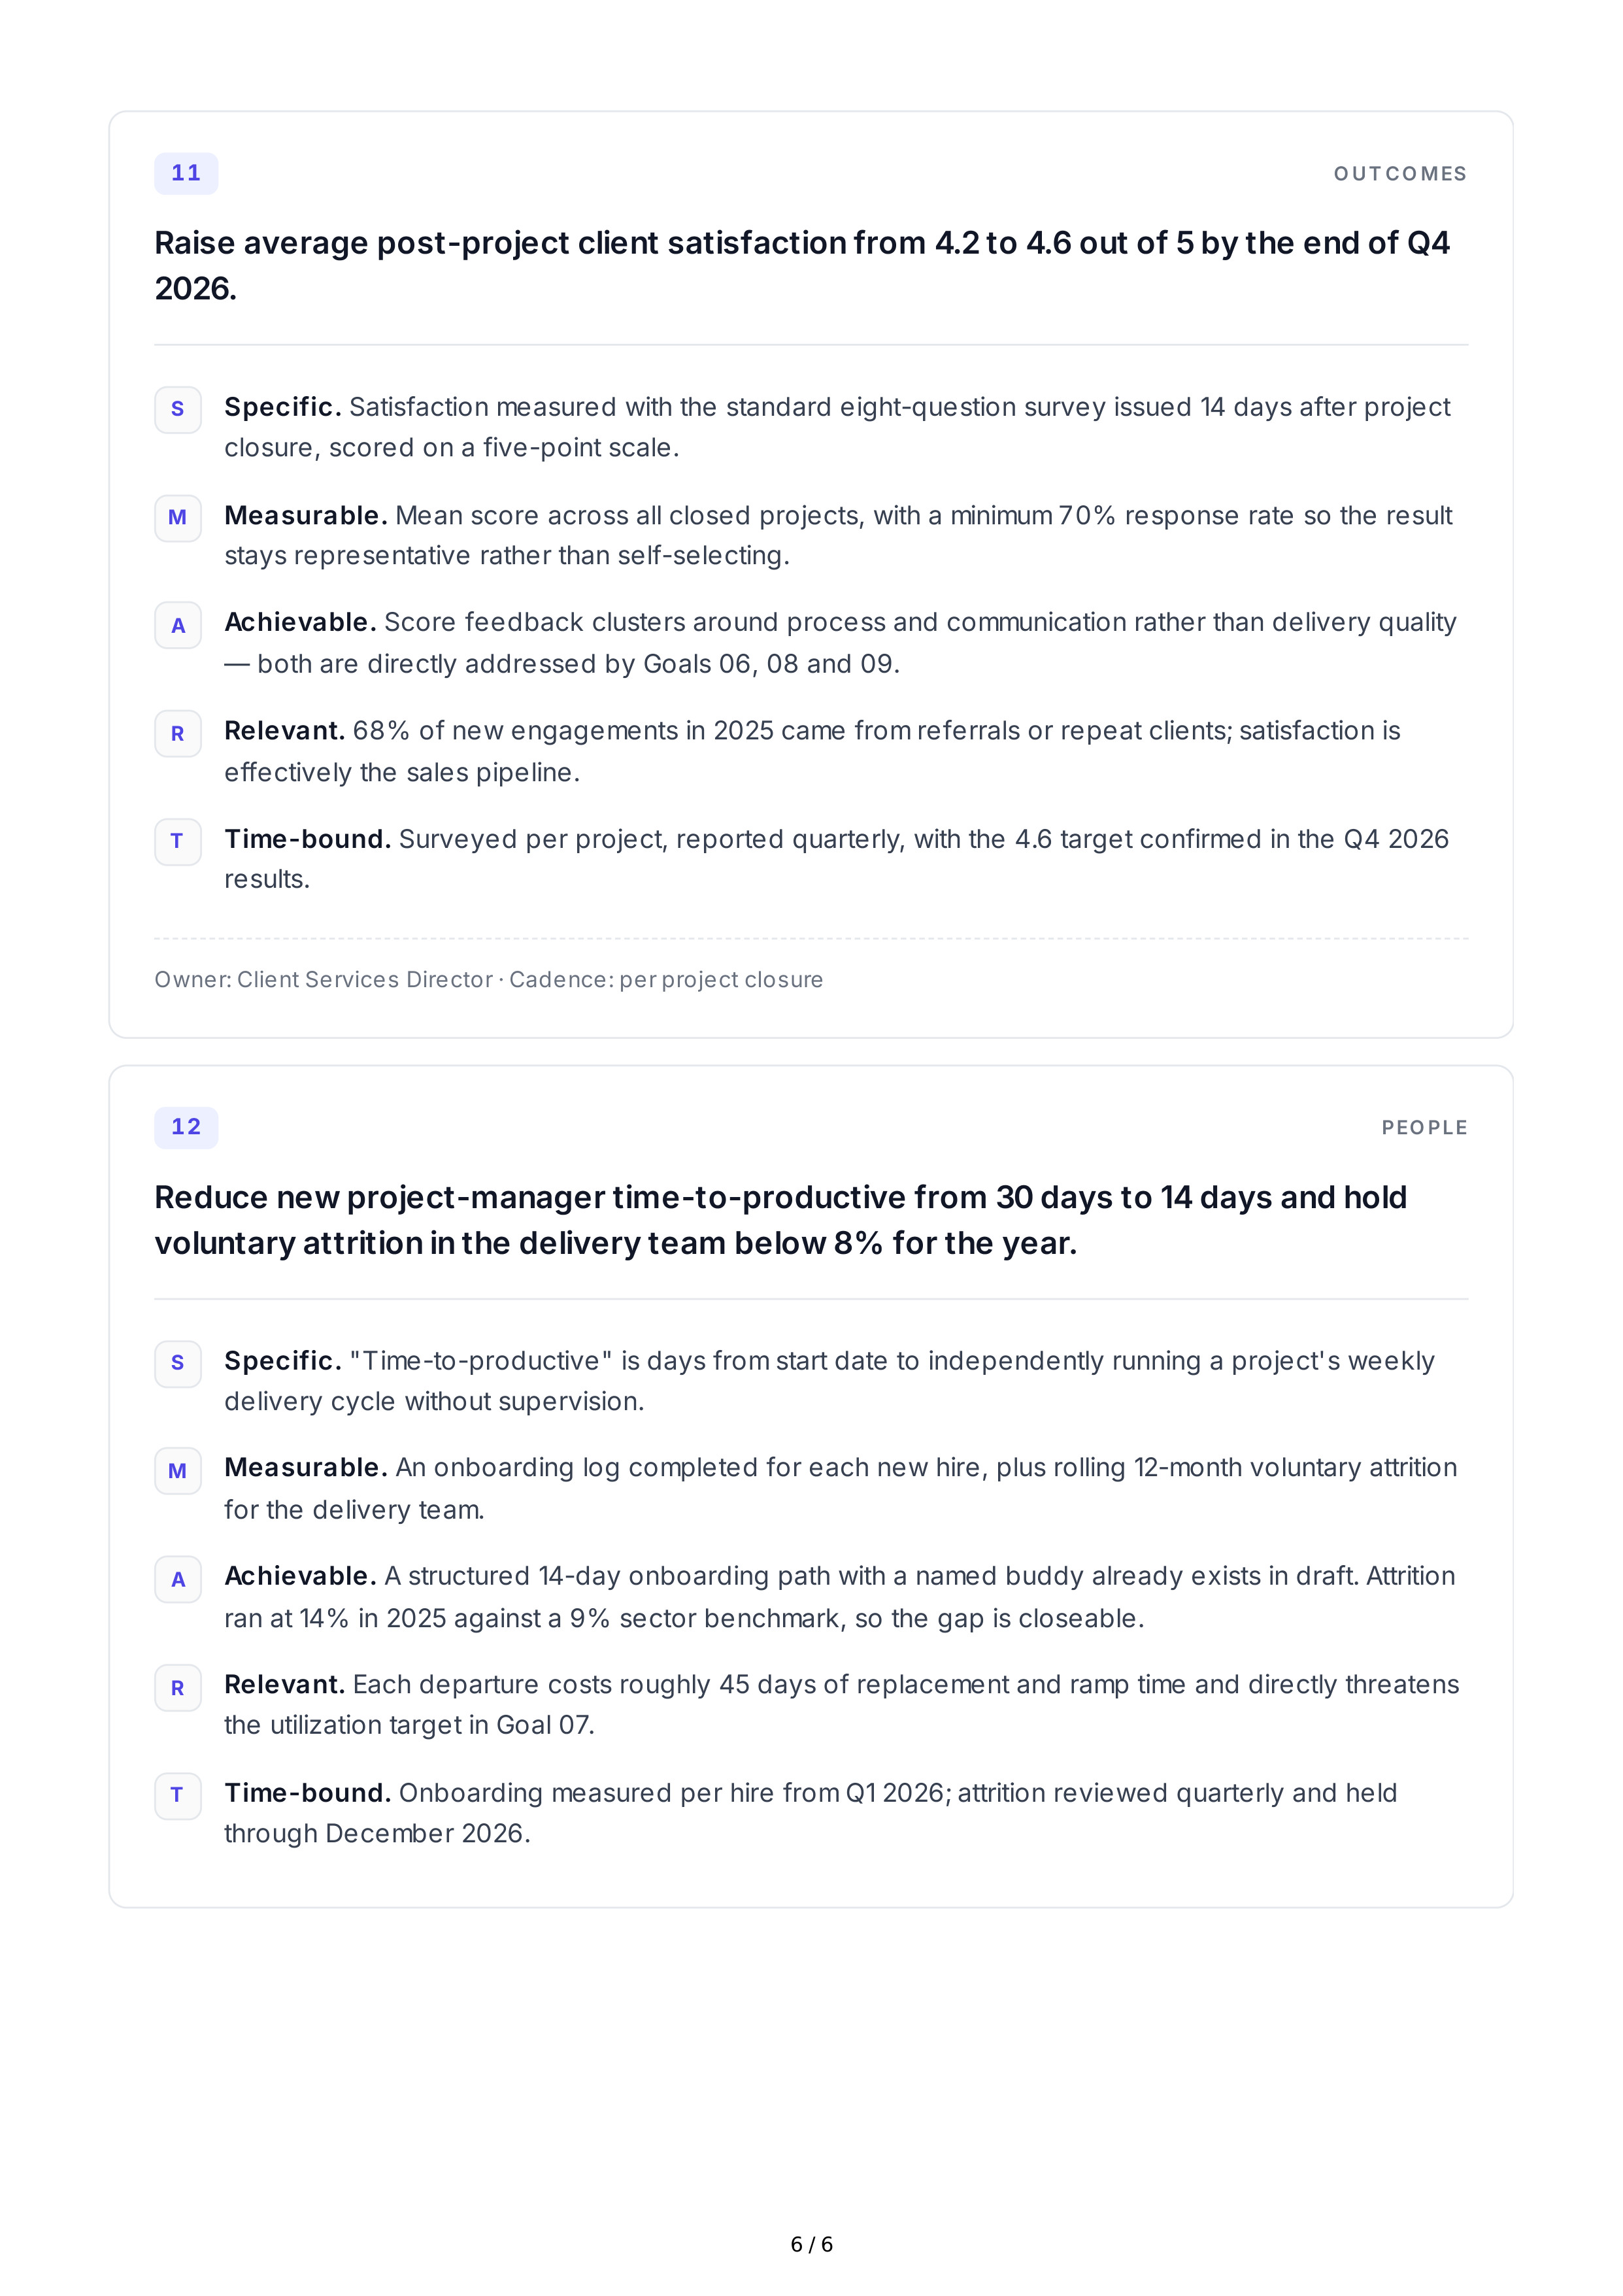
11
O UT CO MES
Raise
average
post
-
project
client
satisfaction
from
4.2
to
4.6
out
of
5
by
the
end
of
Q
4
2026.
S
Specific
.
Satisfaction
measured
with
the
standard
eight
-
question
survey
issued
14
days
after
project
closure
,
scored
on
a
five
-
point
scale
.
M
Measurable
.
Mean
score
across
all
closed
projects
,
with
a
minimum
70%
response
rate
so
the
result
stays
representative
rather
than
self
-
selecting
.
A
Achievable
.
Score
feedback
clusters
around
process
and
communication
rather
than
delivery
quality
—
both
are
directly
addressed
by
Goals
06, 08
and
09.
R
Relevant
.
68%
of
new
engagements
in
2025
came
from
referrals
or
repeat
clients
;
satisfaction
is
effectively
the
sales
pipeline
.
T
Time
-
bound
.
Surveyed
per
project
,
reported
quarterly
,
with
the
4.6
target
confirmed
in
the
Q
4 2026
results
.
Owner
:
Client
Services
Director
·
Cadence
:
per
project
closure
12
PEO PLE
Reduce
new
project
-
manager
time
-
to
-
productive
from
30
days
to
14
days
and
hold
voluntary
attrition
in
the
delivery
team
below
8%
for
the
year
.
S
Specific
.
"
Time
-
to
-
productive
"
is
days
from
start
date
to
independently
running
a
project
'
s
weekly
delivery
cycle
without
supervision
.
M
Measurable
.
An
onboarding
log
completed
for
each
new
hire
,
plus
rolling
12-
month
voluntary
attrition
for
the
delivery
team
.
A
Achievable
.
A
structured
14-
day
onboarding
path
with
a
named
buddy
already
exists
in
draft
.
Attrition
ran
at
14%
in
2025
against
a
9%
sector
benchmark
,
so
the
gap
is
closeable
.
R
Relevant
.
Each
departure
costs
roughly
45
days
of
replacement
and
ramp
time
and
directly
threatens
the
utilization
target
in
Goal
07.
T
Time
-
bound
.
Onboarding
measured
per
hire
from
Q
1 2026;
attrition
reviewed
quarterly
and
held
through
December
2026.
6 / 6