


Facilitating Proactive and Reactive Guidance for Decision Making
on the Web: A Design Probe with WebSeek
Yanwei Huang
The Hong Kong University of Science and Technology
Hong Kong S.A.R., China
yanwei.huang@connect.ust.hk
Arpit Narechania
The Hong Kong University of Science and Technology
Hong Kong S.A.R., China
arpit@ust.hk
B
4
B
1
B
2
B
B
3
B
5
A
2
A
1
A
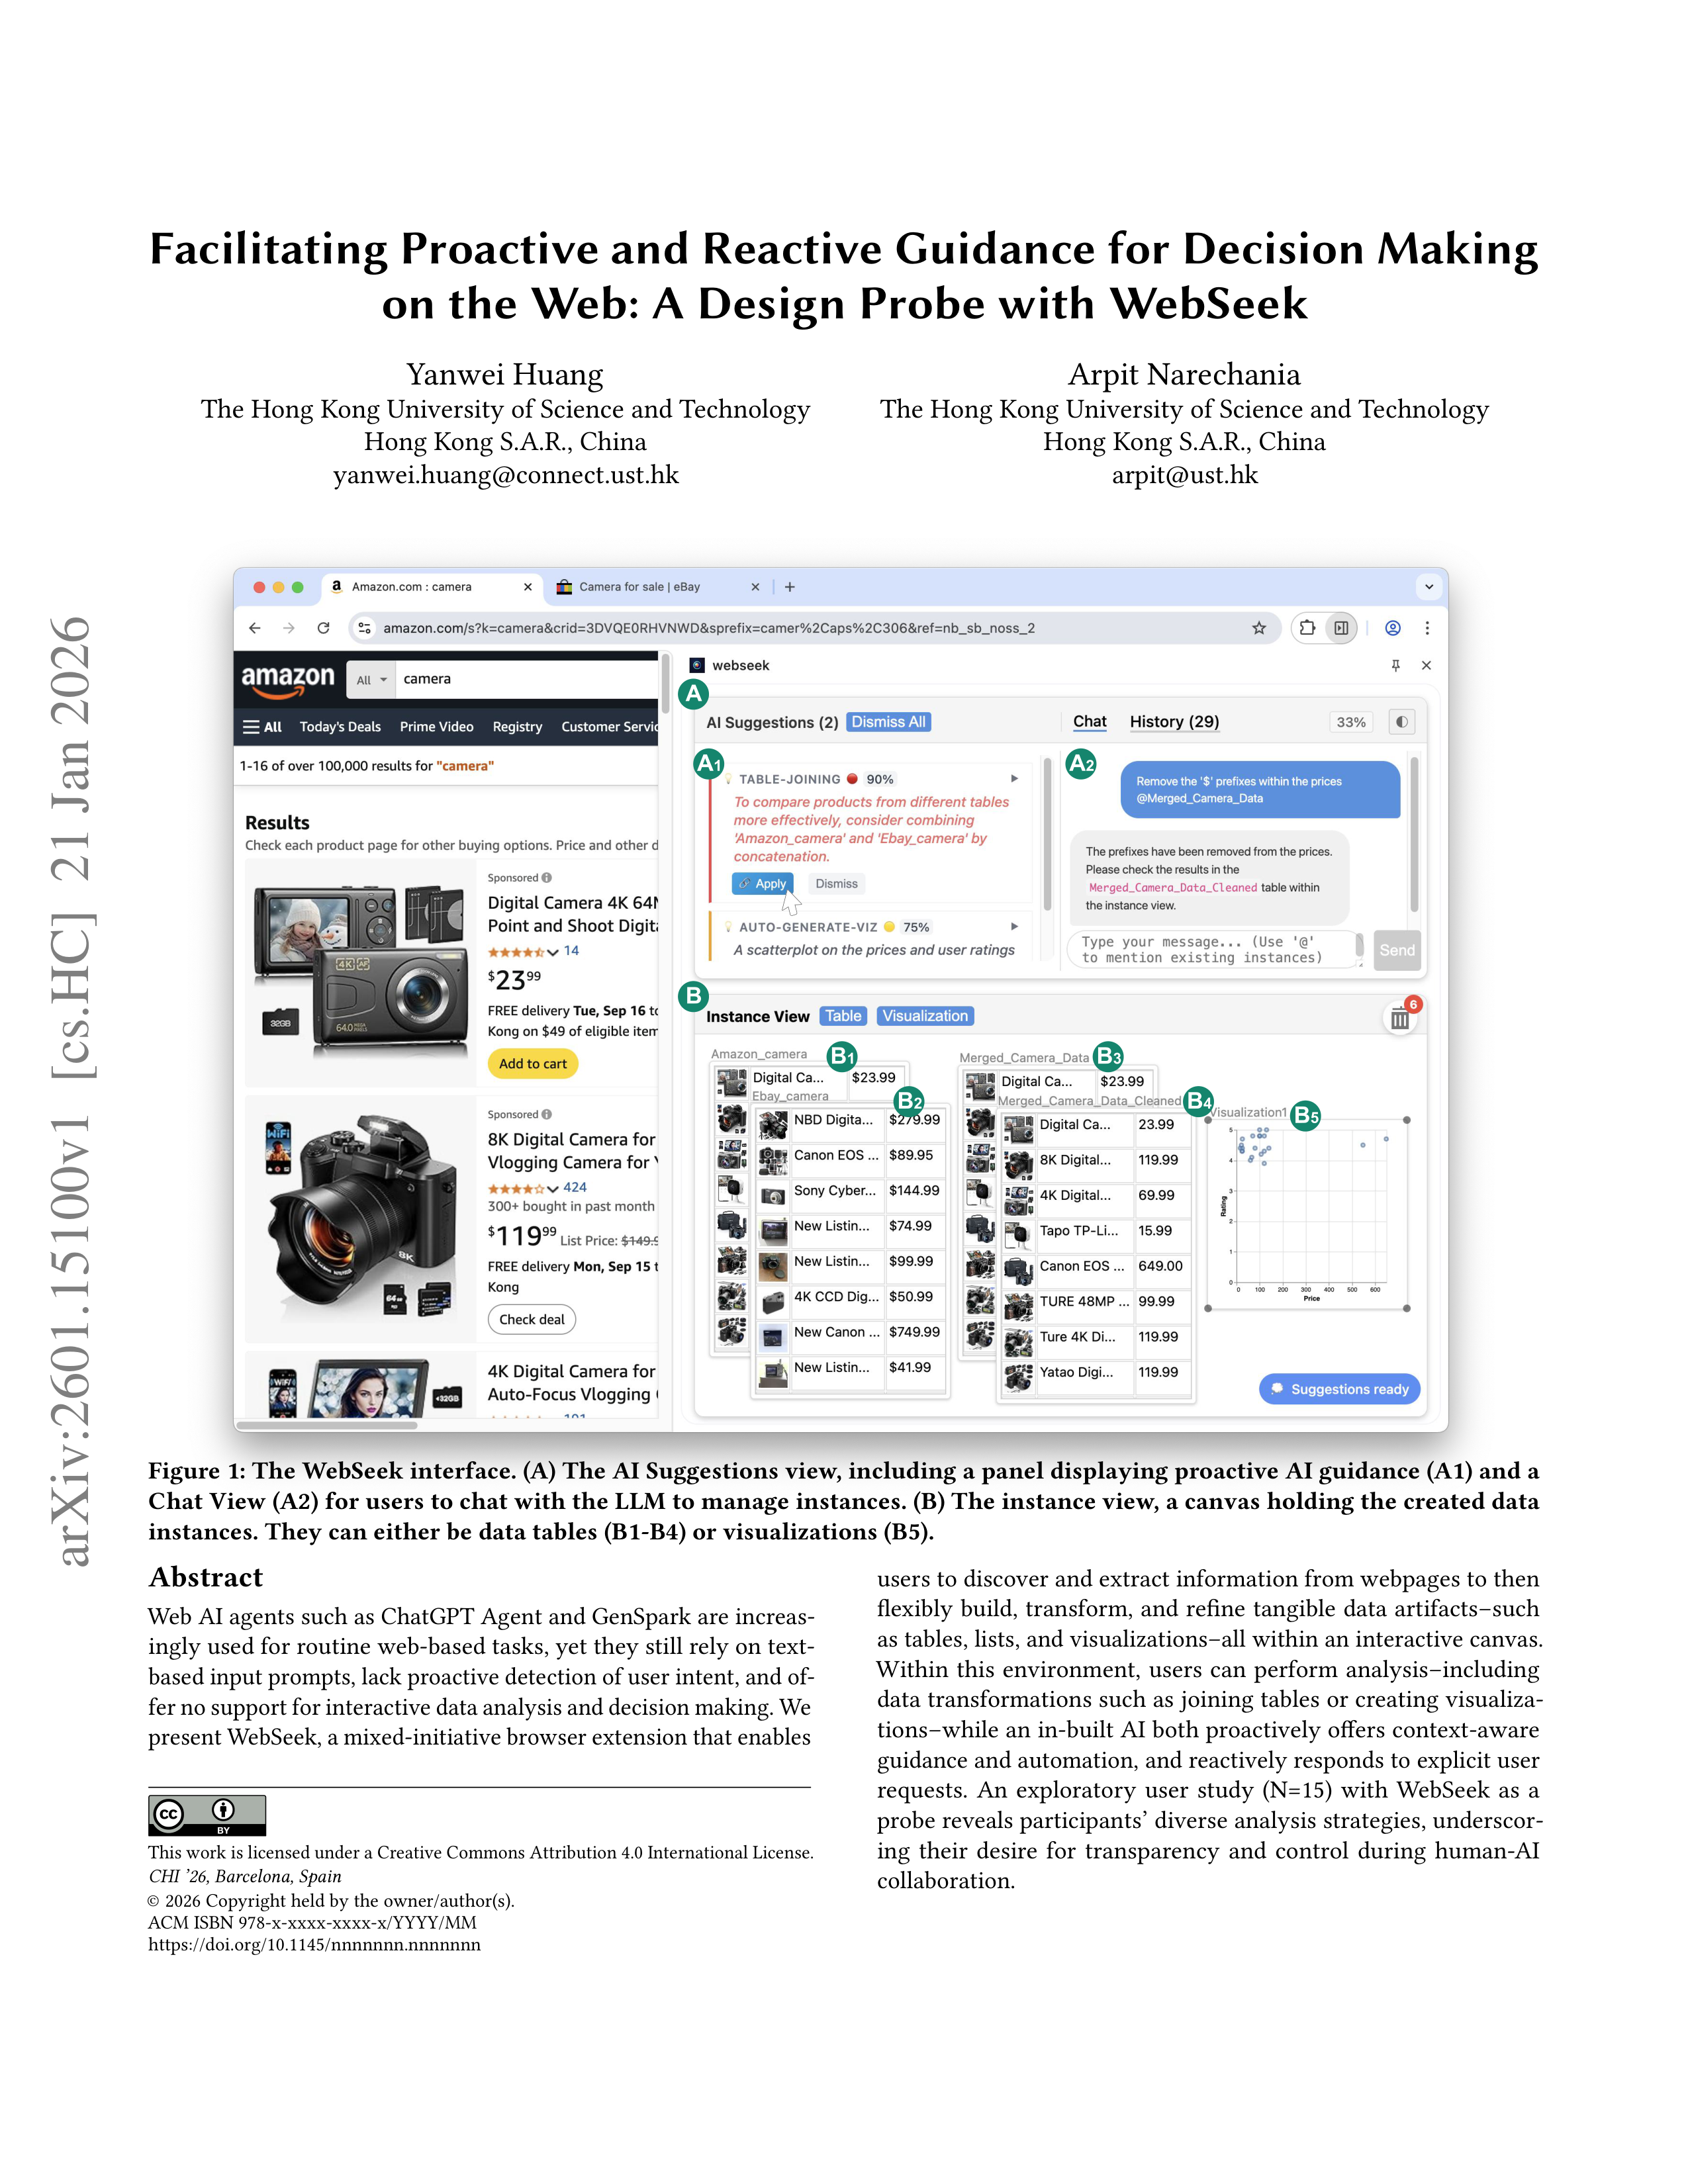
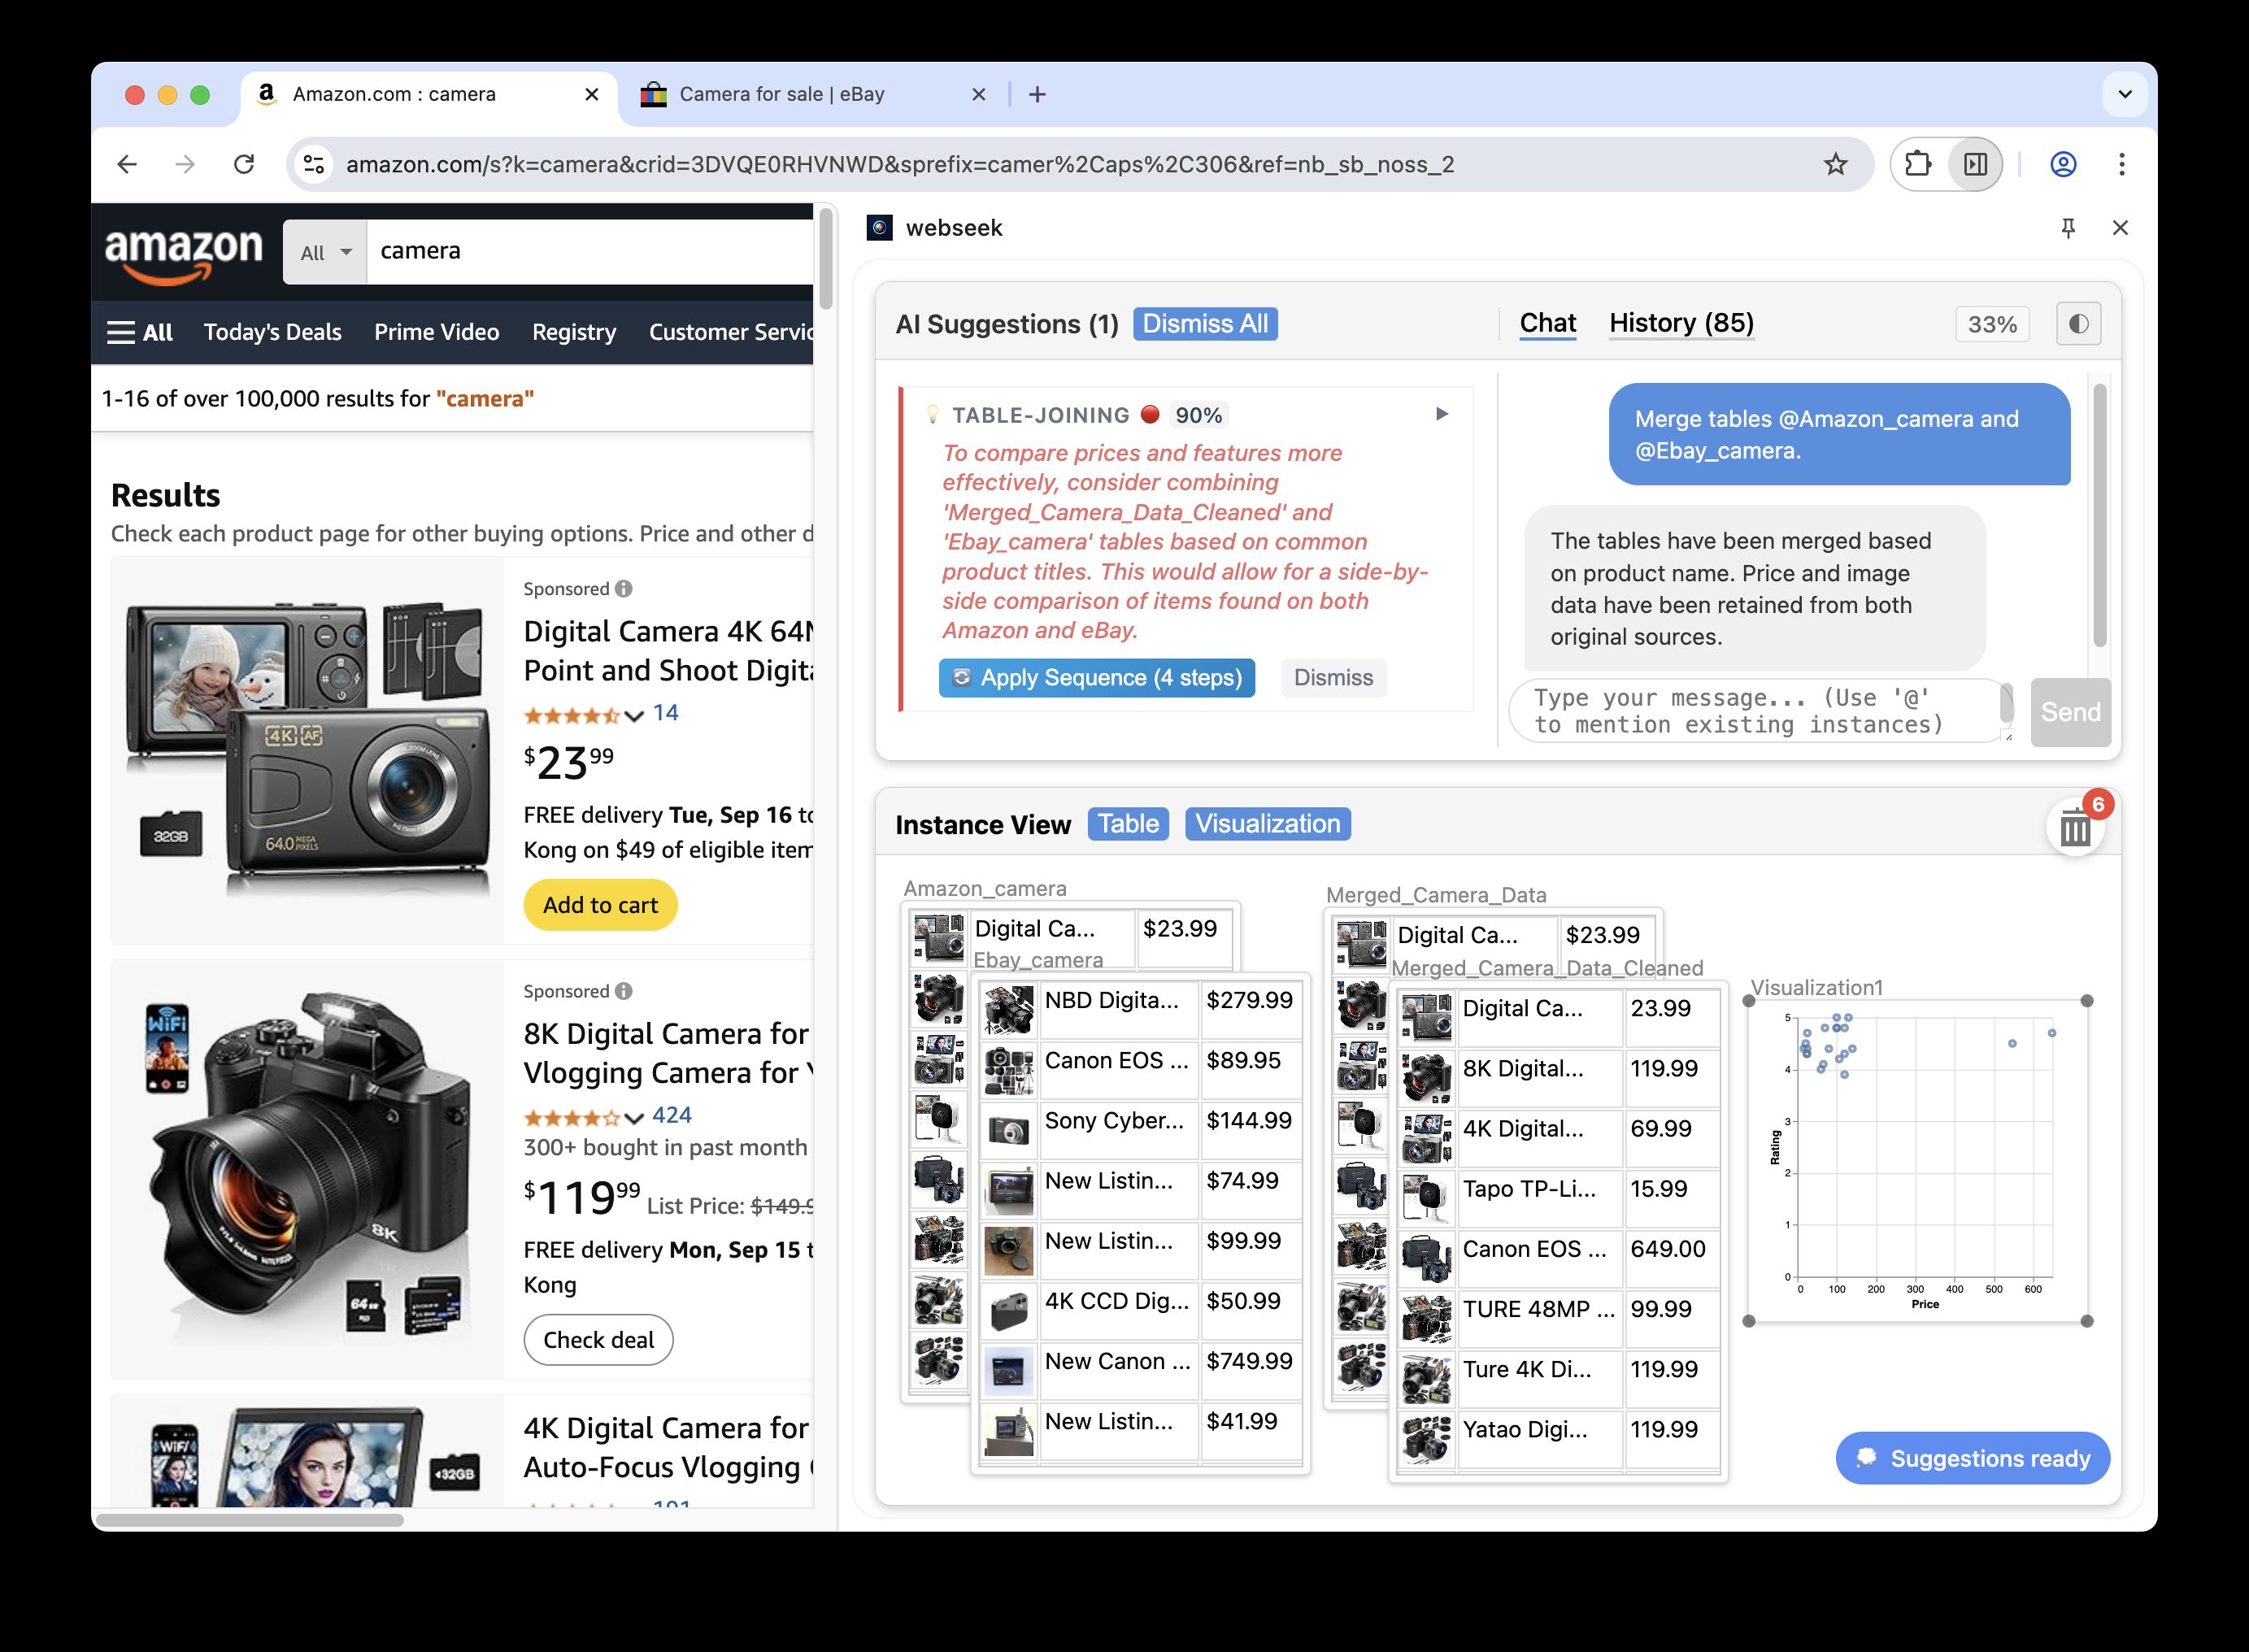
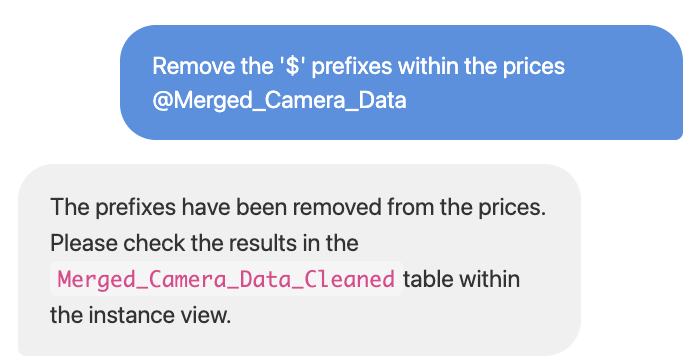
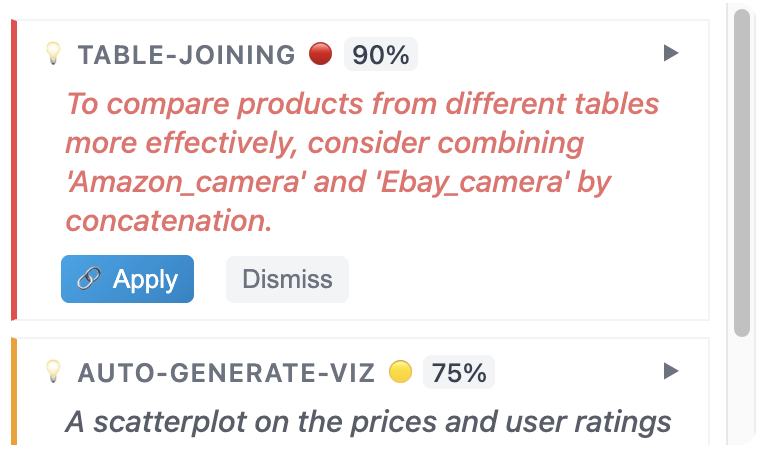
Figure 1: The WebSeek interface. (A) The AI Suggestions view, including a panel displaying proactive AI guidance (A1) and a
Chat View (A2) for users to chat with the LLM to manage instances. (B) The instance view, a canvas holding the created data
instances. They can either be data tables (B1-B4) or visualizations (B5).
Abstract
Web AI agents such as ChatGPT Agent and GenSpark are increas-
ingly used for routine web-based tasks, yet they still rely on text-
based input prompts, lack proactive detection of user intent, and of-
fer no support for interactive data analysis and decision making. We
present WebSeek, a mixed-initiative browser extension that enables
This work is licensed under a Creative Commons Attribution 4.0 International License.
CHI ’26, Barcelona, Spain
© 2026 Copyright held by the owner/author(s).
ACM ISBN 978-x-xxxx-xxxx-x/YYYY/MM
https://doi.org/10.1145/nnnnnnn.nnnnnnn
users to discover and extract information from webpages to then
flexibly build, transform, and refine tangible data artifacts–such
as tables, lists, and visualizations–all within an interactive canvas.
Within
this
environment,
users
can
perform
analysis–including
data transformations such as joining tables or creating visualiza-
tions–while an in-built AI both proactively offers context-aware
guidance and automation, and reactively responds to explicit user
requests.
An
exploratory
user
study
(N=15)
with
WebSeek
as
a
probe reveals participants’ diverse analysis strategies, underscor-
ing
their
desire
for
transparency
and
control
during
human-AI
collaboration.
arXiv:2601.15100v1 [cs.HC] 21 Jan 2026
CHI ’26, April 13–17, 2026, Barcelona, Spain
Yanwei Huang and Arpit Narechania
CCS Concepts
•
Human-centered
computing
→
Interactive
systems
and
tools
;
Interaction design
;
Empirical studies in HCI
.
Keywords
Web
Agent,
Browser
Extension,
Human-AI
collaboration,
Data-
Driven Decision Making
ACM Reference Format:
Yanwei Huang and Arpit Narechania. 2026. Facilitating Proactive and Re-
active Guidance for Decision Making on the Web: A Design Probe with
WebSeek. In
Proceedings of the 2026 CHI Conference on Human Factors in
Computing Systems (CHI ’26), April 13–17, 2026, Barcelona, Spain.
ACM, New
York, NY, USA, 20 pages. https://doi.org/10.1145/nnnnnnn.nnnnnnn
1
Introduction
Modern web usage frequently involves complex, multi-step tasks
that often culminate in a decision. Whether comparing consumer
products, planning travel itineraries, booking movie tickets, or writ-
ing commercial reports, everyday web users
1
often gather, synthe-
size, and analyze information from a variety of sources. These users
often perform these tasks by juggling between multiple browser
tabs
and
manually
copy-pasting
information
into
separate
tools
like spreadsheets or note-taking applications for subsequent anal-
ysis. Unfortunately, this workflow is often fragmented and hence
laborious, imposing a high cognitive load on the user and creating
friction in the overall process.
A key reason for this fragmented workflow is the lack of end-
to-end
data
management
tools.
Data
management
is
often
char-
acterized
by
the
HCI
community
as
an
iterative,
multi-step
pro-
cess
(e.g.,
"Discover,
Capture,
Curate,
Design,
Create"
by
Muller
et al. [
62
]), yet existing interactive web data extraction and wran-
gling tools [
13
,
21
,
39
,
44
,
59
,
94
] are predominantly built to support
specific steps, leaving the overall workflow fragmented. Recently,
a new generation of web-based artificial intelligence (AI) agents
(henceforth referred to as web agents), such as ChatGPT Agent [
70
]
and GenSpark [
28
], have emerged, promising a more streamlined,
end-to-end workflow, particularly for decision-making on the web.
By leveraging the planning and reasoning abilities of large language
models (LLMs), these agents can automate complex sequences of
web actions based on natural language commands, such as browsing
webpages, fetching data for analysis, and making web interactions
on
the
user’s
behalf.
In
other
words,
these
tools
enable
users
to
focus on decision making rather than data management, offering
unprecedented efficiency for routine tasks on the web.
However, despite their advancements, these web agents fall short
when it comes to supporting transparent and iterative data-driven
analysis
[
16
,
30
].
For
instance,
while
these
agents
may
produce
final outputs or even expose fragments of their reasoning process,
they
often
hide
intermediate
artifacts
or
present
them
in
ways
that
are
not
easily
usable
by
the
user.
Even
when
outputs
like
tables are made visible, they are typically static, not interactive or
customizable, hindering users from reusing or adapting the data
analysis
workflow[
16
].
We
observe
that
this
stems
from
a
core
1
We
refer
to
everyday
web
users
as
individuals
who
predominantly
use
internet
browsers to perform routine tasks and information-seeking activities without requiring
specialized technical expertise.
design choice–a chatbot-like UI–which elevates text as the first-
class citizen, not data. Without direct access to the underlying data
and shared data representations, users are forced to articulate their
requirements solely through text commands, an approach that can
be inefficient, ambiguous, and particularly challenging for everyday
web
users
[
39
]
performing
complex
tasks.
Essentially,
there
is
a
need
to
support
these
users
in
making
informed
and
confident
decisions on the web.
To address this need, we built WebSeek, an AI-powered mixed-
initiative browser extension that treats data as a first-class citizen,
enabling both the AI agent and the user to directly interact with
it. In particular, WebSeek shifts the traditional workflow towards
building and refining tangible data artifacts, such as text snippets
extracted from webpages and intermediate tables assembled from
them. Users can directly manipulate these artifacts (e.g., performing
edits or data transformations) on an interactive canvas (Figure 1
(B)), promoting efficient prototyping and enhancing transparency
and flexibility. While this approach supports rich user interaction,
achieving
effective
data-driven
human–AI
collaboration
on
the
web presents new challenges: (1) the specific low-level data tasks
needed to support complex, open-ended decision making on the
web are ill-defined; and (2) determining when, what, and how to
provide AI guidance to optimize the trade-off between efficiency
and control remains a non-trivial design problem. To address these
challenges, we curate a principled design space of mixed-initiative
assistance for data tasks on the web that formalizes AI intervention
to support the user’s goals. Guided by this design space, WebSeek
enables direct manipulation augmented by a mixed-initiative AI.
This AI both reactively executes user commands on demand and
proactively suggests context-aware actions (Figure 1 (A)), ranging
from batch data extraction to complex table joins.
Using WebSeek as a design probe, we conducted a user study
(N=15) involving two representative data-driven decision making
scenarios: (1) fact-checking a news story and (2) product research.
We found that WebSeek helped participants finish complex decision
making tasks successfully while leading to high user confidence
and sense of agency and control. Participants exhibited a diverse
set of workflows with varying degree of reliance on AI guidance
and direct manipulation. Overall, they found direct manipulation
indispensable
and
perceived
proactive
and
reactive
guidance
in
WebSeek as reliable and helpful. Drawing on these observations,
we discuss implications for the design of future mixed-initiative
data analysis systems. Our contributions include:
•
A mixed-initiative browser extension, WebSeek, tailored for
data-driven decision making.
•
A framework for providing proactive and reactive AI guid-
ance during web-based data-driven decision making, cover-
ing the timing, scope, and presentation of guidance.
•
Findings from an exploratory user study using WebSeek as a
probe to understand how users perform two everyday tasks
on the web.
2
Related Work
2.1
AI-powered Web Agents
The recent proliferation of Large Language Models (LLMs) and AI
agents has catalyzed a new paradigm of web automation. Moving
Facilitating Proactive and Reactive Guidance for Decision Making on the Web: A Design Probe with WebSeek
CHI ’26, April 13–17, 2026, Barcelona, Spain
beyond traditional programmatic scripting, numerous modern web
agents have demonstrated impressive capabilities in streamlining
web workflows using natural language. From a user-interface per-
spective, these agents generally fall into three classes: (1) chatbot-
style interfaces–in which an LLM can access the web and external
tools to fulfill user requests (e.g., ChatGPT Agent [
70
], GenSpark [
28
],
AnythingLLM [
49
]); (2) browser extensions or forked browsers–
that fetch page context and provide in-situ suggestions and actions,
navigating
users
to
quick
chats
with
LLMs
in
a
chatroom
(e.g.,
Harpa.AI [
33
], GenSpark Browser [
27
], Merlin.AI [
41
]); and (3) vi-
sual agents–that execute end-to-end web automation workflows in
a virtual machine or local environment while exposing the process
visually for inspection and control (e.g., Skyvern [
42
], Manus.AI [
5
],
AgenticSeek [
26
]). These systems operate with a high degree of
goal-driven autonomy, leveraging a suite of tools for web search,
navigation, processing, and interaction to plan and execute complex
tasks [
4
,
34
,
56
,
69
,
91
,
96
]. Some of these systems even decompose
workflows into specialized subagents or incorporate multimodal
capabilities for richer data collection and analysis [85, 99].
While this paradigm is powerful, its autonomous nature presents
limitations for data-driven decision making, particularly for high-
stakes decisions where users desire agency [
35
,
82
]. For instance,
an
end-to-end
workflow
often
hides
the
intermediate
data
arti-
facts
and
manipulation
steps,
risking
producing
outcomes
that
are ungrounded, biased, or not personalized to the user’s nuanced
goals [
18
]. Although tools such as AgenticSeek [
26
] and Skyvern [
42
]
visualize
the
agent’s
decision
making
process,
the
data
artifacts
are often presented as static snapshots, limiting users’ ability to
interact
with
and
manipulate
them
directly.
Furthermore,
while
natural language is a powerful input modality for initiating tasks, it
can become a bottleneck during the analysis process. When users
need to customize or modify a data transformation pipeline, they
must revert to articulating these complex needs solely through text.
As prior work has shown, text is often not the ideal modality for
specifying the nuances of data transformation, which can be more
directly and unambiguously expressed through direct manipula-
tion [
39
,
58
,
83
,
87
]. In contrast, WebSeek proposes a data-driven
and mixed-initiative paradigm, allowing users to work around tan-
gible data artifacts for better transparency and human agency.
2.2
Web Data Extraction and Analysis
Extracting
structured
data
from
semi-structured
webpages
has
been a long-standing challenge in HCI and data management re-
search
[
24
].
Early
approaches
relied
on
programmatic
scraping
libraries like Beautiful Soup [
3
] or custom wrappers [
21
,
72
], which
are
powerful
but
require
significant
programming
expertise.
To
address
this,
a
number
of
interactive
tools
have
been
proposed,
leveraging paradigms such as Programming by Example (PBE) and
Programming by Demonstration (PBD), enabling non-programmers
to create data extractors through making data examples [
40
,
52
]
or
demonstration
the
procedure
[
9
,
12
,
75
].
Given
the
extracted
data, web data analysis, however, often happens in a different envi-
ronment. A number of commercial tools and research prototypes
have been developed for data profiling [
46
], wrangling and clean-
ing [44, 71, 89], and visualization [80, 81, 102].
Despite
technical
advances,
web
data
extraction
and
analysis
still
face
two
key
limitations.
First,
data
extraction
and
analysis
are often conducted as separate processes, lacking a unified sys-
tem or interface that allows users to seamlessly transition between
these stages and engage in iterative exploration. Second, providing
real-time,
proactive
guidance
throughout
the
entire
data
analy-
sis process remains challenging. Prior work on guidance for data
wrangling [
15
,
44
,
101
] and visualization [
92
,
93
] mostly bases rec-
ommendations on data characteristics (e.g., quality issues), though
some
visualization
tools
infer
user
intent
from
tasks
and
inter-
actions
to
suggest
charts
[
11
,
25
].
However,
most
prior
systems
infer the user’s intent from their current action (e.g., a single se-
lection or edit) within an individual stage of the overall pipeline
(e.g., extraction, wrangling, or cleaning), with limited exploration
of using longer interaction histories to provide proactive guidance
across stages. WebSeek addresses the first challenge by introducing
a data-centric human–AI collaboration paradigm within a browser
extension
that unifies these
stages. It
further investigates
when,
what, and how to provide proactive AI guidance grounded in user
interactions to tackle the second challenge.
2.3
Proactive Guidance for Data-Driven
Decision Making
Providing guidance as users interact with a system is widely recog-
nized as a key approach to lowering learning barriers, improving
task outcomes, and optimizing process efficiency [
68
,
100
]. Building
on this idea, a recent trend emphasizes
proactive
guidance: instead
of requiring users to request help, the system anticipates needs and
offers timely suggestions to streamline workflows, reduce cognitive
load, and strengthen user trust [
31
,
48
,
73
,
74
]. These methods typi-
cally infer user intent from the interaction history and data context
(e.g., quality, provenance, and usage information), and then produce
recommendations via rule-based or learned models [
19
,
53
,
63
,
64
].
With the rise of powerful LLMs, proactive AI agents that provide
real-time guidance have been adopted across various domains such
as programming [
14
,
29
,
101
], data analytics [
100
], and autonomous
driving [60].
Despite this promise, improperly designed proactive guidance
can be detrimental. Research has shown that ill-timed or irrelevant
suggestions
can
disrupt
a
user’s
workflow
and
lead
to
negative
experiences [
54
,
76
]. Moreover, users who desire agency and con-
trol may perceive proactive suggestions as intrusive, choosing to
ignore them or use them only as a “last resort” [
31
]. This highlights
a
critical
design
tension:
proactive
guidance
must
carefully
bal-
ance its potential utility against the cognitive cost of interruption.
Addressing
this
tension
requires
a
principled
approach
to
three
core
questions:
what
content
to
suggest,
when
to
trigger
it,
and
where
in
the
interface
to
display
it.
While
researchers
have
pro-
posed general design guidelines or studied a dimension of these
questions [
65
,
67
,
77
,
78
,
90
], there is a lack of frameworks that sys-
tematically address all these questions in specific domains. WebSeek
contributes to this space by proposing and instantiating a detailed
design space for proactive assistance in the context of data-driven
sensemaking on the web, providing a concrete model for creating
effective, non-disruptive web data analysis tools.
CHI ’26, April 13–17, 2026, Barcelona, Spain
Yanwei Huang and Arpit Narechania
3
A framework for mixed-initiative assistance
in data tasks on the web
WebSeek envisions enhancing data-driven decision making on the
web with efficient human-AI collaboration centered on tangible data
instances. However, during the design process, we soon observed
two research questions that are crucial to the design decisions. First,
what kinds of data tasks are involved in the process of data-
driven decision making on the web?
Despite the rich literature
on general data analysis or decision making process [
6
,
45
,
47
,
62
],
existing models need to be properly adapted to accommodate the
nuanced web environment, accounting for the specific, low-level
actions
users
may
perform.
Second,
having
identified
these
spe-
cific tasks, a natural follow-up question emerged:
how can an AI
proactively and reactively assist users across this diverse set
of tasks in a helpful and non-intrusive manner?
This ques-
tion exposes the central tension in designing any mixed-initiative
system: balancing the potential benefits of AI automation against
the cognitive cost of interruption and the risk of undermining user
agency [
35
,
76
]. The optimal way for an AI to assist with a small,
well-defined task like autocompleting a column is fundamentally
different from how it should suggest a complex, strategic action like
joining two tables or generating a new visualization. A one-size-
fits-all approach to assistance would inevitably lead to a frustrating
user experience.
To address these questions, we envisioned a structured design
space that would serve as the conceptual backbone for WebSeek’s
AI capabilities. To develop it, the authors of this paper, who are also
experienced data analysts themselves, initiated a draft of the space
and revised it through multiple rounds of discussion. During the
process, we particularly focused on three core research questions
summarized by us: a) When should the AI guidance be triggered?
b)
What
should
the
AI
guidance
include?
c)
How
should
the
AI
guidance be communicated to the users? In addition, we reflected
on the space by reviewing well-known theories and principles on
mixed-initiative and general UI design [
37
,
57
] after the discussion.
3.1
Proactive Assistance
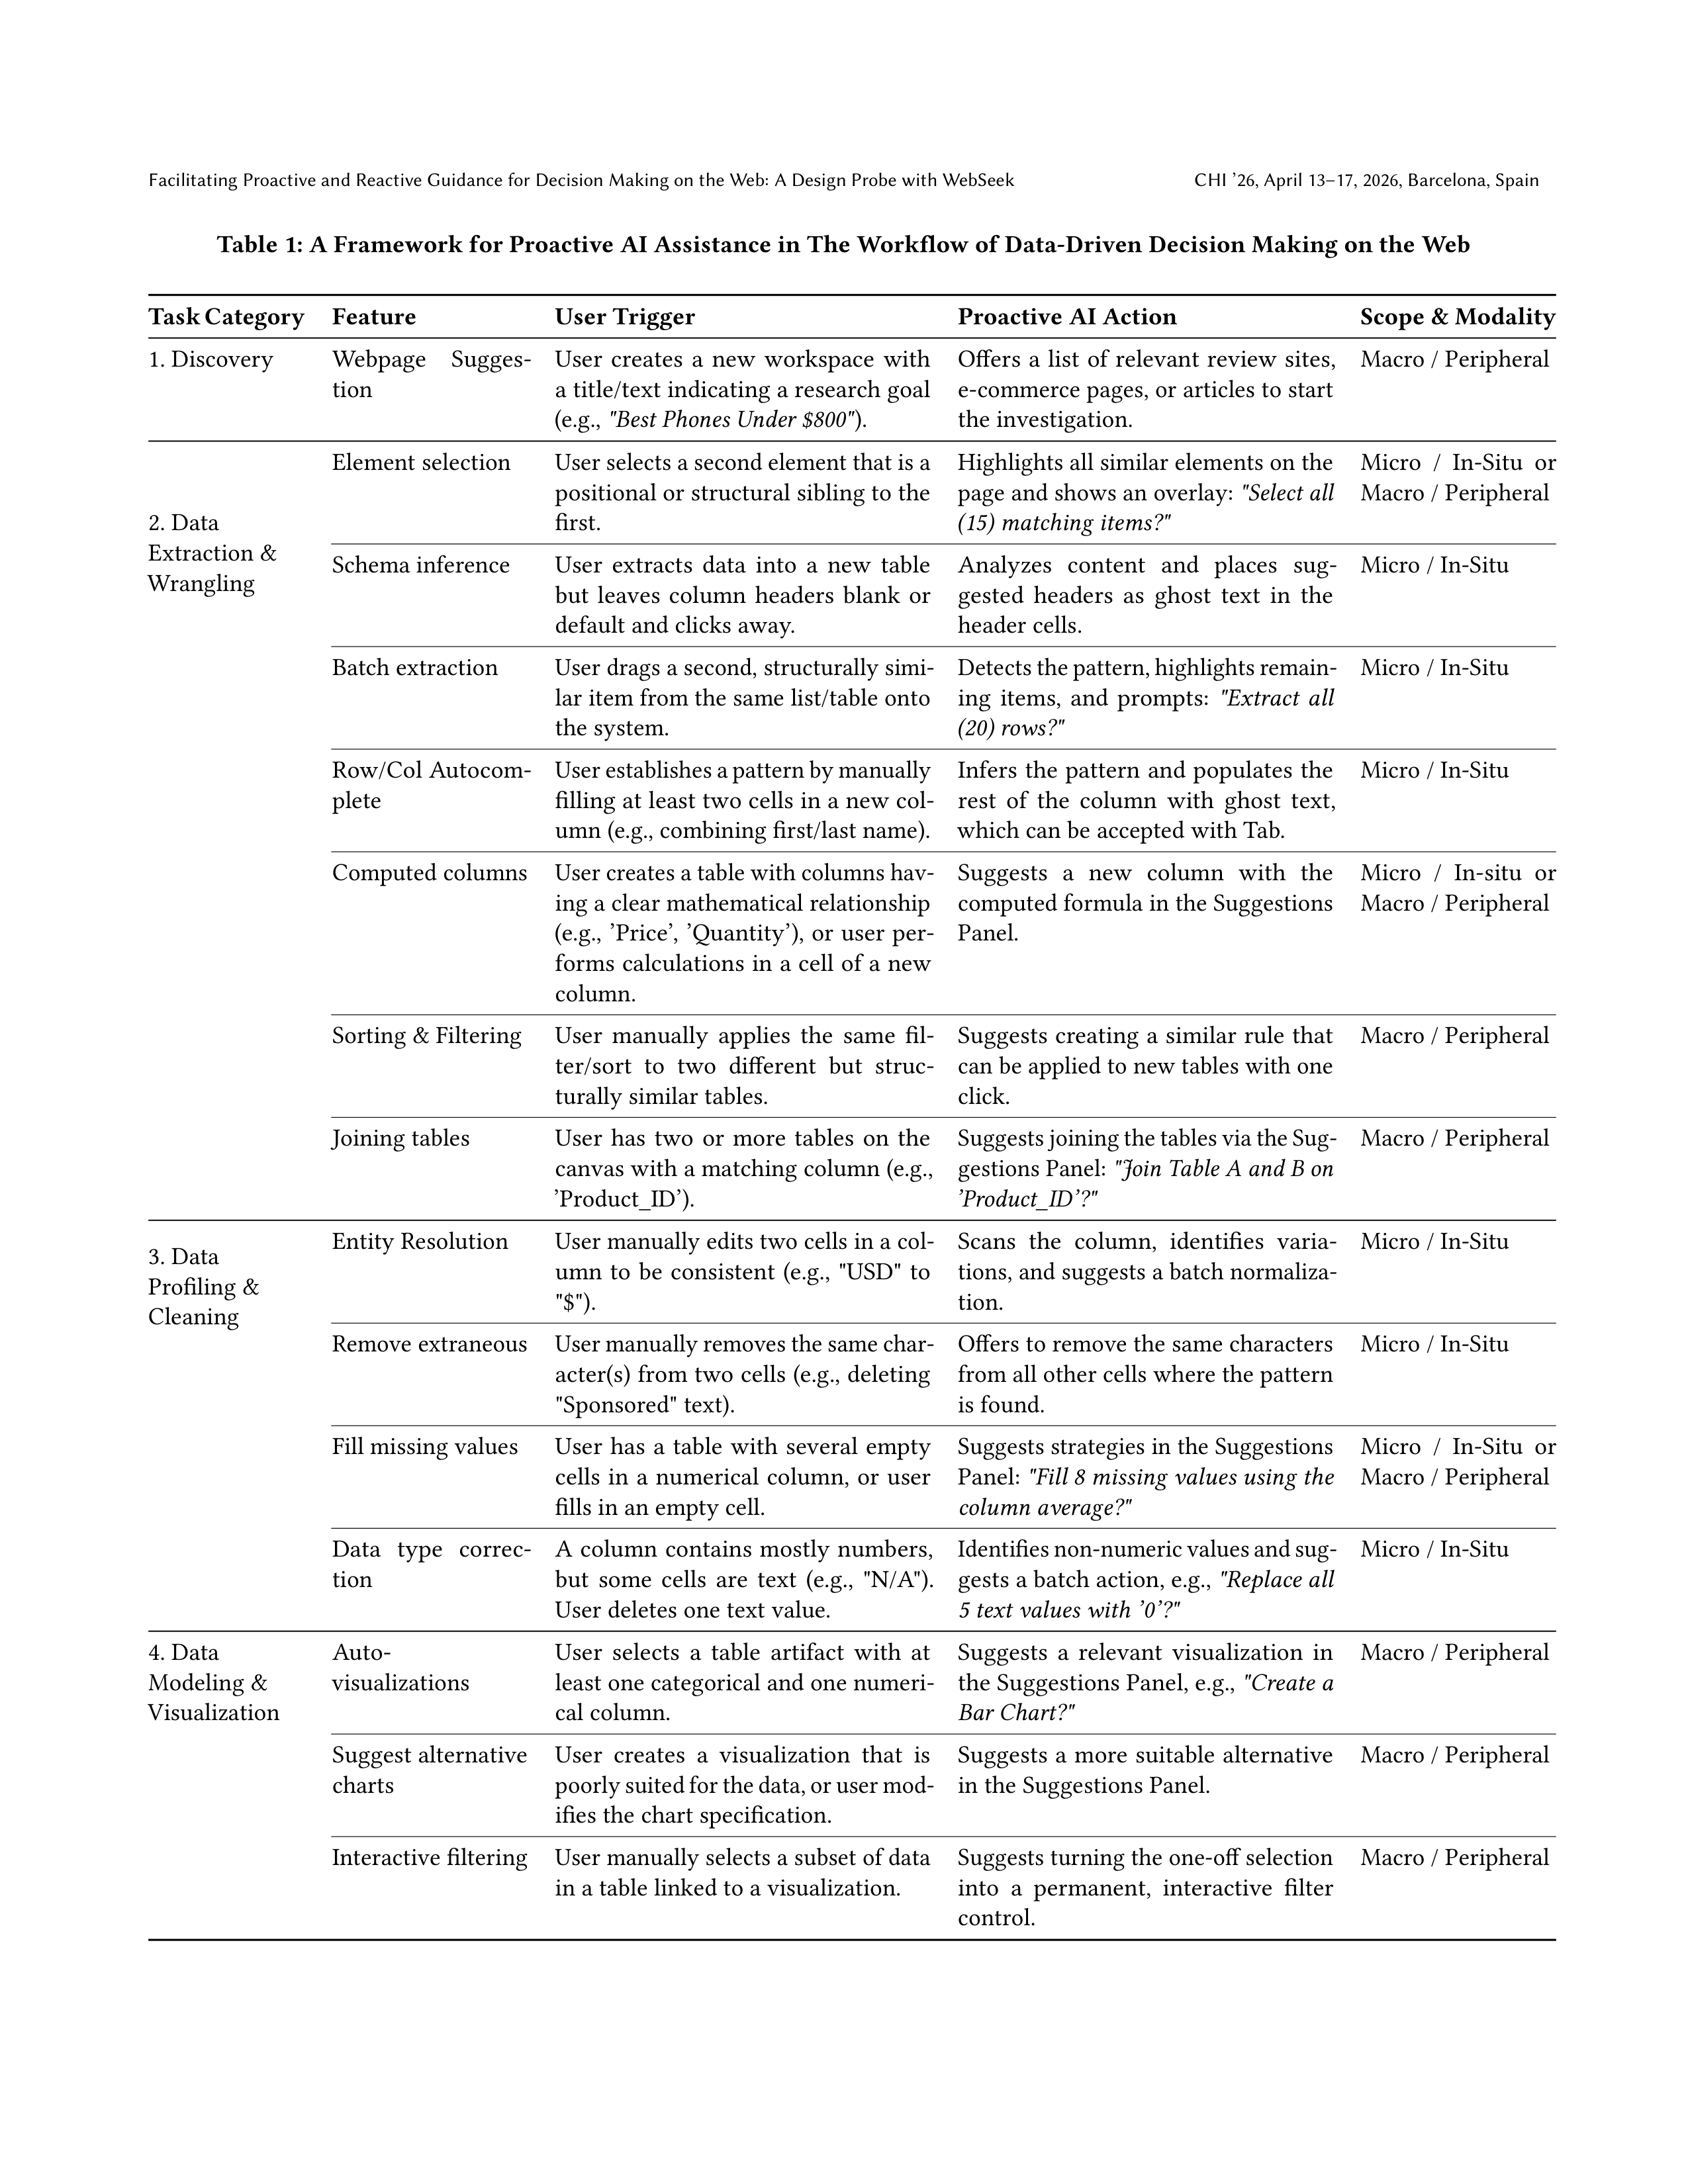
The framework, summarized in Table 1, provides a principled ap-
proach to designing proactive AI assistance for web data tasks. It
answers the first question by adapting the empirically-grounded
taxonomy
of
enterprise
data
analysis
from
Kandel
et
al.
[
45
]
to
the specific context of the web, categorizing tasks into four stages:
Discovery, Data Extraction & Wrangling, Data Profiling & Cleaning,
and Data Modeling & Visualization
2
. We have also summarized a
list of features by adapating the subtasks in their taxonomy to the
context of web data analysis. Crucially, the framework answers the
second question by defining the scope and modality of AI assistance
for each task. We distinguish between
micro
suggestions, which
are small, efficiency-focused actions that accelerate a user’s current
activity (e.g., autocompleting data), and
macro
suggestions, which
are larger, strategic actions that propose a new direction (e.g., cre-
ating a chart). Our guiding principle is to match the suggestion’s
2
The words “Extraction”, “Cleaning”, and “Visualization” do not exist in the original
space by Kandel et al. but are mentioned in the subcategories. These terms are com-
monly used in data science and we add them to the category names to better align
with web tasks.
scope to its presentation modality: micro suggestions are presented
in-situ
, directly within the user’s focus, while macro suggestions
are presented
peripherally
(i.e., ex-situ) in a dedicated panel to
avoid disrupting the user’s flow. Finally, we heuristically decided
the user triggering signal, the potential proactive actions of AI, and
the scope and modality of the guidance, with the validity examined
iteratively through our design process.
3.2
Reactive Assistance and User Manipulation
While proactive assistance offers efficiency and automation, it is
equally
important
to
allow
users
to
seek
AI
assitance
reactively
or manually interact in the system to guarantee user agency [
35
].
Similar to the proactive assistance, the suitability of an interaction
also varies between tasks. For instance, selecting specific elements
on a webpage is naturally suited to direct manipulation, whereas
extracting a list of data from webpages might be more efficiently
expressed
through
demonstration
or
examples.
Meanwhile,
it
is
crucial for us to figure out how interactions can be designed around
the tangible data artifacts that we envision our system to focus on.
These factors motivate us to construct a design space that maps
tasks and features to feasible interaction modalities.
To systematically understand this design landscape, we surveyed
prior work to identify the spectrum of interaction modalities that
have been applied to web data tasks, ranging from imperative ap-
proaches like Coding and domain-specific languages (DSL) to more
intuitive
methods
like
programming
by
Demonstration
[
20
]
or
Example [
32
], and modern approaches like textual prompt-based
(natural
language)
[
7
]
and
visual
prompt-based
(annotation
and
sketches) [95] interactions.
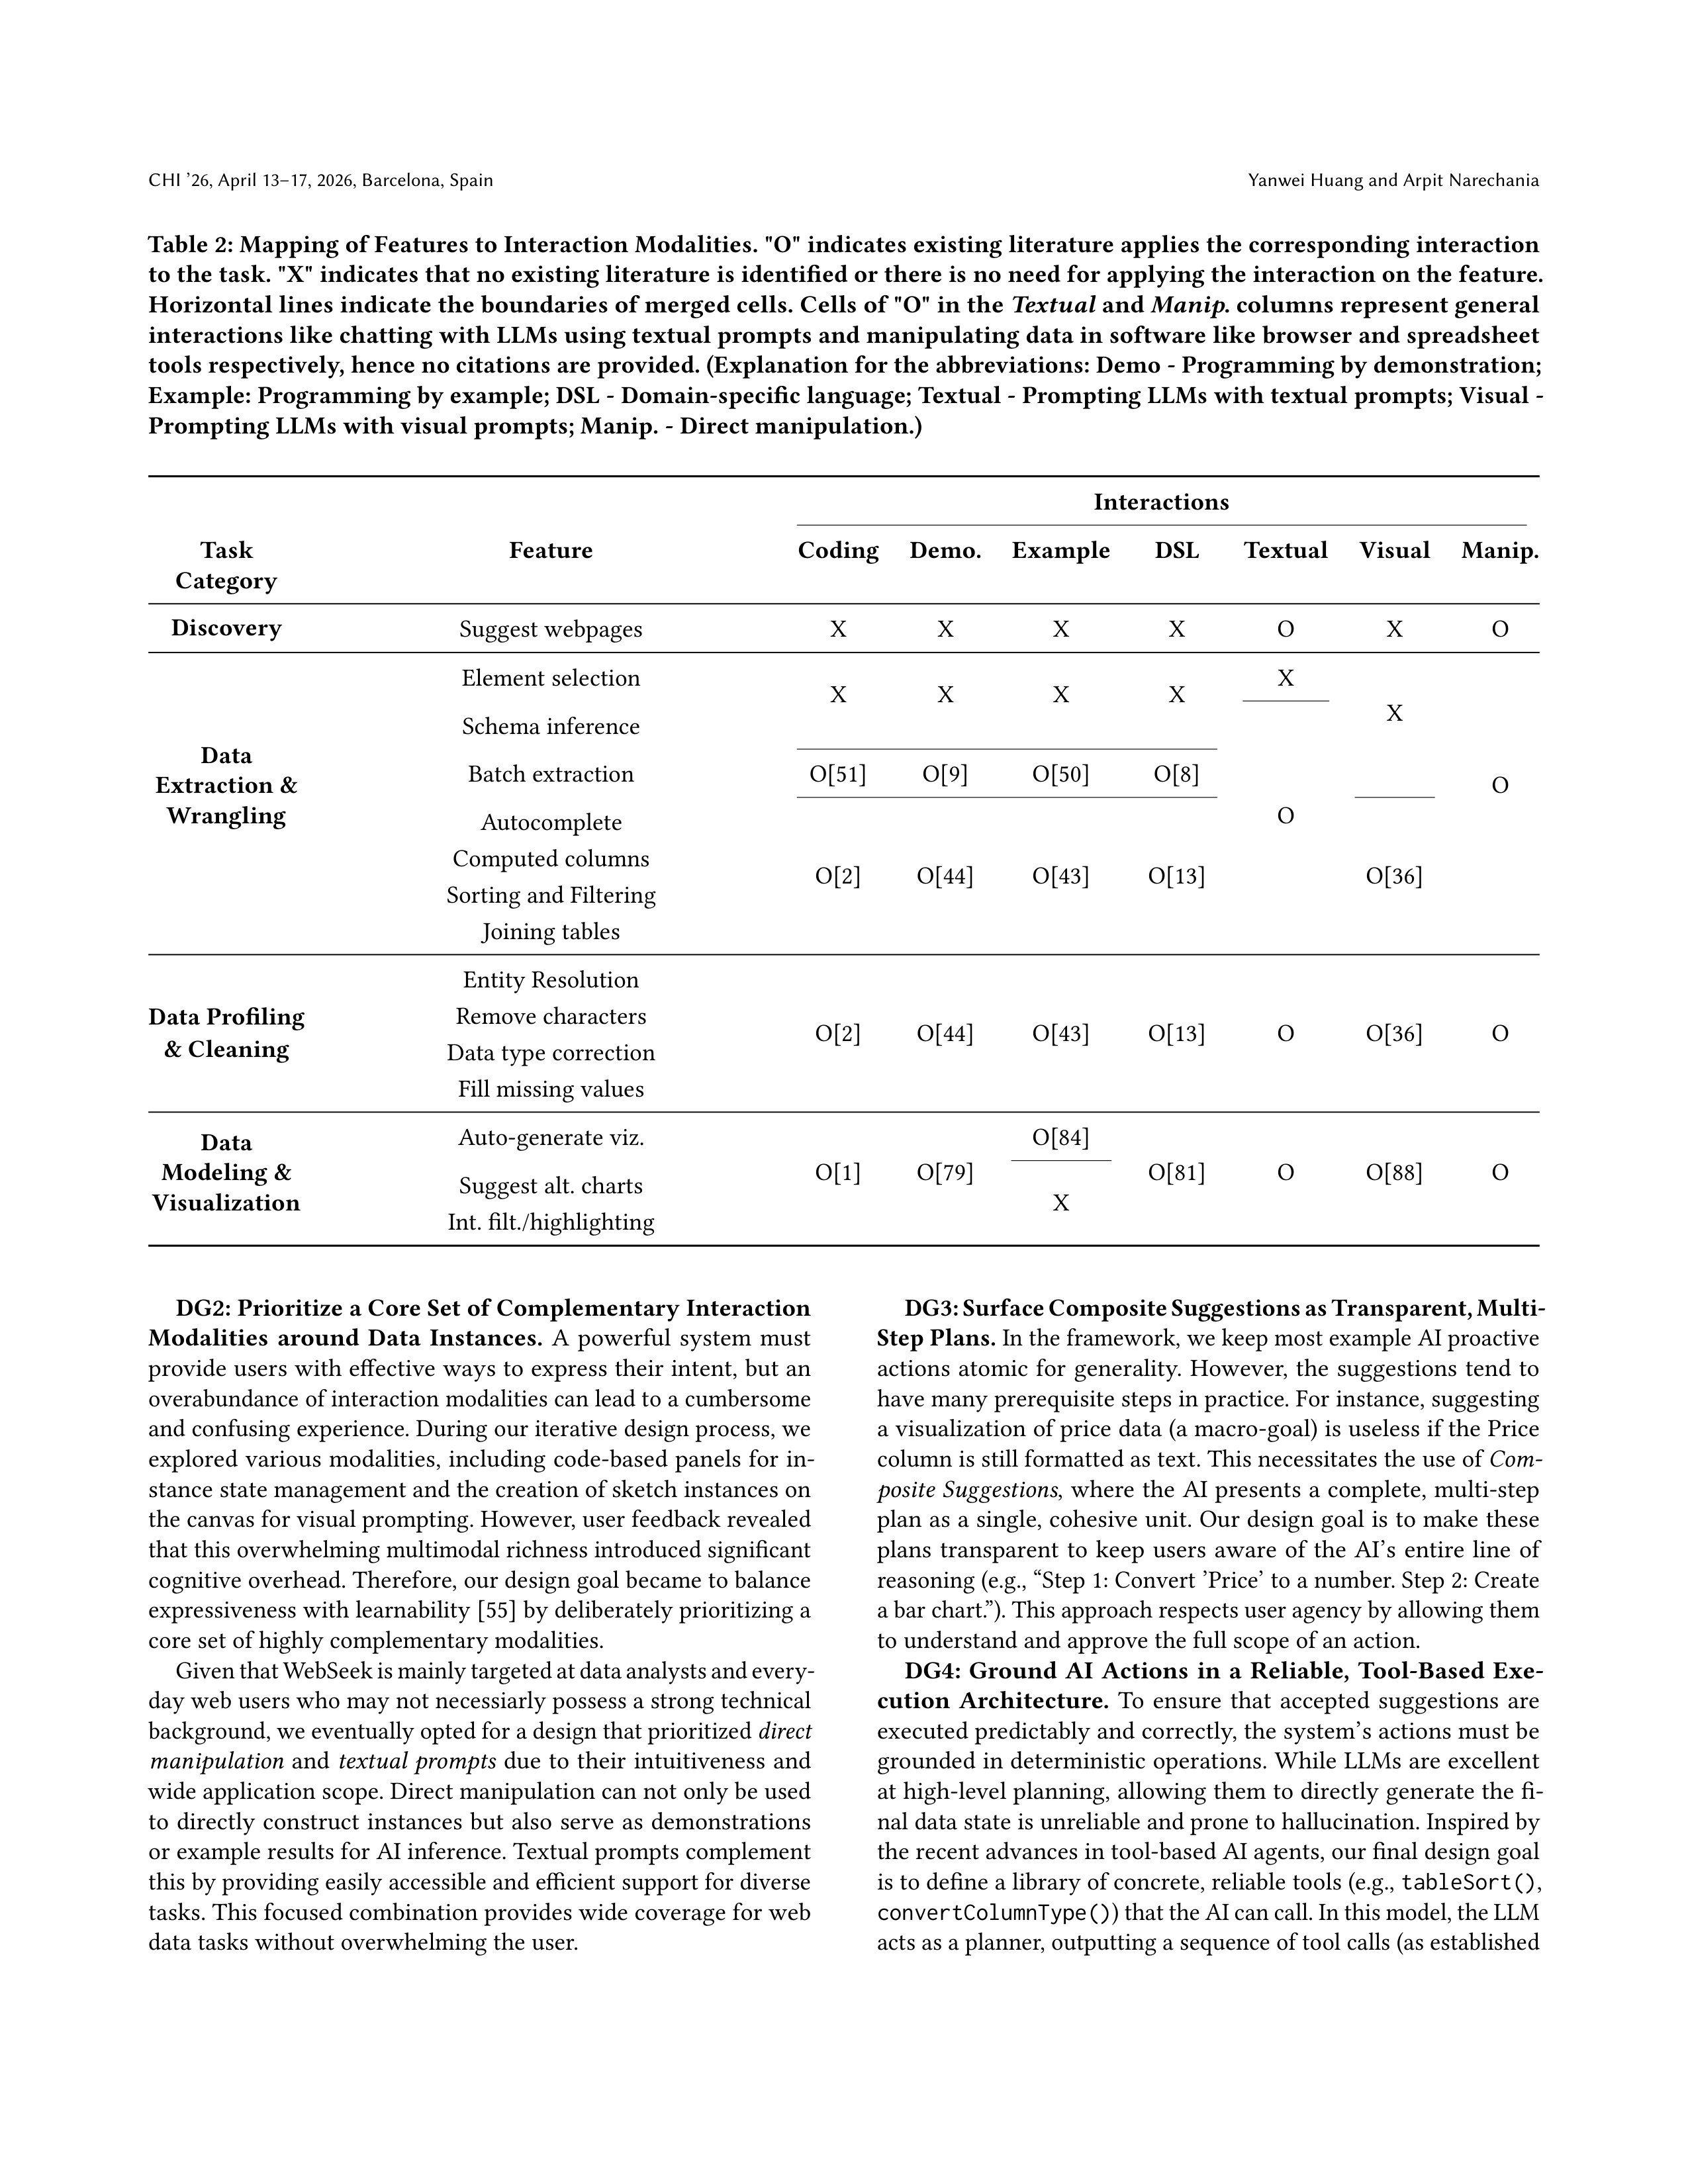
Table 2 presents the result space, mapping the data features from
our design space against these seven distinct interaction modali-
ties. Note that textual prompts and direct manipulation offer the
broadest and most intuitive coverage for various web-based tasks.
This informed WebSeek’s data instance-oriented design: the data
instances serve as a universal interaction unit which, ideally, can be
directly manipulated to demonstrate user intent or build data exam-
ples, while being manageable through other interaction modalities.
4
Design Goals
Applying
our
framework
to
the
practical
design
of
WebSeek
re-
vealed several intricacies of real-world, web-based sensemaking.
To address these, we distilled our learnings into four core design
goals. These goals guided the system’s implementation and serve
as prescriptive principles for future mixed-initiative data tools.
DG1: Infer User Intent from Holistic Interaction Context.
To provide truly helpful assistance, the AI must move beyond sim-
ple triggers and infer user intent from a rich, holistic view of the
user’s context. A single interaction cue, such as selecting a table,
is an ambiguous signal on its own. We posit that the system must
synthesize information from the full spectrum of available context,
including: the current system state (e.g., the artifacts on the can-
vas), the user’s recent interaction history, the specific webpage and
system view the user is focused on, and the conversational history
with the AI. By integrating these multiple signals, the system can
build a more accurate model of the user’s immediate goal, forming
the foundation for more relevant and timely assistance.
Facilitating Proactive and Reactive Guidance for Decision Making on the Web: A Design Probe with WebSeek
CHI ’26, April 13–17, 2026, Barcelona, Spain
Table 1: A Framework for Proactive AI Assistance in The Workflow of Data-Driven Decision Making on the Web
Task Category
Feature
User Trigger
Proactive AI Action
Scope & Modality
1. Discovery
Webpage
Sugges-
tion
User
creates
a
new
workspace
with
a title/text indicating a research goal
(e.g.,
"Best Phones Under $800"
).
Offers
a
list
of
relevant
review
sites,
e-commerce pages, or articles to start
the investigation.
Macro / Peripheral
2. Data
Extraction &
Wrangling
Element selection
User selects a second element that is a
positional or structural sibling to the
first.
Highlights all similar elements on the
page and shows an overlay:
"Select all
(15) matching items?"
Micro
/
In-Situ
or
Macro / Peripheral
Schema inference
User
extracts
data
into
a
new
table
but
leaves
column
headers
blank
or
default and clicks away.
Analyzes
content
and
places
sug-
gested
headers
as
ghost
text
in
the
header cells.
Micro / In-Situ
Batch extraction
User drags a second, structurally simi-
lar item from the same list/table onto
the system.
Detects the pattern, highlights remain-
ing
items,
and
prompts:
"Extract
all
(20) rows?"
Micro / In-Situ
Row/Col Autocom-
plete
User establishes a pattern by manually
filling at least two cells in a new col-
umn (e.g., combining first/last name).
Infers
the
pattern
and
populates
the
rest
of
the
column
with
ghost
text,
which can be accepted with Tab.
Micro / In-Situ
Computed columns
User creates a table with columns hav-
ing a clear mathematical relationship
(e.g., ’Price’, ’Quantity’), or user per-
forms calculations in a cell of a new
column.
Suggests
a
new
column
with
the
computed formula in the Suggestions
Panel.
Micro
/
In-situ
or
Macro / Peripheral
Sorting & Filtering
User
manually
applies
the
same
fil-
ter/sort
to
two
different
but
struc-
turally similar tables.
Suggests creating a similar rule that
can be applied to new tables with one
click.
Macro / Peripheral
Joining tables
User
has
two
or
more
tables
on
the
canvas with a matching column (e.g.,
’Product_ID’).
Suggests joining the tables via the Sug-
gestions Panel:
"Join Table A and B on
’Product_ID’?"
Macro / Peripheral
3. Data
Profiling &
Cleaning
Entity Resolution
User manually edits two cells in a col-
umn
to
be
consistent
(e.g.,
"USD"
to
"$").
Scans
the
column,
identifies
varia-
tions, and suggests a batch normaliza-
tion.
Micro / In-Situ
Remove extraneous
User manually removes the same char-
acter(s) from two cells (e.g., deleting
"Sponsored" text).
Offers to remove the same characters
from all other cells where the pattern
is found.
Micro / In-Situ
Fill missing values
User
has
a
table
with
several
empty
cells
in
a
numerical
column,
or
user
fills in an empty cell.
Suggests strategies in the Suggestions
Panel:
"Fill 8 missing values using the
column average?"
Micro
/
In-Situ
or
Macro / Peripheral
Data
type
correc-
tion
A
column
contains
mostly
numbers,
but
some
cells
are
text
(e.g.,
"N/A").
User deletes one text value.
Identifies non-numeric values and sug-
gests a batch action, e.g.,
"Replace all
5 text values with ’0’?"
Micro / In-Situ
4. Data
Modeling &
Visualization
Auto-
visualizations
User
selects
a
table
artifact
with
at
least one categorical and one numeri-
cal column.
Suggests
a
relevant
visualization
in
the Suggestions Panel, e.g.,
"Create a
Bar Chart?"
Macro / Peripheral
Suggest alternative
charts
User
creates
a
visualization
that
is
poorly suited for the data, or user mod-
ifies the chart specification.
Suggests
a
more
suitable
alternative
in the Suggestions Panel.
Macro / Peripheral
Interactive filtering
User manually selects a subset of data
in a table linked to a visualization.
Suggests turning the one-off selection
into
a
permanent,
interactive
filter
control.
Macro / Peripheral
CHI ’26, April 13–17, 2026, Barcelona, Spain
Yanwei Huang and Arpit Narechania
Table 2: Mapping of Features to Interaction Modalities. "O" indicates existing literature applies the corresponding interaction
to the task. "X" indicates that no existing literature is identified or there is no need for applying the interaction on the feature.
Horizontal lines indicate the boundaries of merged cells. Cells of "O" in the
Textual
and
Manip.
columns represent general
interactions like chatting with LLMs using textual prompts and manipulating data in software like browser and spreadsheet
tools respectively, hence no citations are provided. (Explanation for the abbreviations: Demo - Programming by demonstration;
Example: Programming by example; DSL - Domain-specific language; Textual - Prompting LLMs with textual prompts; Visual -
Prompting LLMs with visual prompts; Manip. - Direct manipulation.)
Interactions
Task
Category
Feature
Coding
Demo.
Example
DSL
Textual
Visual
Manip.
Discovery
Suggest webpages
X
X
X
X
O
X
O
Data
Extraction &
Wrangling
Element selection
X
X
X
X
X
X
O
Schema inference
O
Batch extraction
O[51]
O[9]
O[50]
O[8]
Autocomplete
O[2]
O[44]
O[43]
O[13]
O[36]
Computed columns
Sorting and Filtering
Joining tables
Data Profiling
& Cleaning
Entity Resolution
O[2]
O[44]
O[43]
O[13]
O
O[36]
O
Remove characters
Data type correction
Fill missing values
Data
Modeling &
Visualization
Auto-generate viz.
O[1]
O[79]
O[84]
O[81]
O
O[88]
O
Suggest alt. charts
X
Int. filt./highlighting
DG2: Prioritize a Core Set of Complementary Interaction
Modalities
around
Data
Instances.
A
powerful
system
must
provide users with effective ways to express their intent, but an
overabundance of interaction modalities can lead to a cumbersome
and confusing experience. During our iterative design process, we
explored
various
modalities,
including
code-based
panels
for
in-
stance state management and the creation of sketch instances on
the canvas for visual prompting. However, user feedback revealed
that this overwhelming multimodal richness introduced significant
cognitive overhead. Therefore, our design goal became to balance
expressiveness with learnability [
55
] by deliberately prioritizing a
core set of highly complementary modalities.
Given that WebSeek is mainly targeted at data analysts and every-
day web users who may not necessiarly possess a strong technical
background, we eventually opted for a design that prioritized
direct
manipulation
and
textual
prompts
due
to
their
intuitiveness
and
wide application scope. Direct manipulation can not only be used
to
directly
construct
instances
but
also
serve
as
demonstrations
or example results for AI inference. Textual prompts complement
this by providing easily accessible and efficient support for diverse
tasks. This focused combination provides wide coverage for web
data tasks without overwhelming the user.
DG3: Surface Composite Suggestions as Transparent, Multi-
Step Plans.
In the framework, we keep most example AI proactive
actions
atomic
for
generality.
However,
the
suggestions
tend
to
have many prerequisite steps in practice. For instance, suggesting
a visualization of price data (a macro-goal) is useless if the Price
column is still formatted as text. This necessitates the use of
Com-
posite Suggestions
, where the AI presents a complete, multi-step
plan as a single, cohesive unit. Our design goal is to make these
plans
transparent
to
keep
users
aware
of
the
AI’s
entire
line
of
reasoning (e.g., “Step 1: Convert ’Price’ to a number. Step 2: Create
a bar chart.”). This approach respects user agency by allowing them
to understand and approve the full scope of an action.
DG4:
Ground
AI
Actions
in
a
Reliable,
Tool-Based
Exe-
cution
Architecture.
To
ensure
that
accepted
suggestions
are
executed predictably and correctly, the system’s actions must be
grounded in deterministic operations. While LLMs are excellent
at high-level planning, allowing them to directly generate the fi-
nal data state is unreliable and prone to hallucination. Inspired by
the recent advances in tool-based AI agents, our final design goal
is to define a library of concrete, reliable tools (e.g.,
tableSort()
,
convertColumnType()
) that the AI can call. In this model, the LLM
acts as a planner, outputting a sequence of tool calls (as established


Facilitating Proactive and Reactive Guidance for Decision Making on the Web: A Design Probe with WebSeek
CHI ’26, April 13–17, 2026, Barcelona, Spain
Image
Name
Price
A
B
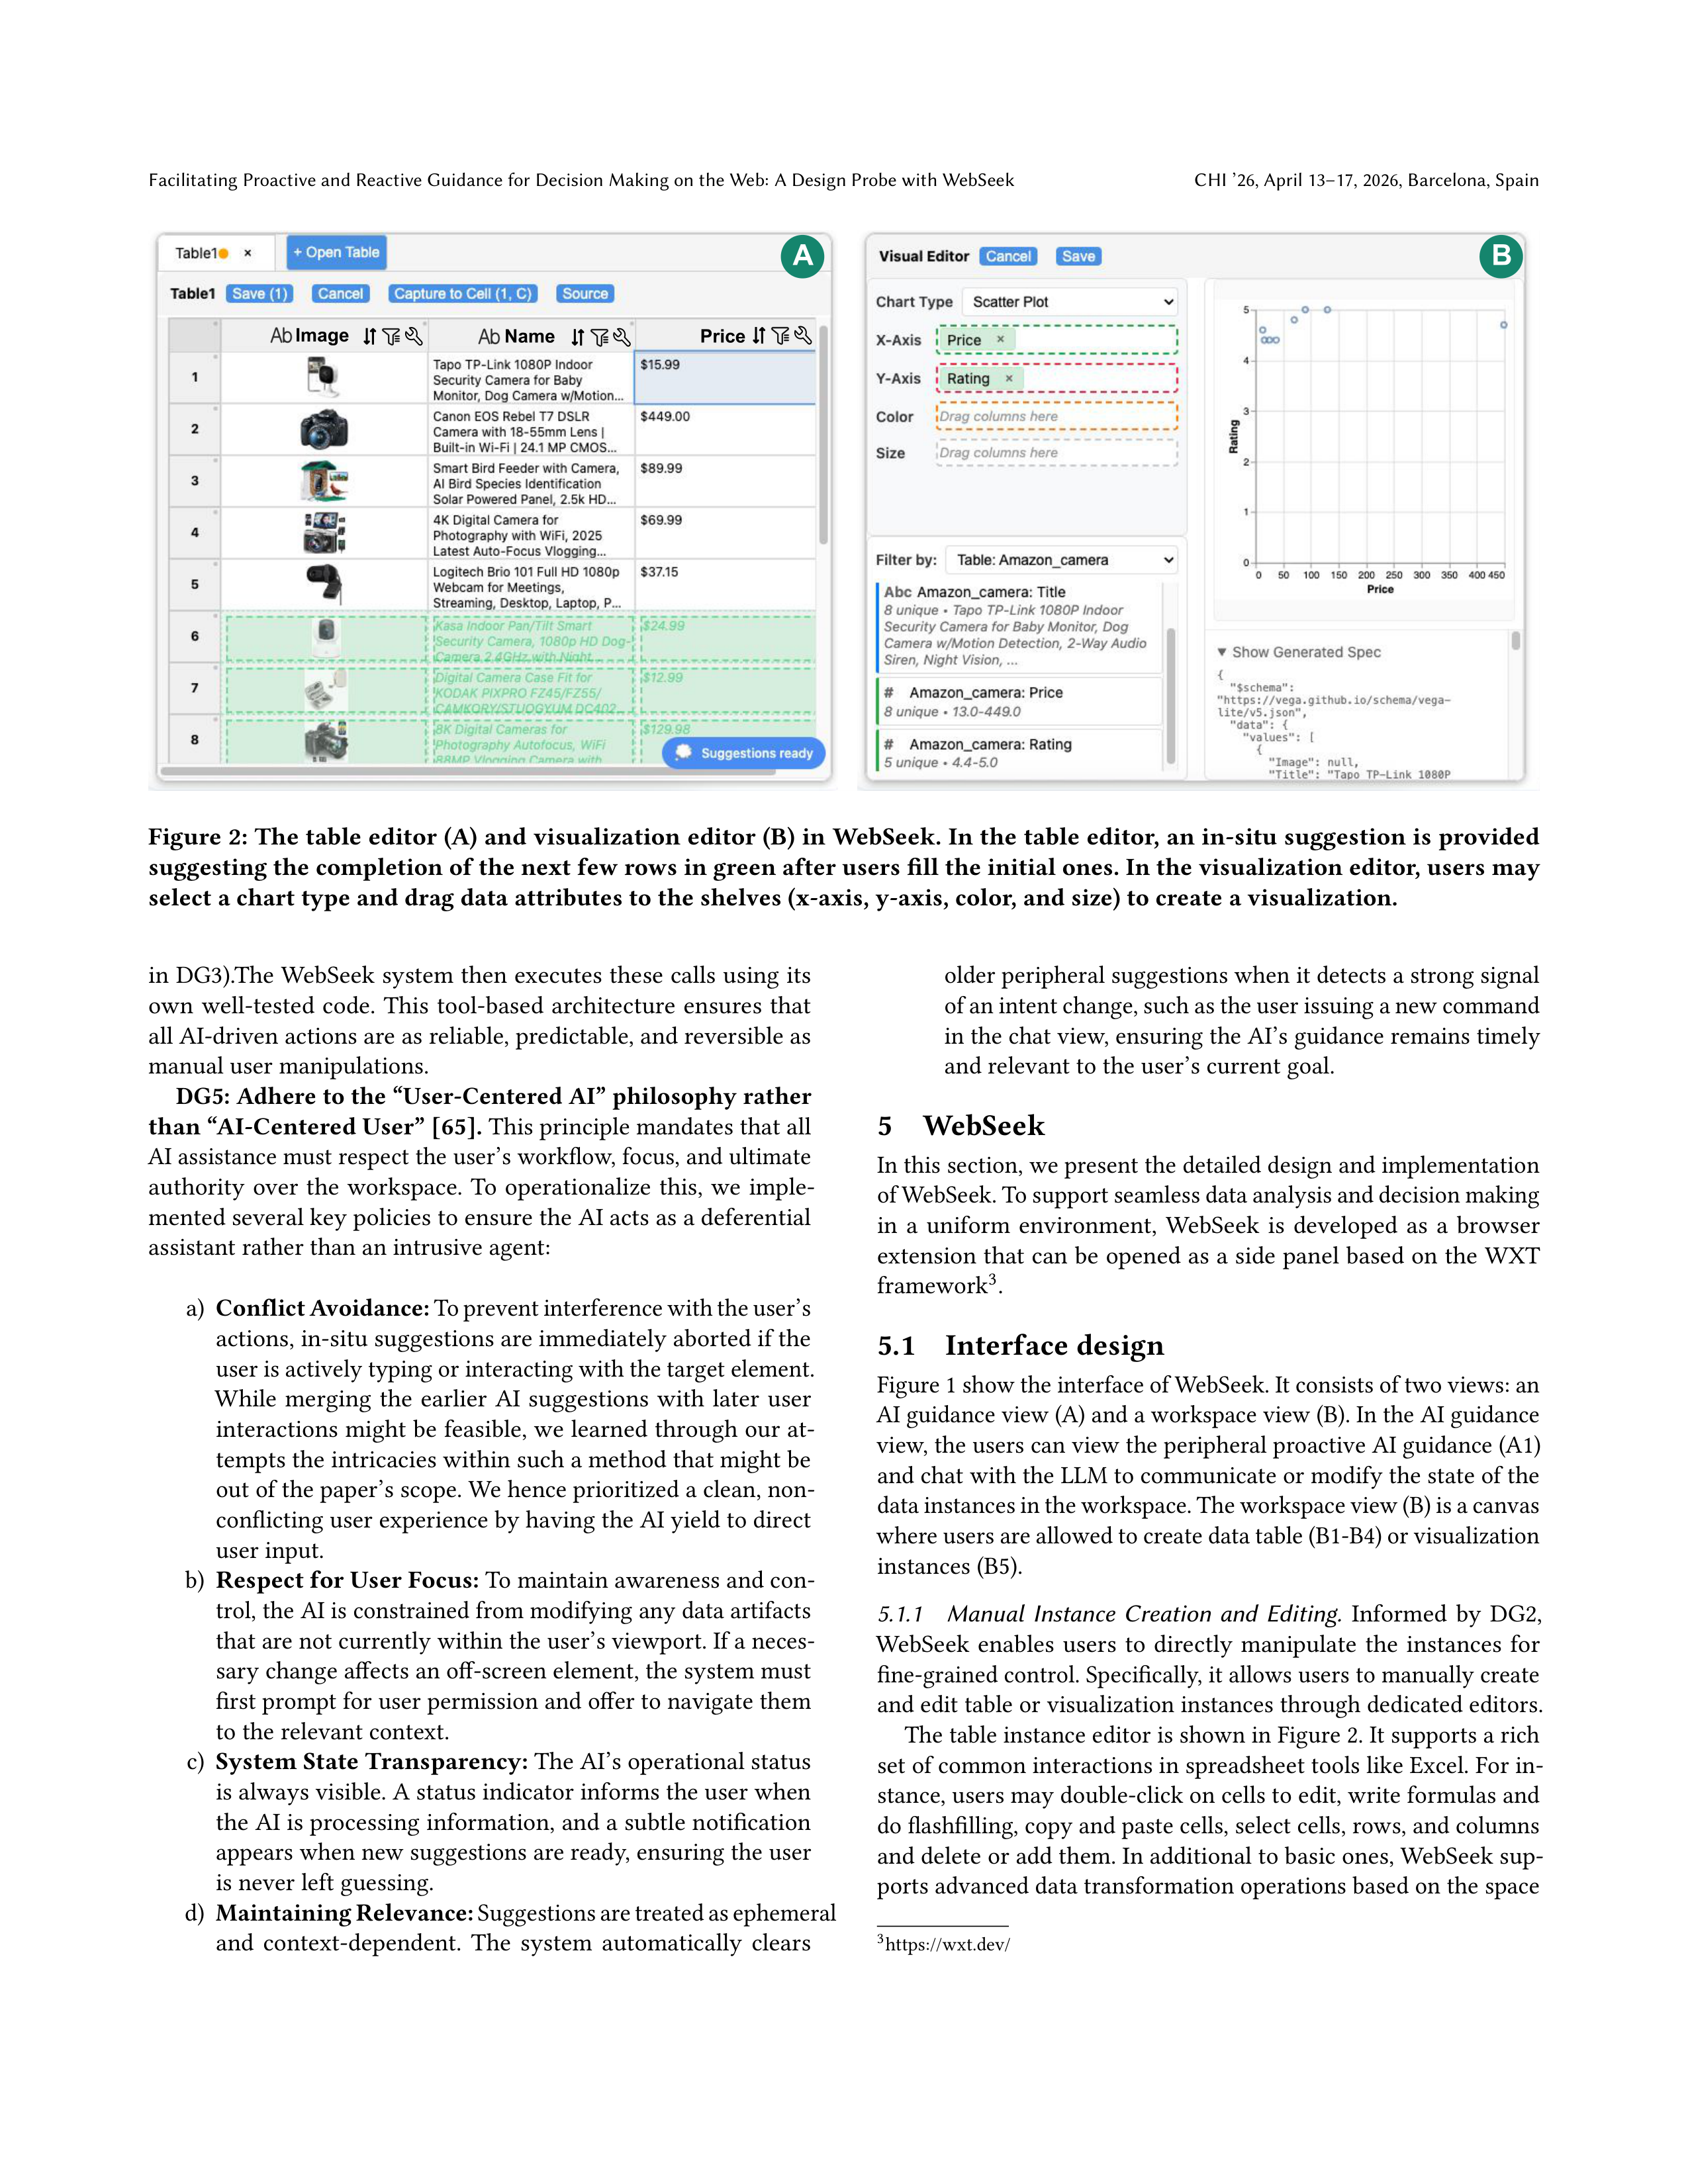
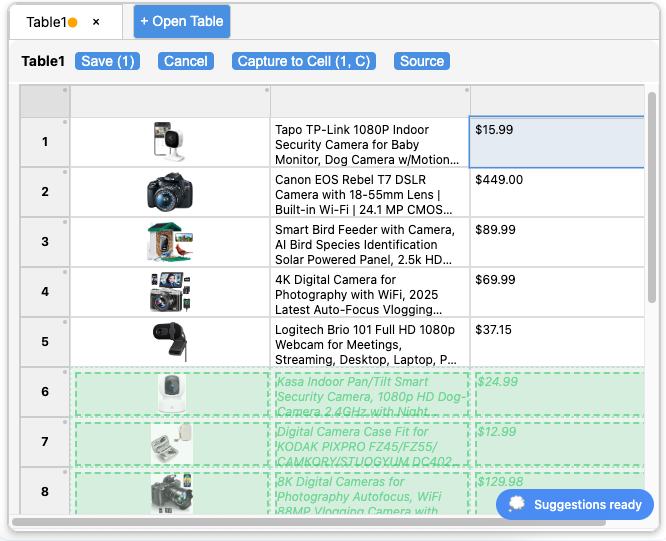
Figure 2: The table editor (A) and visualization editor (B) in WebSeek. In the table editor, an in-situ suggestion is provided
suggesting the completion of the next few rows in green after users fill the initial ones. In the visualization editor, users may
select a chart type and drag data attributes to the shelves (x-axis, y-axis, color, and size) to create a visualization.
in DG3).The WebSeek system then executes these calls using its
own
well-tested
code.
This
tool-based
architecture
ensures
that
all AI-driven actions are as reliable, predictable, and reversible as
manual user manipulations.
DG5: Adhere to the “User-Centered AI” philosophy rather
than “AI-Centered User” [
65
].
This principle mandates that all
AI assistance must respect the user’s workflow, focus, and ultimate
authority
over
the
workspace.
To
operationalize
this,
we
imple-
mented several key policies to ensure the AI acts as a deferential
assistant rather than an intrusive agent:
a)
Conflict Avoidance:
To prevent interference with the user’s
actions, in-situ suggestions are immediately aborted if the
user is actively typing or interacting with the target element.
While
merging
the
earlier
AI
suggestions
with
later
user
interactions might be feasible, we learned through our at-
tempts the intricacies within such a method that might be
out of the paper’s scope. We hence prioritized a clean, non-
conflicting user experience by having the AI yield to direct
user input.
b)
Respect for User Focus:
To maintain awareness and con-
trol, the AI is constrained from modifying any data artifacts
that are not currently within the user’s viewport. If a neces-
sary change affects an off-screen element, the system must
first prompt for user permission and offer to navigate them
to the relevant context.
c)
System State Transparency:
The AI’s operational status
is always visible. A status indicator informs the user when
the AI is processing information, and a subtle notification
appears when new suggestions are ready, ensuring the user
is never left guessing.
d)
Maintaining Relevance:
Suggestions are treated as ephemeral
and
context-dependent.
The
system
automatically
clears
older peripheral suggestions when it detects a strong signal
of an intent change, such as the user issuing a new command
in the chat view, ensuring the AI’s guidance remains timely
and relevant to the user’s current goal.
5
WebSeek
In this section, we present the detailed design and implementation
of WebSeek. To support seamless data analysis and decision making
in
a
uniform
environment,
WebSeek
is
developed
as
a
browser
extension that can be opened as a side panel based on the WXT
framework
3
.
5.1
Interface design
Figure 1 show the interface of WebSeek. It consists of two views: an
AI guidance view (A) and a workspace view (B). In the AI guidance
view, the users can view the peripheral proactive AI guidance (A1)
and chat with the LLM to communicate or modify the state of the
data instances in the workspace. The workspace view (B) is a canvas
where users are allowed to create data table (B1-B4) or visualization
instances (B5).
5.1.1
Manual
Instance
Creation
and
Editing.
Informed
by
DG2,
WebSeek
enables
users
to
directly
manipulate
the
instances
for
fine-grained control. Specifically, it allows users to manually create
and edit table or visualization instances through dedicated editors.
The table instance editor is shown in Figure 2. It supports a rich
set of common interactions in spreadsheet tools like Excel. For in-
stance, users may double-click on cells to edit, write formulas and
do flashfilling, copy and paste cells, select cells, rows, and columns
and delete or add them. In additional to basic ones, WebSeek sup-
ports advanced data transformation operations based on the space
3
https://wxt.dev/







CHI ’26, April 13–17, 2026, Barcelona, Spain
Yanwei Huang and Arpit Narechania
A
C
B
A
E
D
C
B
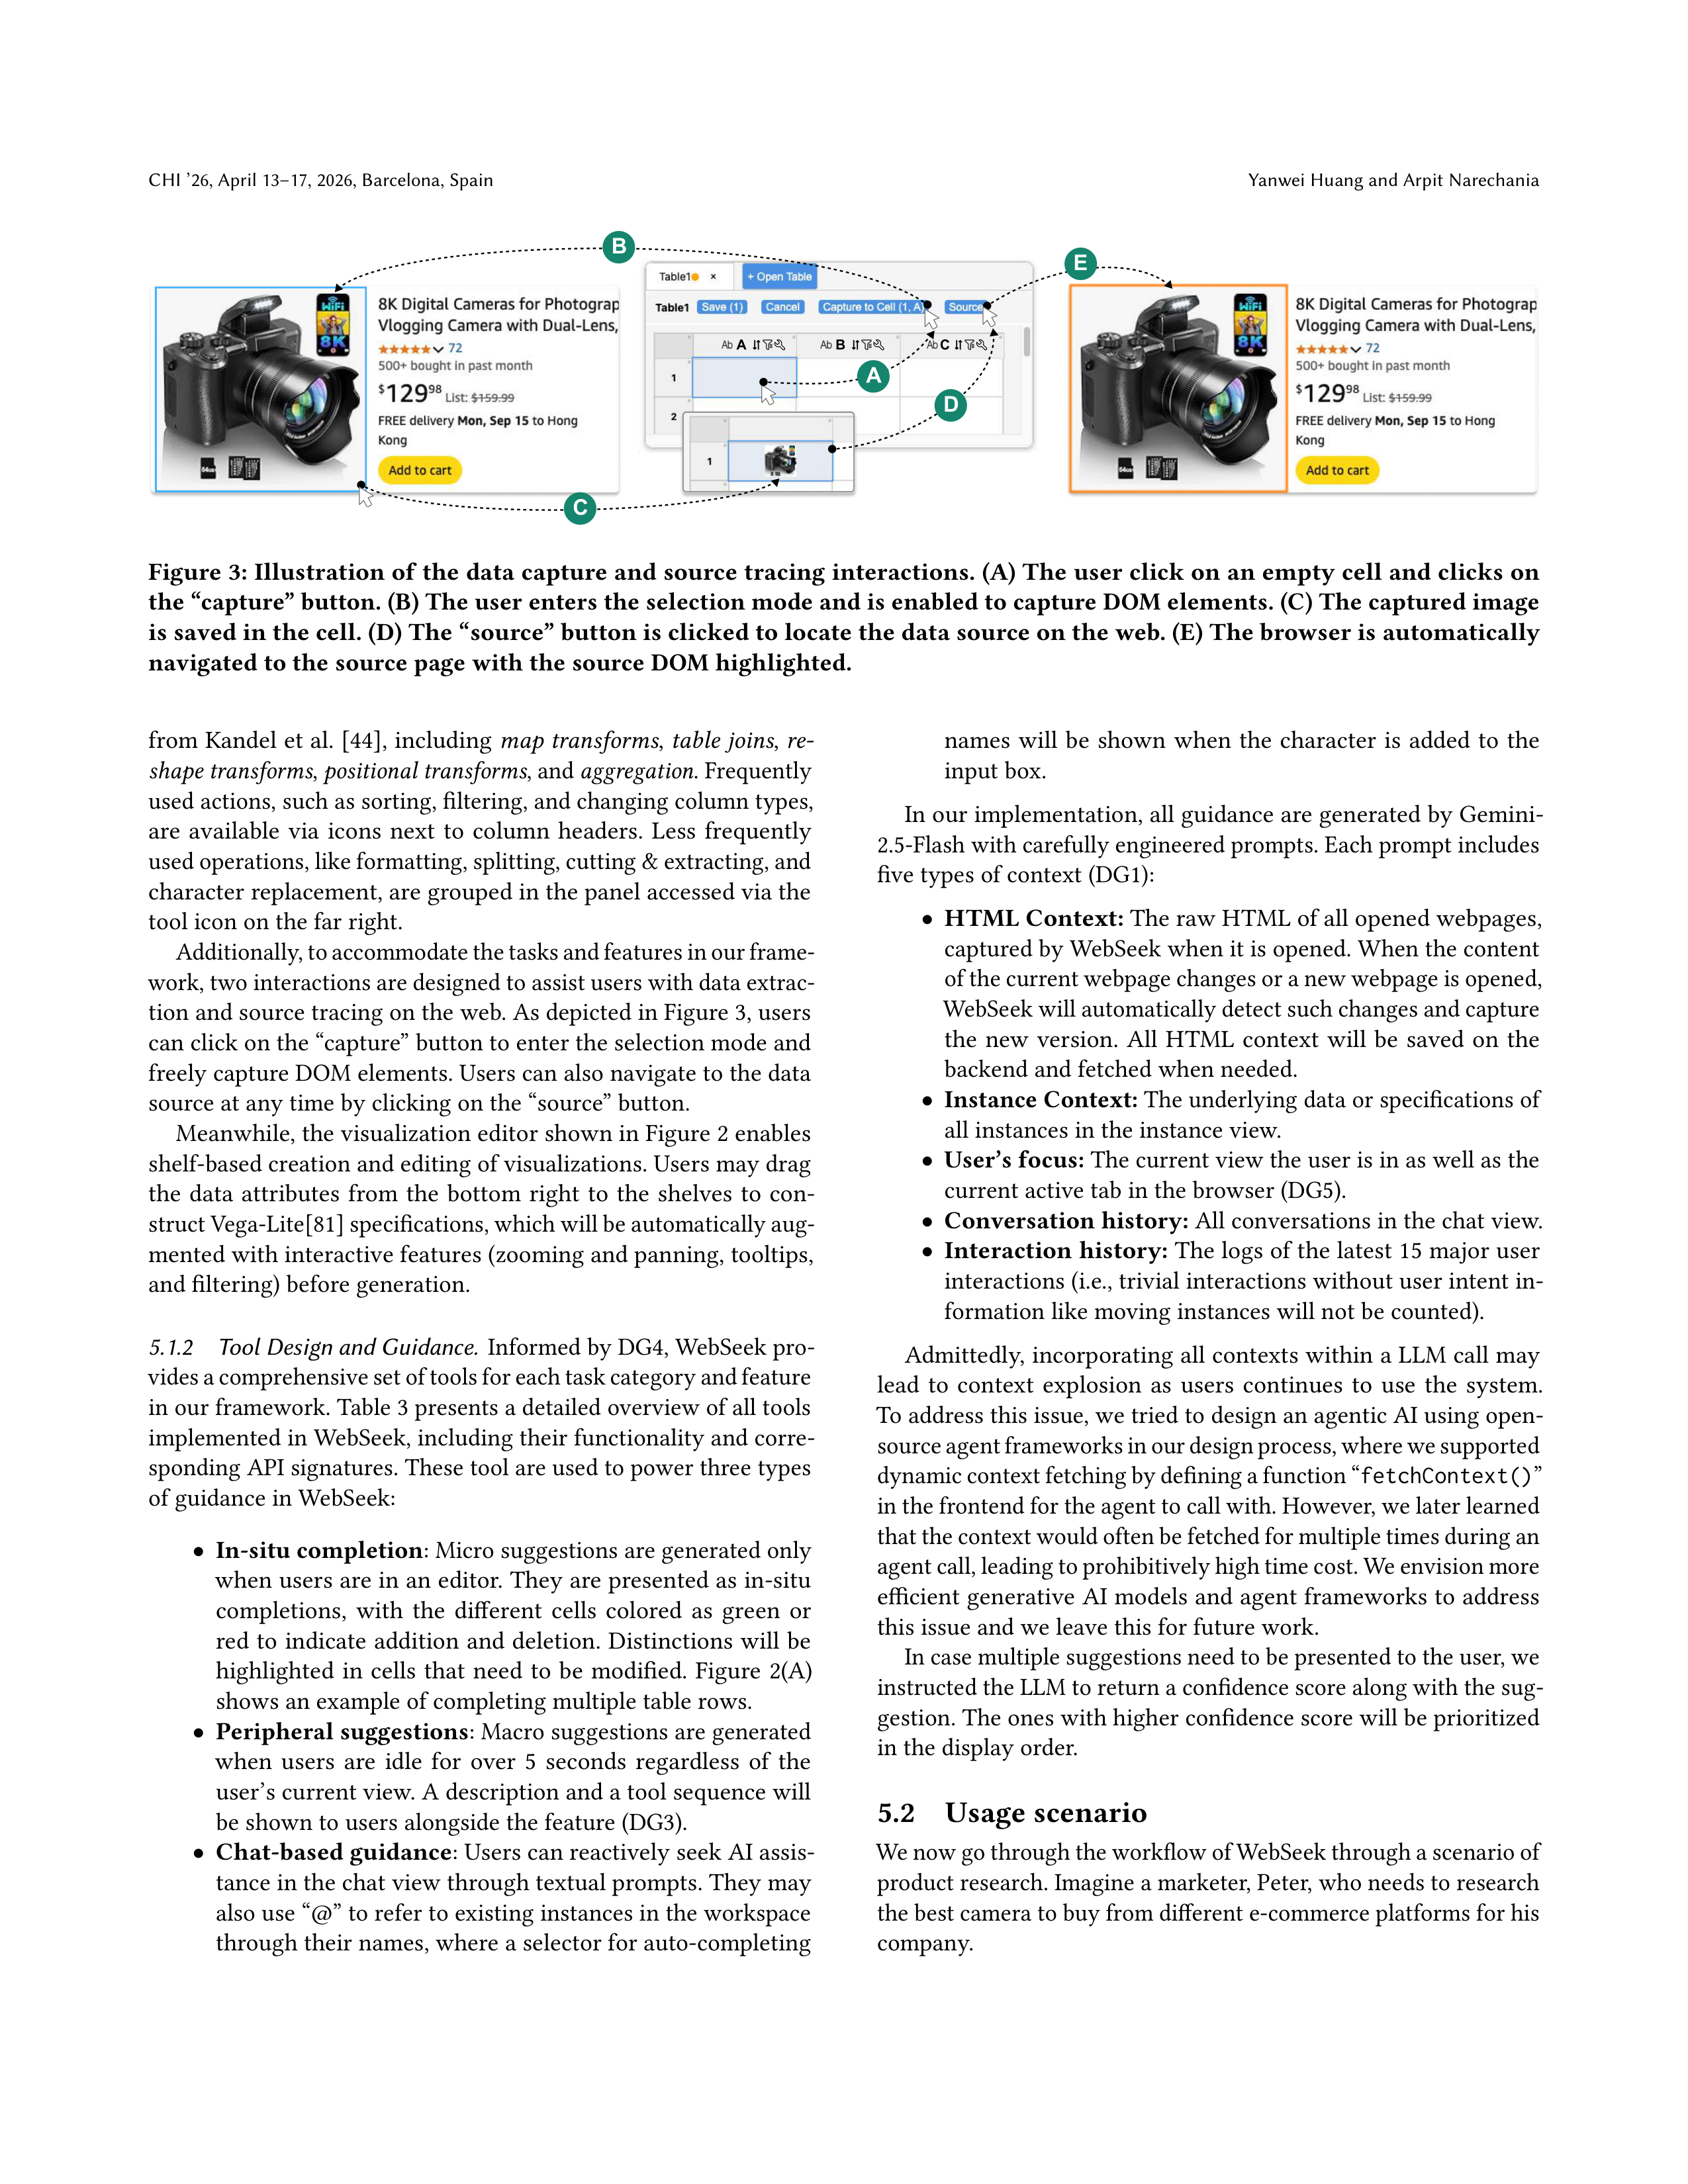
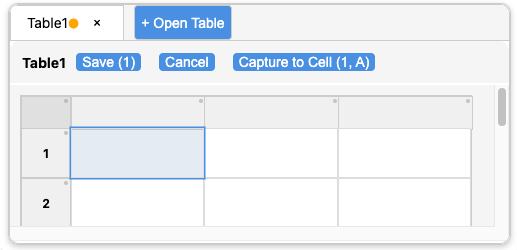
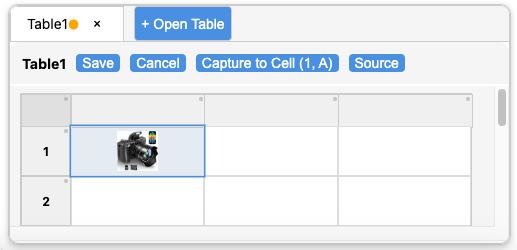
Figure 3: Illustration of the data capture and source tracing interactions. (A) The user click on an empty cell and clicks on
the “capture” button. (B) The user enters the selection mode and is enabled to capture DOM elements. (C) The captured image
is saved in the cell. (D) The “source” button is clicked to locate the data source on the web. (E) The browser is automatically
navigated to the source page with the source DOM highlighted.
from Kandel et al. [
44
], including
map transforms
,
table joins
,
re-
shape transforms
,
positional transforms
, and
aggregation
. Frequently
used actions, such as sorting, filtering, and changing column types,
are
available
via
icons
next
to
column
headers.
Less
frequently
used operations, like formatting, splitting, cutting & extracting, and
character replacement, are grouped in the panel accessed via the
tool icon on the far right.
Additionally, to accommodate the tasks and features in our frame-
work, two interactions are designed to assist users with data extrac-
tion and source tracing on the web. As depicted in Figure 3, users
can click on the “capture” button to enter the selection mode and
freely capture DOM elements. Users can also navigate to the data
source at any time by clicking on the “source” button.
Meanwhile, the visualization editor shown in Figure 2 enables
shelf-based creation and editing of visualizations. Users may drag
the
data
attributes
from
the
bottom
right
to
the
shelves
to
con-
struct Vega-Lite[
81
] specifications, which will be automatically aug-
mented with interactive features (zooming and panning, tooltips,
and filtering) before generation.
5.1.2
Tool Design and Guidance.
Informed by DG4, WebSeek pro-
vides a comprehensive set of tools for each task category and feature
in our framework. Table 3 presents a detailed overview of all tools
implemented in WebSeek, including their functionality and corre-
sponding API signatures. These tool are used to power three types
of guidance in WebSeek:
•
In-situ completion
: Micro suggestions are generated only
when users are in an editor. They are presented as in-situ
completions,
with
the
different
cells
colored
as
green
or
red
to
indicate
addition
and
deletion.
Distinctions
will
be
highlighted
in
cells
that
need
to
be
modified.
Figure
2(A)
shows an example of completing multiple table rows.
•
Peripheral suggestions
: Macro suggestions are generated
when
users
are
idle
for
over
5
seconds
regardless
of
the
user’s current view. A description and a tool sequence will
be shown to users alongside the feature (DG3).
•
Chat-based guidance
: Users can reactively seek AI assis-
tance in the chat view through textual prompts. They may
also use “@” to refer to existing instances in the workspace
through their names, where a selector for auto-completing
names
will
be
shown
when
the
character
is
added
to
the
input box.
In our implementation, all guidance are generated by Gemini-
2.5-Flash with carefully engineered prompts. Each prompt includes
five types of context (DG1):
•
HTML Context:
The raw HTML of all opened webpages,
captured by WebSeek when it is opened. When the content
of the current webpage changes or a new webpage is opened,
WebSeek will automatically detect such changes and capture
the
new
version.
All
HTML
context
will
be
saved
on
the
backend and fetched when needed.
•
Instance Context:
The underlying data or specifications of
all instances in the instance view.
•
User’s focus:
The current view the user is in as well as the
current active tab in the browser (DG5).
•
Conversation history:
All conversations in the chat view.
•
Interaction history:
The logs of the latest 15 major user
interactions (i.e., trivial interactions without user intent in-
formation like moving instances will not be counted).
Admittedly, incorporating all contexts within a LLM call may
lead
to
context
explosion
as
users
continues
to
use
the
system.
To address this issue, we tried to design an agentic AI using open-
source agent frameworks in our design process, where we supported
dynamic context fetching by defining a function “
fetchContext()
”
in the frontend for the agent to call with. However, we later learned
that the context would often be fetched for multiple times during an
agent call, leading to prohibitively high time cost. We envision more
efficient generative AI models and agent frameworks to address
this issue and we leave this for future work.
In case multiple suggestions need to be presented to the user, we
instructed the LLM to return a confidence score along with the sug-
gestion. The ones with higher confidence score will be prioritized
in the display order.
5.2
Usage scenario
We now go through the workflow of WebSeek through a scenario of
product research. Imagine a marketer, Peter, who needs to research
the best camera to buy from different e-commerce platforms for his
company.
Facilitating Proactive and Reactive Guidance for Decision Making on the Web: A Design Probe with WebSeek
CHI ’26, April 13–17, 2026, Barcelona, Spain
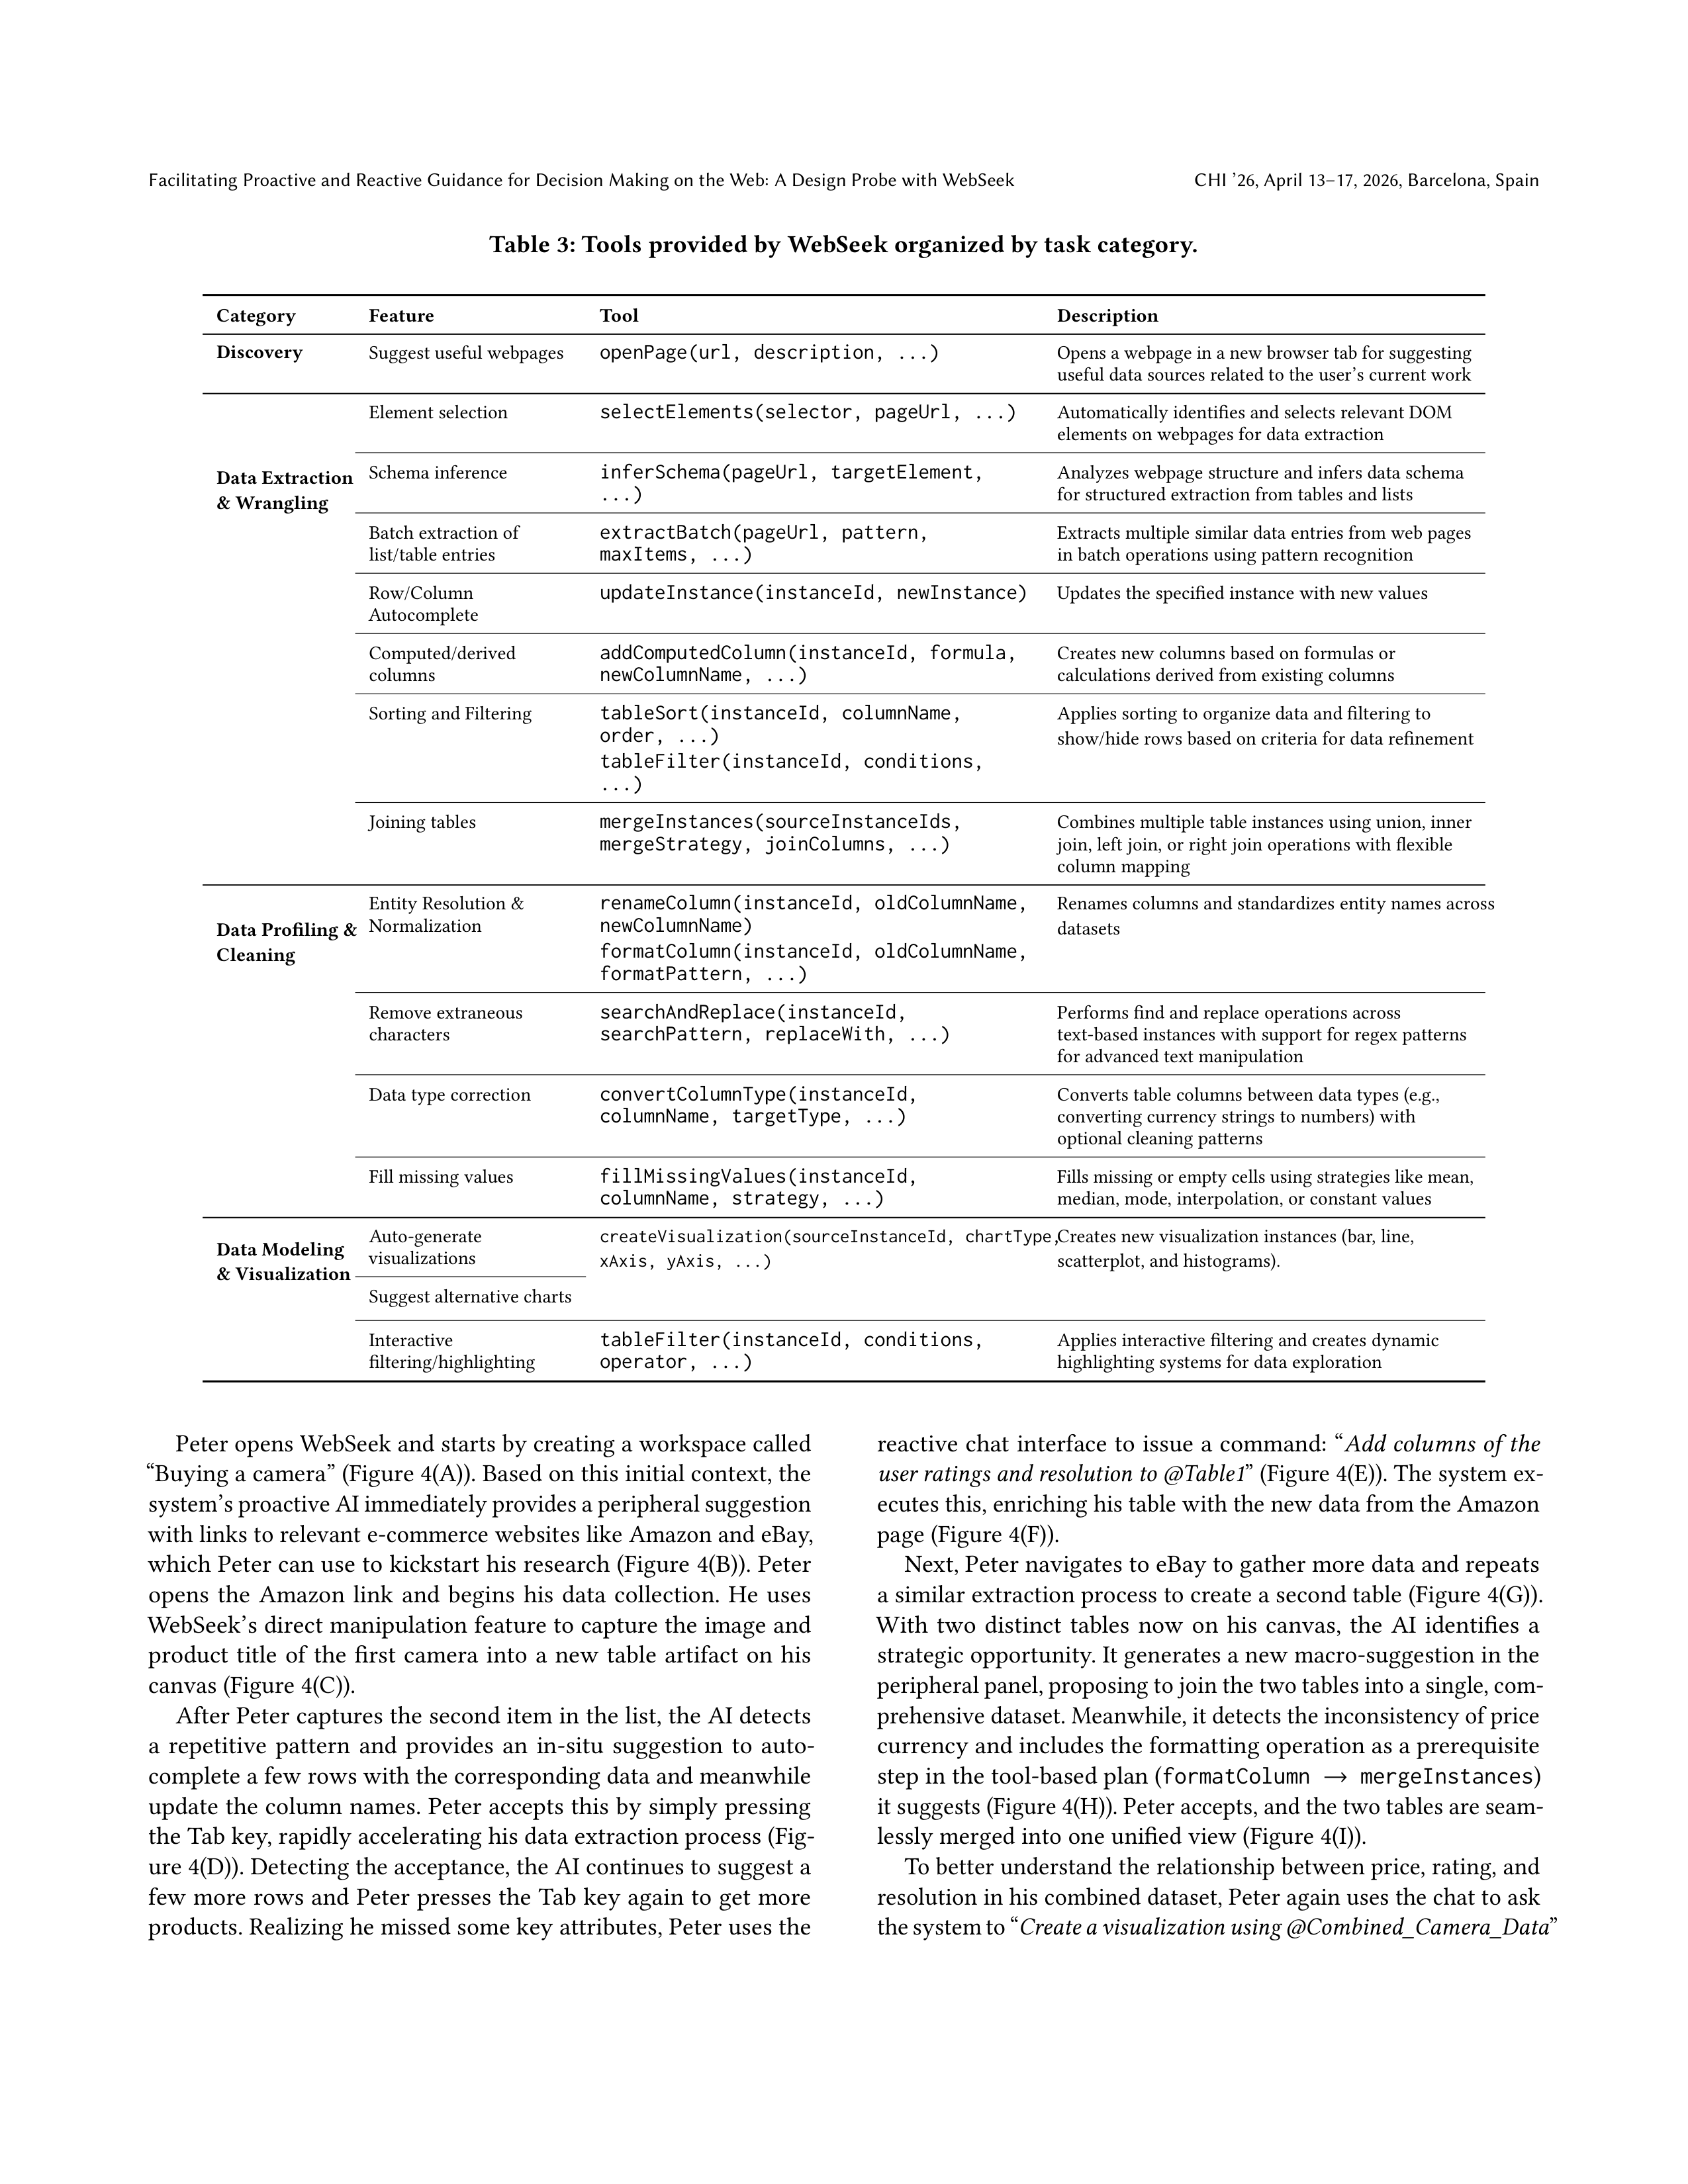
Table 3: Tools provided by WebSeek organized by task category.
Category
Feature
Tool
Description
Discovery
Suggest useful webpages
openPage(url,
description,
...)
Opens a webpage in a new browser tab for suggesting
useful data sources related to the user’s current work
Data Extraction
& Wrangling
Element selection
selectElements(selector,
pageUrl,
...)
Automatically identifies and selects relevant DOM
elements on webpages for data extraction
Schema inference
inferSchema(pageUrl,
targetElement,
...)
Analyzes webpage structure and infers data schema
for structured extraction from tables and lists
Batch extraction of
list/table entries
extractBatch(pageUrl,
pattern,
maxItems,
...)
Extracts multiple similar data entries from web pages
in batch operations using pattern recognition
Row/Column
Autocomplete
updateInstance(instanceId,
newInstance)
Updates the specified instance with new values
Computed/derived
columns
addComputedColumn(instanceId,
formula,
newColumnName,
...)
Creates new columns based on formulas or
calculations derived from existing columns
Sorting and Filtering
tableSort(instanceId,
columnName,
order,
...)
Applies sorting to organize data and filtering to
show/hide rows based on criteria for data refinement
tableFilter(instanceId,
conditions,
...)
Joining tables
mergeInstances(sourceInstanceIds,
mergeStrategy,
joinColumns,
...)
Combines multiple table instances using union, inner
join, left join, or right join operations with flexible
column mapping
Data Profiling &
Cleaning
Entity Resolution &
Normalization
renameColumn(instanceId,
oldColumnName,
newColumnName)
Renames columns and standardizes entity names across
datasets
formatColumn(instanceId,
oldColumnName,
formatPattern,
...)
Remove extraneous
characters
searchAndReplace(instanceId,
searchPattern,
replaceWith,
...)
Performs find and replace operations across
text-based instances with support for regex patterns
for advanced text manipulation
Data type correction
convertColumnType(instanceId,
columnName,
targetType,
...)
Converts table columns between data types (e.g.,
converting currency strings to numbers) with
optional cleaning patterns
Fill missing values
fillMissingValues(instanceId,
columnName,
strategy,
...)
Fills missing or empty cells using strategies like mean,
median, mode, interpolation, or constant values
Data Modeling
& Visualization
Auto-generate
visualizations
createVisualization(sourceInstanceId,
chartType,
xAxis,
yAxis,
...)
Creates new visualization instances (bar, line,
scatterplot, and histograms).
Suggest alternative charts
Interactive
filtering/highlighting
tableFilter(instanceId,
conditions,
operator,
...)
Applies interactive filtering and creates dynamic
highlighting systems for data exploration
Peter opens WebSeek and starts by creating a workspace called
“Buying a camera” (Figure 4(A)). Based on this initial context, the
system’s proactive AI immediately provides a peripheral suggestion
with links to relevant e-commerce websites like Amazon and eBay,
which Peter can use to kickstart his research (Figure 4(B)). Peter
opens
the
Amazon
link
and
begins
his
data
collection.
He
uses
WebSeek’s direct manipulation feature to capture the image and
product
title
of
the
first
camera
into
a
new
table
artifact
on
his
canvas (Figure 4(C)).
After Peter captures the second item in the list, the AI detects
a
repetitive
pattern
and
provides
an
in-situ
suggestion
to
auto-
complete a few rows with the corresponding data and meanwhile
update the column names. Peter accepts this by simply pressing
the Tab key, rapidly accelerating his data extraction process (Fig-
ure 4(D)). Detecting the acceptance, the AI continues to suggest a
few more rows and Peter presses the Tab key again to get more
products. Realizing he missed some key attributes, Peter uses the
reactive chat interface to issue a command: “
Add columns of the
user ratings and resolution to @Table1
” (Figure 4(E)). The system ex-
ecutes this, enriching his table with the new data from the Amazon
page (Figure 4(F)).
Next, Peter navigates to eBay to gather more data and repeats
a similar extraction process to create a second table (Figure 4(G)).
With
two
distinct
tables
now
on
his
canvas,
the
AI
identifies
a
strategic opportunity. It generates a new macro-suggestion in the
peripheral panel, proposing to join the two tables into a single, com-
prehensive dataset. Meanwhile, it detects the inconsistency of price
currency and includes the formatting operation as a prerequisite
step in the tool-based plan (
formatColumn
→
mergeInstances
)
it suggests (Figure 4(H)). Peter accepts, and the two tables are seam-
lessly merged into one unified view (Figure 4(I)).
To better understand the relationship between price, rating, and
resolution in his combined dataset, Peter again uses the chat to ask
the system to “
Create a visualization using @Combined_Camera_Data
”
CHI ’26, April 13–17, 2026, Barcelona, Spain
Yanwei Huang and Arpit Narechania
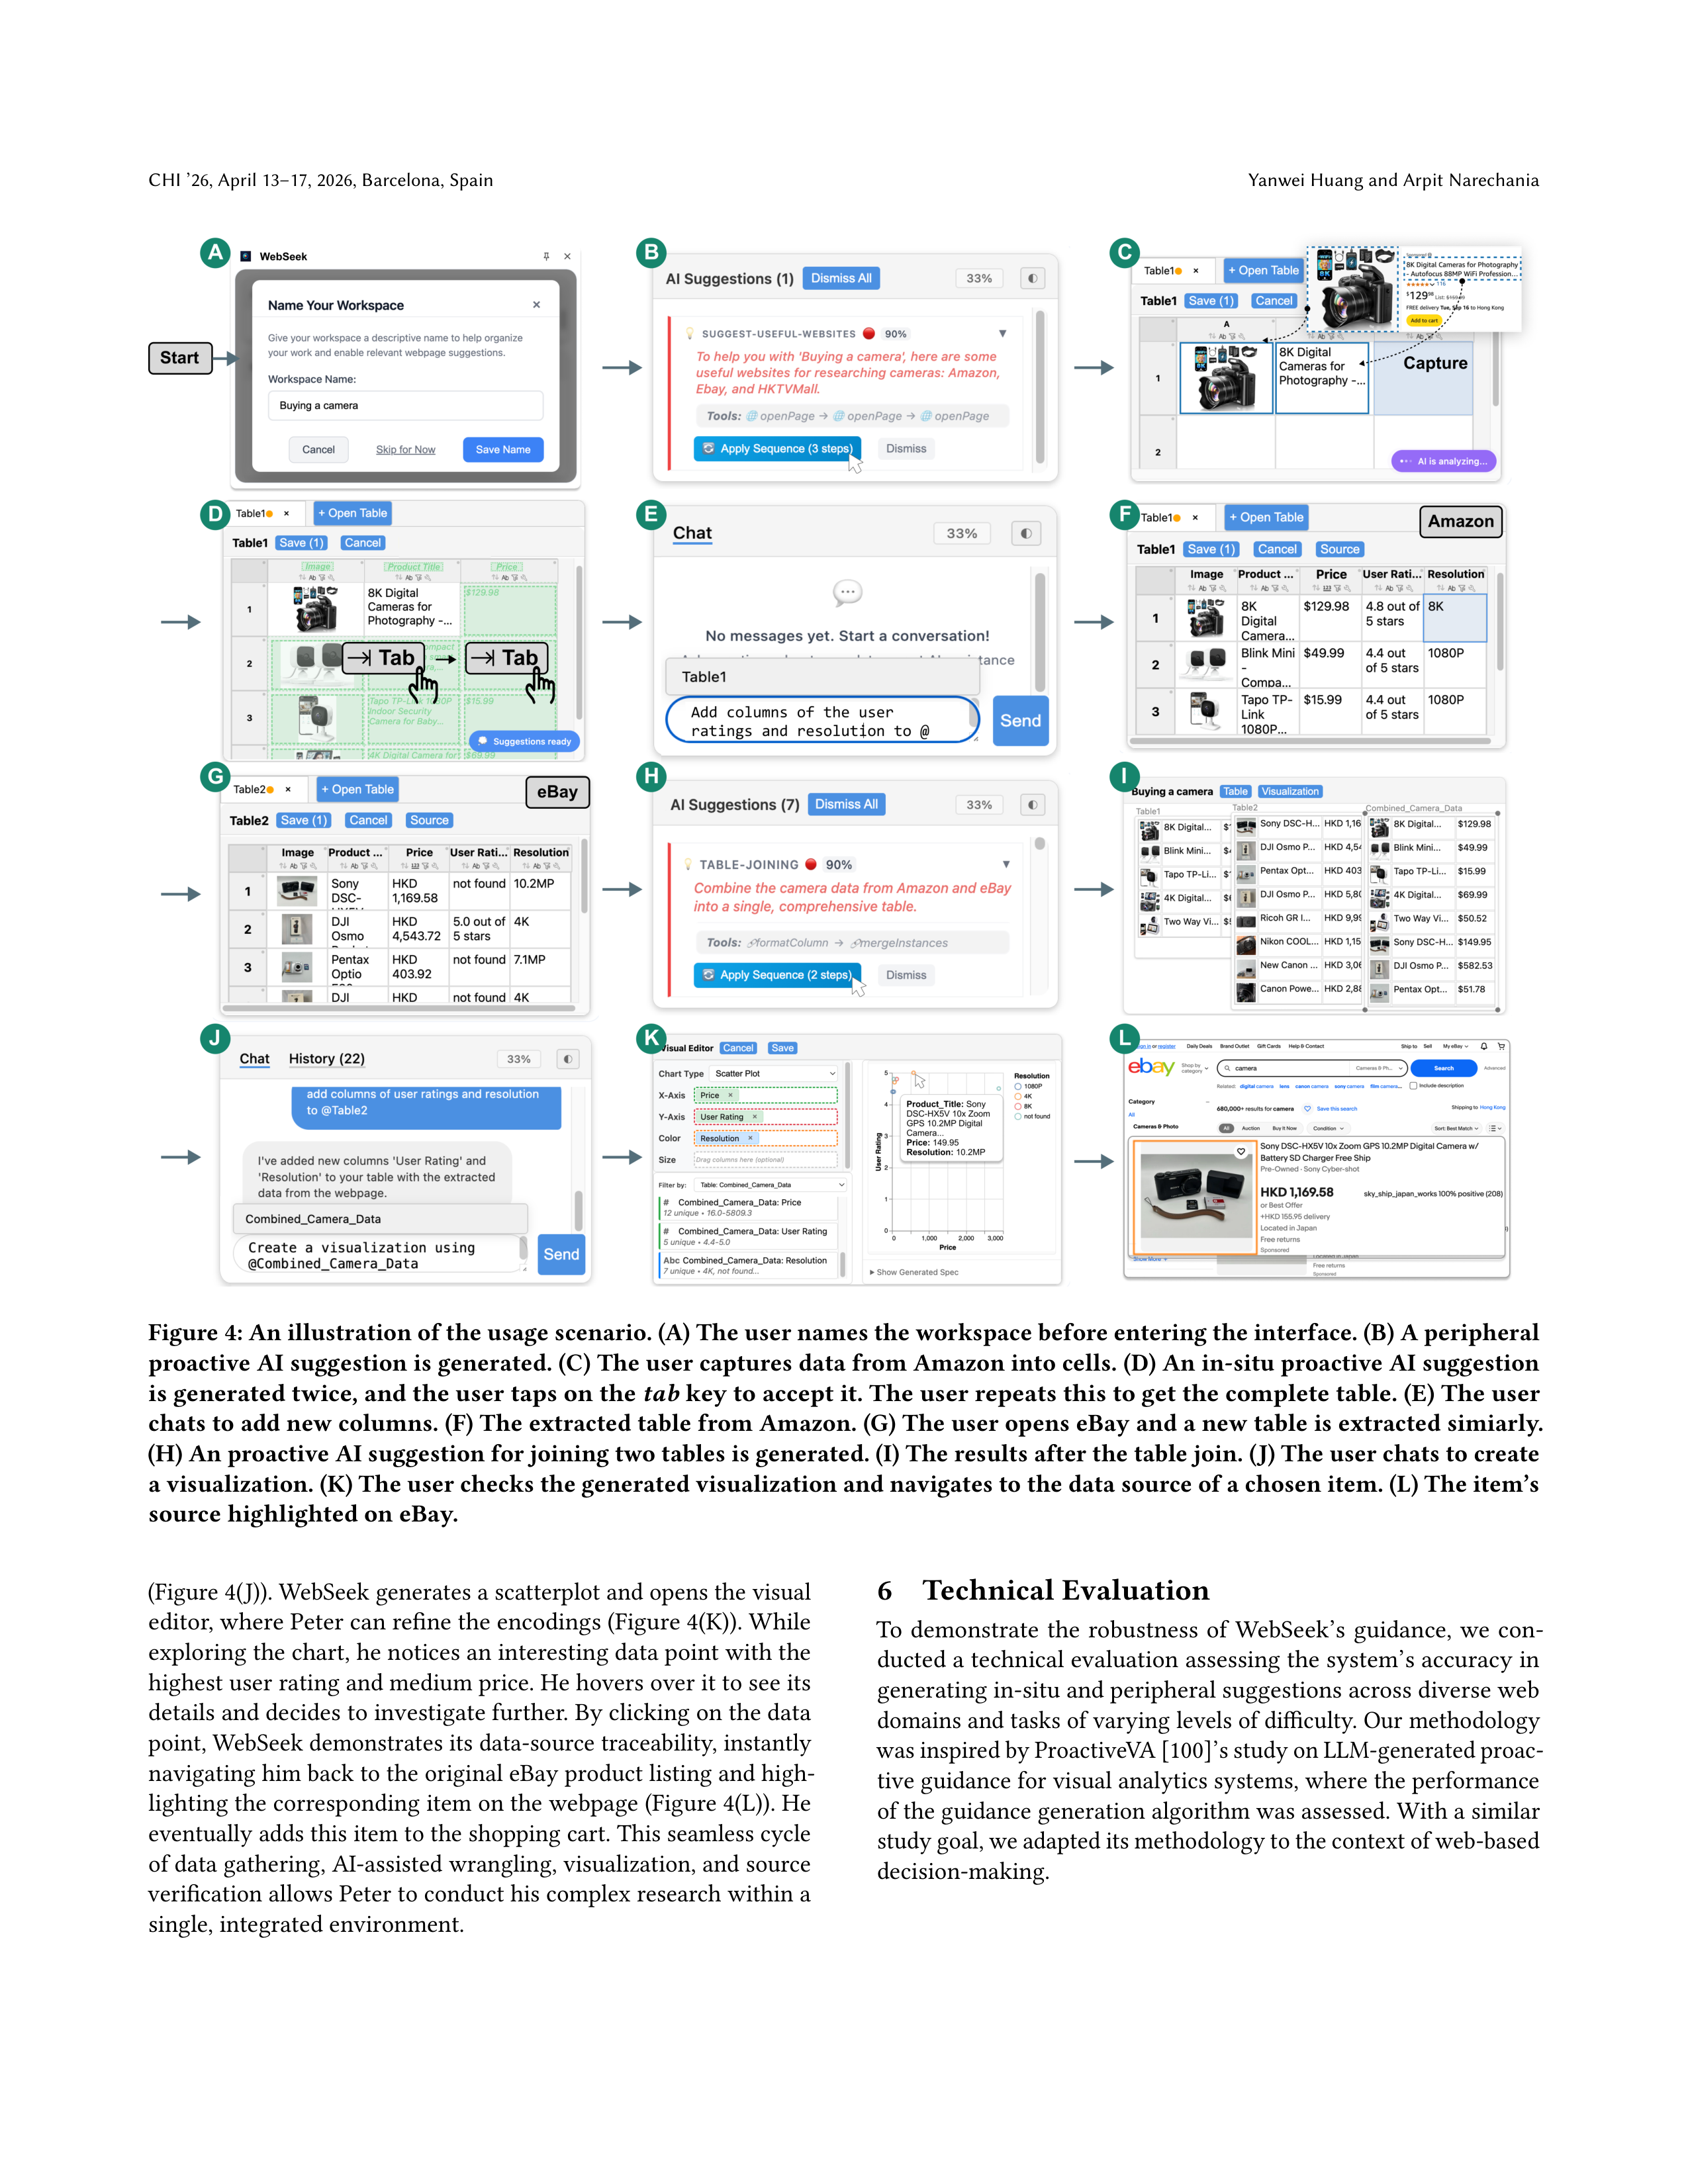
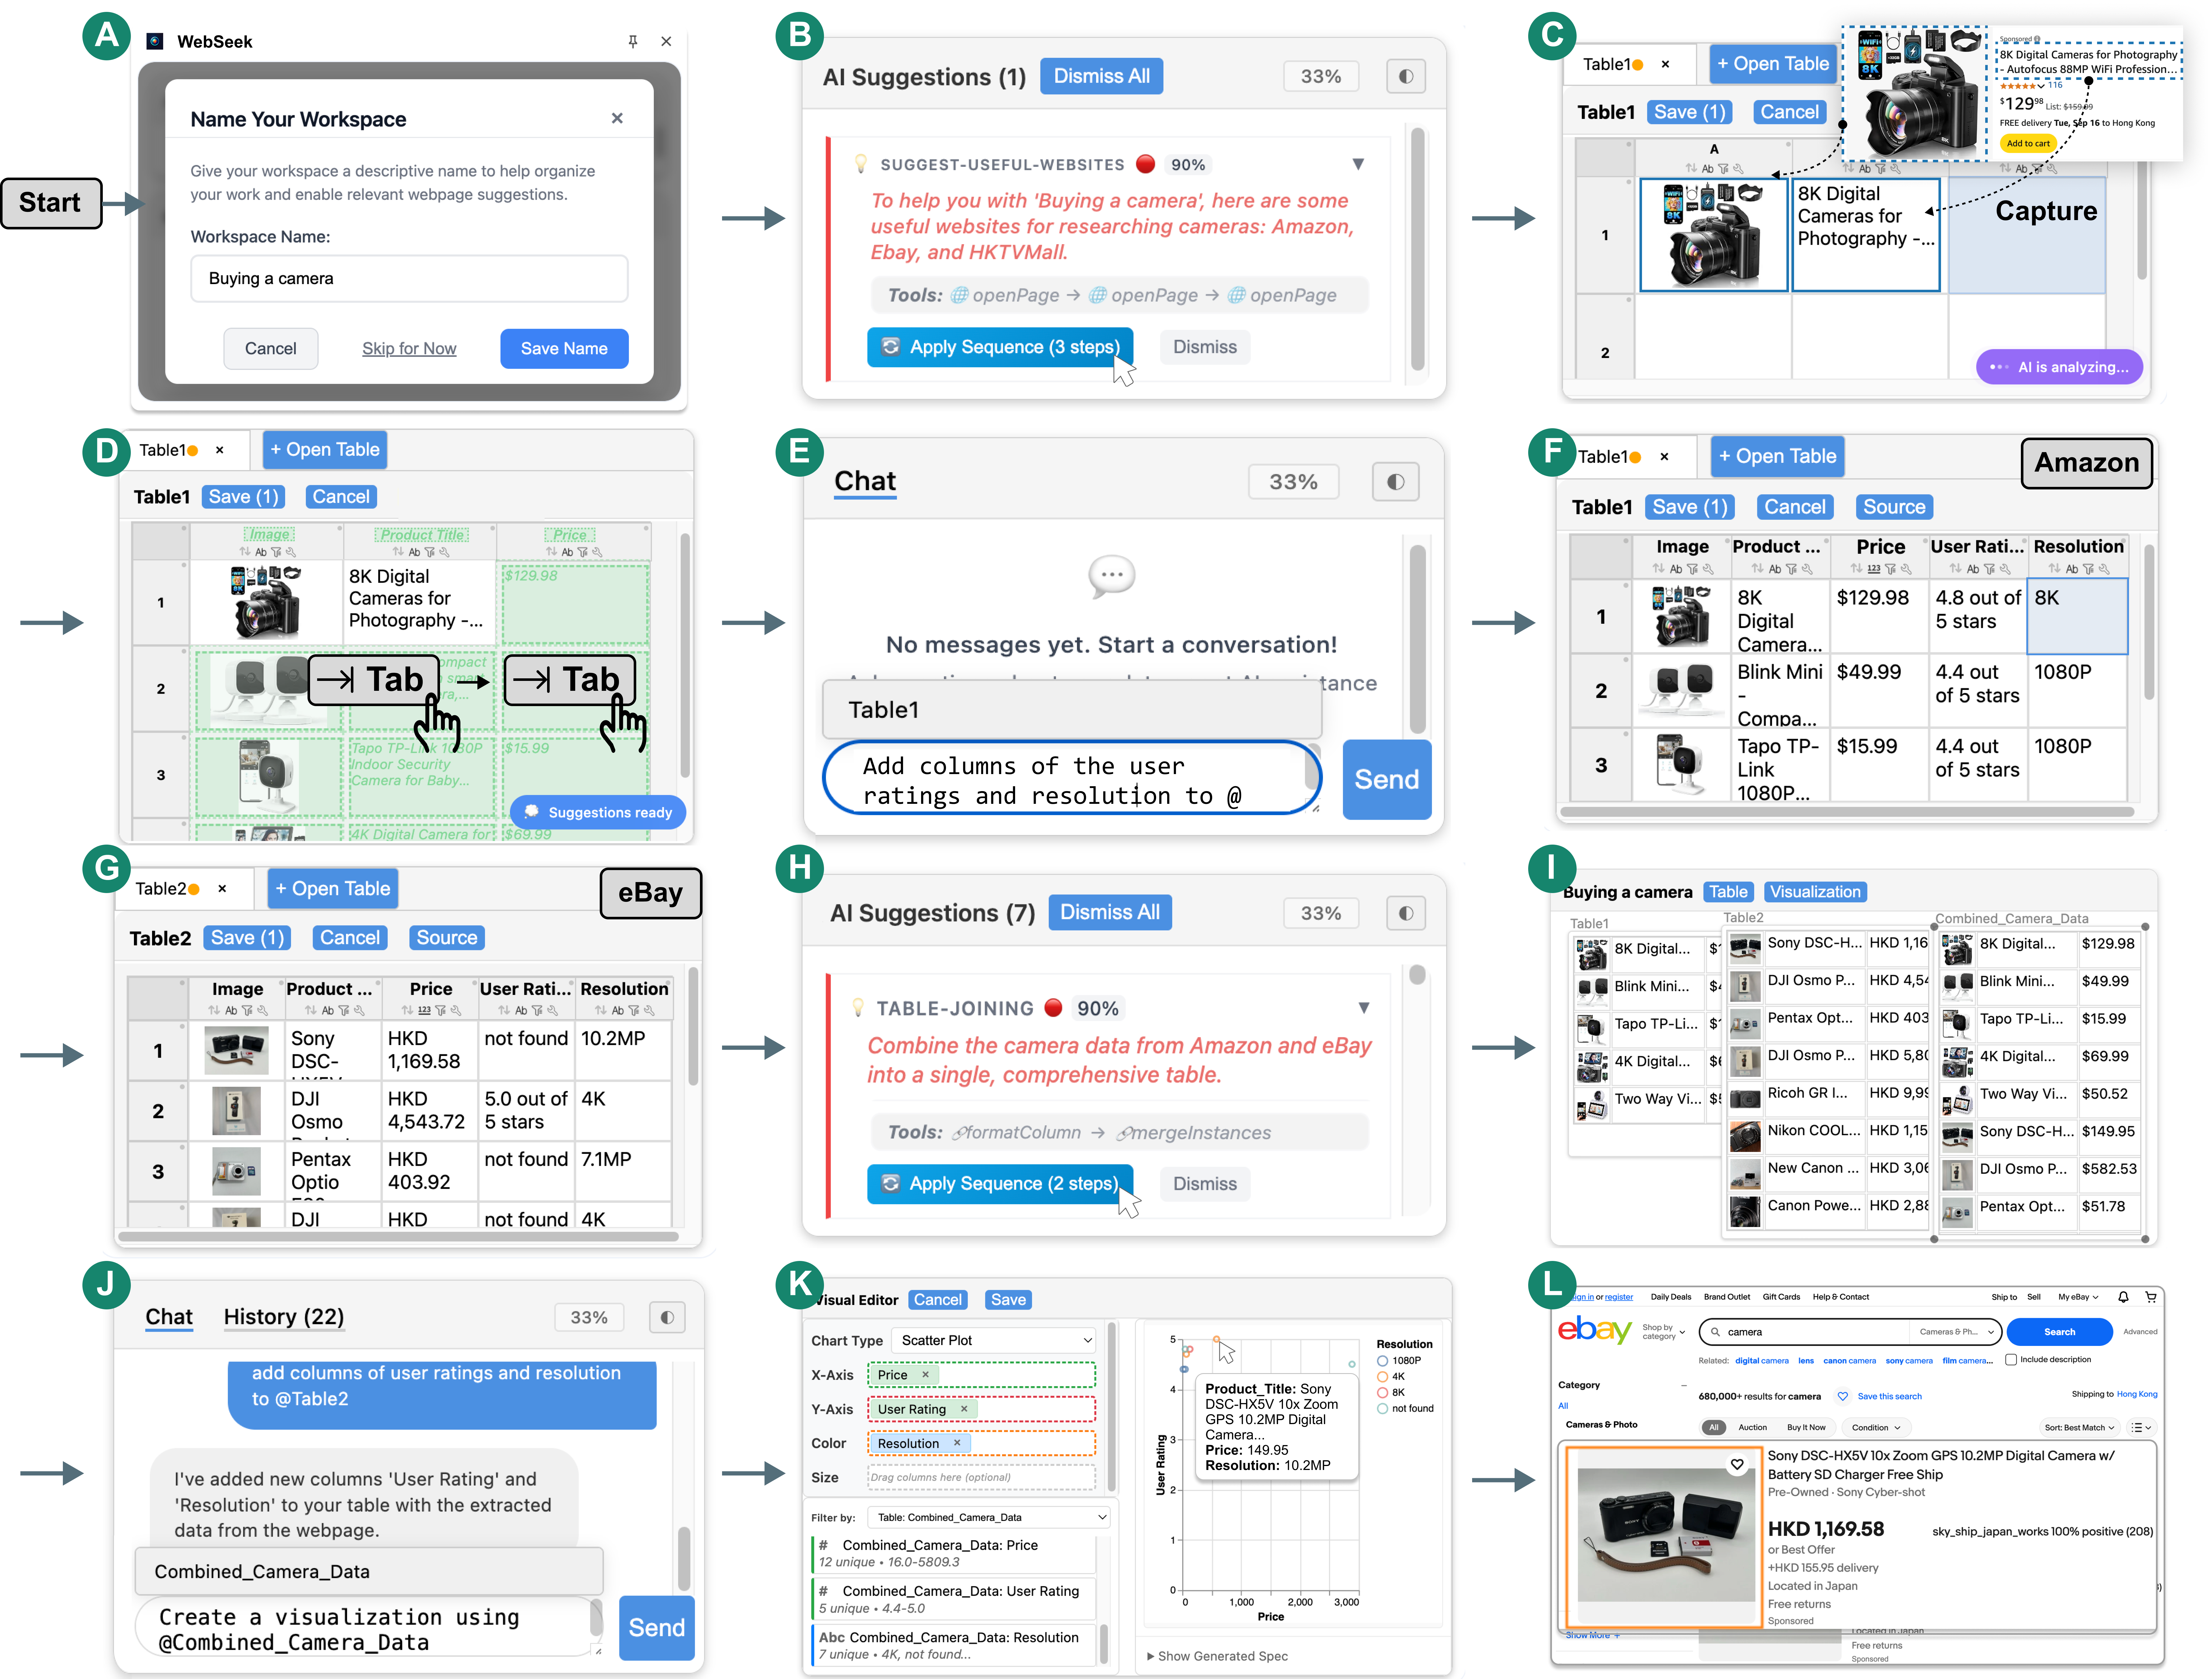
Figure 4: An illustration of the usage scenario. (A) The user names the workspace before entering the interface. (B) A peripheral
proactive AI suggestion is generated. (C) The user captures data from Amazon into cells. (D) An in-situ proactive AI suggestion
is generated twice, and the user taps on the
tab
key to accept it. The user repeats this to get the complete table. (E) The user
chats to add new columns. (F) The extracted table from Amazon. (G) The user opens eBay and a new table is extracted simiarly.
(H) An proactive AI suggestion for joining two tables is generated. (I) The results after the table join. (J) The user chats to create
a visualization. (K) The user checks the generated visualization and navigates to the data source of a chosen item. (L) The item’s
source highlighted on eBay.
(Figure 4(J)). WebSeek generates a scatterplot and opens the visual
editor, where Peter can refine the encodings (Figure 4(K)). While
exploring the chart, he notices an interesting data point with the
highest user rating and medium price. He hovers over it to see its
details and decides to investigate further. By clicking on the data
point, WebSeek demonstrates its data-source traceability, instantly
navigating him back to the original eBay product listing and high-
lighting the corresponding item on the webpage (Figure 4(L)). He
eventually adds this item to the shopping cart. This seamless cycle
of data gathering, AI-assisted wrangling, visualization, and source
verification allows Peter to conduct his complex research within a
single, integrated environment.
6
Technical Evaluation
To
demonstrate
the
robustness
of
WebSeek’s
guidance,
we
con-
ducted a technical evaluation assessing the system’s accuracy in
generating in-situ and peripheral suggestions across diverse web
domains and tasks of varying levels of difficulty. Our methodology
was inspired by ProactiveVA [
100
]’s study on LLM-generated proac-
tive guidance for visual analytics systems, where the performance
of the guidance generation algorithm was assessed. With a similar
study goal, we adapted its methodology to the context of web-based
decision-making.
Facilitating Proactive and Reactive Guidance for Decision Making on the Web: A Design Probe with WebSeek
CHI ’26, April 13–17, 2026, Barcelona, Spain
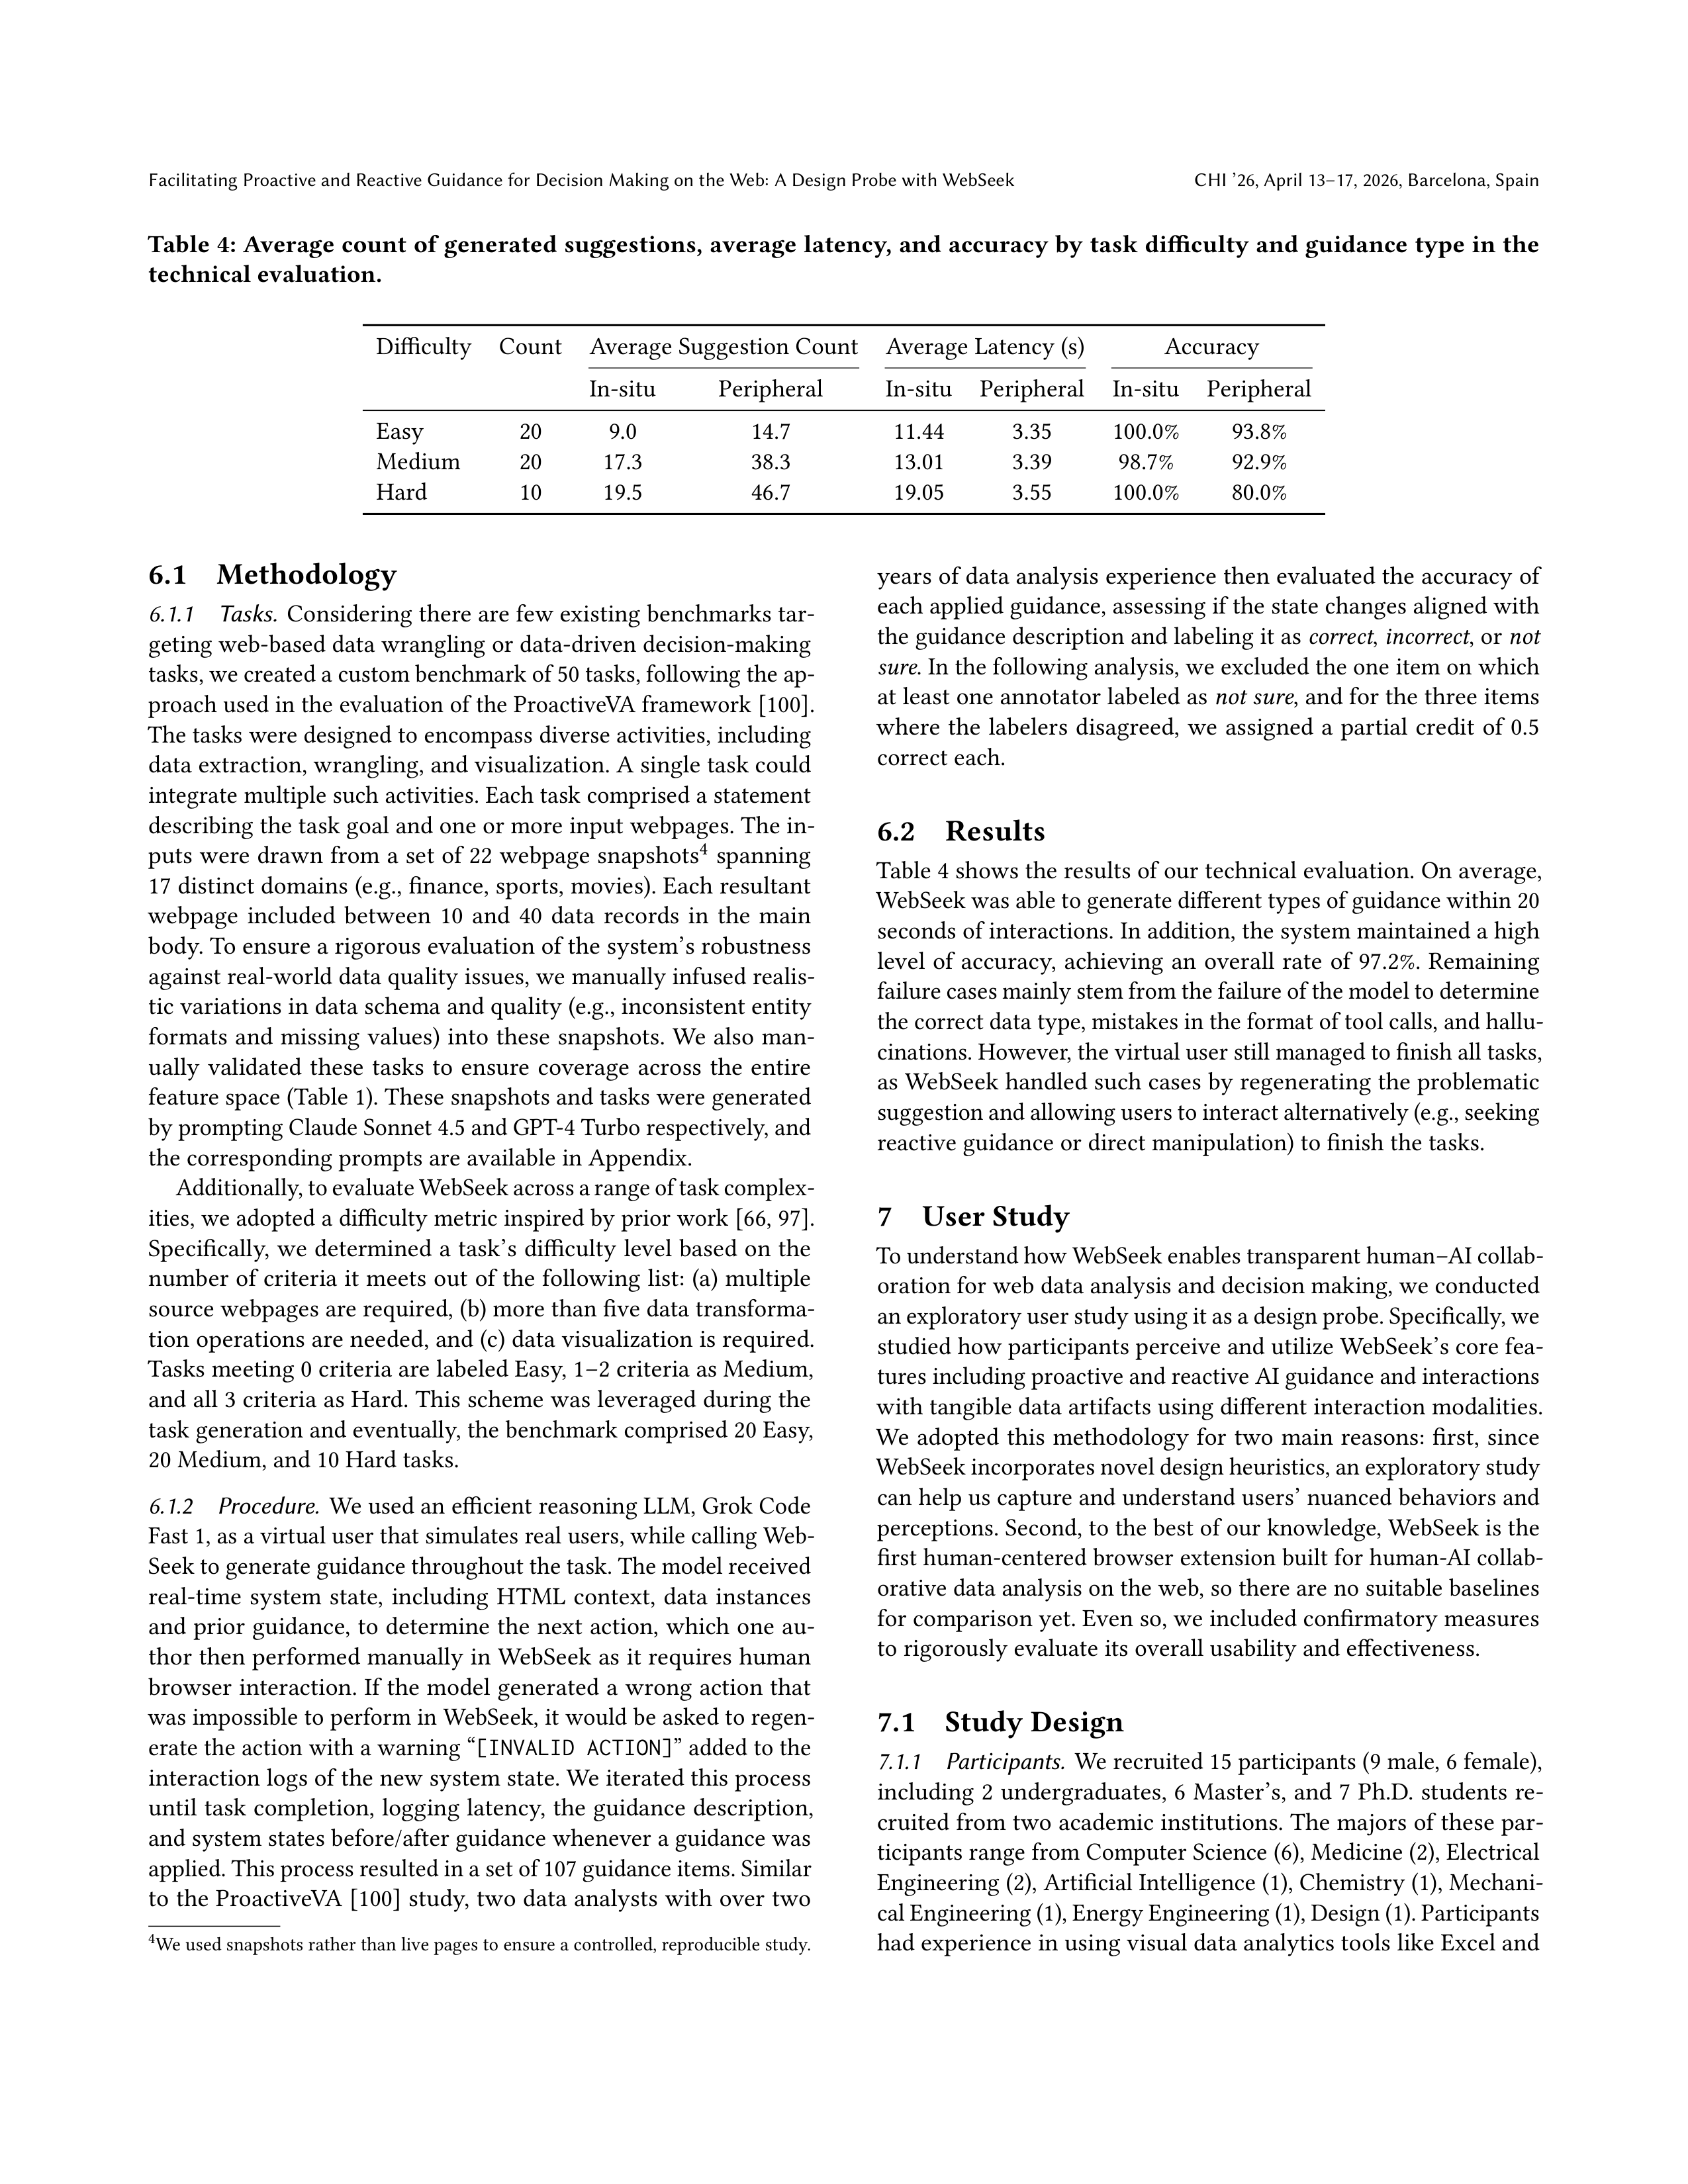
Table 4: Average count of generated suggestions, average latency, and accuracy by task difficulty and guidance type in the
technical evaluation.
Difficulty
Count
Average Suggestion Count
Average Latency (s)
Accuracy
In-situ
Peripheral
In-situ
Peripheral
In-situ
Peripheral
Easy
20
9.0
14.7
11.44
3.35
100.0%
93.8%
Medium
20
17.3
38.3
13.01
3.39
98.7%
92.9%
Hard
10
19.5
46.7
19.05
3.55
100.0%
80.0%
6.1
Methodology
6.1.1
Tasks.
Considering there are few existing benchmarks tar-
geting web-based data wrangling or data-driven decision-making
tasks, we created a custom benchmark of 50 tasks, following the ap-
proach used in the evaluation of the ProactiveVA framework [
100
].
The tasks were designed to encompass diverse activities, including
data extraction, wrangling, and visualization. A single task could
integrate multiple such activities. Each task comprised a statement
describing the task goal and one or more input webpages. The in-
puts were drawn from a set of 22 webpage snapshots
4
spanning
17 distinct domains (e.g., finance, sports, movies). Each resultant
webpage
included
between
10
and
40
data
records
in
the
main
body. To ensure a rigorous evaluation of the system’s robustness
against real-world data quality issues, we manually infused realis-
tic variations in data schema and quality (e.g., inconsistent entity
formats and missing values) into these snapshots. We also man-
ually
validated
these
tasks
to
ensure
coverage
across
the
entire
feature space (Table 1). These snapshots and tasks were generated
by prompting Claude Sonnet 4.5 and GPT-4 Turbo respectively, and
the corresponding prompts are available in Appendix.
Additionally, to evaluate WebSeek across a range of task complex-
ities, we adopted a difficulty metric inspired by prior work [
66
,
97
].
Specifically, we determined a task’s difficulty level based on the
number of criteria it meets out of the following list: (a) multiple
source webpages are required, (b) more than five data transforma-
tion operations are needed, and (c) data visualization is required.
Tasks meeting 0 criteria are labeled Easy, 1–2 criteria as Medium,
and all 3 criteria as Hard. This scheme was leveraged during the
task generation and eventually, the benchmark comprised 20 Easy,
20 Medium, and 10 Hard tasks.
6.1.2
Procedure.
We used an efficient reasoning LLM, Grok Code
Fast 1, as a virtual user that simulates real users, while calling Web-
Seek to generate guidance throughout the task. The model received
real-time
system
state,
including
HTML
context,
data
instances
and prior guidance, to determine the next action, which one au-
thor then performed manually in WebSeek as it requires human
browser interaction. If the model generated a wrong action that
was impossible to perform in WebSeek, it would be asked to regen-
erate the action with a warning “
[INVALID
ACTION]
” added to the
interaction logs of the new system state. We iterated this process
until task completion, logging latency, the guidance description,
and system states before/after guidance whenever a guidance was
applied. This process resulted in a set of 107 guidance items. Similar
to the ProactiveVA [
100
] study, two data analysts with over two
4
We used snapshots rather than live pages to ensure a controlled, reproducible study.
years of data analysis experience then evaluated the accuracy of
each applied guidance, assessing if the state changes aligned with
the guidance description and labeling it as
correct
,
incorrect
, or
not
sure
. In the following analysis, we excluded the one item on which
at least one annotator labeled as
not sure
, and for the three items
where
the
labelers
disagreed,
we
assigned
a
partial
credit
of
0.5
correct each.
6.2
Results
Table 4 shows the results of our technical evaluation. On average,
WebSeek was able to generate different types of guidance within 20
seconds of interactions. In addition, the system maintained a high
level
of
accuracy,
achieving
an
overall
rate
of
97.2%.
Remaining
failure cases mainly stem from the failure of the model to determine
the correct data type, mistakes in the format of tool calls, and hallu-
cinations. However, the virtual user still managed to finish all tasks,
as WebSeek handled such cases by regenerating the problematic
suggestion and allowing users to interact alternatively (e.g., seeking
reactive guidance or direct manipulation) to finish the tasks.
7
User Study
To understand how WebSeek enables transparent human–AI collab-
oration for web data analysis and decision making, we conducted
an exploratory user study using it as a design probe. Specifically, we
studied how participants perceive and utilize WebSeek’s core fea-
tures including proactive and reactive AI guidance and interactions
with tangible data artifacts using different interaction modalities.
We
adopted
this
methodology
for
two
main
reasons:
first,
since
WebSeek incorporates novel design heuristics, an exploratory study
can help us capture and understand users’ nuanced behaviors and
perceptions. Second, to the best of our knowledge, WebSeek is the
first human-centered browser extension built for human-AI collab-
orative data analysis on the web, so there are no suitable baselines
for comparison yet. Even so, we included confirmatory measures
to rigorously evaluate its overall usability and effectiveness.
7.1
Study Design
7.1.1
Participants.
We recruited 15 participants (9 male, 6 female),
including 2 undergraduates, 6 Master’s, and 7 Ph.D. students re-
cruited from two academic institutions. The majors of these par-
ticipants range from Computer Science (6), Medicine (2), Electrical
Engineering (2), Artificial Intelligence (1), Chemistry (1), Mechani-
cal Engineering (1), Energy Engineering (1), Design (1). Participants
had experience in using visual data analytics tools like Excel and
CHI ’26, April 13–17, 2026, Barcelona, Spain
Yanwei Huang and Arpit Narechania
Task 1
Task 2
1
2
3
4
5
6
7
Confidence
Control
Confidence
Control
(A) Confidence and Sense of Control
In-situ
Guidance
Peripheral
Guidance
Chat with
AI
Direct
Manipulation
1
2
3
4
5
(B) Helpfulness
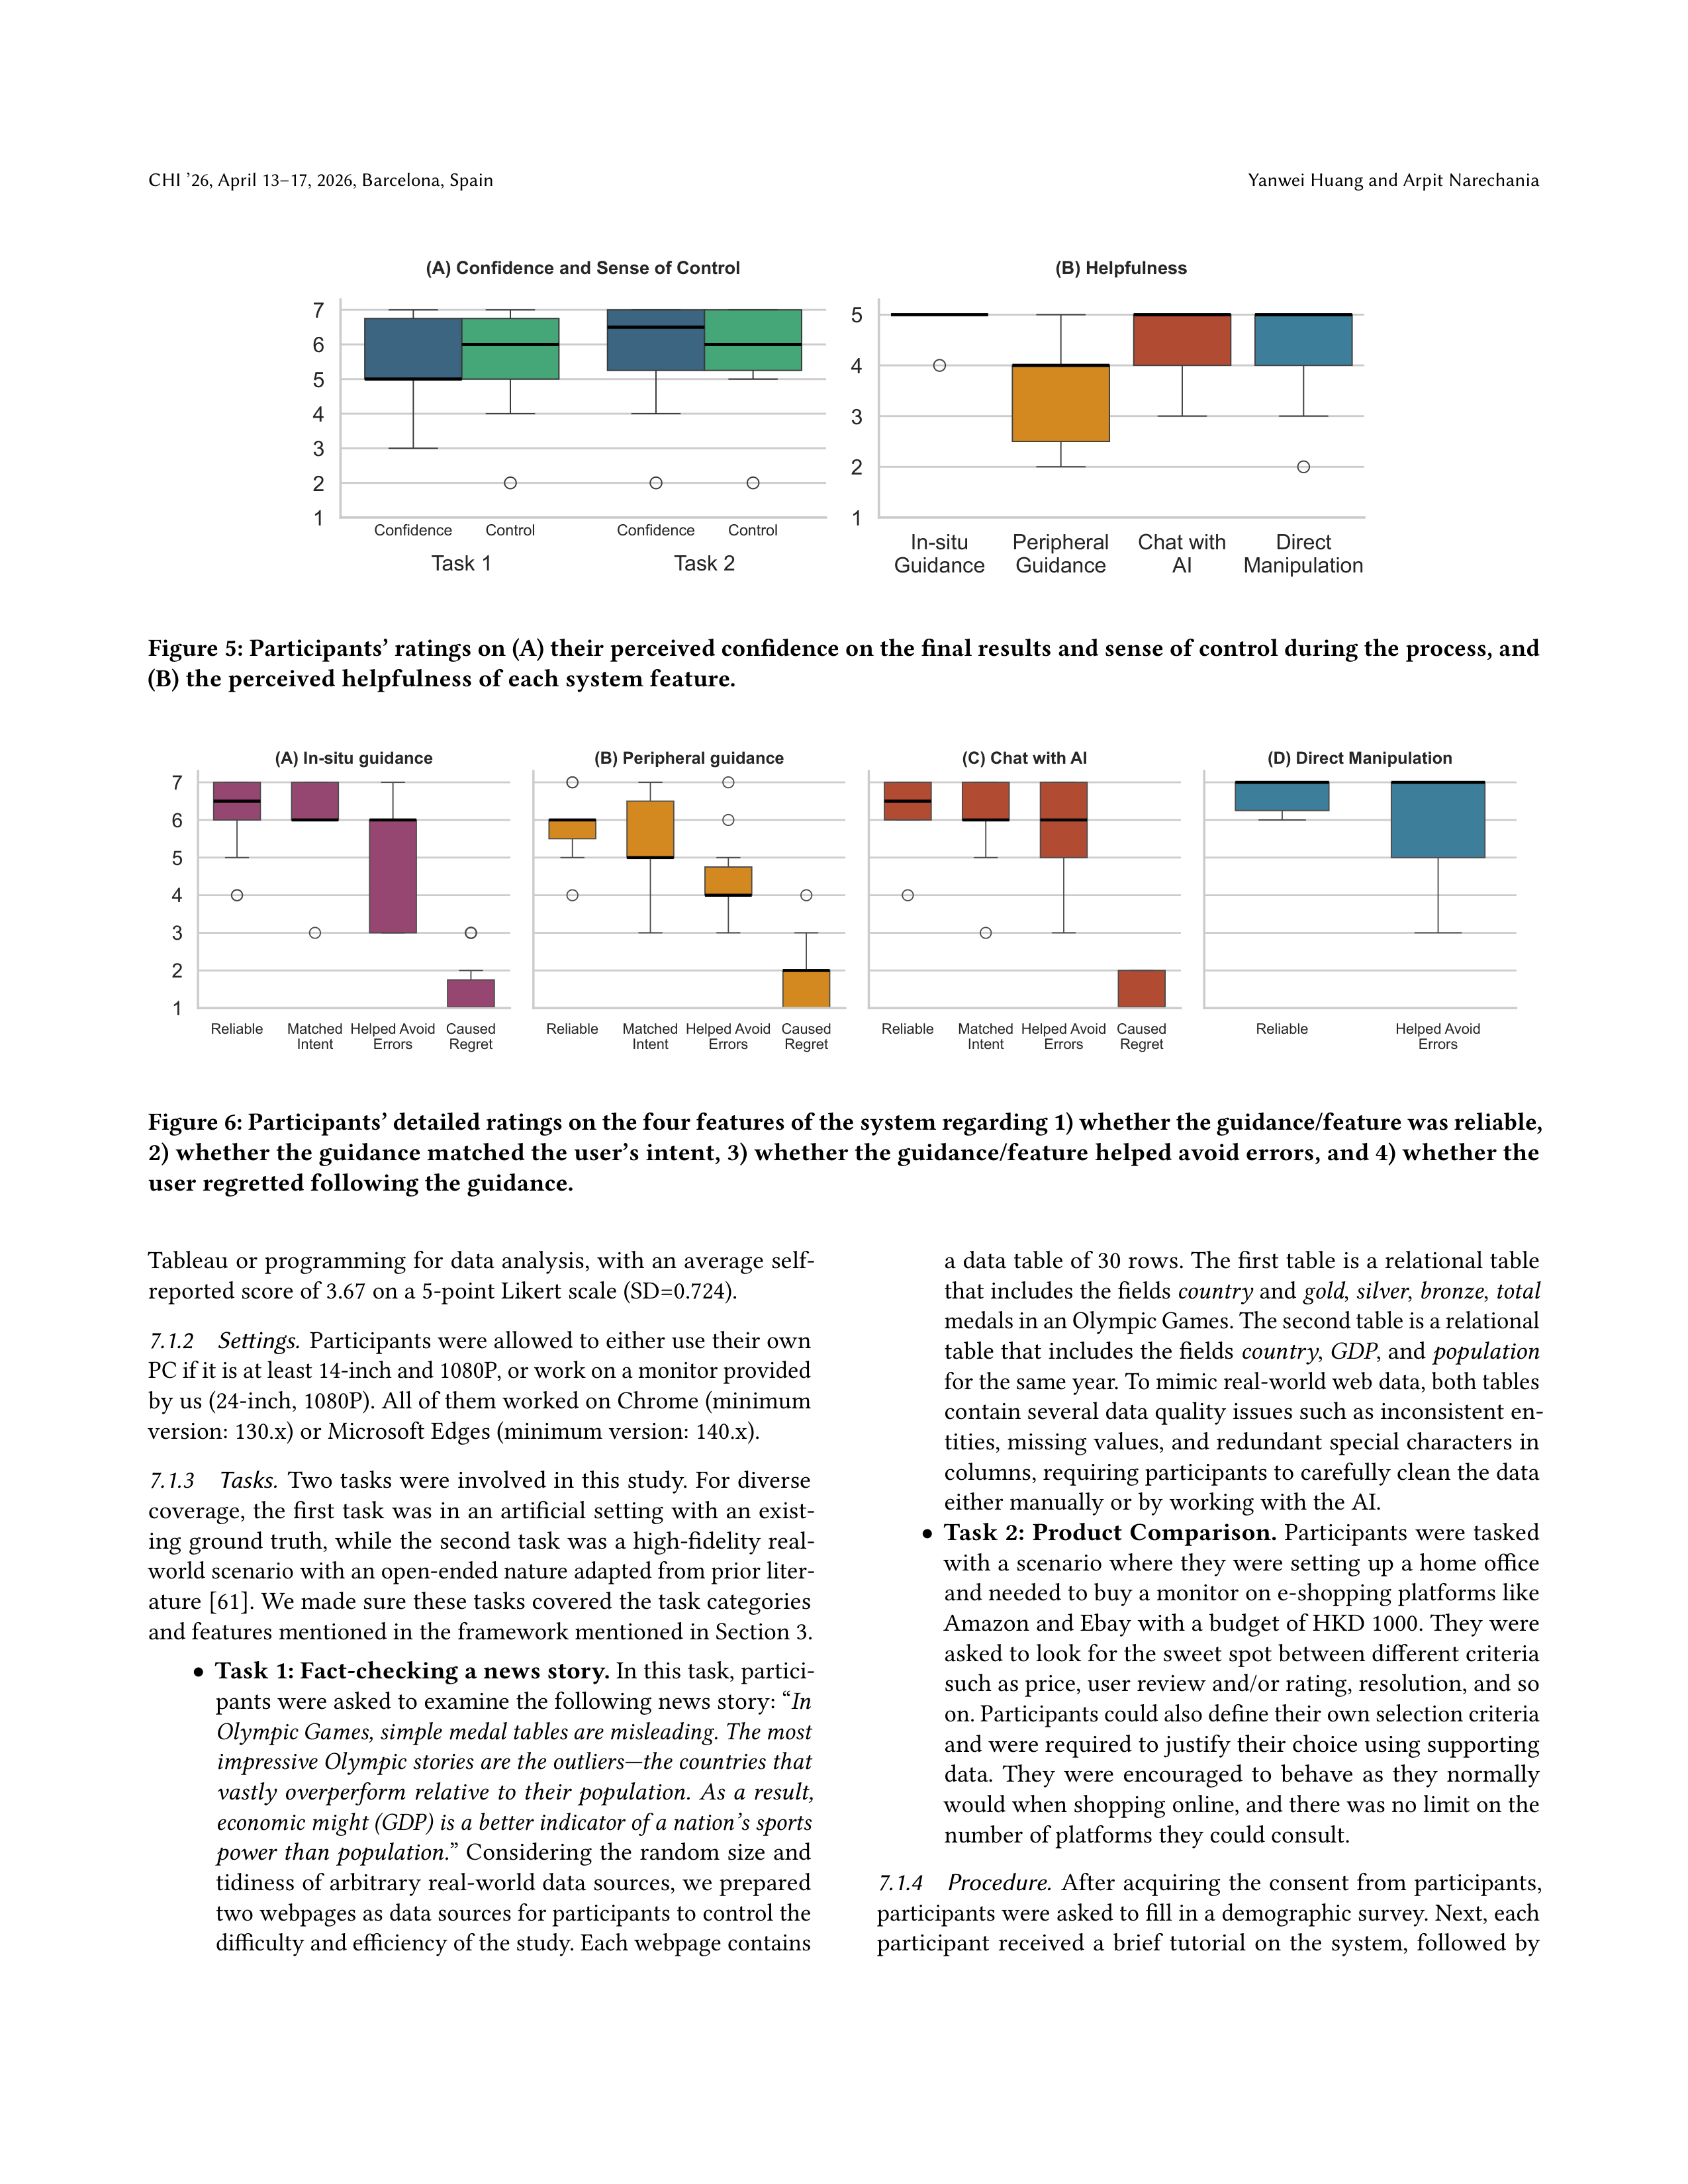
Figure 5: Participants’ ratings on (A) their perceived confidence on the final results and sense of control during the process, and
(B) the perceived helpfulness of each system feature.
Reliable
Matched
Intent
Helped Avoid
Errors
Caused
Regret
1
2
3
4
5
6
7
(A) In-situ guidance
Reliable
Matched
Intent
Helped Avoid
Errors
Caused
Regret
(B) Peripheral guidance
Reliable
Matched
Intent
Helped Avoid
Errors
Caused
Regret
(C) Chat with AI
Reliable
Helped Avoid
Errors
(D) Direct Manipulation
Figure 6: Participants’ detailed ratings on the four features of the system regarding 1) whether the guidance/feature was reliable,
2) whether the guidance matched the user’s intent, 3) whether the guidance/feature helped avoid errors, and 4) whether the
user regretted following the guidance.
Tableau or programming for data analysis, with an average self-
reported score of 3.67 on a 5-point Likert scale (SD=0.724).
7.1.2
Settings.
Participants were allowed to either use their own
PC if it is at least 14-inch and 1080P, or work on a monitor provided
by us (24-inch, 1080P). All of them worked on Chrome (minimum
version: 130.x) or Microsoft Edges (minimum version: 140.x).
7.1.3
Tasks.
Two tasks were involved in this study. For diverse
coverage, the
first task
was in
an artificial
setting with
an exist-
ing ground truth, while the second task was a high-fidelity real-
world scenario with an open-ended nature adapted from prior liter-
ature [
61
]. We made sure these tasks covered the task categories
and features mentioned in the framework mentioned in Section 3.
•
Task 1: Fact-checking a news story.
In this task, partici-
pants were asked to examine the following news story: “
In
Olympic Games, simple medal tables are misleading. The most
impressive Olympic stories are the outliers—the countries that
vastly
overperform
relative
to
their
population.
As
a
result,
economic might (GDP) is a better indicator of a nation’s sports
power than population.
” Considering the random size and
tidiness of arbitrary real-world data sources, we prepared
two webpages as data sources for participants to control the
difficulty and efficiency of the study. Each webpage contains
a data table of 30 rows. The first table is a relational table
that includes the fields
country
and
gold
,
silver
,
bronze
,
total
medals in an Olympic Games. The second table is a relational
table that includes the fields
country
,
GDP
, and
population
for the same year. To mimic real-world web data, both tables
contain several data quality issues such as inconsistent en-
tities, missing values, and redundant special characters in
columns, requiring participants to carefully clean the data
either manually or by working with the AI.
•
Task
2:
Product
Comparison.
Participants
were
tasked
with a scenario where they were setting up a home office
and needed to buy a monitor on e-shopping platforms like
Amazon and Ebay with a budget of HKD 1000. They were
asked to look for the sweet spot between different criteria
such as price, user review and/or rating, resolution, and so
on. Participants could also define their own selection criteria
and were required to justify their choice using supporting
data.
They
were
encouraged
to
behave
as
they
normally
would when shopping online, and there was no limit on the
number of platforms they could consult.
7.1.4
Procedure.
After
acquiring
the
consent
from
participants,
participants were asked to fill in a demographic survey. Next, each
participant
received
a
brief
tutorial
on
the
system,
followed
by
Facilitating Proactive and Reactive Guidance for Decision Making on the Web: A Design Probe with WebSeek
CHI ’26, April 13–17, 2026, Barcelona, Spain
a
10-minute
warm-up
session
in
which
they
tried
every
system
feature. They then worked on the two tasks, with a 1-minute break
between tasks. The session ended with a post-study questionnaire
and a semi-structured interview. Each study lasted approximately
90 minutes, and participants were compensated HKD 90. The study
protocol has been approved by the IRB committee of our institution.
7.1.5
Measure.
Participants
were
asked
to
rate
the
usability
of
WebSeek using the System Usability Scale (SUS) [
10
] and the help-
fulness of different components of the system. To study the impact
of AI guidance in detail, we asked targeted questions probing partic-
ipants’ perceptions of the guidance along dimensions such as intent
alignment, perceived reliability, usefulness for reducing errors, and
the sense of regret caused. For the manual functionalities, partici-
pants answered two questions about realiability and error-reducing.
We also collected the interaction logs while recording their screen
throughout the study.
7.2
Findings
7.2.1
Finish Rate, Time, and User ratings.
All participants success-
fully finished both tasks. In Task 1 (fact-checking), the ground truth
of the story should be true, supported by Pearson correlations be-
tween relevant data attributes (r = 0.91 for
GDP
vs.
Total Medals
and
r = 0.59 for
Population
vs.
Total Medals
. This fact remains true if the
participant chose other medal types). We discovered that 12 out of
15 participants reached a conclusion that matched the ground truth.
Of the three failures, P1 produced charts from the wrong dataset
because of an earlier data-cleaning error that corrupts a data col-
umn. P10 and P15 created the correct charts but interpreted them
differently: P10 overly focused on a few outliers and misjudged the
trends, while P15 believed that there were no significant differences
between the two indicators. In Task 2, participants used diverse
criteria to determine the product to buy, including the user rating
(13/15), size (6/15), refresh rate (3/15), sales (3/15), resolution (2/15),
the number of users rating the product (2/15), and platform (1/15).
We also noticed two participants who defined a custom score for
each product using a self-designed formula, and one participant
managed
to
compared
products
from
multiple
platforms.
Over-
all, participants spent 14.60 minutes (SD=4.47) and 12.65 minutes
(SD=6.58) on the two tasks, respectively.
In addition, participants were generally positive on WebSeek’s us-
ability, giving an average SUS score of 73.11/100 (SD=14.50). Mean-
while, as depicted in Figure 5(A), they also reported for both tasks a
high degree of confidence (M=5.33/7, SD=1.59 for Task 1; M=5.67/7,
SD=1.54 for Task 2) and sense of control (M=5.80/7, SD=1.08 for
Task 1; M=5.53/7, SD=1.41 for Task 2). Regarding the helpfulness
of the features (Figure 5(B)), participants generally spoke highly of
in-situ guidance (M=4.93/5, SD=0.26), chatting with AI (M=4.53/5,
SD=0.74), and direct manipulation (M=4.40/5, SD=0.99), while the
ratings on the peripheral guidance are mixed and notably lower
(M=3.42/5, SD=1.08). A similar pattern exists in the detailed ratings
on these features (Figure 6): generally, participants believed the top
three features were reliable and error-reducing, with the guidance
well-aligned with user intent and causing little regret. Peripheral
guidance, however, was less consistently seen as helpful though
viewed as positive on average.
7.2.2
User Behavior.
We analyzed the participants’ behavior pat-
terns during the tasks by analyzing the log data with the following
steps. First, we filtered out trivial interactions like open/close ed-
itors
and
repositioning
instances,
focusing
on
actions
that
were
crucial to the task outcome such as editing instances and applying
suggestions. The result events are classified into four categories:
in-situ guidance
,
peripheral guidance
,
chatting with AI
, and
direct
manipulation
. Second, we merged consecutive interactions of the
same category if their time gap is within a predefined threshold
(1.5 min in our analysis) to reveal patterns from the massive logs.
The merged result could be heuristically viewed as an active period
where users were devoted to an interaction modality. Finally, we
visualized the interaction timelines for each participant, inspected
the patterns, and annotated interesting individual trails. In total,
we collected logs of 29 valid sessions (15 participants
×
2 tasks; the
logs of P5 on Task 1 was missing due to some technical issues). We
will discuss below our major findings with a few selected examples,
and the complete visualizations are included in the supplemental
materials.
Statistics of the task completion process.
Overall, partici-
pants spent 67.1% of time (8.87 minutes on average per session) on
manual interactions, resulting in an average of 28.6 manual interac-
tions per session. Additionally, every participant performed more
than 70% of their interactions manually. These results indicate that
despite receiving diverse guidance, participants maintained a strong
preference for manual control and agency. Besides, we observe that
chatting with AI and in
-
situ suggestions were also commonly used:
they appeared in 86.2% and 82.8% of sessions, respectively, and ac-
counted for 61.5% and 35.2% of guidance-application events. Among
participants who used these features, the average usage was 4.5 chat
messages and 2.7 in
-
situ suggestion applications per session. By
contrast, peripheral suggestions were rarely applied: they were used
in only 13.8% of sessions and accounted for just 3.3% of guidance-
application events. Furthermore, we have noticed that the top 2
suggestion types were used together in 58.6% sessions, and 10.3%
sessions used all the suggestions types. Interestingly, there are 5
sessions (17.2%) in which only in-situ suggestions were the only
guidance used, and there are 3 sessions where only chatting with
AI were used, revealing diversity in participants’ preference of the
suggestion types.
Usage patterns.
Several usage patterns emerged from the de-
tailed participant trials. One of the most common is illustrated in
Figure 7, demonstrated here with an example workflow from Par-
ticipant 15 on Task 1. The user began with data extraction through
an iterative collaboration with the AI: (1) building data examples
manually, (2) receiving automatic table completions via in-situ sug-
gestions from the AI, and (3) accepting those suggestions. Next, the
user proceeded to data wrangling, predominantly using chat inter-
actions, peripheral guidance, or manual adjustments. During this
phase, in-situ suggestions were infrequently generated or accepted.
Finally, participants created data visualizations before making their
final
decisions,
often
revisiting
the
wrangling
stage
upon
notic-
ing issues. Throughout this stage, most participants performed the
majority
of the
work manually.
Such
a pattern
revealed
distinct
behavior
of
participants
between
different
stages
and
tasks.
We
further asked participants to reason about their interaction choices
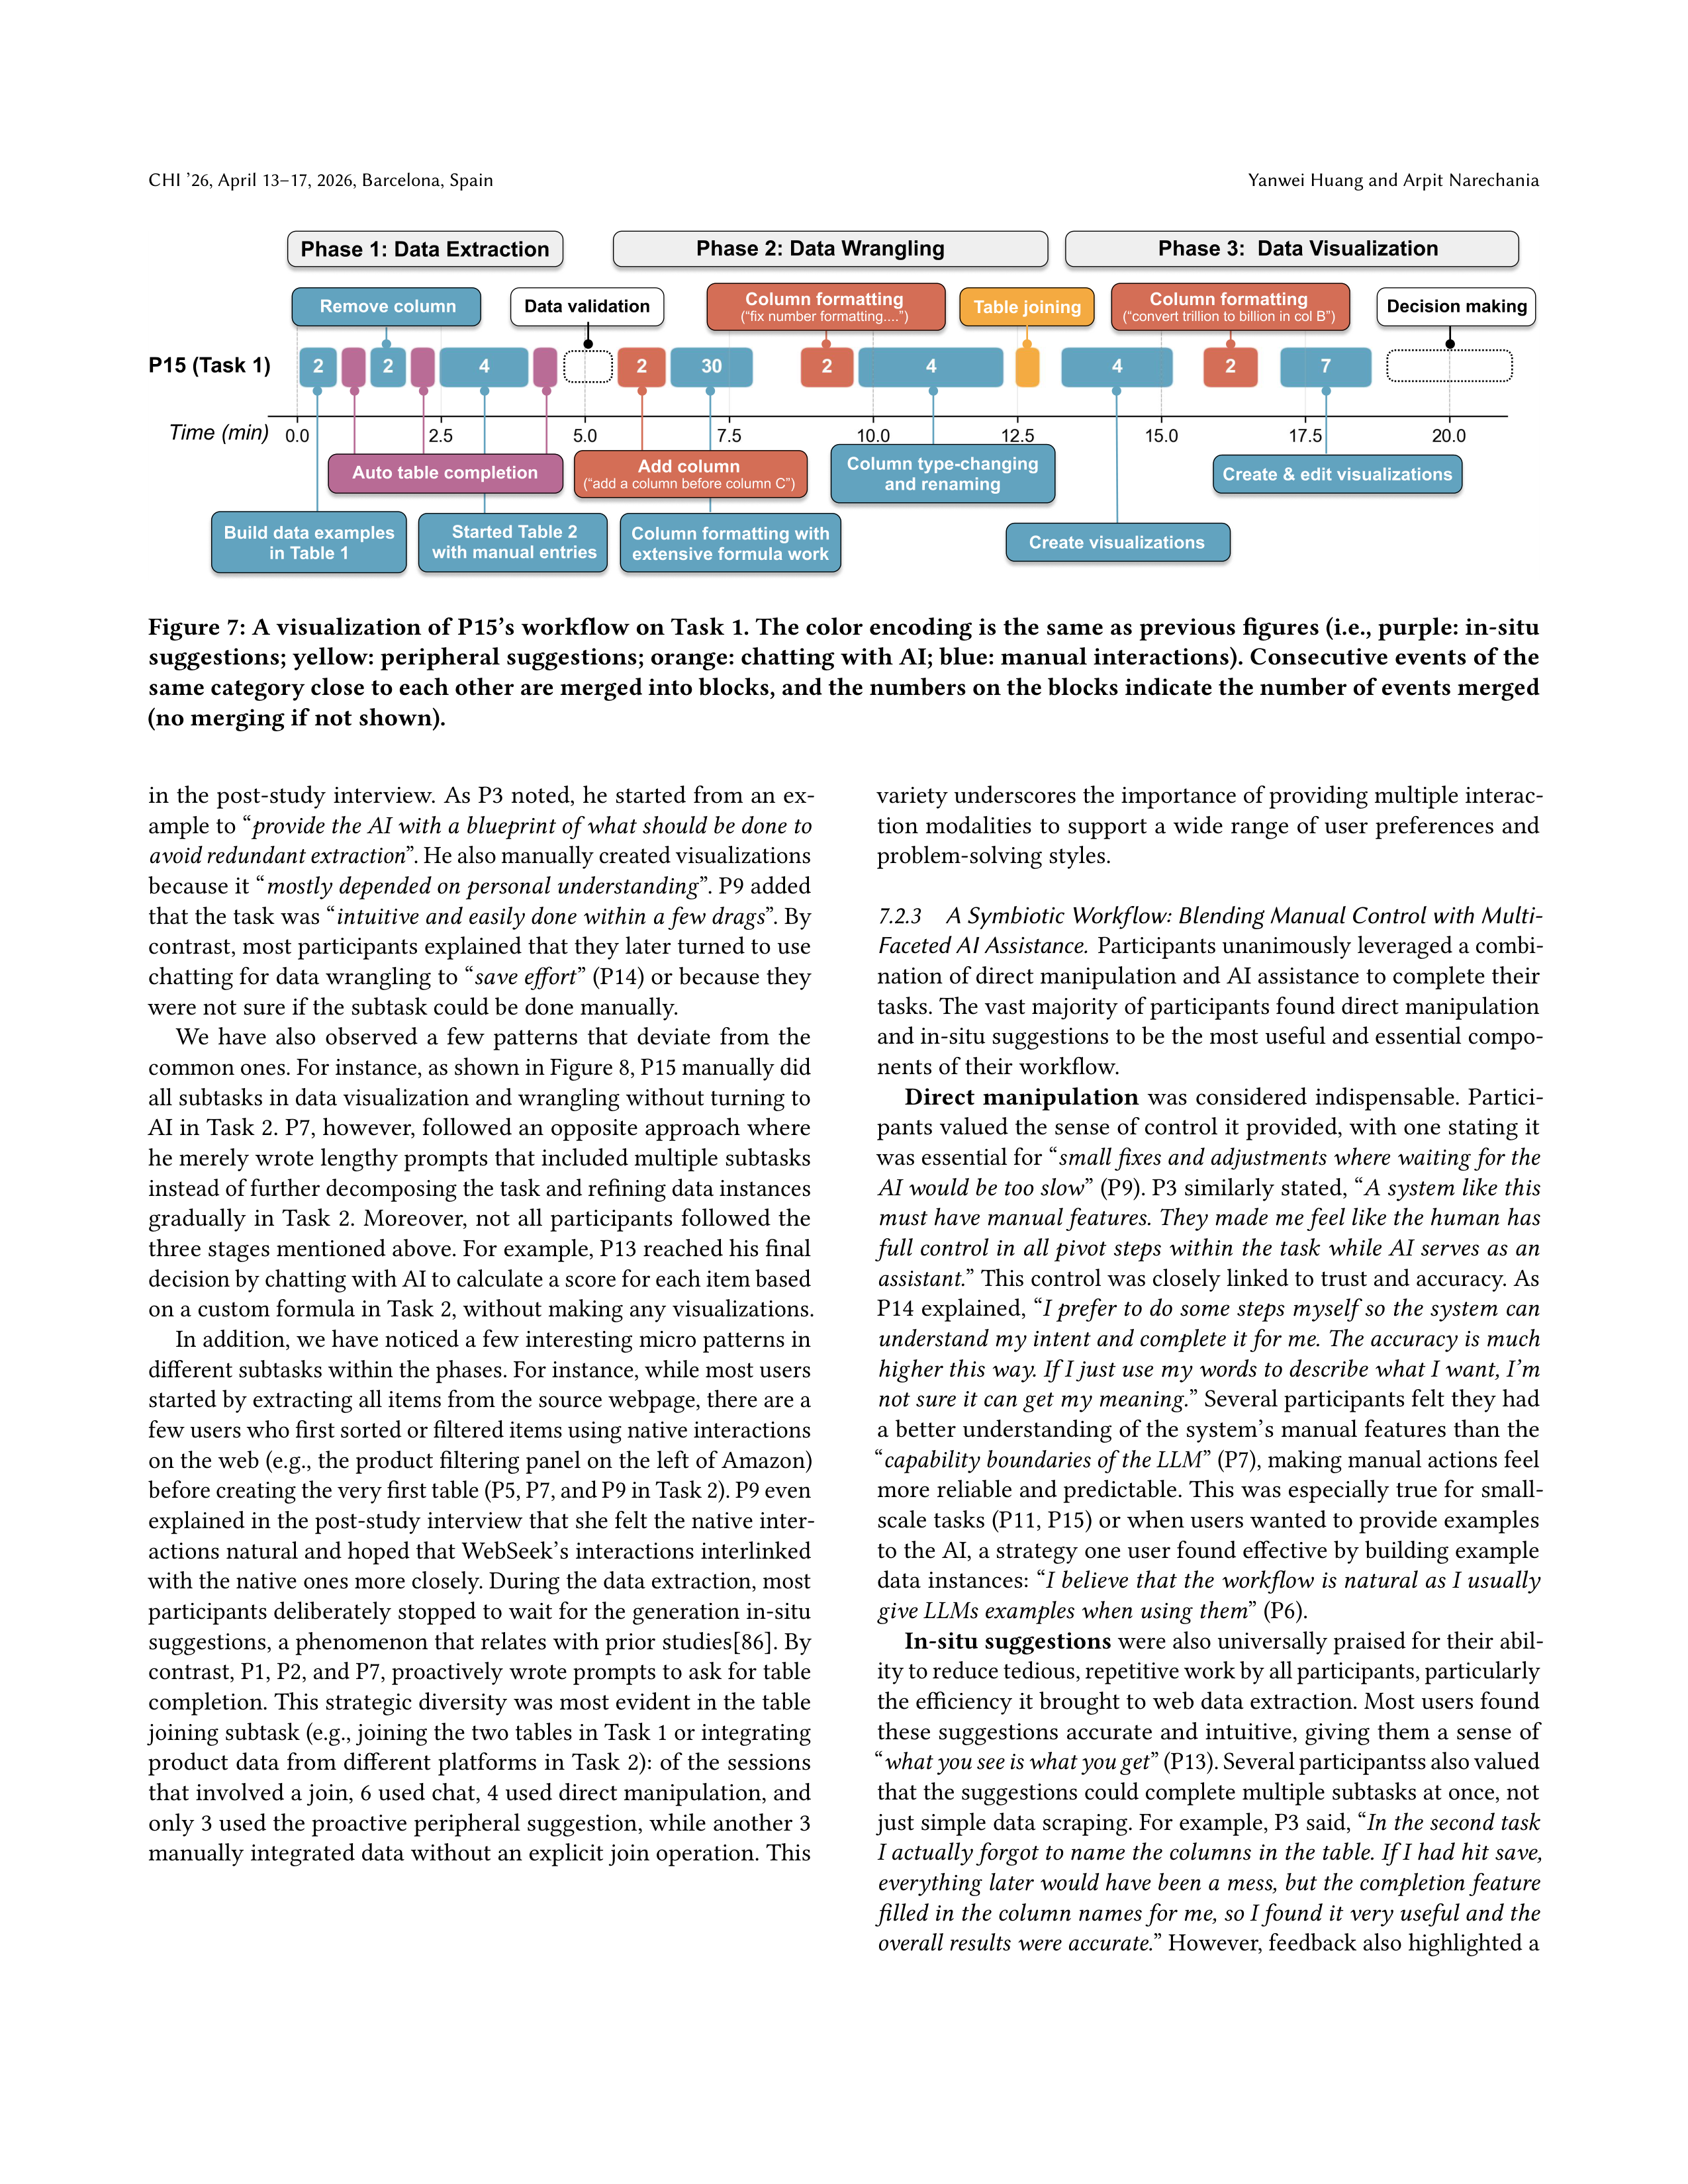


















CHI ’26, April 13–17, 2026, Barcelona, Spain
Yanwei Huang and Arpit Narechania
P15 (Task 1)
Phase 1: Data Extraction
Phase 2: Data Wrangling
Phase 3: Data Visualization
Build data examples
in Table 1
Remove column
Column formatting with
extensive formula work
Column type-changing
and renaming
Create visualizations
Create & edit visualizations
Table joining
Data validation
Started Table 2
with manual entries
Auto table completion
Add column
(“add a column before column C”)
Column formatting
(“fix number formatting....”)
Decision making
Column formatting
(“con
v
ert trillion to billion in col
B
”)
Time
(min)
Figure 7: A visualization of P15’s workflow on Task 1. The color encoding is the same as previous figures (i.e., purple: in-situ
suggestions; yellow: peripheral suggestions; orange: chatting with AI; blue: manual interactions). Consecutive events of the
same category close to each other are merged into blocks, and the numbers on the blocks indicate the number of events merged
(no merging if not shown).
in the post-study interview. As P3 noted, he started from an ex-
ample to “
provide the AI with a blueprint of what should be done to
avoid redundant extraction
”. He also manually created visualizations
because it “
mostly depended on personal understanding
”. P9 added
that the task was “
intuitive and easily done within a few drags
”. By
contrast, most participants explained that they later turned to use
chatting for data wrangling to “
save effort
” (P14) or because they
were not sure if the subtask could be done manually.
We
have
also
observed
a
few
patterns
that
deviate
from
the
common ones. For instance, as shown in Figure 8, P15 manually did
all subtasks in data visualization and wrangling without turning to
AI in Task 2. P7, however, followed an opposite approach where
he merely wrote lengthy prompts that included multiple subtasks
instead of further decomposing the task and refining data instances
gradually
in
Task
2.
Moreover,
not
all
participants
followed
the
three stages mentioned above. For example, P13 reached his final
decision by chatting with AI to calculate a score for each item based
on a custom formula in Task 2, without making any visualizations.
In addition, we have noticed a few interesting micro patterns in
different subtasks within the phases. For instance, while most users
started by extracting all items from the source webpage, there are a
few users who first sorted or filtered items using native interactions
on the web (e.g., the product filtering panel on the left of Amazon)
before creating the very first table (P5, P7, and P9 in Task 2). P9 even
explained in the post-study interview that she felt the native inter-
actions natural and hoped that WebSeek’s interactions interlinked
with the native ones more closely. During the data extraction, most
participants deliberately stopped to wait for the generation in-situ
suggestions, a phenomenon that relates with prior studies[
86
]. By
contrast, P1, P2, and P7, proactively wrote prompts to ask for table
completion. This strategic diversity was most evident in the table
joining subtask (e.g., joining the two tables in Task 1 or integrating
product data from different platforms in Task 2): of the sessions
that involved a join, 6 used chat, 4 used direct manipulation, and
only 3 used the proactive peripheral suggestion, while another 3
manually integrated data without an explicit join operation. This
variety underscores the importance of providing multiple interac-
tion modalities to support a wide range of user preferences and
problem-solving styles.
7.2.3
A Symbiotic Workflow: Blending Manual Control with Multi-
Faceted AI Assistance.
Participants unanimously leveraged a combi-
nation of direct manipulation and AI assistance to complete their
tasks. The vast majority of participants found direct manipulation
and in-situ suggestions to be the most useful and essential compo-
nents of their workflow.
Direct
manipulation
was
considered
indispensable.
Partici-
pants valued the sense of control it provided, with one stating it
was essential for “
small fixes and adjustments where waiting for the
AI would be too slow
” (P9). P3 similarly stated, “
A system like this
must have manual features. They made me feel like the human has
full control in all pivot steps within the task while AI serves as an
assistant.
” This control was closely linked to trust and accuracy. As
P14 explained, “
I prefer to do some steps myself so the system can
understand my intent and complete it for me. The accuracy is much
higher this way. If I just use my words to describe what I want, I’m
not sure it can get my meaning.
” Several participants felt they had
a better understanding of the system’s manual features than the
“
capability boundaries of the LLM
” (P7), making manual actions feel
more reliable and predictable. This was especially true for small-
scale tasks (P11, P15) or when users wanted to provide examples
to the AI, a strategy one user found effective by building example
data instances: “
I believe that the workflow is natural as I usually
give LLMs examples when using them
” (P6).
In-situ suggestions
were also universally praised for their abil-
ity to reduce tedious, repetitive work by all participants, particularly
the efficiency it brought to web data extraction. Most users found
these suggestions accurate and intuitive, giving them a sense of
“
what you see is what you get
” (P13). Several participantss also valued
that the suggestions could complete multiple subtasks at once, not
just simple data scraping. For example, P3 said, “
In the second task
I actually forgot to name the columns in the table. If I had hit save,
everything later would have been a mess, but the completion feature
filled in the column names for me, so I found it very useful and the
overall results were accurate.
” However, feedback also highlighted a
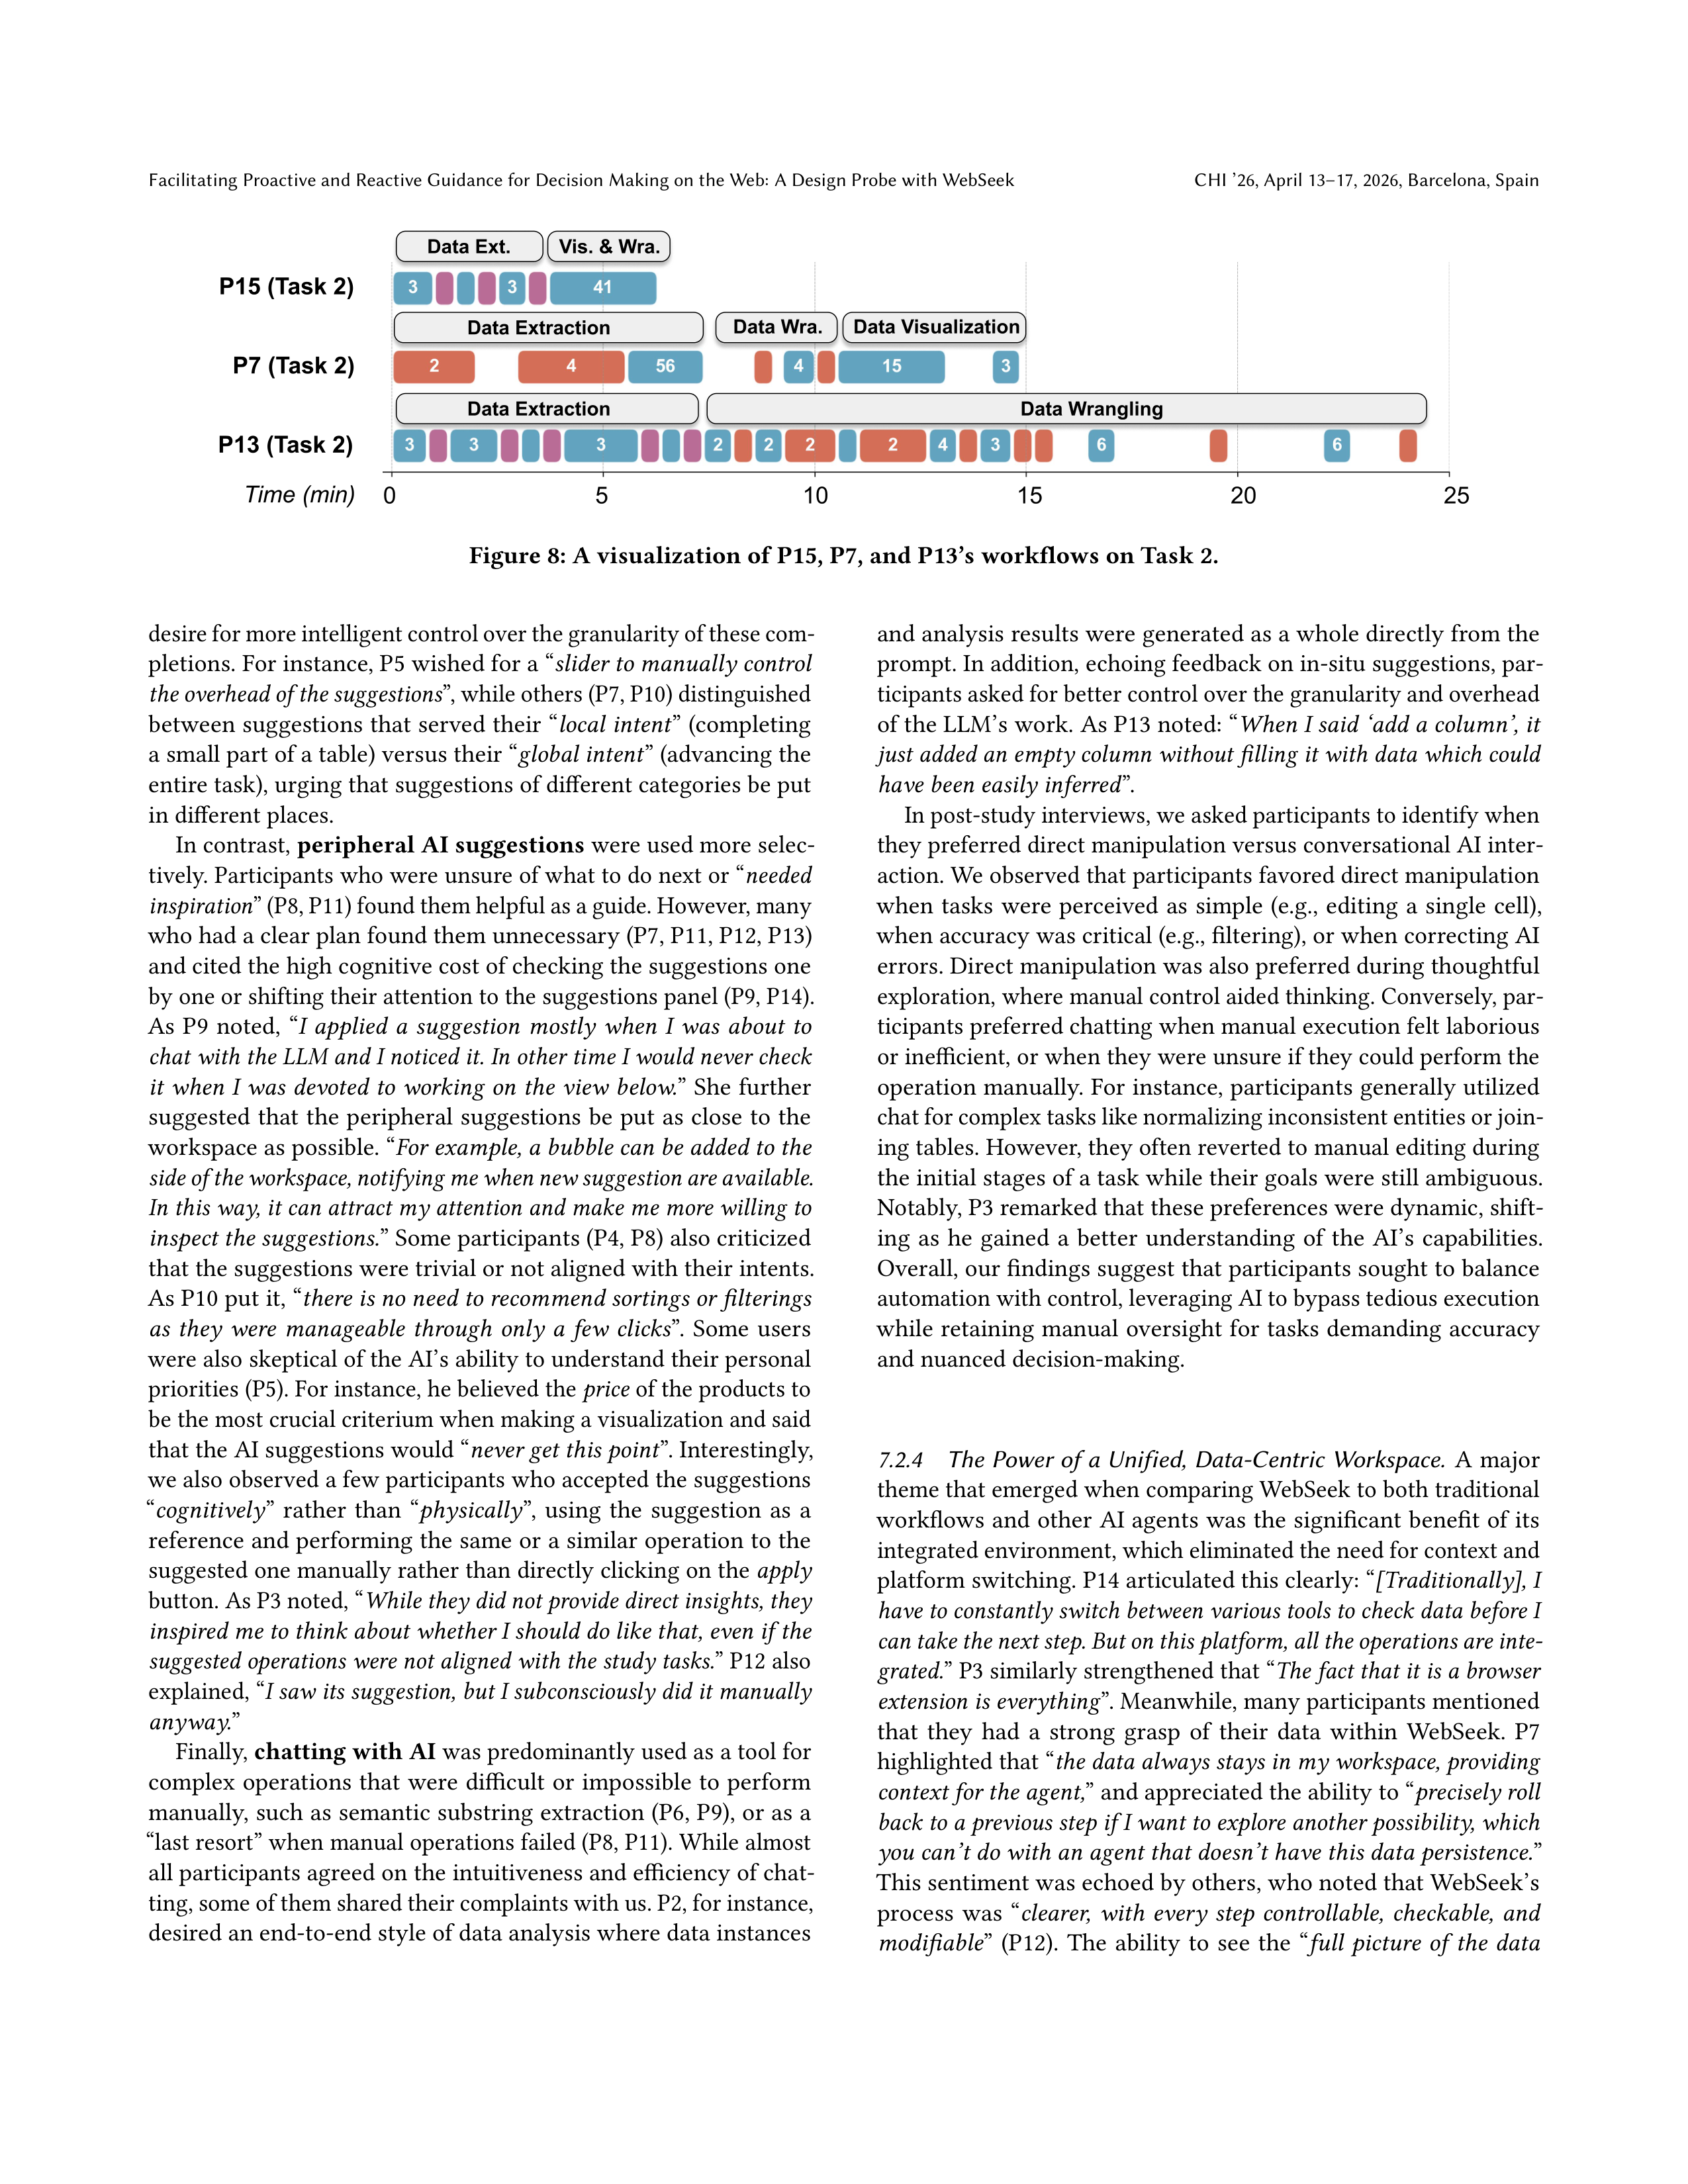
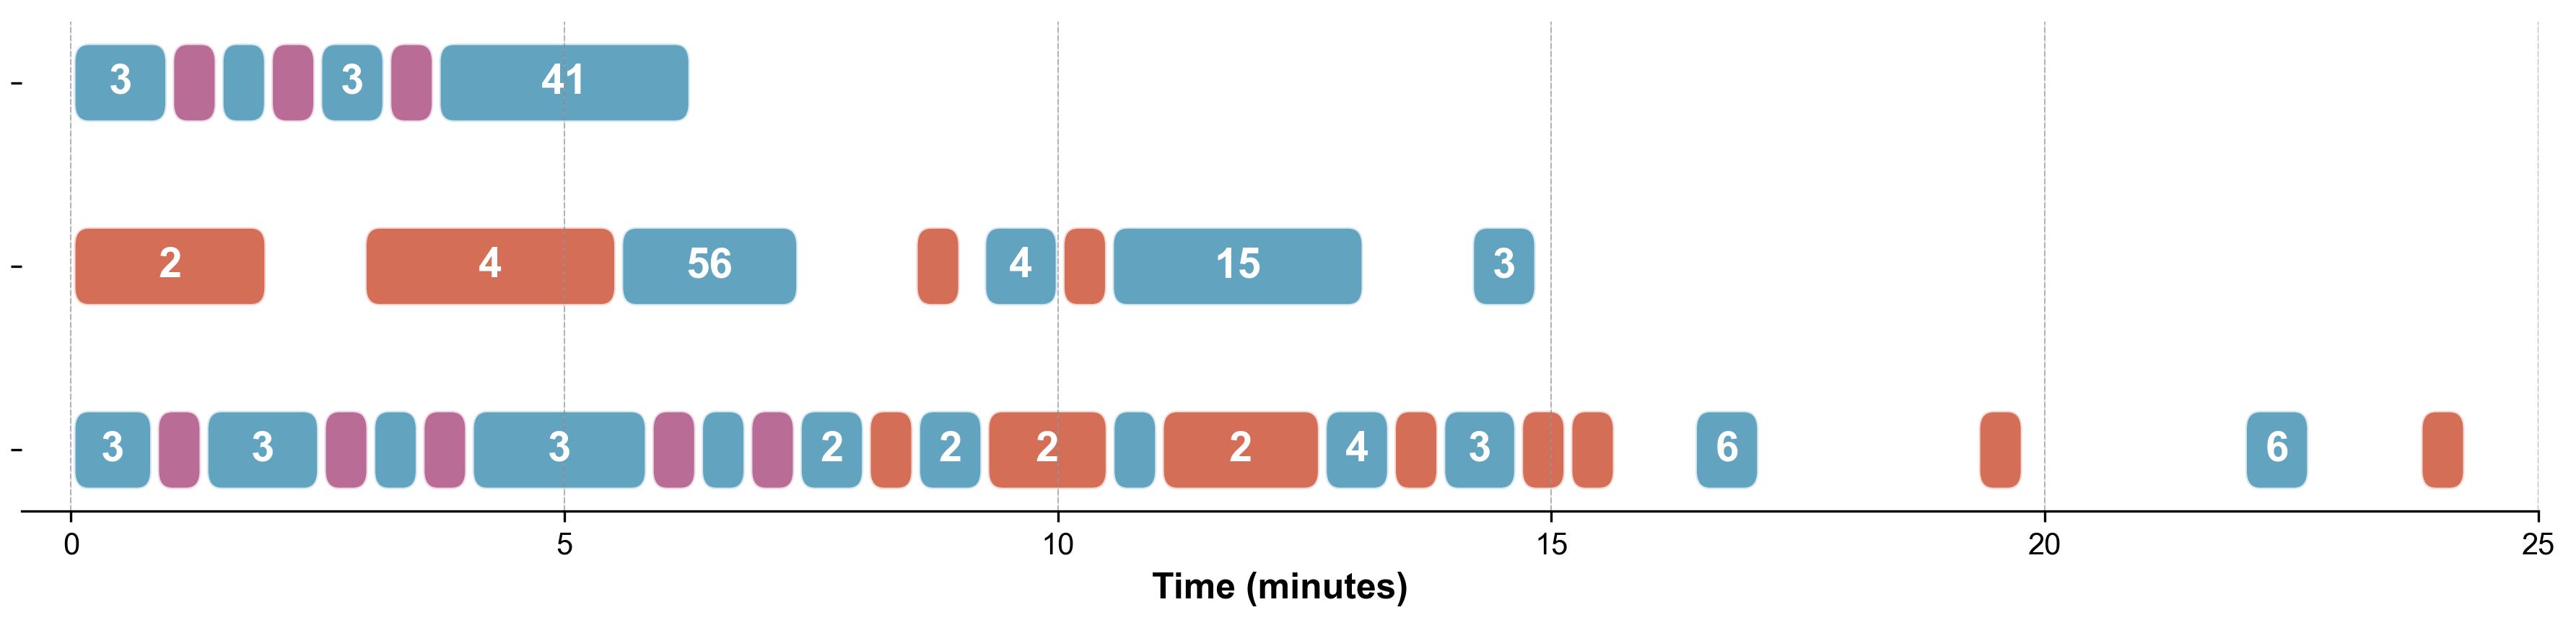







Facilitating Proactive and Reactive Guidance for Decision Making on the Web: A Design Probe with WebSeek
CHI ’26, April 13–17, 2026, Barcelona, Spain
P15 (Task 2)
P7 (Task 2)
P13 (Task 2)
Data Ext.
Vis. & Wra.
Data Extraction
Data Wra.
Data Visualization
Data Extraction
Data Wrangling
Time (min)
0
5
15
20
25
10
Figure 8: A visualization of P15, P7, and P13’s workflows on Task 2.
desire for more intelligent control over the granularity of these com-
pletions. For instance, P5 wished for a “
slider to manually control
the overhead of the suggestions
”, while others (P7, P10) distinguished
between suggestions that served their “
local intent
” (completing
a small part of a table) versus their “
global intent
” (advancing the
entire task), urging that suggestions of different categories be put
in different places.
In contrast,
peripheral AI suggestions
were used more selec-
tively. Participants who were unsure of what to do next or “
needed
inspiration
” (P8, P11) found them helpful as a guide. However, many
who had a clear plan found them unnecessary (P7, P11, P12, P13)
and cited the high cognitive cost of checking the suggestions one
by one or shifting their attention to the suggestions panel (P9, P14).
As
P9
noted,
“
I
applied
a
suggestion
mostly
when
I
was
about
to
chat with the LLM and I noticed it. In other time I would never check
it
when
I
was
devoted
to
working
on
the
view
below.
”
She
further
suggested
that
the
peripheral
suggestions
be
put
as
close
to
the
workspace as possible. “
For example, a bubble can be added to the
side of the workspace, notifying me when new suggestion are available.
In this way, it can attract my attention and make me more willing to
inspect the suggestions.
” Some participants (P4, P8) also criticized
that the suggestions were trivial or not aligned with their intents.
As P10 put it, “
there is no need to recommend sortings or filterings
as
they
were
manageable
through
only
a
few
clicks
”.
Some
users
were also skeptical of the AI’s ability to understand their personal
priorities (P5). For instance, he believed the
price
of the products to
be the most crucial criterium when making a visualization and said
that the AI suggestions would “
never get this point
”. Interestingly,
we also observed a few participants who accepted the suggestions
“
cognitively
”
rather
than
“
physically
”,
using
the
suggestion
as
a
reference and performing the same or a similar operation to the
suggested one manually rather than directly clicking on the
apply
button. As P3 noted, “
While they did not provide direct insights, they
inspired me to think about whether I should do like that, even if the
suggested operations were not aligned with the study tasks.
” P12 also
explained, “
I saw its suggestion, but I subconsciously did it manually
anyway.
”
Finally,
chatting with AI
was predominantly used as a tool for
complex operations that were difficult or impossible to perform
manually, such as semantic substring extraction (P6, P9), or as a
“last resort” when manual operations failed (P8, P11). While almost
all participants agreed on the intuitiveness and efficiency of chat-
ting, some of them shared their complaints with us. P2, for instance,
desired an end-to-end style of data analysis where data instances
and analysis results were generated as a whole directly from the
prompt. In addition, echoing feedback on in-situ suggestions, par-
ticipants asked for better control over the granularity and overhead
of the LLM’s work. As P13 noted: “
When I said ‘add a column’, it
just added an empty column without filling it with data which could
have been easily inferred
”.
In post-study interviews, we asked participants to identify when
they preferred direct manipulation versus conversational AI inter-
action. We observed that participants favored direct manipulation
when
tasks
were
perceived
as
simple
(e.g.,
editing
a
single
cell),
when accuracy was critical (e.g., filtering), or when correcting AI
errors. Direct manipulation was also preferred during thoughtful
exploration, where manual control aided thinking. Conversely, par-
ticipants preferred chatting when manual execution felt laborious
or inefficient, or when they were unsure if they could perform the
operation manually. For instance, participants generally utilized
chat for complex tasks like normalizing inconsistent entities or join-
ing tables. However, they often reverted to manual editing during
the initial stages of a task while their goals were still ambiguous.
Notably, P3 remarked that these preferences were dynamic, shift-
ing
as
he
gained
a
better
understanding
of
the
AI’s
capabilities.
Overall, our findings suggest that participants sought to balance
automation with control, leveraging AI to bypass tedious execution
while retaining manual oversight for tasks demanding accuracy
and nuanced decision-making.
7.2.4
The Power of a Unified, Data-Centric Workspace.
A major
theme that emerged when comparing WebSeek to both traditional
workflows and other AI agents was the significant benefit of its
integrated environment, which eliminated the need for context and
platform switching. P14 articulated this clearly: “
[Traditionally], I
have to constantly switch between various tools to check data before I
can take the next step. But on this platform, all the operations are inte-
grated.
” P3 similarly strengthened that “
The fact that it is a browser
extension is everything
”. Meanwhile, many participants mentioned
that
they
had
a
strong
grasp
of
their
data
within
WebSeek.
P7
highlighted that “
the data always stays in my workspace, providing
context for the agent,
” and appreciated the ability to “
precisely roll
back to a previous step if I want to explore another possibility, which
you can’t do with an agent that doesn’t have this data persistence.
”
This sentiment was echoed by others, who noted that WebSeek’s
process
was
“
clearer,
with
every
step
controllable,
checkable,
and
modifiable
”
(P12).
The
ability
to
see
the
“
full
picture
of
the
data
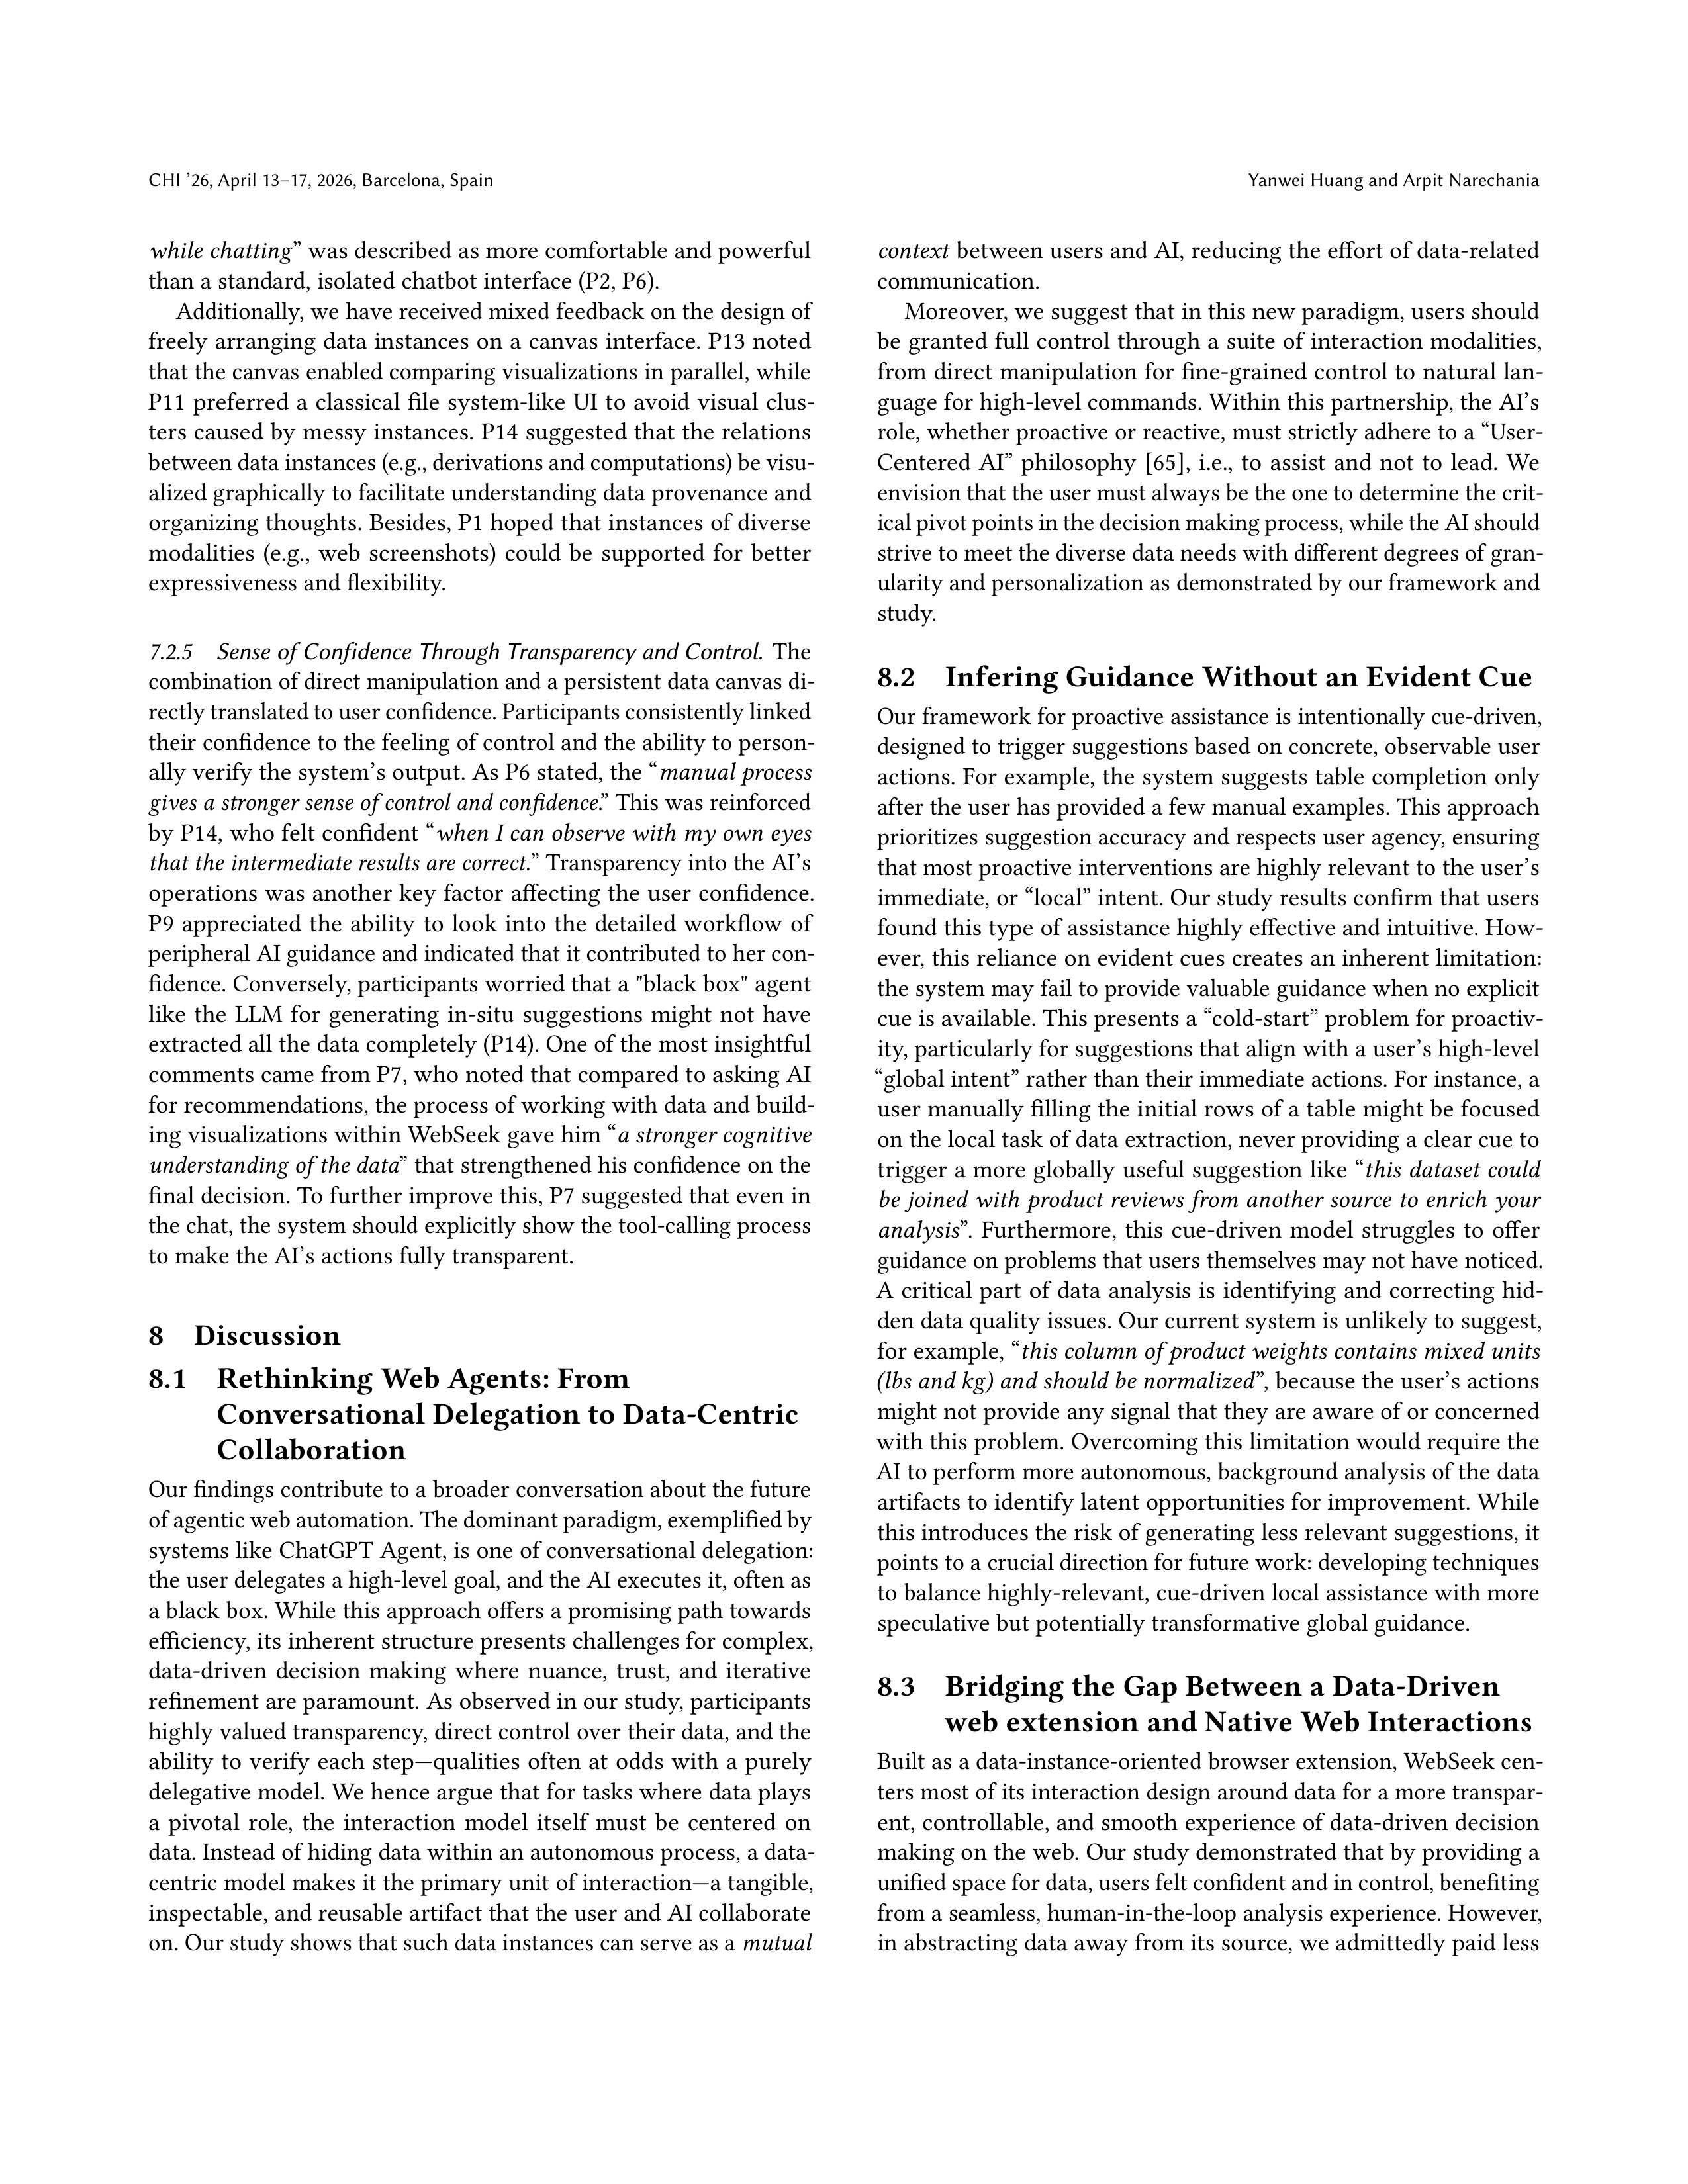
CHI ’26, April 13–17, 2026, Barcelona, Spain
Yanwei Huang and Arpit Narechania
while chatting
” was described as more comfortable and powerful
than a standard, isolated chatbot interface (P2, P6).
Additionally, we have received mixed feedback on the design of
freely arranging data instances on a canvas interface. P13 noted
that the canvas enabled comparing visualizations in parallel, while
P11
preferred
a
classical
file
system-like
UI
to
avoid
visual
clus-
ters caused by messy instances. P14 suggested that the relations
between data instances (e.g., derivations and computations) be visu-
alized graphically to facilitate understanding data provenance and
organizing thoughts. Besides, P1 hoped that instances of diverse
modalities
(e.g.,
web
screenshots)
could
be
supported
for
better
expressiveness and flexibility.
7.2.5
Sense of Confidence Through Transparency and Control.
The
combination of direct manipulation and a persistent data canvas di-
rectly translated to user confidence. Participants consistently linked
their confidence to the feeling of control and the ability to person-
ally verify the system’s output. As P6 stated, the “
manual process
gives a stronger sense of control and confidence
.” This was reinforced
by P14, who felt confident “
when I can observe with my own eyes
that the intermediate results are correct.
” Transparency into the AI’s
operations was another key factor affecting the user confidence.
P9
appreciated
the
ability
to
look
into
the
detailed
workflow
of
peripheral AI guidance and indicated that it contributed to her con-
fidence. Conversely, participants worried that a "black box" agent
like
the
LLM
for
generating
in-situ
suggestions
might
not
have
extracted all the data completely (P14). One of the most insightful
comments came from P7, who noted that compared to asking AI
for recommendations, the process of working with data and build-
ing visualizations within WebSeek gave him “
a stronger cognitive
understanding of the data
” that strengthened his confidence on the
final decision. To further improve this, P7 suggested that even in
the chat, the system should explicitly show the tool-calling process
to make the AI’s actions fully transparent.
8
Discussion
8.1
Rethinking Web Agents: From
Conversational Delegation to Data-Centric
Collaboration
Our findings contribute to a broader conversation about the future
of agentic web automation. The dominant paradigm, exemplified by
systems like ChatGPT Agent, is one of conversational delegation:
the user delegates a high-level goal, and the AI executes it, often as
a black box. While this approach offers a promising path towards
efficiency, its inherent structure presents challenges for complex,
data-driven
decision
making
where
nuance,
trust,
and
iterative
refinement are paramount. As observed in our study, participants
highly valued transparency, direct control over their data, and the
ability
to verify
each step—qualities
often at
odds with
a purely
delegative model. We hence argue that for tasks where data plays
a
pivotal
role,
the
interaction
model
itself
must
be
centered
on
data. Instead of hiding data within an autonomous process, a data-
centric model makes it the primary unit of interaction—a tangible,
inspectable, and reusable artifact that the user and AI collaborate
on. Our study shows that such data instances can serve as a
mutual
context
between users and AI, reducing the effort of data-related
communication.
Moreover, we suggest that in this new paradigm, users should
be granted full control through a suite of interaction modalities,
from direct manipulation for fine-grained control to natural lan-
guage for high-level commands. Within this partnership, the AI’s
role, whether proactive or reactive, must strictly adhere to a “User-
Centered
AI”
philosophy
[
65
],
i.e.,
to
assist
and
not
to
lead.
We
envision that the user must always be the one to determine the crit-
ical pivot points in the decision making process, while the AI should
strive to meet the diverse data needs with different degrees of gran-
ularity and personalization as demonstrated by our framework and
study.
8.2
Infering Guidance Without an Evident Cue
Our framework for proactive assistance is intentionally cue-driven,
designed to trigger suggestions based on concrete, observable user
actions. For example, the system suggests table completion only
after the user has provided a few manual examples. This approach
prioritizes suggestion accuracy and respects user agency, ensuring
that most proactive interventions are highly relevant to the user’s
immediate, or “local” intent. Our study results confirm that users
found this type of assistance highly effective and intuitive. How-
ever, this reliance on evident cues creates an inherent limitation:
the system may fail to provide valuable guidance when no explicit
cue is available. This presents a “cold-start” problem for proactiv-
ity, particularly for suggestions that align with a user’s high-level
“global intent” rather than their immediate actions. For instance, a
user manually filling the initial rows of a table might be focused
on the local task of data extraction, never providing a clear cue to
trigger a more globally useful suggestion like “
this dataset could
be joined with product reviews from another source to enrich your
analysis
”.
Furthermore,
this
cue-driven
model
struggles
to
offer
guidance on problems that users themselves may not have noticed.
A
critical
part of
data
analysis
is identifying
and
correcting
hid-
den data quality issues. Our current system is unlikely to suggest,
for example, “
this column of product weights contains mixed units
(lbs and kg) and should be normalized
”, because the user’s actions
might not provide any signal that they are aware of or concerned
with this problem. Overcoming this limitation would require the
AI to perform more autonomous, background analysis of the data
artifacts to identify latent opportunities for improvement. While
this introduces the risk of generating less relevant suggestions, it
points to a crucial direction for future work: developing techniques
to balance highly-relevant, cue-driven local assistance with more
speculative but potentially transformative global guidance.
8.3
Bridging the Gap Between a Data-Driven
web extension and Native Web Interactions
Built as a data-instance-oriented browser extension, WebSeek cen-
ters most of its interaction design around data for a more transpar-
ent, controllable, and smooth experience of data-driven decision
making on the web. Our study demonstrated that by providing a
unified space for data, users felt confident and in control, benefiting
from a seamless, human-in-the-loop analysis experience. However,
in abstracting data away from its source, we admittedly paid less
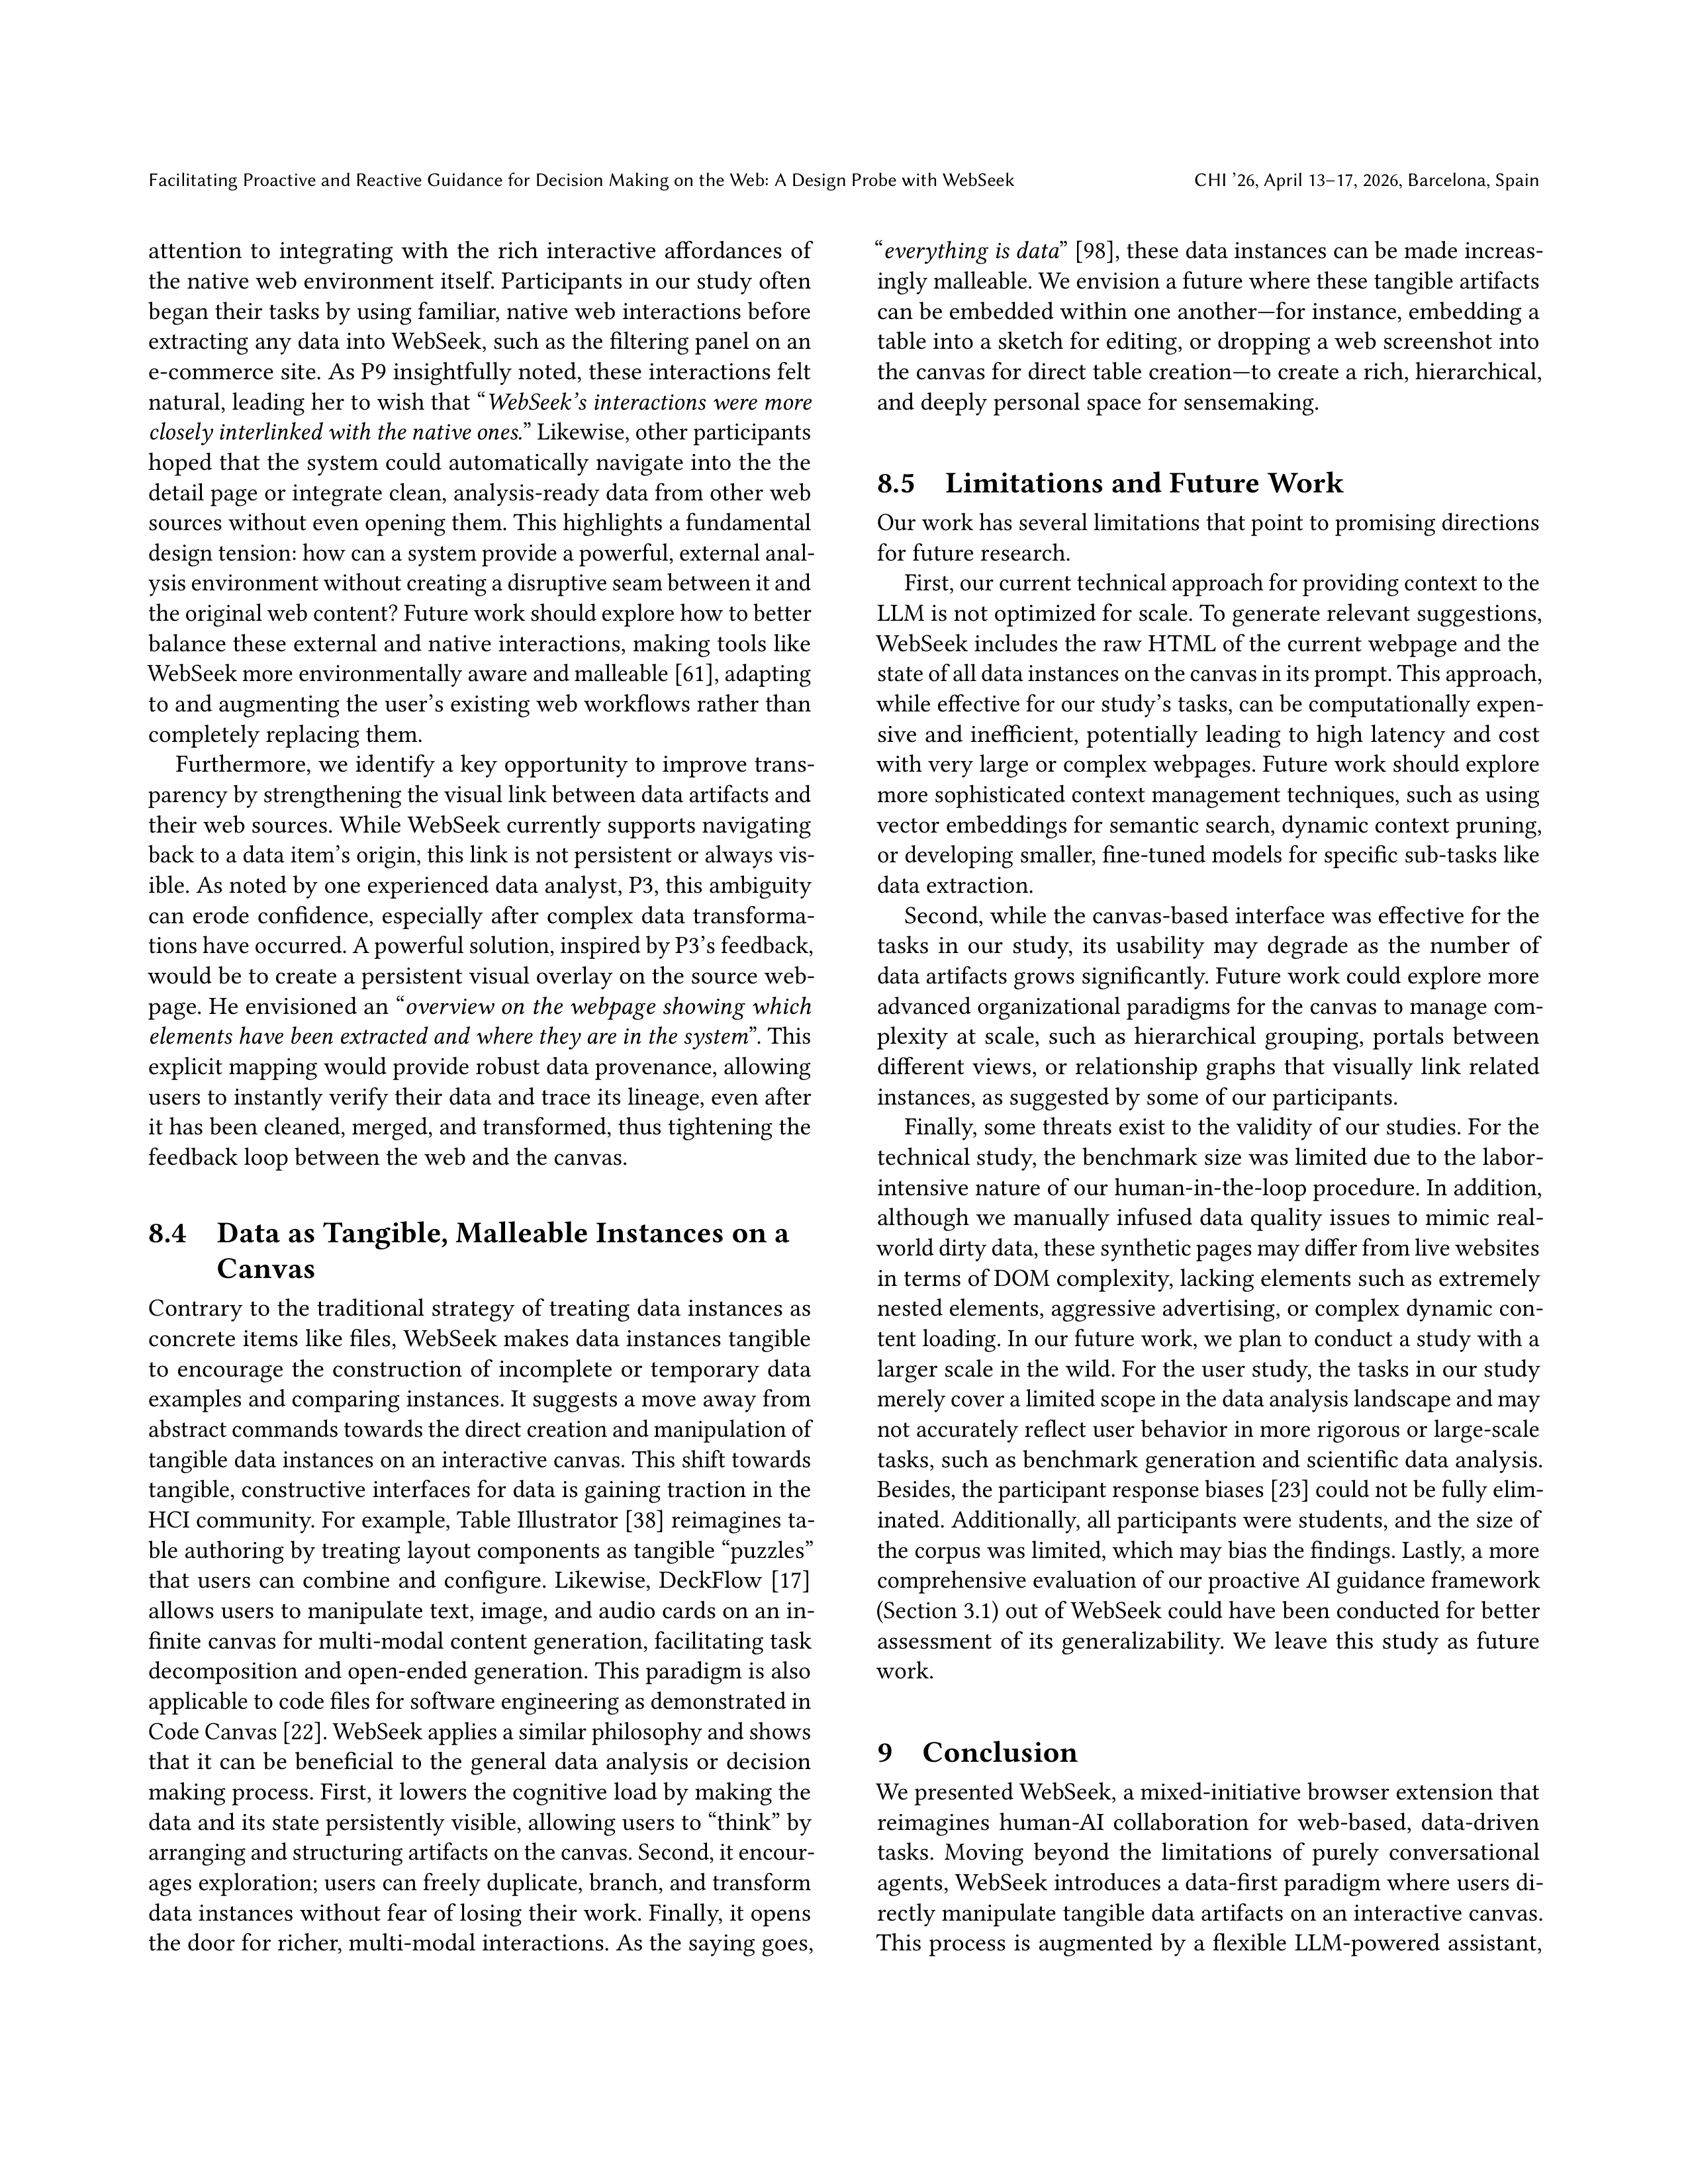
Facilitating Proactive and Reactive Guidance for Decision Making on the Web: A Design Probe with WebSeek
CHI ’26, April 13–17, 2026, Barcelona, Spain
attention
to
integrating
with
the
rich
interactive
affordances
of
the native web environment itself. Participants in our study often
began their tasks by using familiar, native web interactions before
extracting any data into WebSeek, such as the filtering panel on an
e-commerce site. As P9 insightfully noted, these interactions felt
natural, leading her to wish that “
WebSeek’s interactions were more
closely interlinked with the native ones.
” Likewise, other participants
hoped that the system could automatically navigate into the the
detail page or integrate clean, analysis-ready data from other web
sources without even opening them. This highlights a fundamental
design tension: how can a system provide a powerful, external anal-
ysis environment without creating a disruptive seam between it and
the original web content? Future work should explore how to better
balance these external and native interactions, making tools like
WebSeek more environmentally aware and malleable [
61
], adapting
to and augmenting the user’s existing web workflows rather than
completely replacing them.
Furthermore, we identify a key opportunity to improve trans-
parency by strengthening the visual link between data artifacts and
their web sources. While WebSeek currently supports navigating
back to a data item’s origin, this link is not persistent or always vis-
ible. As noted by one experienced data analyst, P3, this ambiguity
can
erode
confidence,
especially
after
complex
data
transforma-
tions have occurred. A powerful solution, inspired by P3’s feedback,
would be to create a persistent visual overlay on the source web-
page. He envisioned an “
overview on the webpage showing which
elements have been extracted and where they are in the system
”. This
explicit mapping would provide robust data provenance, allowing
users to instantly verify their data and trace its lineage, even after
it has been cleaned, merged, and transformed, thus tightening the
feedback loop between the web and the canvas.
8.4
Data as Tangible, Malleable Instances on a
Canvas
Contrary to the traditional strategy of treating data instances as
concrete items like files, WebSeek makes data instances tangible
to
encourage
the
construction
of
incomplete
or
temporary
data
examples and comparing instances. It suggests a move away from
abstract commands towards the direct creation and manipulation of
tangible data instances on an interactive canvas. This shift towards
tangible, constructive interfaces for data is gaining traction in the
HCI community. For example, Table Illustrator [
38
] reimagines ta-
ble authoring by treating layout components as tangible “puzzles”
that
users
can
combine
and
configure.
Likewise,
DeckFlow
[
17
]
allows users to manipulate text, image, and audio cards on an in-
finite canvas for multi-modal content generation, facilitating task
decomposition and open-ended generation. This paradigm is also
applicable to code files for software engineering as demonstrated in
Code Canvas [
22
]. WebSeek applies a similar philosophy and shows
that
it
can
be
beneficial
to
the
general
data
analysis
or
decision
making process. First, it lowers the cognitive load by making the
data and its state persistently visible, allowing users to “think” by
arranging and structuring artifacts on the canvas. Second, it encour-
ages exploration; users can freely duplicate, branch, and transform
data instances without fear of losing their work. Finally, it opens
the door for richer, multi-modal interactions. As the saying goes,
“
everything is data
” [
98
], these data instances can be made increas-
ingly malleable. We envision a future where these tangible artifacts
can be embedded within one another—for instance, embedding a
table into a sketch for editing, or dropping a web screenshot into
the canvas for direct table creation—to create a rich, hierarchical,
and deeply personal space for sensemaking.
8.5
Limitations and Future Work
Our work has several limitations that point to promising directions
for future research.
First, our current technical approach for providing context to the
LLM is not optimized for scale. To generate relevant suggestions,
WebSeek includes the raw HTML of the current webpage and the
state of all data instances on the canvas in its prompt. This approach,
while effective for our study’s tasks, can be computationally expen-
sive and inefficient, potentially leading to high latency and cost
with very large or complex webpages. Future work should explore
more sophisticated context management techniques, such as using
vector embeddings for semantic search, dynamic context pruning,
or developing smaller, fine-tuned models for specific sub-tasks like
data extraction.
Second, while the canvas-based interface was effective for the
tasks
in
our
study,
its
usability
may
degrade
as
the
number
of
data artifacts grows significantly. Future work could explore more
advanced organizational paradigms for the canvas to manage com-
plexity
at
scale,
such
as
hierarchical
grouping,
portals
between
different
views,
or
relationship
graphs
that
visually
link
related
instances, as suggested by some of our participants.
Finally, some threats exist to the validity of our studies. For the
technical study, the benchmark size was limited due to the labor-
intensive nature of our human-in-the-loop procedure. In addition,
although we manually infused data quality issues to mimic real-
world dirty data, these synthetic pages may differ from live websites
in terms of DOM complexity, lacking elements such as extremely
nested elements, aggressive advertising, or complex dynamic con-
tent loading. In our future work, we plan to conduct a study with a
larger scale in the wild. For the user study, the tasks in our study
merely cover a limited scope in the data analysis landscape and may
not accurately reflect user behavior in more rigorous or large-scale
tasks, such as benchmark generation and scientific data analysis.
Besides, the participant response biases [
23
] could not be fully elim-
inated. Additionally, all participants were students, and the size of
the corpus was limited, which may bias the findings. Lastly, a more
comprehensive evaluation of our proactive AI guidance framework
(Section 3.1) out of WebSeek could have been conducted for better
assessment
of
its
generalizability.
We
leave
this
study
as
future
work.
9
Conclusion
We presented WebSeek, a mixed-initiative browser extension that
reimagines
human-AI
collaboration
for
web-based,
data-driven
tasks.
Moving
beyond
the
limitations
of
purely
conversational
agents, WebSeek introduces a data-first paradigm where users di-
rectly manipulate tangible data artifacts on an interactive canvas.
This
process
is
augmented
by
a
flexible
LLM-powered
assistant,
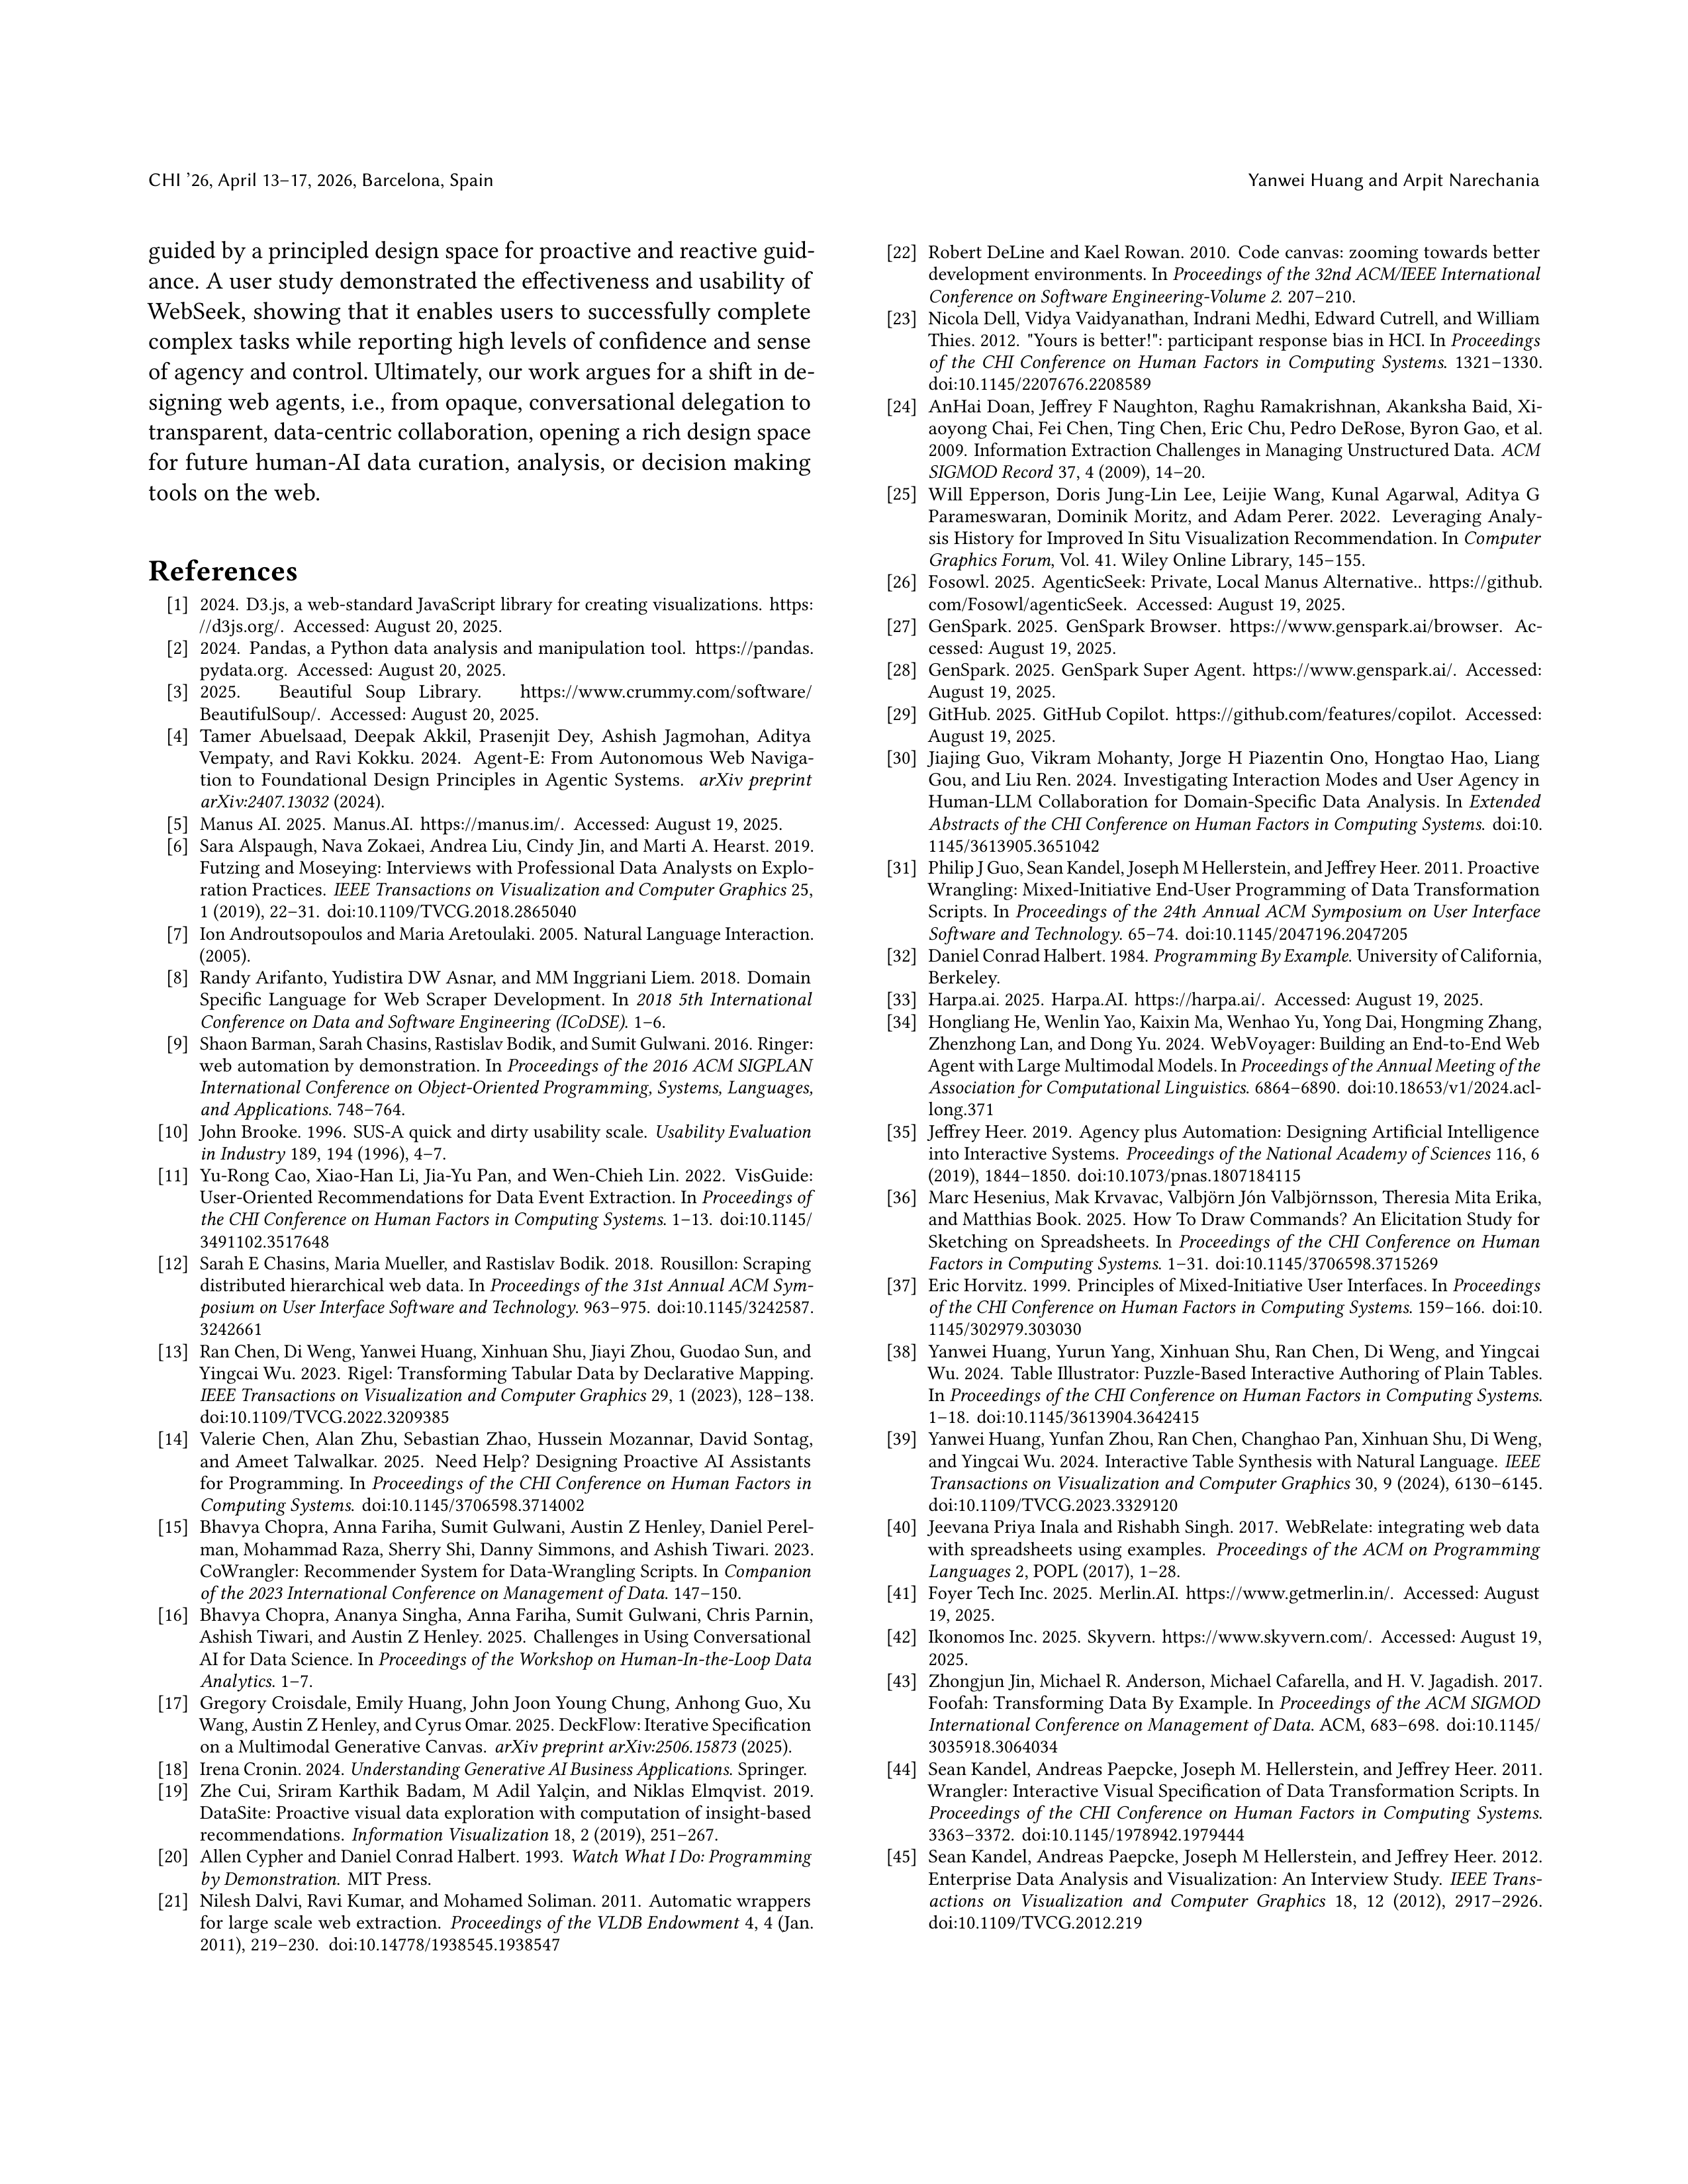
CHI ’26, April 13–17, 2026, Barcelona, Spain
Yanwei Huang and Arpit Narechania
guided by a principled design space for proactive and reactive guid-
ance. A user study demonstrated the effectiveness and usability of
WebSeek, showing that it enables users to successfully complete
complex tasks while reporting high levels of confidence and sense
of agency and control. Ultimately, our work argues for a shift in de-
signing web agents, i.e., from opaque, conversational delegation to
transparent, data-centric collaboration, opening a rich design space
for future human-AI data curation, analysis, or decision making
tools on the web.
References
[1]
2024.
D3.js, a web-standard JavaScript library for creating visualizations.
https:
//d3js.org/.
Accessed: August 20, 2025.
[2]
2024.
Pandas, a Python data analysis and manipulation tool.
https://pandas.
pydata.org.
Accessed: August 20, 2025.
[3]
2025.
Beautiful
Soup
Library.
https://www.crummy.com/software/
BeautifulSoup/.
Accessed: August 20, 2025.
[4]
Tamer
Abuelsaad,
Deepak
Akkil,
Prasenjit
Dey,
Ashish
Jagmohan,
Aditya
Vempaty,
and
Ravi
Kokku.
2024.
Agent-E:
From
Autonomous
Web
Naviga-
tion
to
Foundational
Design
Principles
in
Agentic
Systems.
arXiv
preprint
arXiv:2407.13032
(2024).
[5]
Manus AI. 2025.
Manus.AI.
https://manus.im/.
Accessed: August 19, 2025.
[6]
Sara Alspaugh, Nava Zokaei, Andrea Liu, Cindy Jin, and Marti A. Hearst. 2019.
Futzing and Moseying: Interviews with Professional Data Analysts on Explo-
ration Practices.
IEEE Transactions on Visualization and Computer Graphics
25,
1 (2019), 22–31.
doi:10.1109/TVCG.2018.2865040
[7]
Ion Androutsopoulos and Maria Aretoulaki. 2005. Natural Language Interaction.
(2005).
[8]
Randy Arifanto, Yudistira DW Asnar, and MM Inggriani Liem. 2018.
Domain
Specific
Language
for
Web
Scraper
Development.
In
2018
5th
International
Conference on Data and Software Engineering (ICoDSE)
. 1–6.
[9]
Shaon Barman, Sarah Chasins, Rastislav Bodik, and Sumit Gulwani. 2016. Ringer:
web automation by demonstration. In
Proceedings of the 2016 ACM SIGPLAN
International Conference on Object-Oriented Programming, Systems, Languages,
and Applications
. 748–764.
[10]
John Brooke. 1996.
SUS-A quick and dirty usability scale.
Usability Evaluation
in Industry
189, 194 (1996), 4–7.
[11]
Yu-Rong Cao, Xiao-Han Li, Jia-Yu Pan, and Wen-Chieh Lin. 2022.
VisGuide:
User-Oriented Recommendations for Data Event Extraction. In
Proceedings of
the CHI Conference on Human Factors in Computing Systems
. 1–13.
doi:10.1145/
3491102.3517648
[12]
Sarah E Chasins, Maria Mueller, and Rastislav Bodik. 2018.
Rousillon: Scraping
distributed hierarchical web data. In
Proceedings of the 31st Annual ACM Sym-
posium on User Interface Software and Technology
. 963–975.
doi:10.1145/3242587.
3242661
[13]
Ran Chen, Di Weng, Yanwei Huang, Xinhuan Shu, Jiayi Zhou, Guodao Sun, and
Yingcai Wu. 2023.
Rigel: Transforming Tabular Data by Declarative Mapping.
IEEE Transactions on Visualization and Computer Graphics
29, 1 (2023), 128–138.
doi:10.1109/TVCG.2022.3209385
[14]
Valerie
Chen,
Alan
Zhu,
Sebastian
Zhao,
Hussein
Mozannar,
David
Sontag,
and
Ameet
Talwalkar.
2025.
Need
Help?
Designing
Proactive
AI
Assistants
for Programming. In
Proceedings of the CHI Conference on Human Factors in
Computing Systems
.
doi:10.1145/3706598.3714002
[15]
Bhavya Chopra, Anna Fariha, Sumit Gulwani, Austin Z Henley, Daniel Perel-
man, Mohammad Raza, Sherry Shi, Danny Simmons, and Ashish Tiwari. 2023.
CoWrangler: Recommender System for Data-Wrangling Scripts. In
Companion
of the 2023 International Conference on Management of Data
. 147–150.
[16]
Bhavya Chopra, Ananya Singha, Anna Fariha, Sumit Gulwani, Chris Parnin,
Ashish Tiwari, and Austin Z Henley. 2025.
Challenges in Using Conversational
AI for Data Science. In
Proceedings of the Workshop on Human-In-the-Loop Data
Analytics
. 1–7.
[17]
Gregory Croisdale, Emily Huang, John Joon Young Chung, Anhong Guo, Xu
Wang, Austin Z Henley, and Cyrus Omar. 2025. DeckFlow: Iterative Specification
on a Multimodal Generative Canvas.
arXiv preprint arXiv:2506.15873
(2025).
[18]
Irena Cronin. 2024.
Understanding Generative AI Business Applications
. Springer.
[19]
Zhe
Cui,
Sriram
Karthik
Badam,
M
Adil
Yalçin,
and
Niklas
Elmqvist.
2019.
DataSite: Proactive visual data exploration with computation of insight-based
recommendations.
Information Visualization
18, 2 (2019), 251–267.
[20]
Allen Cypher and Daniel Conrad Halbert. 1993.
Watch What I Do: Programming
by Demonstration
.
MIT Press.
[21]
Nilesh Dalvi, Ravi Kumar, and Mohamed Soliman. 2011.
Automatic wrappers
for large scale web extraction.
Proceedings of the VLDB Endowment
4, 4 (Jan.
2011), 219–230.
doi:10.14778/1938545.1938547
[22]
Robert DeLine and Kael Rowan. 2010.
Code canvas: zooming towards better
development environments. In
Proceedings of the 32nd ACM/IEEE International
Conference on Software Engineering-Volume 2
. 207–210.
[23]
Nicola Dell, Vidya Vaidyanathan, Indrani Medhi, Edward Cutrell, and William
Thies. 2012.
"Yours is better!": participant response bias in HCI. In
Proceedings
of
the
CHI
Conference
on
Human
Factors
in
Computing
Systems
.
1321–1330.
doi:10.1145/2207676.2208589
[24]
AnHai Doan, Jeffrey F Naughton, Raghu Ramakrishnan, Akanksha Baid, Xi-
aoyong Chai, Fei Chen, Ting Chen, Eric Chu, Pedro DeRose, Byron Gao, et al
.
2009.
Information Extraction Challenges in Managing Unstructured Data.
ACM
SIGMOD Record
37, 4 (2009), 14–20.
[25]
Will
Epperson,
Doris
Jung-Lin
Lee,
Leijie
Wang,
Kunal
Agarwal,
Aditya
G
Parameswaran,
Dominik
Moritz,
and
Adam
Perer.
2022.
Leveraging
Analy-
sis History for Improved In Situ Visualization Recommendation. In
Computer
Graphics Forum
, Vol. 41. Wiley Online Library, 145–155.
[26]
Fosowl. 2025.
AgenticSeek: Private, Local Manus Alternative..
https://github.
com/Fosowl/agenticSeek.
Accessed: August 19, 2025.
[27]
GenSpark. 2025.
GenSpark Browser.
https://www.genspark.ai/browser.
Ac-
cessed: August 19, 2025.
[28]
GenSpark. 2025.
GenSpark Super Agent.
https://www.genspark.ai/.
Accessed:
August 19, 2025.
[29]
GitHub. 2025.
GitHub Copilot.
https://github.com/features/copilot.
Accessed:
August 19, 2025.
[30]
Jiajing
Guo,
Vikram
Mohanty,
Jorge
H
Piazentin
Ono,
Hongtao
Hao,
Liang
Gou, and Liu Ren. 2024.
Investigating Interaction Modes and User Agency in
Human-LLM
Collaboration
for
Domain-Specific
Data
Analysis.
In
Extended
Abstracts of the CHI Conference on Human Factors in Computing Systems
.
doi:10.
1145/3613905.3651042
[31]
Philip J Guo, Sean Kandel, Joseph M Hellerstein, and Jeffrey Heer. 2011. Proactive
Wrangling: Mixed-Initiative End-User Programming of Data Transformation
Scripts. In
Proceedings of the 24th Annual ACM Symposium on User Interface
Software and Technology
. 65–74.
doi:10.1145/2047196.2047205
[32]
Daniel Conrad Halbert. 1984.
Programming By Example
. University of California,
Berkeley.
[33]
Harpa.ai. 2025.
Harpa.AI.
https://harpa.ai/.
Accessed: August 19, 2025.
[34]
Hongliang He, Wenlin Yao, Kaixin Ma, Wenhao Yu, Yong Dai, Hongming Zhang,
Zhenzhong Lan, and Dong Yu. 2024.
WebVoyager: Building an End-to-End Web
Agent with Large Multimodal Models. In
Proceedings of the Annual Meeting of the
Association for Computational Linguistics
. 6864–6890.
doi:10.18653/v1/2024.acl-
long.371
[35]
Jeffrey Heer. 2019.
Agency plus Automation: Designing Artificial Intelligence
into Interactive Systems.
Proceedings of the National Academy of Sciences
116, 6
(2019), 1844–1850.
doi:10.1073/pnas.1807184115
[36]
Marc Hesenius, Mak Krvavac, Valbjörn Jón Valbjörnsson, Theresia Mita Erika,
and Matthias Book. 2025.
How To Draw Commands? An Elicitation Study for
Sketching
on
Spreadsheets.
In
Proceedings
of
the
CHI
Conference
on
Human
Factors in Computing Systems
. 1–31.
doi:10.1145/3706598.3715269
[37]
Eric Horvitz. 1999.
Principles of Mixed-Initiative User Interfaces. In
Proceedings
of the CHI Conference on Human Factors in Computing Systems
. 159–166.
doi:10.
1145/302979.303030
[38]
Yanwei Huang, Yurun Yang, Xinhuan Shu, Ran Chen, Di Weng, and Yingcai
Wu. 2024.
Table Illustrator: Puzzle-Based Interactive Authoring of Plain Tables.
In
Proceedings of the CHI Conference on Human Factors in Computing Systems
.
1–18.
doi:10.1145/3613904.3642415
[39]
Yanwei Huang, Yunfan Zhou, Ran Chen, Changhao Pan, Xinhuan Shu, Di Weng,
and Yingcai Wu. 2024.
Interactive Table Synthesis with Natural Language.
IEEE
Transactions on Visualization and Computer Graphics
30, 9 (2024), 6130–6145.
doi:10.1109/TVCG.2023.3329120
[40]
Jeevana Priya Inala and Rishabh Singh. 2017.
WebRelate: integrating web data
with spreadsheets using examples.
Proceedings of the ACM on Programming
Languages
2, POPL (2017), 1–28.
[41]
Foyer Tech Inc. 2025.
Merlin.AI.
https://www.getmerlin.in/.
Accessed: August
19, 2025.
[42]
Ikonomos Inc. 2025.
Skyvern.
https://www.skyvern.com/.
Accessed: August 19,
2025.
[43]
Zhongjun Jin, Michael R. Anderson, Michael Cafarella, and H. V. Jagadish. 2017.
Foofah: Transforming Data By Example. In
Proceedings of the ACM SIGMOD
International Conference on Management of Data
. ACM, 683–698.
doi:10.1145/
3035918.3064034
[44]
Sean Kandel, Andreas Paepcke, Joseph M. Hellerstein, and Jeffrey Heer. 2011.
Wrangler: Interactive Visual Specification of Data Transformation Scripts. In
Proceedings
of
the
CHI
Conference
on
Human
Factors
in
Computing
Systems
.
3363–3372.
doi:10.1145/1978942.1979444
[45]
Sean Kandel, Andreas Paepcke, Joseph M Hellerstein, and Jeffrey Heer. 2012.
Enterprise Data Analysis and Visualization: An Interview Study.
IEEE Trans-
actions
on
Visualization
and
Computer
Graphics
18,
12
(2012),
2917–2926.
doi:10.1109/TVCG.2012.219
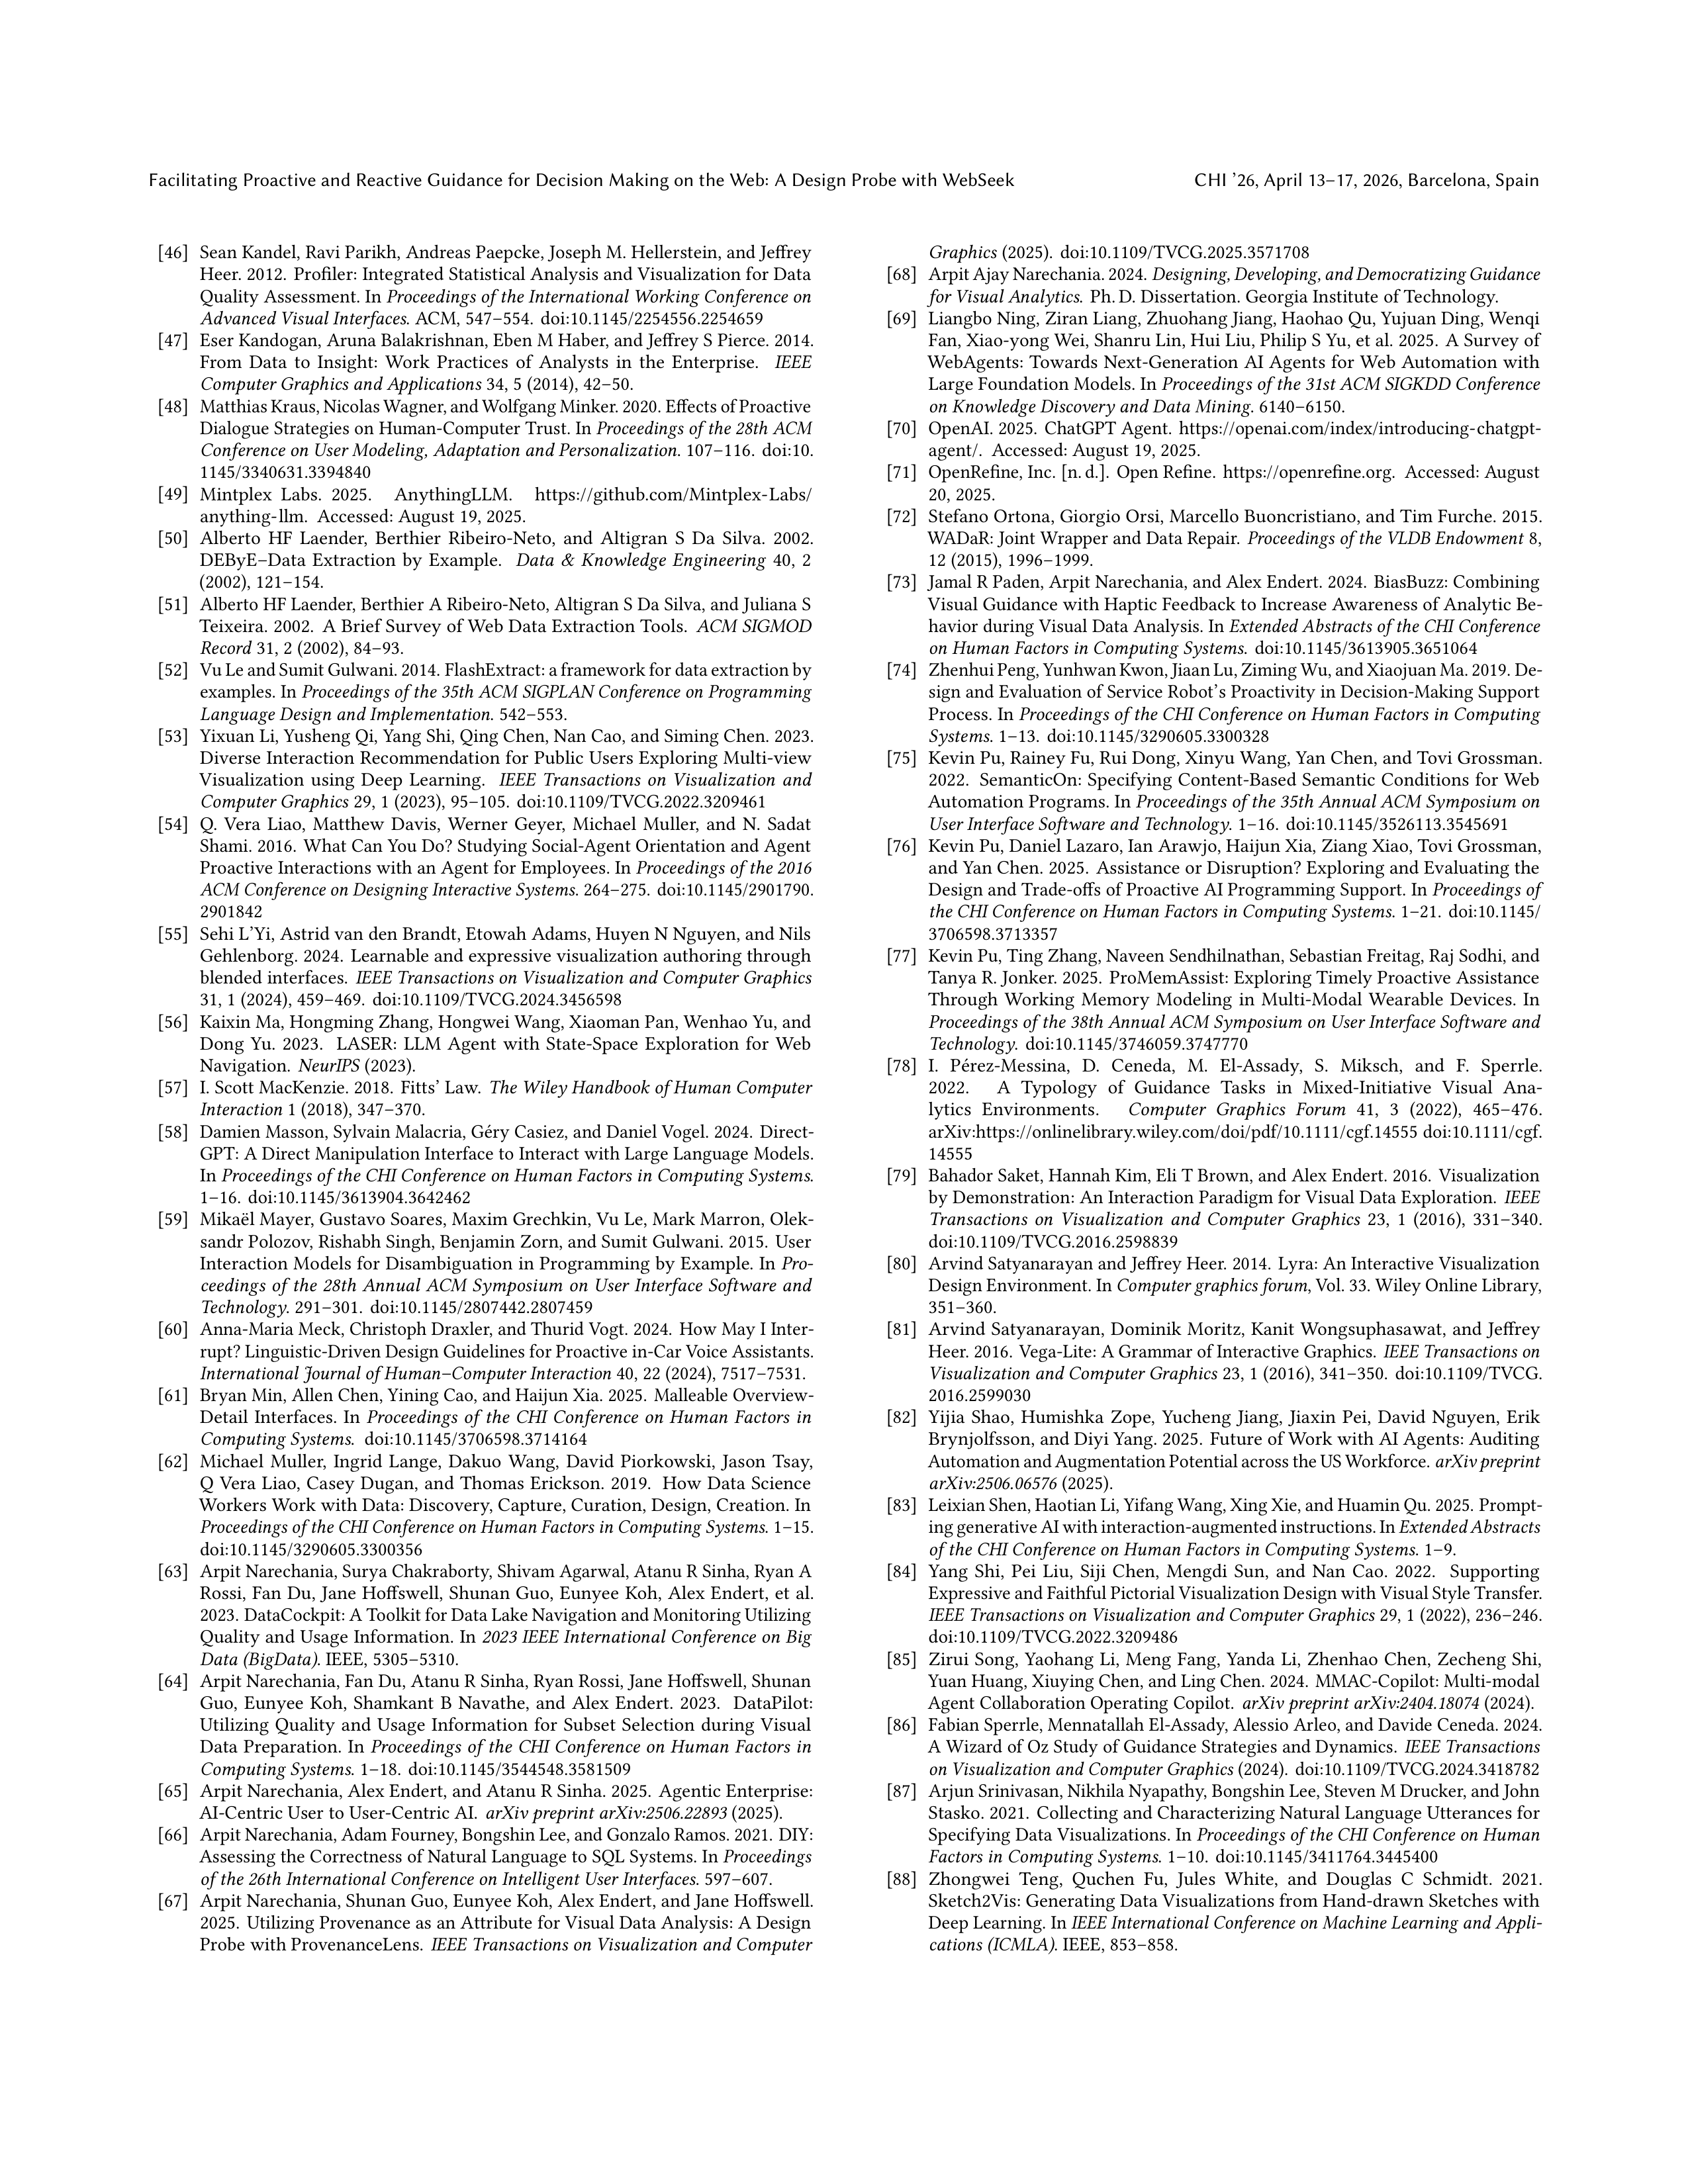
Facilitating Proactive and Reactive Guidance for Decision Making on the Web: A Design Probe with WebSeek
CHI ’26, April 13–17, 2026, Barcelona, Spain
[46]
Sean Kandel, Ravi Parikh, Andreas Paepcke, Joseph M. Hellerstein, and Jeffrey
Heer. 2012.
Profiler: Integrated Statistical Analysis and Visualization for Data
Quality Assessment. In
Proceedings of the International Working Conference on
Advanced Visual Interfaces
. ACM, 547–554.
doi:10.1145/2254556.2254659
[47]
Eser Kandogan, Aruna Balakrishnan, Eben M Haber, and Jeffrey S Pierce. 2014.
From
Data
to
Insight:
Work
Practices
of
Analysts
in
the
Enterprise.
IEEE
Computer Graphics and Applications
34, 5 (2014), 42–50.
[48]
Matthias Kraus, Nicolas Wagner, and Wolfgang Minker. 2020. Effects of Proactive
Dialogue Strategies on Human-Computer Trust. In
Proceedings of the 28th ACM
Conference on User Modeling, Adaptation and Personalization
. 107–116.
doi:10.
1145/3340631.3394840
[49]
Mintplex
Labs.
2025.
AnythingLLM.
https://github.com/Mintplex-Labs/
anything-llm.
Accessed: August 19, 2025.
[50]
Alberto
HF
Laender,
Berthier
Ribeiro-Neto,
and
Altigran
S
Da
Silva.
2002.
DEByE–Data
Extraction
by
Example.
Data
&
Knowledge
Engineering
40,
2
(2002), 121–154.
[51]
Alberto HF Laender, Berthier A Ribeiro-Neto, Altigran S Da Silva, and Juliana S
Teixeira. 2002.
A Brief Survey of Web Data Extraction Tools.
ACM SIGMOD
Record
31, 2 (2002), 84–93.
[52]
Vu Le and Sumit Gulwani. 2014. FlashExtract: a framework for data extraction by
examples. In
Proceedings of the 35th ACM SIGPLAN Conference on Programming
Language Design and Implementation
. 542–553.
[53]
Yixuan Li, Yusheng Qi, Yang Shi, Qing Chen, Nan Cao, and Siming Chen. 2023.
Diverse Interaction Recommendation for Public Users Exploring Multi-view
Visualization
using
Deep
Learning.
IEEE
Transactions
on
Visualization
and
Computer Graphics
29, 1 (2023), 95–105.
doi:10.1109/TVCG.2022.3209461
[54]
Q.
Vera
Liao,
Matthew
Davis,
Werner
Geyer,
Michael
Muller,
and
N.
Sadat
Shami. 2016.
What Can You Do? Studying Social-Agent Orientation and Agent
Proactive Interactions with an Agent for Employees. In
Proceedings of the 2016
ACM Conference on Designing Interactive Systems
. 264–275.
doi:10.1145/2901790.
2901842
[55]
Sehi L’Yi, Astrid van den Brandt, Etowah Adams, Huyen N Nguyen, and Nils
Gehlenborg. 2024.
Learnable and expressive visualization authoring through
blended interfaces.
IEEE Transactions on Visualization and Computer Graphics
31, 1 (2024), 459–469.
doi:10.1109/TVCG.2024.3456598
[56]
Kaixin Ma, Hongming Zhang, Hongwei Wang, Xiaoman Pan, Wenhao Yu, and
Dong
Yu.
2023.
LASER:
LLM
Agent
with
State-Space
Exploration
for
Web
Navigation.
NeurIPS
(2023).
[57]
I. Scott MacKenzie. 2018.
Fitts’ Law.
The Wiley Handbook of Human Computer
Interaction
1 (2018), 347–370.
[58]
Damien Masson, Sylvain Malacria, Géry Casiez, and Daniel Vogel. 2024.
Direct-
GPT: A Direct Manipulation Interface to Interact with Large Language Models.
In
Proceedings of the CHI Conference on Human Factors in Computing Systems
.
1–16.
doi:10.1145/3613904.3642462
[59]
Mikaël Mayer, Gustavo Soares, Maxim Grechkin, Vu Le, Mark Marron, Olek-
sandr Polozov, Rishabh Singh, Benjamin Zorn, and Sumit Gulwani. 2015.
User
Interaction Models for Disambiguation in Programming by Example. In
Pro-
ceedings
of
the
28th
Annual
ACM
Symposium
on
User
Interface
Software
and
Technology
. 291–301.
doi:10.1145/2807442.2807459
[60]
Anna-Maria Meck, Christoph Draxler, and Thurid Vogt. 2024.
How May I Inter-
rupt? Linguistic-Driven Design Guidelines for Proactive in-Car Voice Assistants.
International Journal of Human–Computer Interaction
40, 22 (2024), 7517–7531.
[61]
Bryan Min, Allen Chen, Yining Cao, and Haijun Xia. 2025.
Malleable Overview-
Detail
Interfaces.
In
Proceedings
of
the
CHI
Conference
on
Human
Factors
in
Computing Systems
.
doi:10.1145/3706598.3714164
[62]
Michael
Muller,
Ingrid
Lange,
Dakuo
Wang,
David
Piorkowski,
Jason
Tsay,
Q
Vera
Liao,
Casey
Dugan,
and
Thomas
Erickson.
2019.
How
Data
Science
Workers Work with Data: Discovery, Capture, Curation, Design, Creation. In
Proceedings of the CHI Conference on Human Factors in Computing Systems
. 1–15.
doi:10.1145/3290605.3300356
[63]
Arpit Narechania, Surya Chakraborty, Shivam Agarwal, Atanu R Sinha, Ryan A
Rossi,
Fan
Du,
Jane
Hoffswell,
Shunan
Guo,
Eunyee
Koh,
Alex
Endert,
et
al
.
2023. DataCockpit: A Toolkit for Data Lake Navigation and Monitoring Utilizing
Quality and Usage Information. In
2023 IEEE International Conference on Big
Data (BigData)
. IEEE, 5305–5310.
[64]
Arpit Narechania, Fan Du, Atanu R Sinha, Ryan Rossi, Jane Hoffswell, Shunan
Guo,
Eunyee
Koh,
Shamkant
B
Navathe,
and
Alex
Endert.
2023.
DataPilot:
Utilizing
Quality
and
Usage
Information
for
Subset
Selection
during
Visual
Data
Preparation.
In
Proceedings
of
the
CHI
Conference
on
Human
Factors
in
Computing Systems
. 1–18.
doi:10.1145/3544548.3581509
[65]
Arpit Narechania, Alex Endert, and Atanu R Sinha. 2025.
Agentic Enterprise:
AI-Centric User to User-Centric AI.
arXiv preprint arXiv:2506.22893
(2025).
[66]
Arpit Narechania, Adam Fourney, Bongshin Lee, and Gonzalo Ramos. 2021. DIY:
Assessing the Correctness of Natural Language to SQL Systems. In
Proceedings
of the 26th International Conference on Intelligent User Interfaces
. 597–607.
[67]
Arpit Narechania, Shunan Guo, Eunyee Koh, Alex Endert, and Jane Hoffswell.
2025.
Utilizing Provenance as an Attribute for Visual Data Analysis: A Design
Probe with ProvenanceLens.
IEEE Transactions on Visualization and Computer
Graphics
(2025).
doi:10.1109/TVCG.2025.3571708
[68]
Arpit Ajay Narechania. 2024.
Designing, Developing, and Democratizing Guidance
for Visual Analytics
.
Ph. D. Dissertation. Georgia Institute of Technology.
[69]
Liangbo Ning, Ziran Liang, Zhuohang Jiang, Haohao Qu, Yujuan Ding, Wenqi
Fan, Xiao-yong Wei, Shanru Lin, Hui Liu, Philip S Yu, et al
.
2025.
A Survey of
WebAgents: Towards Next-Generation AI Agents for Web Automation with
Large Foundation Models. In
Proceedings of the 31st ACM SIGKDD Conference
on Knowledge Discovery and Data Mining
. 6140–6150.
[70]
OpenAI. 2025.
ChatGPT Agent.
https://openai.com/index/introducing-chatgpt-
agent/.
Accessed: August 19, 2025.
[71]
OpenRefine, Inc. [n. d.].
Open Refine.
https://openrefine.org.
Accessed: August
20, 2025.
[72]
Stefano Ortona, Giorgio Orsi, Marcello Buoncristiano, and Tim Furche. 2015.
WADaR: Joint Wrapper and Data Repair.
Proceedings of the VLDB Endowment
8,
12 (2015), 1996–1999.
[73]
Jamal R Paden, Arpit Narechania, and Alex Endert. 2024.
BiasBuzz: Combining
Visual Guidance with Haptic Feedback to Increase Awareness of Analytic Be-
havior during Visual Data Analysis. In
Extended Abstracts of the CHI Conference
on Human Factors in Computing Systems
.
doi:10.1145/3613905.3651064
[74]
Zhenhui Peng, Yunhwan Kwon, Jiaan Lu, Ziming Wu, and Xiaojuan Ma. 2019. De-
sign and Evaluation of Service Robot’s Proactivity in Decision-Making Support
Process. In
Proceedings of the CHI Conference on Human Factors in Computing
Systems
. 1–13.
doi:10.1145/3290605.3300328
[75]
Kevin Pu, Rainey Fu, Rui Dong, Xinyu Wang, Yan Chen, and Tovi Grossman.
2022.
SemanticOn: Specifying Content-Based Semantic Conditions for Web
Automation Programs. In
Proceedings of the 35th Annual ACM Symposium on
User Interface Software and Technology
. 1–16.
doi:10.1145/3526113.3545691
[76]
Kevin Pu, Daniel Lazaro, Ian Arawjo, Haijun Xia, Ziang Xiao, Tovi Grossman,
and Yan Chen. 2025.
Assistance or Disruption? Exploring and Evaluating the
Design and Trade-offs of Proactive AI Programming Support. In
Proceedings of
the CHI Conference on Human Factors in Computing Systems
. 1–21.
doi:10.1145/
3706598.3713357
[77]
Kevin Pu, Ting Zhang, Naveen Sendhilnathan, Sebastian Freitag, Raj Sodhi, and
Tanya R. Jonker. 2025.
ProMemAssist: Exploring Timely Proactive Assistance
Through
Working
Memory
Modeling
in
Multi-Modal
Wearable
Devices.
In
Proceedings of the 38th Annual ACM Symposium on User Interface Software and
Technology
.
doi:10.1145/3746059.3747770
[78]
I.
Pérez-Messina,
D.
Ceneda,
M.
El-Assady,
S.
Miksch,
and
F.
Sperrle.
2022.
A
Typology
of
Guidance
Tasks
in
Mixed-Initiative
Visual
Ana-
lytics
Environments.
Computer
Graphics
Forum
41,
3
(2022),
465–476.
arXiv:https://onlinelibrary.wiley.com/doi/pdf/10.1111/cgf.14555 doi:10.1111/cgf.
14555
[79]
Bahador Saket, Hannah Kim, Eli T Brown, and Alex Endert. 2016.
Visualization
by Demonstration: An Interaction Paradigm for Visual Data Exploration.
IEEE
Transactions
on
Visualization
and
Computer
Graphics
23,
1
(2016),
331–340.
doi:10.1109/TVCG.2016.2598839
[80]
Arvind Satyanarayan and Jeffrey Heer. 2014.
Lyra: An Interactive Visualization
Design Environment. In
Computer graphics forum
, Vol. 33. Wiley Online Library,
351–360.
[81]
Arvind
Satyanarayan,
Dominik
Moritz,
Kanit
Wongsuphasawat,
and
Jeffrey
Heer. 2016.
Vega-Lite: A Grammar of Interactive Graphics.
IEEE Transactions on
Visualization and Computer Graphics
23, 1 (2016), 341–350.
doi:10.1109/TVCG.
2016.2599030
[82]
Yijia
Shao,
Humishka
Zope,
Yucheng
Jiang,
Jiaxin
Pei,
David
Nguyen,
Erik
Brynjolfsson, and Diyi Yang. 2025.
Future of Work with AI Agents: Auditing
Automation and Augmentation Potential across the US Workforce.
arXiv preprint
arXiv:2506.06576
(2025).
[83]
Leixian Shen, Haotian Li, Yifang Wang, Xing Xie, and Huamin Qu. 2025. Prompt-
ing generative AI with interaction-augmented instructions. In
Extended Abstracts
of the CHI Conference on Human Factors in Computing Systems
. 1–9.
[84]
Yang
Shi,
Pei
Liu,
Siji
Chen,
Mengdi
Sun,
and
Nan
Cao.
2022.
Supporting
Expressive and Faithful Pictorial Visualization Design with Visual Style Transfer.
IEEE Transactions on Visualization and Computer Graphics
29, 1 (2022), 236–246.
doi:10.1109/TVCG.2022.3209486
[85]
Zirui
Song,
Yaohang
Li,
Meng
Fang,
Yanda
Li,
Zhenhao
Chen,
Zecheng
Shi,
Yuan Huang, Xiuying Chen, and Ling Chen. 2024.
MMAC-Copilot: Multi-modal
Agent Collaboration Operating Copilot.
arXiv preprint arXiv:2404.18074
(2024).
[86]
Fabian Sperrle, Mennatallah El-Assady, Alessio Arleo, and Davide Ceneda. 2024.
A Wizard of Oz Study of Guidance Strategies and Dynamics.
IEEE Transactions
on Visualization and Computer Graphics
(2024).
doi:10.1109/TVCG.2024.3418782
[87]
Arjun Srinivasan, Nikhila Nyapathy, Bongshin Lee, Steven M Drucker, and John
Stasko. 2021.
Collecting and Characterizing Natural Language Utterances for
Specifying Data Visualizations. In
Proceedings of the CHI Conference on Human
Factors in Computing Systems
. 1–10.
doi:10.1145/3411764.3445400
[88]
Zhongwei
Teng,
Quchen
Fu,
Jules
White,
and
Douglas
C
Schmidt.
2021.
Sketch2Vis: Generating Data Visualizations from Hand-drawn Sketches with
Deep Learning. In
IEEE International Conference on Machine Learning and Appli-
cations (ICMLA)
. IEEE, 853–858.
CHI ’26, April 13–17, 2026, Barcelona, Spain
Yanwei Huang and Arpit Narechania
[89]
Trifacta, Inc. [n. d.].
Trifacta.
https://www.trifacta.com.
Accessed: August 20,
2025.
[90]
Anargh Viswanath and Hendrik Buschmeier. 2025. Insights for Proactive Agents:
Design Considerations, Challenges, and Recommendations. In
Joint Proceedings
of the ACM IUI 2025 Workshops
.
[91]
Zhenhailong Wang, Haiyang Xu, Junyang Wang, Xi Zhang, Ming Yan, Ji Zhang,
Fei Huang, and Heng Ji. 2025.
Mobile-Agent-E: Self-Evolving Mobile Assistant
for Complex Tasks.
NeurIPS
(2025).
[92]
Kanit
Wongsuphasawat,
Dominik
Moritz,
Anushka
Anand,
Jock
Mackinlay,
Bill Howe, and Jeffrey Heer. 2015.
Voyager: Exploratory Analysis via Faceted
Browsing of Visualization Recommendations.
IEEE Transactions on Visualization
and Computer Graphics
22, 1 (2015), 649–658.
doi:10.1109/TVCG.2015.2467191
[93]
Kanit Wongsuphasawat, Zening Qu, Dominik Moritz, Riley Chang, Felix Ouk,
Anushka Anand, Jock Mackinlay, Bill Howe, and Jeffrey Heer. 2017.
Voyager 2:
Augmenting Visual Analysis with Partial View Specifications. In
Proceedings
of
the
CHI
Conference
on
Human
Factors
in
Computing
Systems
.
2648–2659.
doi:10.1145/3025453.3025768
[94]
Siyuan Xia, Nafisa Anzum, Semih Salihoglu, and Jian Zhao. 2021.
KTabulator:
Interactive ad hoc table creation using knowledge graphs. In
Proceedings of the
CHI
Conference
on
Human
Factors
in
Computing
Systems
.
1–14.
doi:10.1145/
3411764.3445227
[95]
Lingfeng
Yang,
Yueze
Wang,
Xiang
Li,
Xinlong
Wang,
and
Jian
Yang.
2023.
Fine-Grained Visual Prompting.
NeurIPS
36 (2023), 24993–25006.
[96]
Yingxuan Yang, Mulei Ma, Yuxuan Huang, Huacan Chai, Chenyu Gong, Haoran
Geng, Yuanjian Zhou, Ying Wen, Meng Fang, Muhao Chen, et al
.
2025.
Agentic
Web: Weaving the Next Web with AI Agents.
arXiv preprint arXiv:2507.21206
(2025).
[97]
Tao
Yu,
Rui
Zhang,
Kai
Yang,
Michihiro
Yasunaga,
Dongxu
Wang,
Zifan
Li,
James Ma, Irene Li, Qingning Yao, Shanelle Roman, et al
.
2018.
Spider: A large-
scale human-labeled dataset for complex and cross-domain semantic parsing
and
text-to-sql
task.
Proceedings
of
the
Conference
on
Empirical
Methods
in
Natural Language Processing
(2018).
[98]
Ariana Yunita, Harry B Santoso, and Zainal A Hasibuan. 2022.
‘Everything is
data’: towards one big data ecosystem using multiple sources of data on higher
education in Indonesia.
Journal of Big Data
9, 1 (2022), 91.
[99]
Zhuosheng Zhang and Aston Zhang. 2024.
You Only Look at Screens: Multi-
modal Chain-of-Action Agents. In
Findings of the Association for Computational
Linguistics
, Lun-Wei Ku, Andre Martins, and Vivek Srikumar (Eds.). 3132–3149.
doi:10.18653/v1/2024.findings-acl.186
[100]
Yuheng Zhao, Xueli Shu, Liwen Fan, Lin Gao, Yu Zhang, and Siming Chen. 2025.
ProactiveVA: Proactive Visual Analytics with LLM-Based UI Agent.
IEEE VIS
(2025).
[101]
Yunfan Zhou, Xiwen Cai, Qiming Shi, Yanwei Huang, Haotian Li, Huamin Qu,
Di Weng, and Yingcai Wu. 2025.
Xavier: Toward Better Coding Assistance in
Authoring Tabular Data Wrangling Scripts. In
Proceedings of the CHI Conference
on Human Factors in Computing Systems
. 1–16.
doi:10.1145/3706598.3714239
[102]
Jonathan Zong, Dhiraj Barnwal, Rupayan Neogy, and Arvind Satyanarayan.
2020.
Lyra
2:
Designing
Interactive
Visualizations
by
Demonstration.
IEEE
Transactions
on
Visualization
and
Computer
Graphics
27,
2
(2020),
304–314.
doi:10.1109/TVCG.2020.3030367