














Tools and expertise to grow your business
2018 Visa Debit Product Profi le















Visa helps your business succeed
Visa is a trusted global brand known for strength, integrity and
industry-leading innovation. We continue to break new
ground with an advanced suite of debit solutions that can be
customized to meet your needs, streamline your processes, and
deliver exceptional value to you and the customers you serve.
Visa is a better way to pay and be paid, enabling consumers
and merchants to do business with confi dence.
Why choose Visa for debit?
Visa’s industry leadership is your assurance of capability and quality
at the highest level. Here’s what sets Visa apart:
• The Visa Network – widely accepted around the world
• A commitment to uncovering debit potential and increasing usage
• Powerful tools and marketing resources to support your growth
• Strategic insights, benchmarking and diagnostics to optimize your
performance
• Sophisticated risk and fraud detection techniques to safeguard transactions
More places and more ways to use Visa
We’re expanding and modernizing.
• Over 46 million merchant locations globally
1
• The exclusive major payment card network accepted at U.S. Costco locations,
the world’s 2nd largest retailer.
2
• Multiple payment solutions: Visa Checkout, Visa Developer, Visa Direct
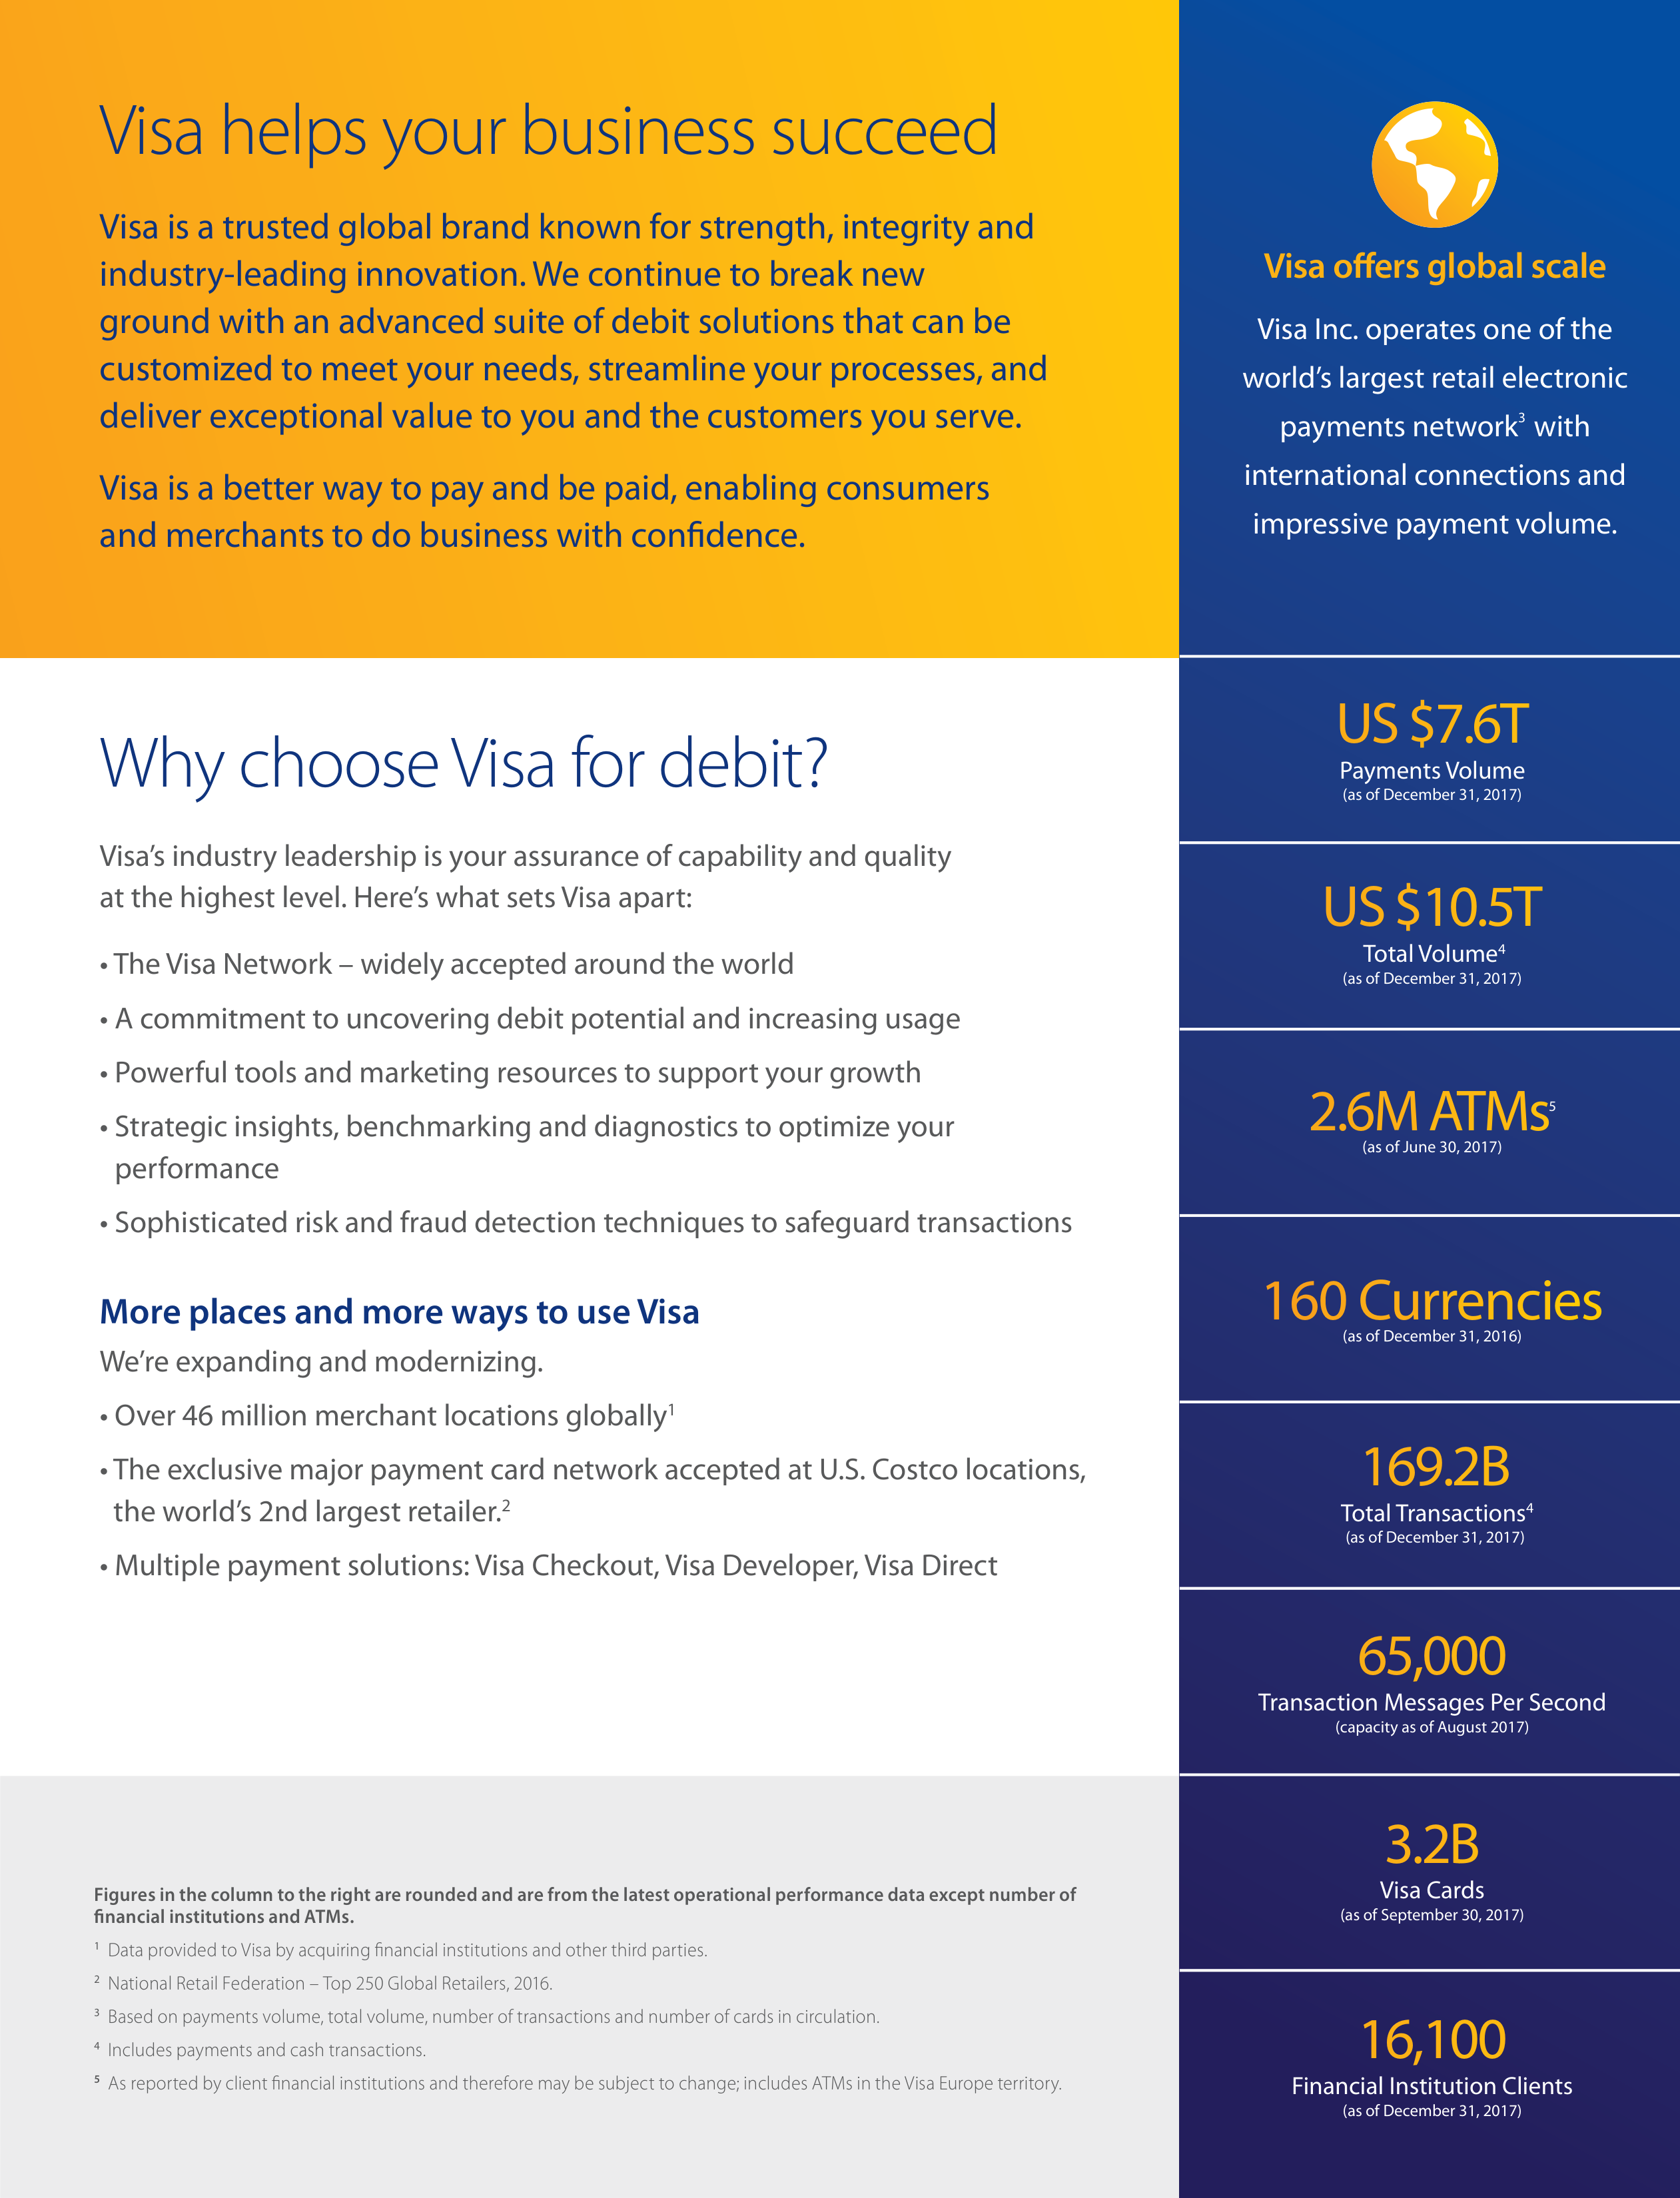
Visa off ers global scale
Visa Inc. operates one of the
world’s largest retail electronic
payments network
3
with
international connections and
impressive payment volume.
Figures in the column to the right are rounded and are from the latest operational performance data except number of
fi nancial institutions and ATMs.
1
Data provided to Visa by acquiring fi nancial institutions and other third parties.
2
National Retail Federation – Top 250 Global Retailers, 2016.
3
Based on payments volume, total volume, number of transactions and number of cards in circulation.
4
Includes payments and cash transactions.
5
As reported by client fi nancial institutions and therefore may be subject to change; includes ATMs in the Visa Europe territory.
U
S
$
1
0
.
5
T
Total Volume
4
(as of December 31, 2017)
6
5
,
0
0
0
Transaction Messages Per Second
(capacity as of August 2017)
3
.
2
B
Visa Cards
(as of September 30, 2017)
1
6
,
1
0
0
Financial Institution Clients
(as of December 31, 2017)
1
6
9
.
2
B
Total Transactions
4
(as of December 31, 2017)
U
S
$
7
.6
T
Payments Volume
(as of December 31, 2017)
2
.
6
M
A
T
M
s
5
(as of June 30, 2017)
1
6
0
C
u
r
r
e
n
c
i
e
s
(as of December 31, 2016)















































































The Visa Debit opportunity
Visa has historically been the debit leader.
1
We’ve made signifi cant,
strategic investments in innovation, security, and expanded acceptance
to drive future debit growth.
Visa Debit
• Accepted at tens of millions of merchants worldwide
• Purchasing power at point-of-sale and card-not-present
• Flexible and convenient cardholder verifi cation including
signature, no signature, PIN (PAVD), and biometrics
Visa/Plus ATM
• Cash access at 2+ million ATMs worldwide
and 600+ thousand ATMs in U.S.
2
• Scalable and interoperable network
Interlink
• Accepted at 2.6 million U.S. merchant locations
3
• Purchasing power at point-of-sale via PIN
Visa DPS
• Turnkey and reliable single-source
processing platform
• Debit and prepaid processing
• Fraud and risk services
Round out and enhance your debit portfolio with a full suite of products
1
Nilson Report issue #1119 published October 2017
2
Visa Annual Report 2017
3
Visa Interlink Matching Service (VIMS) Database
Cash to Debit Migration
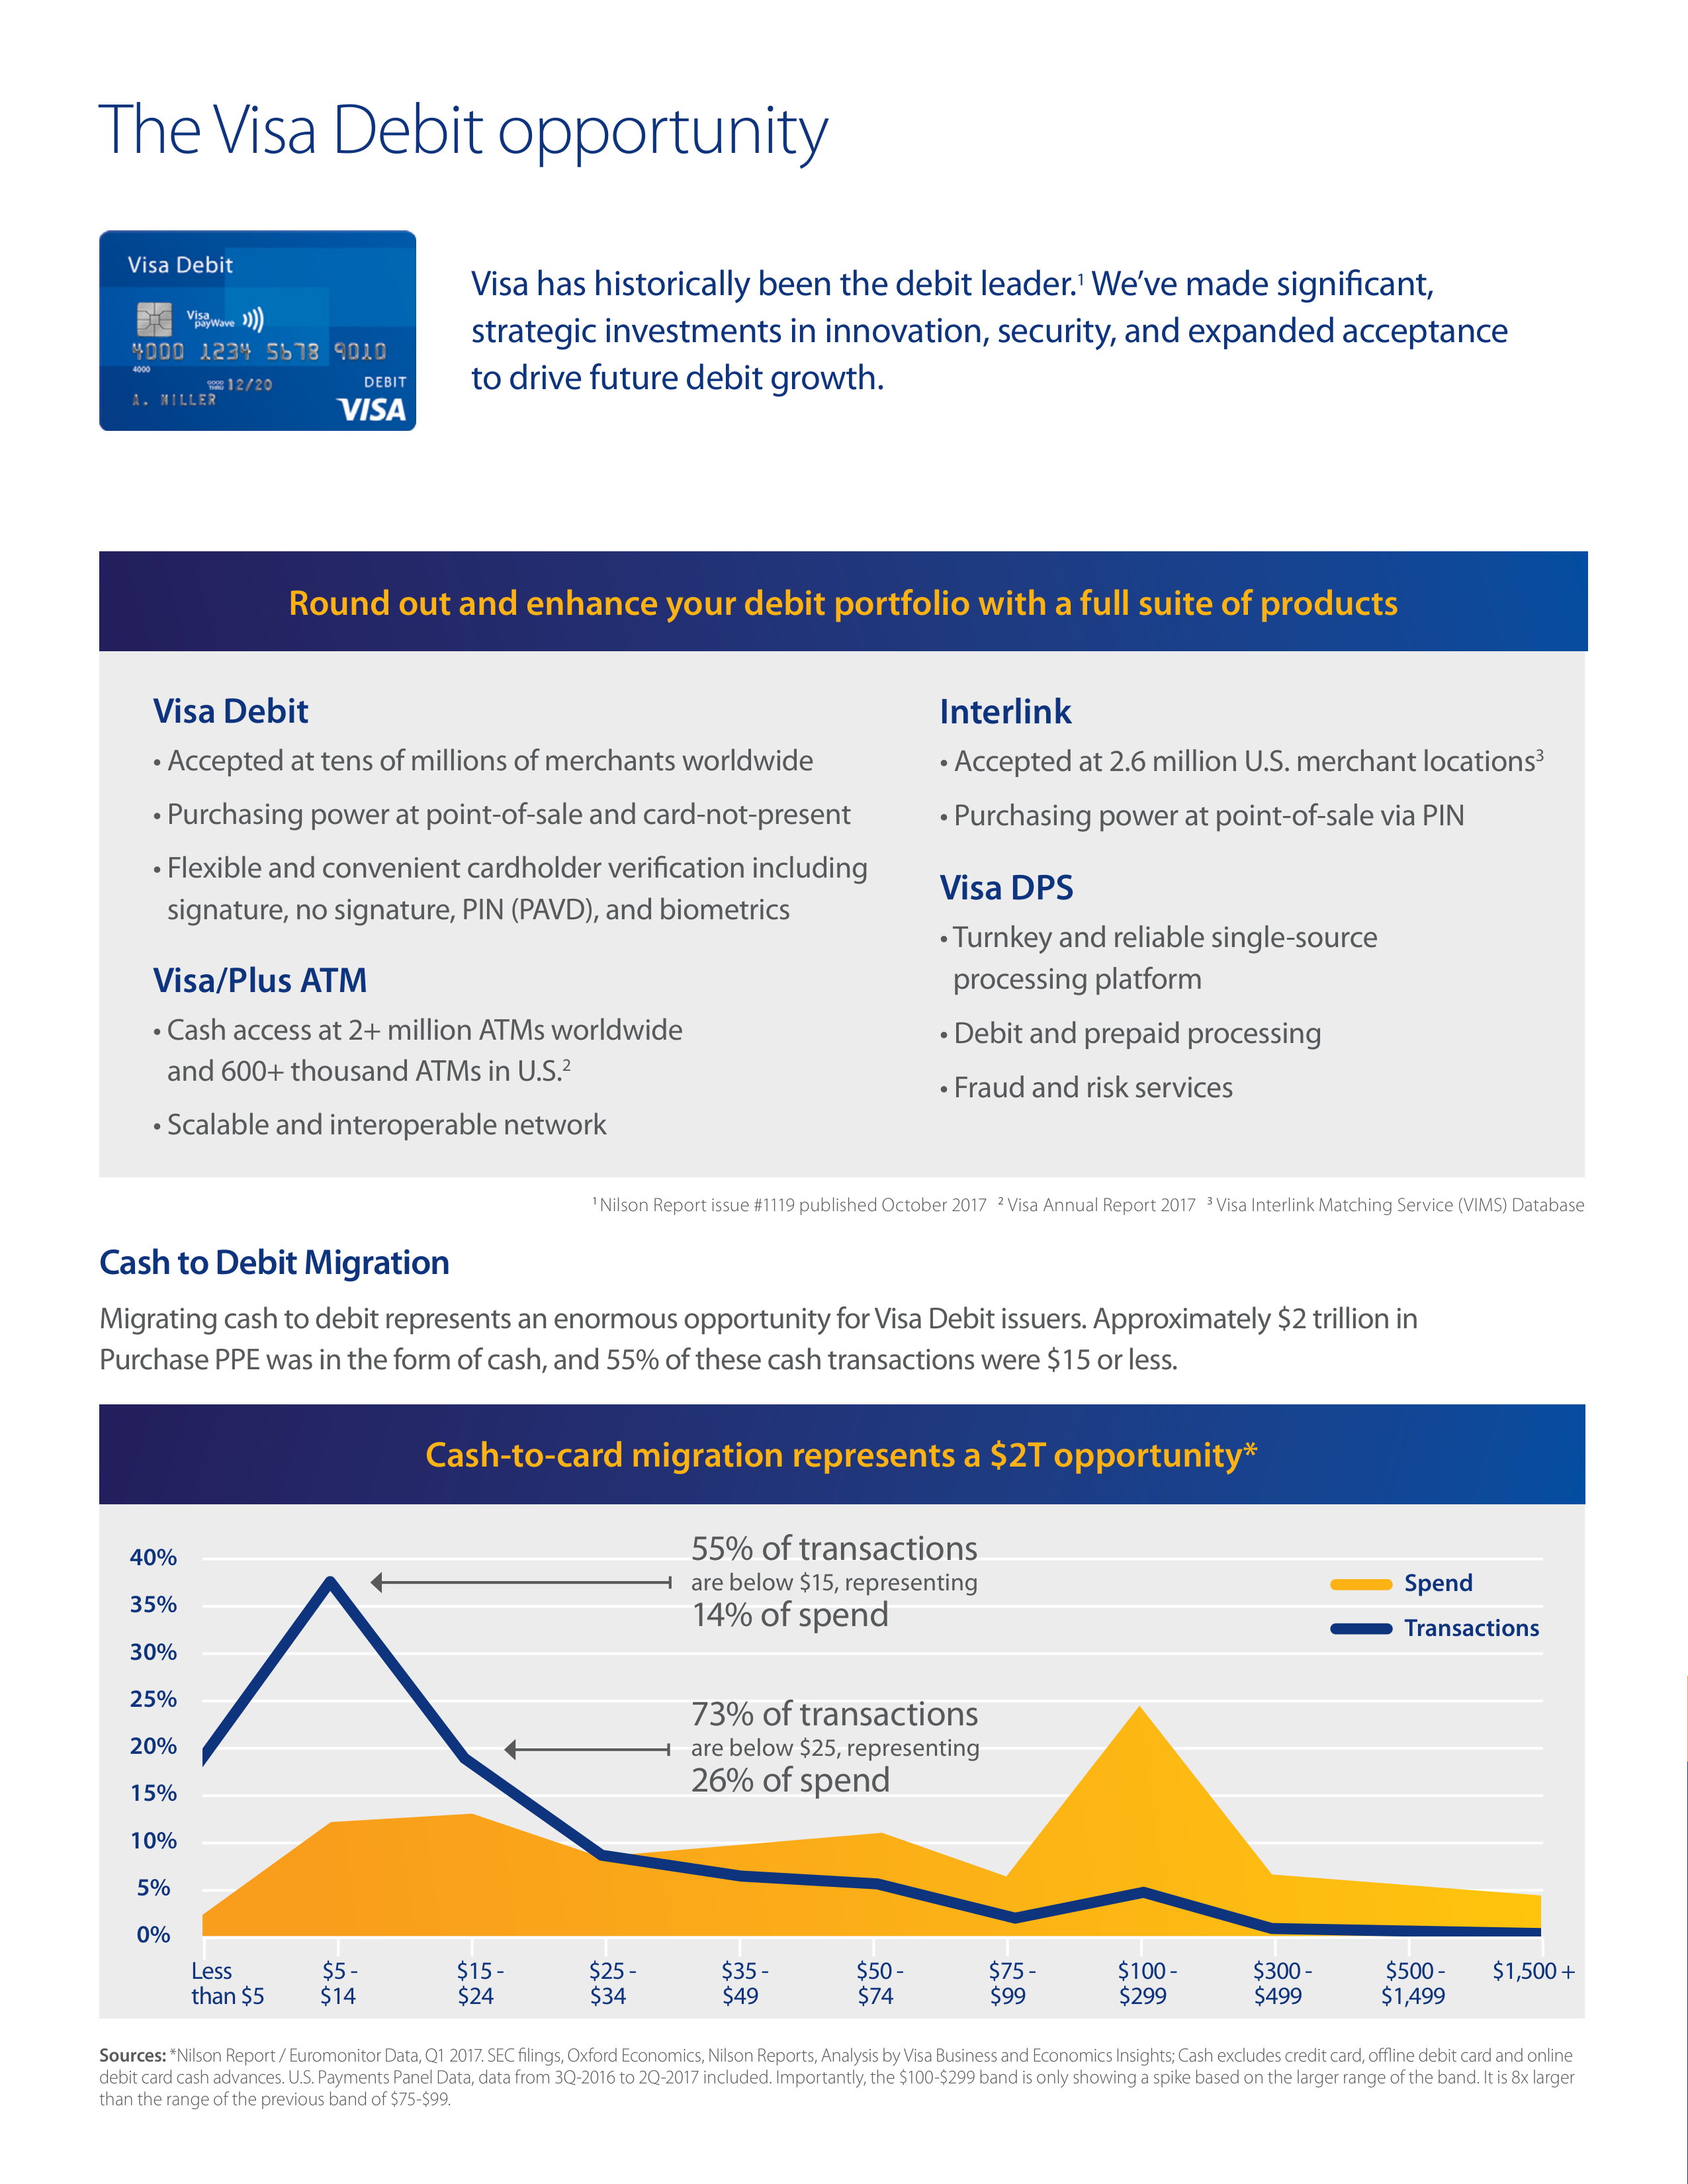
Migrating cash to debit represents an enormous opportunity for Visa Debit issuers. Approximately $2 trillion in
Purchase PPE was in the form of cash, and 55% of these cash transactions were $15 or less.
40%
35%
30%
25%
20%
15%
10%
5%
0%
Cash-to-card migration represents a $2T opportunity*
Less
$5 -
$15 -
$25 -
$35 -
$50 -
$75 -
$100 -
$300 -
$500 -
$1,500 +
than $5
$14
$24
$34
$49
$74
$99
$299
$499
$1,499
Spend
Transactions
73% of transactions
are below $25, representing
26% of spend
55% of transactions
are below $15, representing
14% of spend
Sources:
*Nilson Report / Euromonitor Data, Q1 2017. SEC fi lings, Oxford Economics, Nilson Reports, Analysis by Visa Business and Economics Insights; Cash excludes credit card, offl ine debit card and online
debit card cash advances. U.S. Payments Panel Data, data from 3Q-2016 to 2Q-2017 included. Importantly, the $100-$299 band is only showing a spike based on the larger range of the band. It is 8x larger
than the range of the previous band of $75-$99.















































































The Visa Debit Toolkit also includes:
Optimize your debit portfolio with online support
When you partner with Visa, you never go it alone. You have a one-stop online resource to help you grow your
portfolio. Visit Visa Online for a complete toolkit of metrics and support including helpful guides and turnkey,
customizable marketing materials to help you take action.
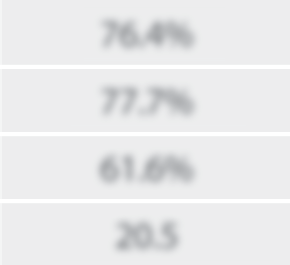
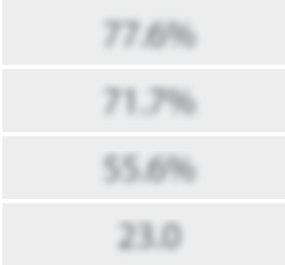
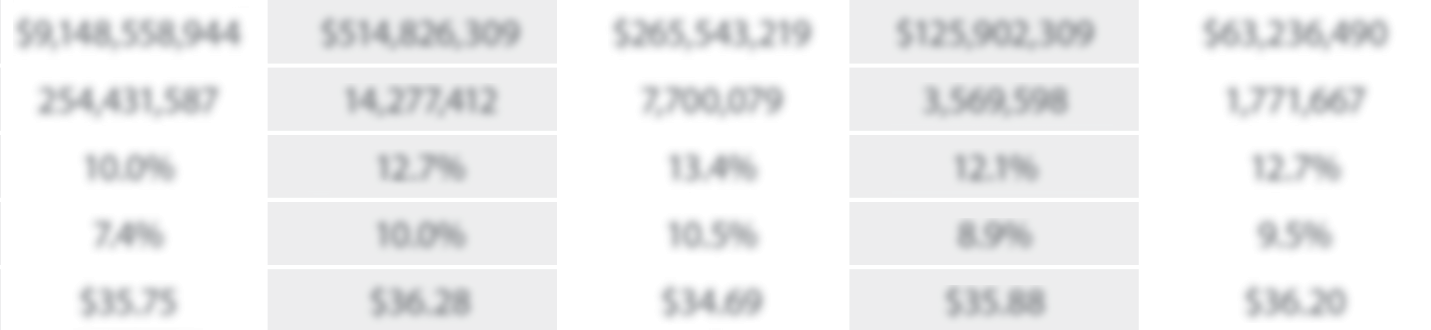
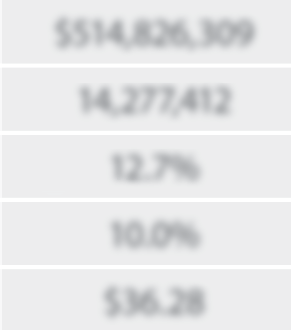
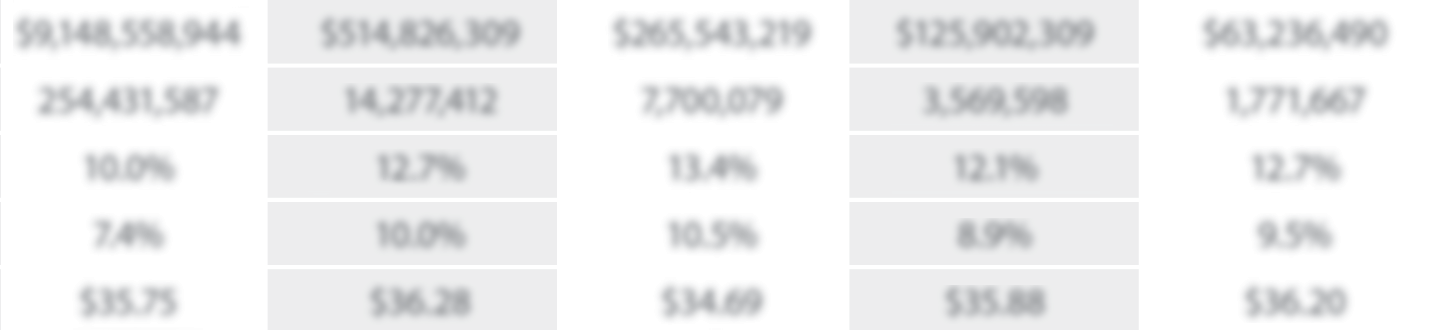
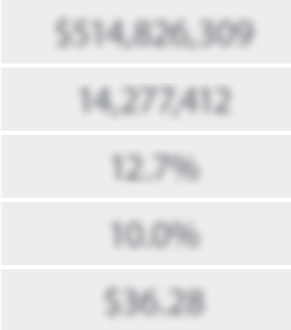
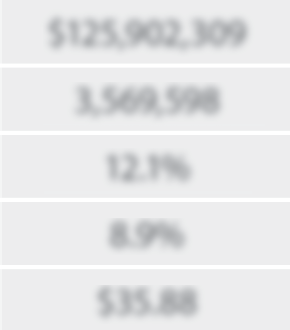
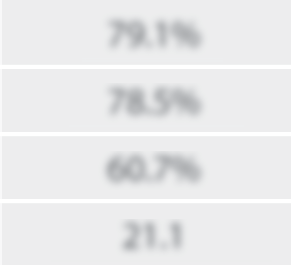
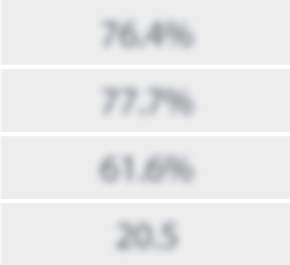
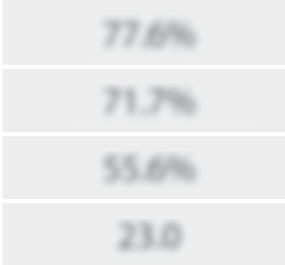
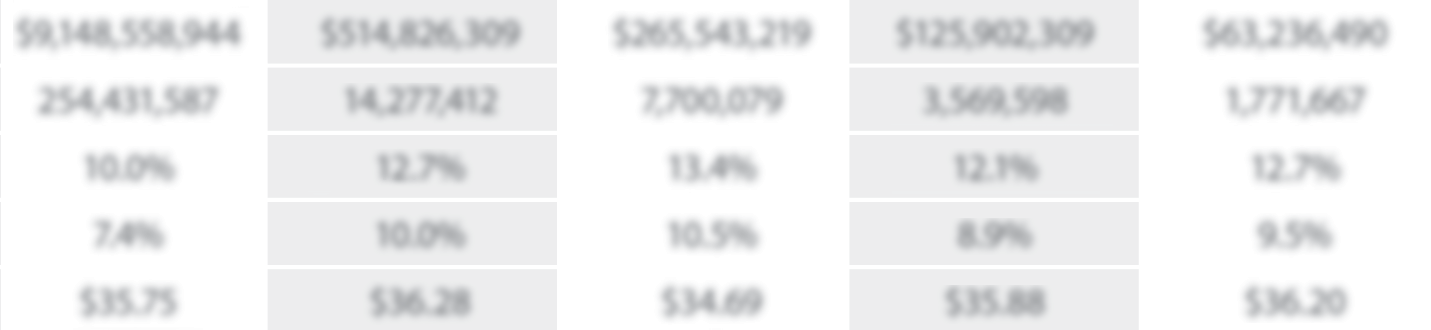
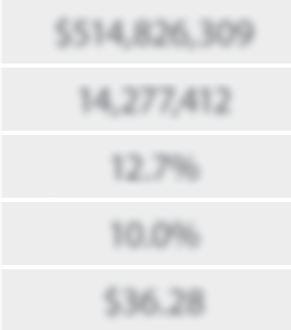
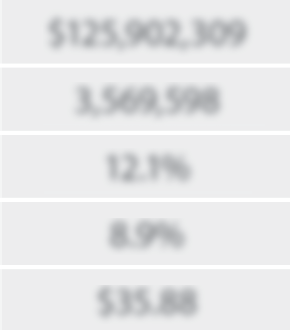
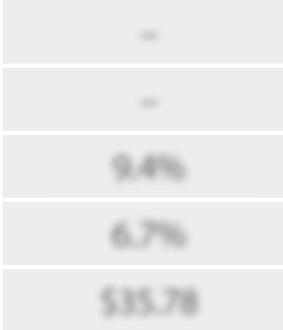
Consumer Debit Scorecard
Visa’s fl agship metrics tool is unique in the industry. It identifi es potential for penetration, activation, and usage
improvement and lets you benchmark your portfolio against Peers (other issuers of your size) and the Visa System.
That lets you focus your resources where the opportunity is greatest, and move ahead with clarity and confi dence.
Customizable
Marketing Collateral
to help increase turnkey, multi-channel
campaigns to increase debit card usage
Branch Best Practices
to help maximize new
account production
Performance
Measurement Calculator
to estimate portfolio revenue potential
Metrics
Peer Group
Peer Group
Peer Group
Peer Group
Peer Group
Visa System
1 – 20
21 – 50
51 – 100
101 – 250
251 - 400
Power Scores:
Transaction
14.88
13.00
13.96
12.35
11.60
12.80
Sales Volume
$529.60
$466.70
$477.01
$435.97
$410.82
$458.18
PAU:
Penetration
81.7%
79.1%
80.4%
76.4%
75.6%
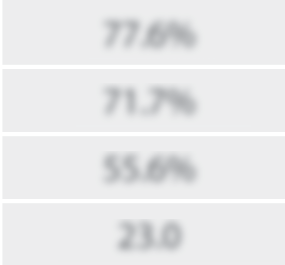
77.6%
Activation
75.0%
78.5%
78.2%
77.7%
79.2%
71.7%
Penetration* Activation
62.1%
60.7%
62.4%
61.6%
61.8%
55.6%
Usage
24.8
21.1
22.1
20.5
19.3
23.0
Portfolio:
Sales Volume
$9,148,558,944
$514,826,309
$265,543,219
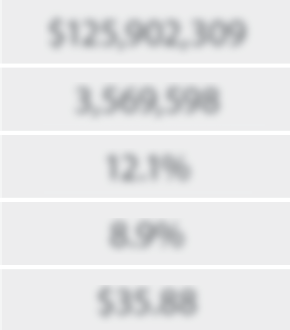
$125,902,309
$63,236,490
–
Transaction Volume
254,431,587
14,277,412
7,700,079
3,569,598
1,771,667
–
Sales Volume Growth
10.0%
12.7%
13.4%
12.1%
12.7%
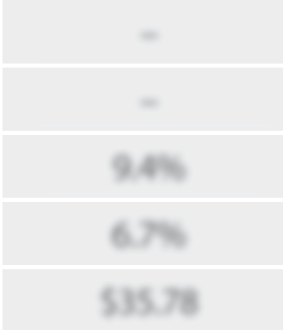
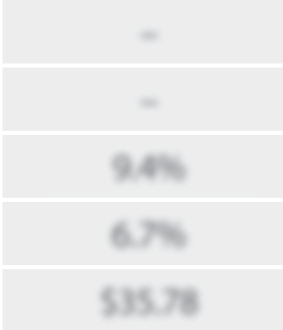
9.4%
Transaction Count Growth
7.4%
10.0%
10.5%
8.9%
9.5%
6.7%
Average Ticket Size
$35.75
$36.28
$34.69
$35.88
$36.20
$35.78
Accounts & Cards:
# of DDAs
5,698,102
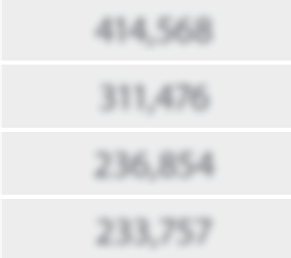
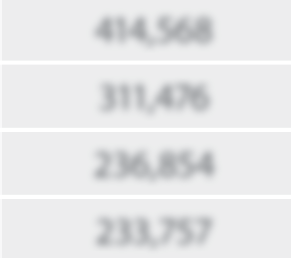
414,568
212,146
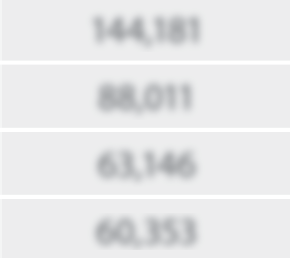
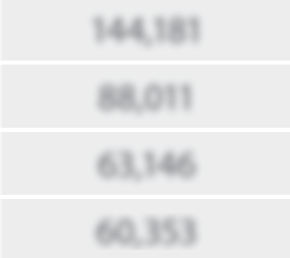
144,181
55,639
–
# of Visa Debit Accounts
4,741,058
311,476
165,481
88,011
41,795
–
# of Active Visa Debit Accounts
3,344,336
236,854
125,053
63,146
32,349
–
# of Active Cards
4,125,897
233,757
123,874
60,353
30,016
–
Monthly Average per Active Card:
Sales per Active Card
$746.50
$736.65
$725.26
$709.16
$710.83
$757.90
Transaction per Active Card
20.92
20.39
21.01
19.90
19.81
21.18
1
4.
4.
4.
4.
4.
4
8
8
88
88
88
88
88
8
1
3.
3.
3.
3
96
96
96
96
96
96
96
96
1
1.
1.
1.
1.
1.
1
6
0
60
60
60
60
60
1
3.
3.
3.
3.
3
00
00
00
00
00
00
1
2.
2.
2.
2
3
5
35
35
35
35
1
2.
2.
2.
2.
2
8
0
80
80
80
80
$
52
52
52
52
52
9.
9.
9.
9.
9
60
60
60
60
60
60
60
$
47
47
47
47
47
47
4
7.
7
.
7.
7.
7
01
01
01
01
01
01
$
41
41
41
41
41
41
4
0.
0.
0.
0.
0
82
82
82
82
82
82
8
$
46
46
46
46
46
46
46
6.
6.
6.
6.
6
70
70
70
70
70
70
$
43
43
43
43
43
4
5.
5.
5
.
5
97
97
97
97
97
9
7
$
45
45
45
45
45
4
8.
8.
8.
8.
8
18
18
18
18
18
8
1.
1.
1
.
1
7%
7%
7%
7%
7%
7%
7%
8
0.
0.
0.
0.
0
4%
4%
4%
4%
4%
4%
4%
4
7
5.
5.
5.
5.
5.
5
6%
6%
6%
6%
6%
6%
6%
7
9.
9.
9.
9.
9
1%
1%
1%
1%
1%
7
6.
6.
6.
6.
6.
6
4%
4%
4%
4%
4%
4%
4%
4
7
7.
7.
7.
7.
7.
7
6%
6%
6%
6%
6%
6%
6%
7
5.
5.
5.
5.
5.
5
0%
0%
0%
0%
0%
0%
0%
7
8.
8.
8.
8.
8.
8
2%
2%
2%
2%
2%
2%
2%
7
9.
9.
9.
9.
9
2%
2%
2%
2%
2%
2%
2%
7
8.
8.
8.
8
5%
5%
5%
5%
5%
5%
7
7
.
7.
7
.
7%
7%
7%
7%
7%
7%
7
1
.
1.
1.
1
7%
7%
7%
7%
7%
7%
6
2.
2.
2
1%
1%
1%
1%
1%
1%
6
2.
2.
2.
2.
2
4%
4%
4%
4%
4%
4%
4%
4
6
1.
1.
1.
1.
1.
1
8%
8%
8%
8%
8%
8%
8%
8
6
0.
0.
0
.
0
7%
7%
7%
7%
7%
7%
61.
1.
1.
1.
1
6%
6%
6%
6%
6%
6%
6%
5
5.
5.
5.
5.
5
6%
6%
6%
6%
6%
6%
6%
2
4.
4.
4.
4.
4.
4
8
8
8
8
2
2.
2
.
2
1
1
9.
9.
9.
9.
9
3
21
21
21
21
21
2
.1
.1
2
0
20
20
20
2
.5
.5
.5
.5
2
3
23
23
23
2
.0
.0
.0
.0
$
9,
9,
9,
9,
9,
9,
9
14
14
14
14
14
14
8,
8,
8,
8,
8,
8
5
5
55
55
55
55
8,
8,
8,
8,
8,
8
94
94
94
94
94
94
94
94
4
4
4
4
$
26
26
26
26
26
26
5,
5,
5,
5,
5,
5
54
54
54
54
54
54
3,
3,
3,
3,
3,
3
21
21
21
21
21
21
2
9
9
9
9
9
$
63
63
63
63
63
6
2
,2
,2
,2
,2
36
36
36
36
36
36
36
,4
,4
,4
,4
,4
,4
90
90
90
90
90
90
90
$5
$5
$5
$5
$5
14
14
14
14
14
,8
,8
,8
,8
,8
26
26
26
26
26
26
,3
,3
,3
,3
,3
09
09
09
09
09
09
$1
$1
$1
$1
$1
$1
25
25
25
25
25
2
,9
,9
,9
,9
,9
,9
02
02
02
02
02
02
0
3
,3
,3
,3
,3
09
09
09
09
09
09
–
2
54
54
54
54
54
54
,4
,4
,4
,4
,4
,4
31
31
31
31
31
3
,5
,5
,5
,5
87
87
87
87
87
8
7
7,
7,
7,
7
,
70
70
70
70
70
70
70
0,
0,
0,
0,
0,
0
07
07
07
07
07
07
9
9
9
9
1,
1,
1,
1,
1
77
77
77
77
77
77
1,
1,
1,
1,
1,
1
66
66
66
66
66
66
66
7
7
7
7
1
4,
4,
4,
4,
4,
4
27
27
27
27
27
27
2
7,
7,
7,
7,
7
41
4
1
41
41
41
4
2
2
2
2
3,
3,
3,
3,
3,
3
56
56
56
56
56
9,
9,
9,
9,
9,
9,
9
59
59
59
59
59
8
–
1
0.
0.
0.
0
0%
0%
0%
0%
0%
0%
0%
1
3.
3.
3.
3
4%
4%
4%
4%
4%
4%
4%
4
1
2
.
2
7%
7%
7%
7%
7%
7%
7%
1
2.
2
7%
7%
7%
7%
7%
7%
1
2.
2
1%
1%
1%
1%
1%
9
.4
.4
.4
.4
.4
%
7
.4
.4
.4
.4
.4
%
%
%
%
%
10
10
10
10
10
10
.5
.5
.5
.5
%
%
%
%
%
9
.5
.5
.5
.5
%
%
%
%
%
10
10
10
10
10
1
.0
.0
.0
.0
%
%
%
%
8.
8.
8.
8
9%
9%
9%
9%
9%
9%
6
.
6.
6.
6
7%
7%
7%
7%
7%
7%
$
35
35
35
35
35
3
.7
.7
.7
.7
.7
5
5
5
5
5
$
34
34
34
34
34
34
.6
.6
.6
.6
9
9
9
9
$
36
36
36
36
36
36
2
.2
.2
.2
.2
0
0
0
0
$
3
$3
$3
$3
$3
6.
6.
6.
6
28
28
28
28
28
2
8
$
3
$3
$3
$3
$3
5.
5.
5.
5.
5
88
88
88
88
88
88
$
3
$3
$3
$3
$3
5.
5.
5.
5
78
78
78
78
78
7
5
,6
,6
,6
,6
,6
98
98
98
98
98
98
,1
,1
,1
,1
,1
,1
02
02
02
02
02
2
12
12
12
12
12
,1
,1
,1
,1
,1
46
46
46
46
46
46
46
4
5
5,
5,
5,
5,
5,
5
6
3
63
63
63
63
63
9
9
9
9
4
14
14
14
14
14
,5
,5
,5
,5
,5
68
68
68
68
68
68
1
44
44
44
44
44
44
44
4
,1
,1
,1
,1
,1
81
81
81
81
81
8
–
4
,7
,7
,7
,7
,7
,7
41
41
41
41
41
4
,0
,0
,0
,0
58
58
58
58
58
1
6
5
65
65
65
65
6
,4
,4
,4
,4
,4
,4
81
81
81
81
81
8
4
1
41
41
41
41
4
,7
,7
,7
,7
95
95
95
95
95
95
9
3
11
11
11
11
11
,4
,4
,4
,4
76
76
76
76
76
76
8
8,
8,
8,
8,
8,
8
01
01
01
01
01
1
–
3
,3
,3
,3
,3
,3
44
44
44
44
44
44
44
44
,3
,3
,3
,3
,3
,3
36
36
36
36
36
36
1
25
25
25
25
25
2
,0
,0
,0
,0
,0
,0
53
53
53
53
53
3
2
32
32
32
32
,3
,3
,3
,3
,3
49
4
9
49
49
49
49
4
2
36
36
36
36
36
,8
,8
,8
,8
,8
54
54
54
54
6
3,
3,
3,
3,
3
14
14
14
14
14
6
6
6
6
6
–
4
,1
,1
,1
,1
,1
25
25
25
25
25
2
,8
,8
,8
,8
,8
97
97
97
97
9
7
1
23
23
23
23
23
2
,8
,8
,8
,8
,8
,8
74
74
74
74
74
74
3
0
30
30
30
30
30
,0
,0
,0
,0
,0
16
16
16
16
16
2
33
33
33
33
,7
,7
,7
,7
,7
57
57
57
57
57
6
0,
0,
0,
0,
0
3
5
35
35
35
3
3
3
–
$
74
74
74
74
74
74
6.
6.
6.
6.
6.
6
50
50
50
50
50
50
50
$
72
72
72
72
72
7
5.
5.
5.
5
2
6
26
26
26
26
26
$
71
71
71
71
71
71
0.
0.
0.
0.
0
83
83
83
83
83
83
8
$
73
73
73
73
73
6.
6.
6.
6.
6
6
5
65
65
65
65
6
$
70
70
70
70
70
9.
9.
9.
9.
9
16
16
16
16
16
$7
$7
$7
$7
$7
$7
57
57
57
57
57
.9
.9
.9
.9
0
2
0.
0
.
0
92
92
92
92
92
92
2
1.
1.
1.
1.
1
01
01
01
01
01
1
9.
9.
9.
9.
9
81
81
81
81
81
8
2
0.
0.
0
39
39
39
39
39
39
1
9.
9.
9.
9.
9
90
90
90
90
90
90
90
2
1.
1
.
1
1
8
18
18
18
FOR
ILLUSTRATIVE
PURPOSES
ONLY















































































Potential for added growth
Visa Debit represents exceptional revenue potential for you, as debit cards are poised for further growth.
The use of debit has become increasingly important with an impressive sales volume of more than
$2.6 trillion in 2016.
1
And there is still room to grow debit spend. With 26% of those who participated in the Visa Payments Panel continuing
to use cash and checks, and 73% of cash transactions falling below $25,
2
Visa is now taking aim at well-defi ned targets
for future debit expansion.
In-depth Research
Whenever possible we use fi rsthand
customer research data to inform our
debit marketing strategies
Webinars
I
n-depth content on industry trends,
business opportunities and more
Insight Guides
to help increase the eff ectiveness
of your marketing eff orts
More possibilities ahead:
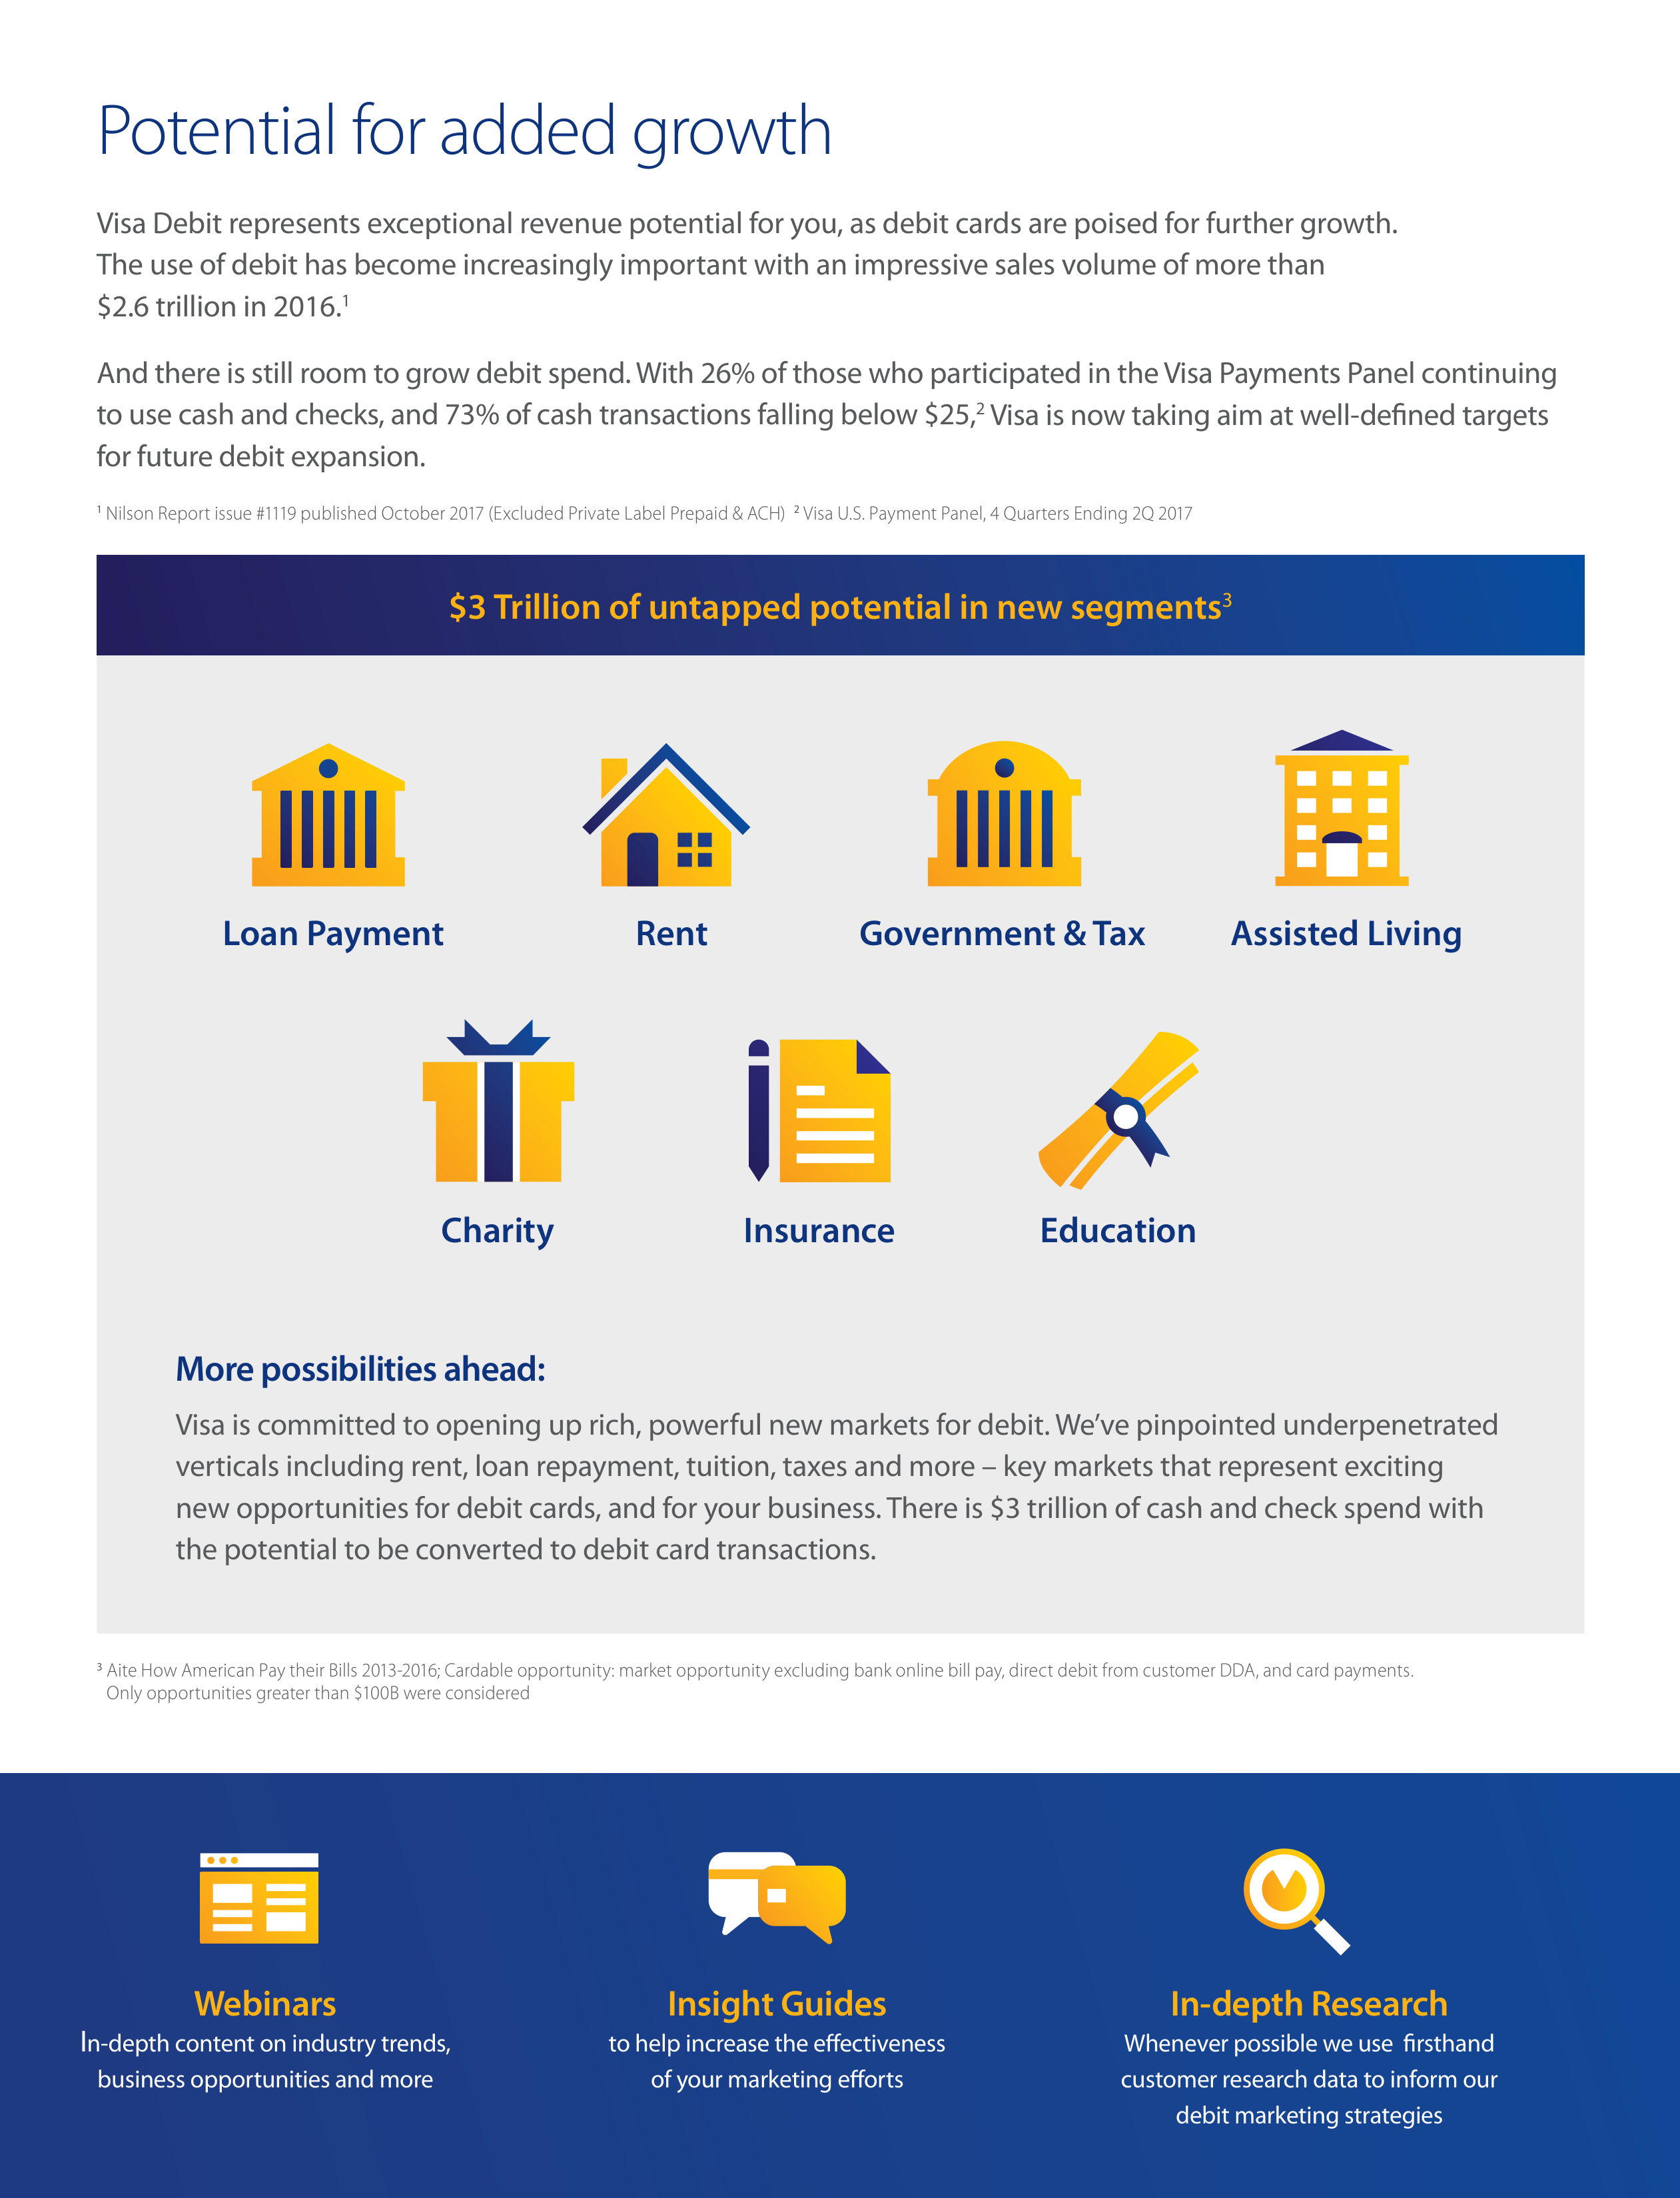
Visa is committed to opening up rich, powerful new markets for debit. We’ve pinpointed underpenetrated
verticals including rent, loan repayment, tuition, taxes and more – key markets that represent exciting
new opportunities for debit cards, and for your business. There is $3 trillion of cash and check spend with
the potential to be converted to debit card transactions.
$3 Trillion of untapped potential in new segments
3
Loan Payment
Rent
Government & Tax
Assisted Living
Charity
Insurance
Education
3
Aite How American Pay their Bills 2013-2016; Cardable opportunity: market opportunity excluding bank online bill pay, direct debit from customer DDA, and card payments.
Only opportunities greater than $100B were considered
1
Nilson Report issue #1119 published October 2017 (Excluded Private Label Prepaid & ACH)
2
Visa U.S. Payment Panel, 4 Quarters Ending 2Q 2017















Industry-leading risk solutions
Authentication:
Visa Advanced Authorization (VAA)
In-fl ight real-time risk scoring available for every VisaNet transaction
Visa Risk Manager (VRM)
Lets fi nancial institutions decline only the highest risk transactions while
optimizing approval rates at point of purchase, resulting in reduced risk exposure and increased usage
Visa Consumer Authentication Service (VCAS)
Visa’s hosted 3DS solution
delivers multiple layers of protection against eCommerce fraud
Mobile Location Confi rmation
Unique geolocation service enhances
risk scoring
Travel Authorization Tag
Incorporates travel data into authorization
Visa ID Intelligence
Intelligent risk analytics
Transaction Advisor
Lessens fraud on Automated Fuel Dispensers
Compromised Account Management System
Identifi es accounts for reissuance
Risk Management:
Threat Intelligence
Delivers real time threat information
Visa Claims Resolution
Allows issuers to process disputes effi ciently
Consumer Transaction Controls
Empowers consumers to limit card usage
Our methods include:
• Identifying fraud before it occurs using predictive analytics
• Tokenizing transaction data so payment data becomes
worthless to criminals
• Verifying cardholder identity before a transaction is made
• Optimizing the customer experience with best-in-class
payment products
Our approach keeps payments
effi cient and secure:
• Optimizing authorization rates
• Minimizing fraud
• Streamlining the payment process
Le
a
rn
h
o
w
V
is
a
c
an
a
dd
s
tr
e
n
g
t
h
a
n
d
d
riv
e
pe
r
fo
rm
a
n
c
e
f
o
r
yo
u
r d
e
b
it
p
o
rt
f
o
l
io
.
C
a
ll
8
8
8
-
8
4
7
-
2
2
4
2
and follow the prompts on the menu to be directed to the Sales Department.
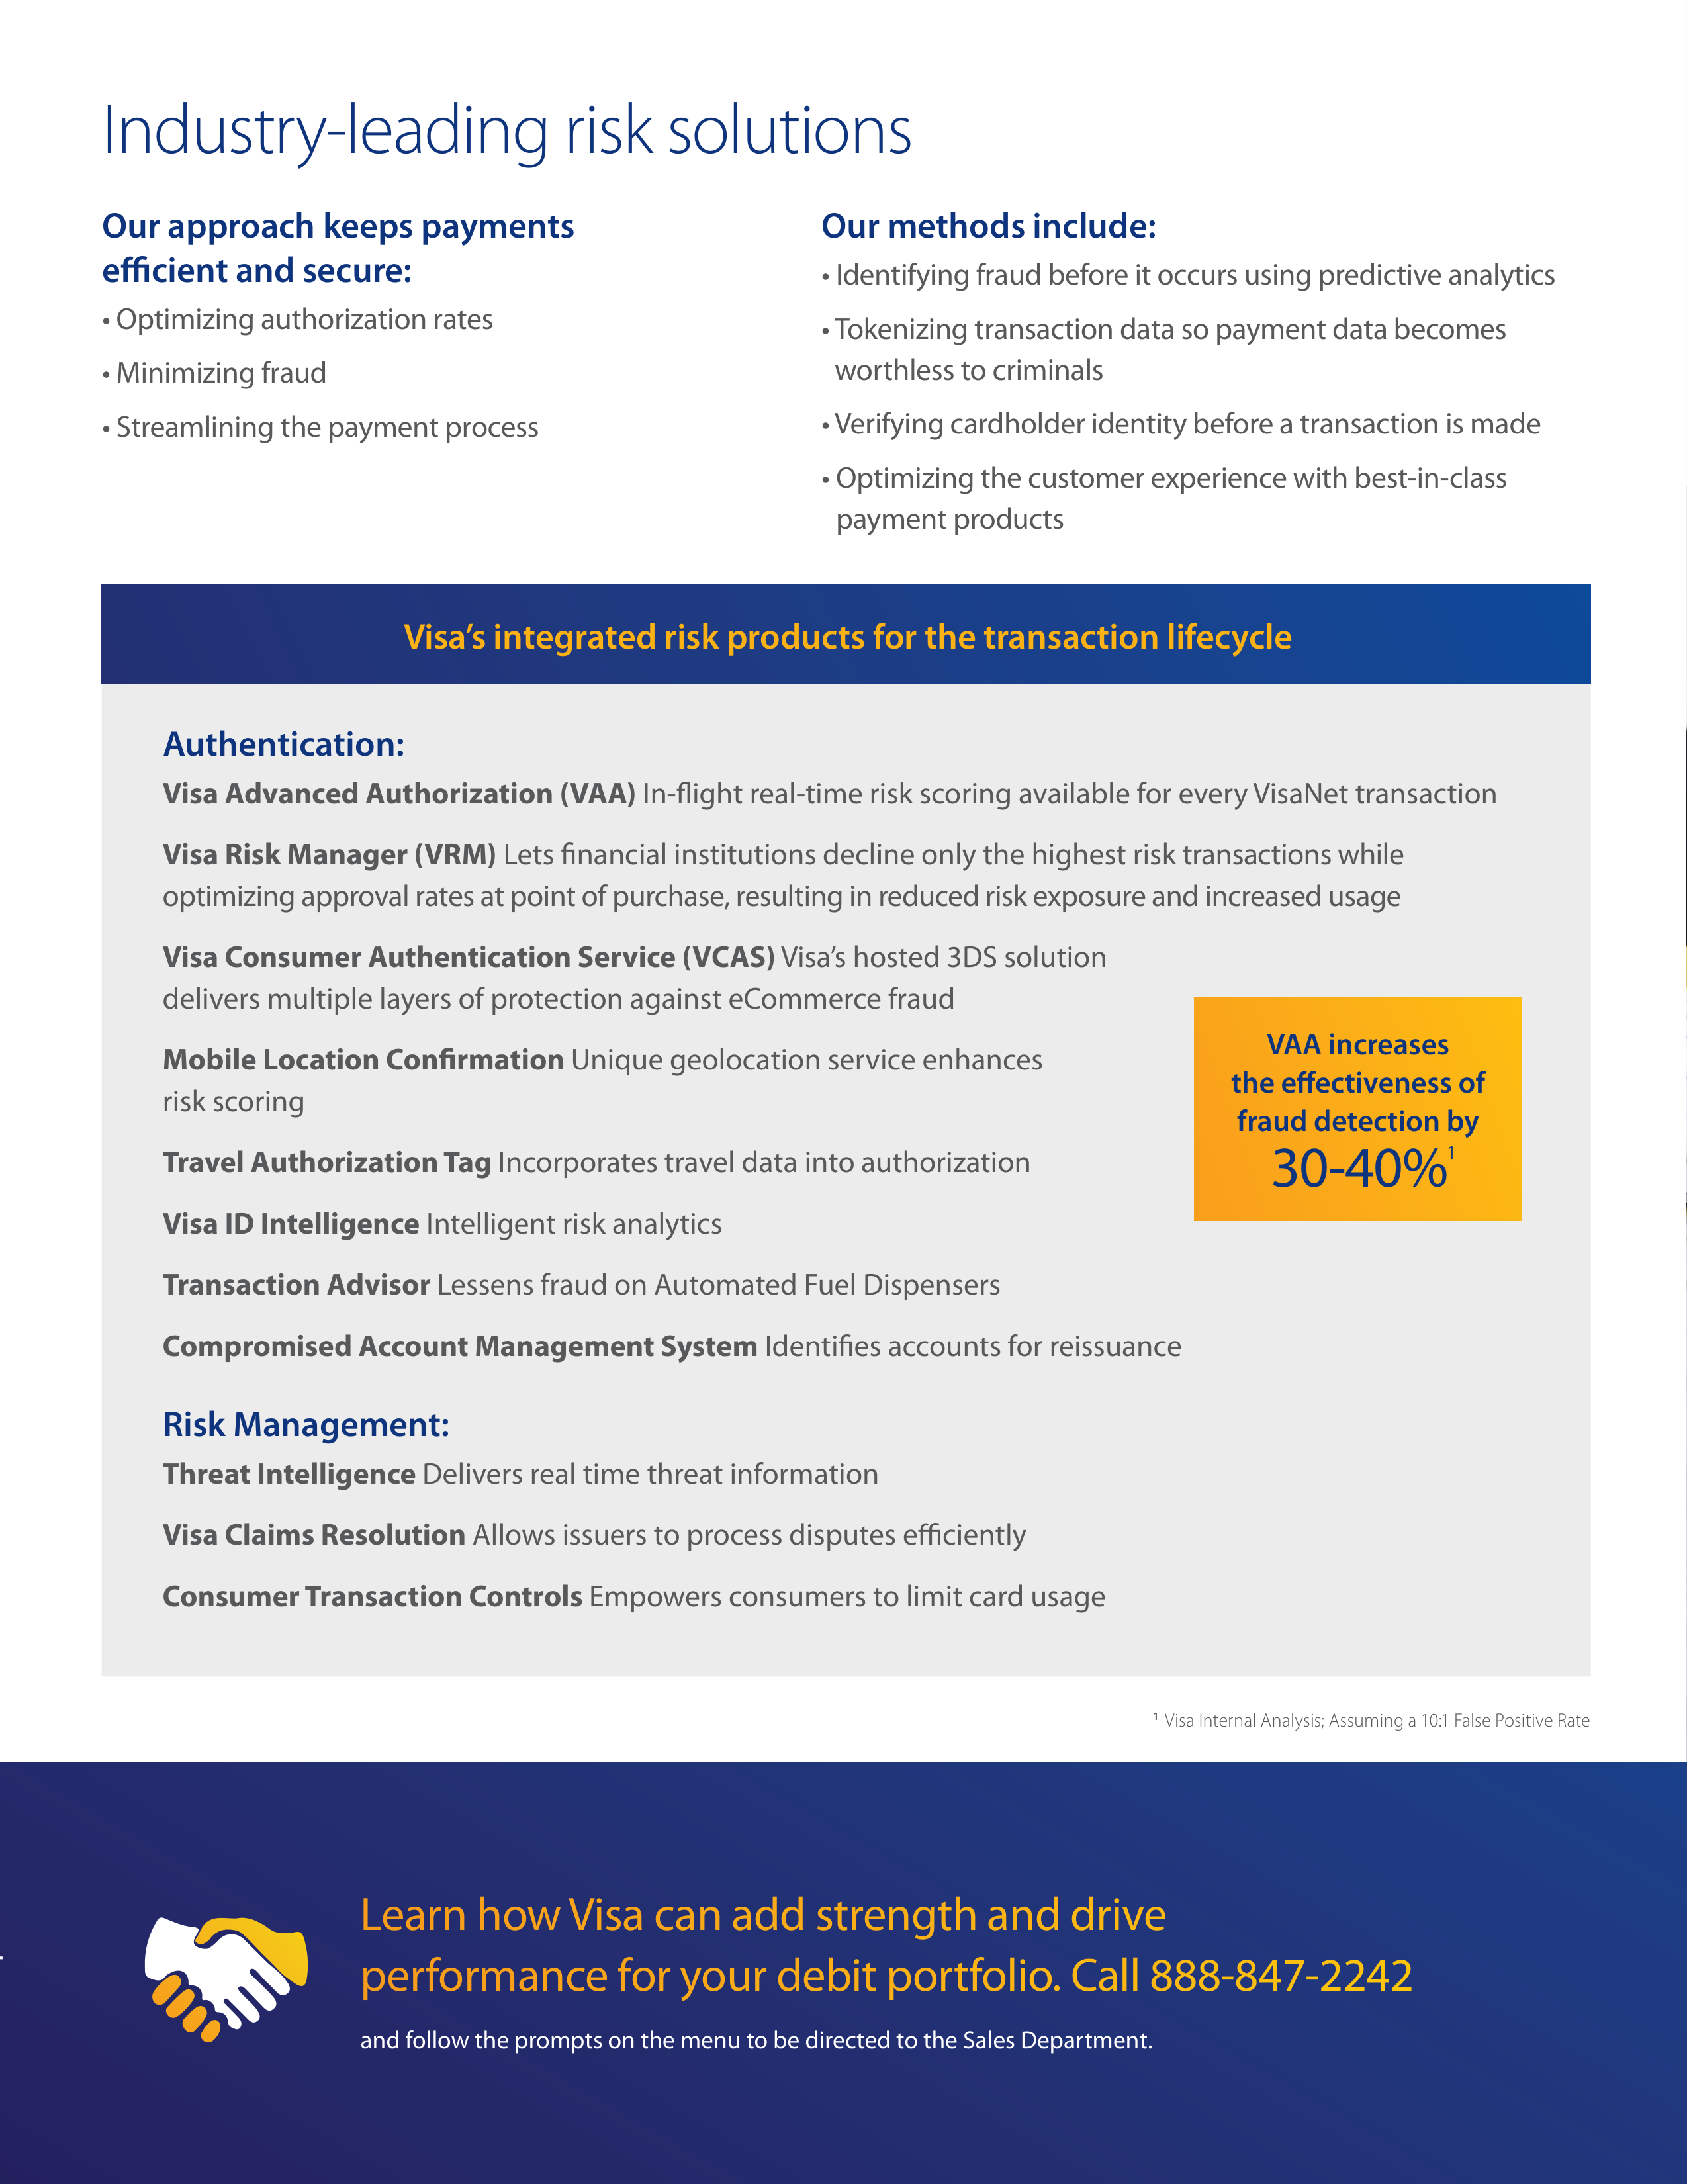
VAA increases
the eff ectiveness of
fraud detection by
30-40%
1
1
Visa Internal Analysis; Assuming a 10:1 False Positive Rate
Visa’s integrated risk products for the transaction lifecycle