
Annual Report 2015
STRONGER
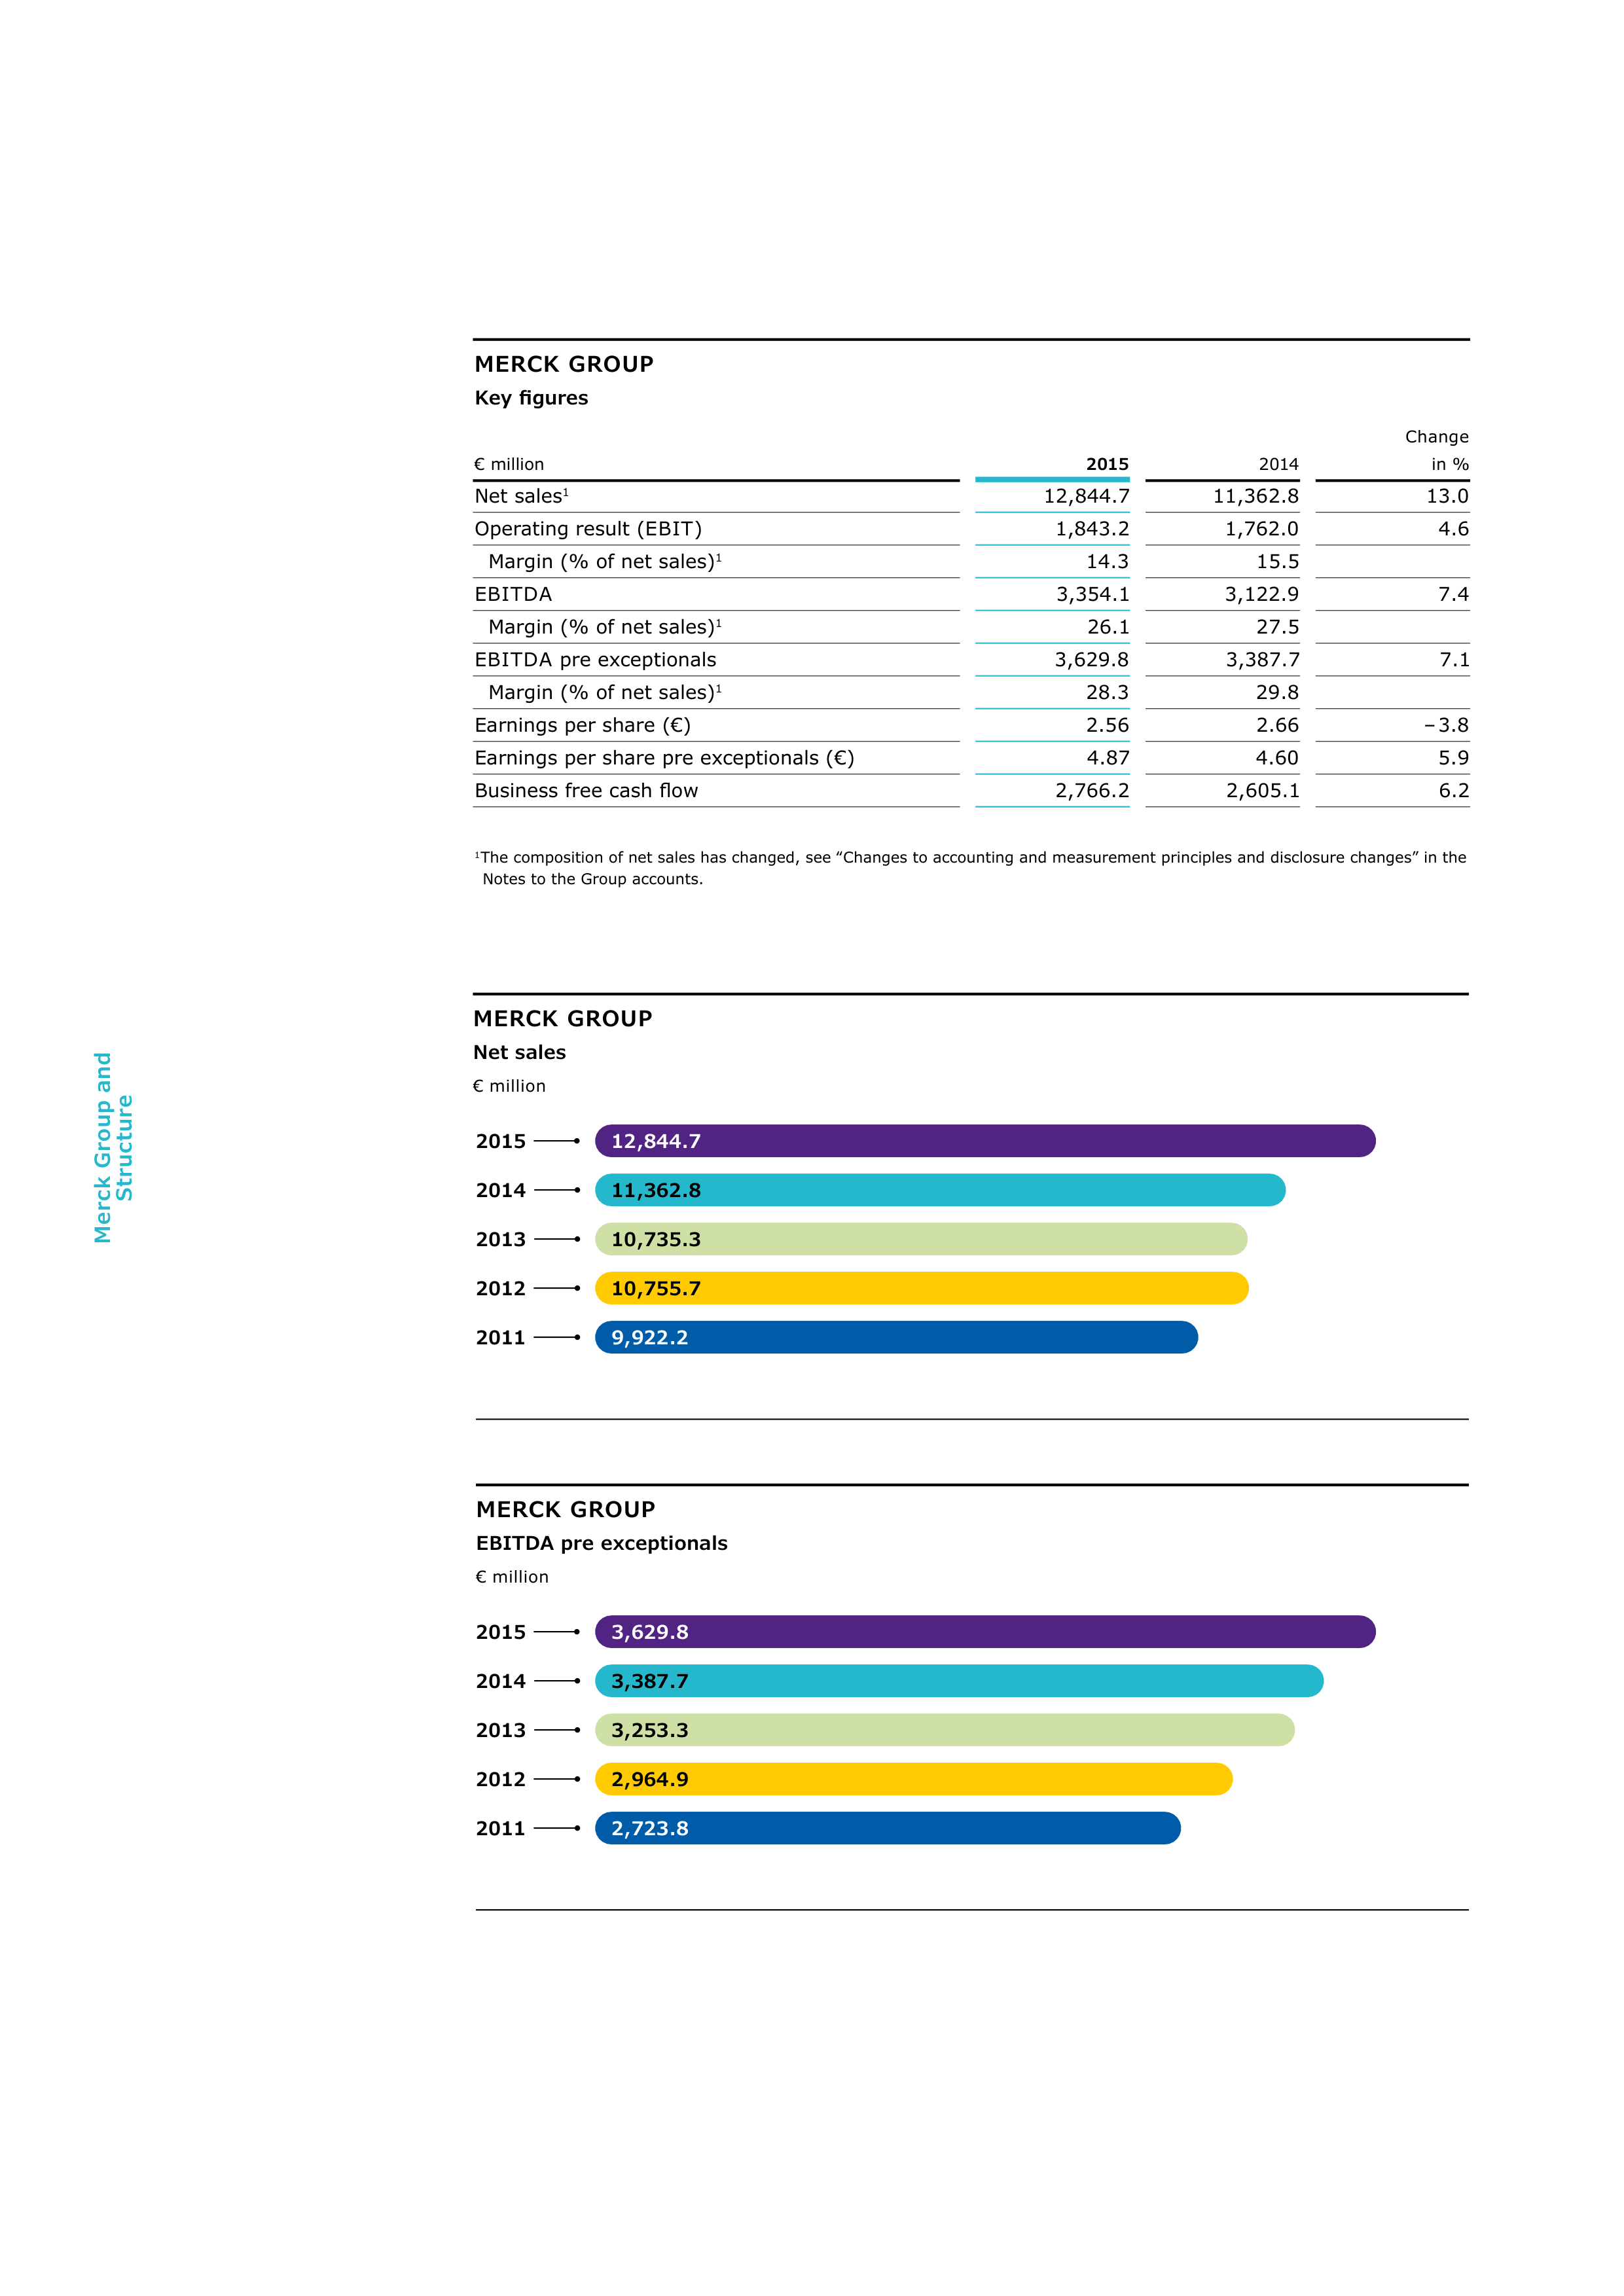
MERCK GROUP
EBITDA pre exceptionals
€ million
2015
12,844.7
MERCK GROUP
Net sales
€ million
9,922.2
11,362.8
10,735.3
10,755.7
2014
2013
2012
2011
3,629.8
2,723.8
3,387.7
3,253.3
2,964.9
2015
2014
2013
2012
2011
Merck Group and
Structure
MERCK GROUP
Key figures
€ million
2015
2014
Change
in %
Net sales
1
12,844.7
11,362.8
13.0
Operating result (EBIT)
1,843.2
1,762.0
4.6
Margin (% of net sales)
1
14.3
15.5
EBITDA
3,354.1
3,122.9
7.4
Margin (% of net sales)
1
26.1
27.5
EBITDA pre exceptionals
3,629.8
3,387.7
7.1
Margin (% of net sales)
1
28.3
29.8
Earnings per share (€)
2.56
2.66
– 3.8
Earnings per share pre exceptionals (€)
4.87
4.60
5.9
Business free cash flow
2,766.2
2,605.1
6.2
1
The composition of net sales has changed, see ‟Changes to accounting and measurement principles and disclosure changes” in the
Notes to the Group accounts.
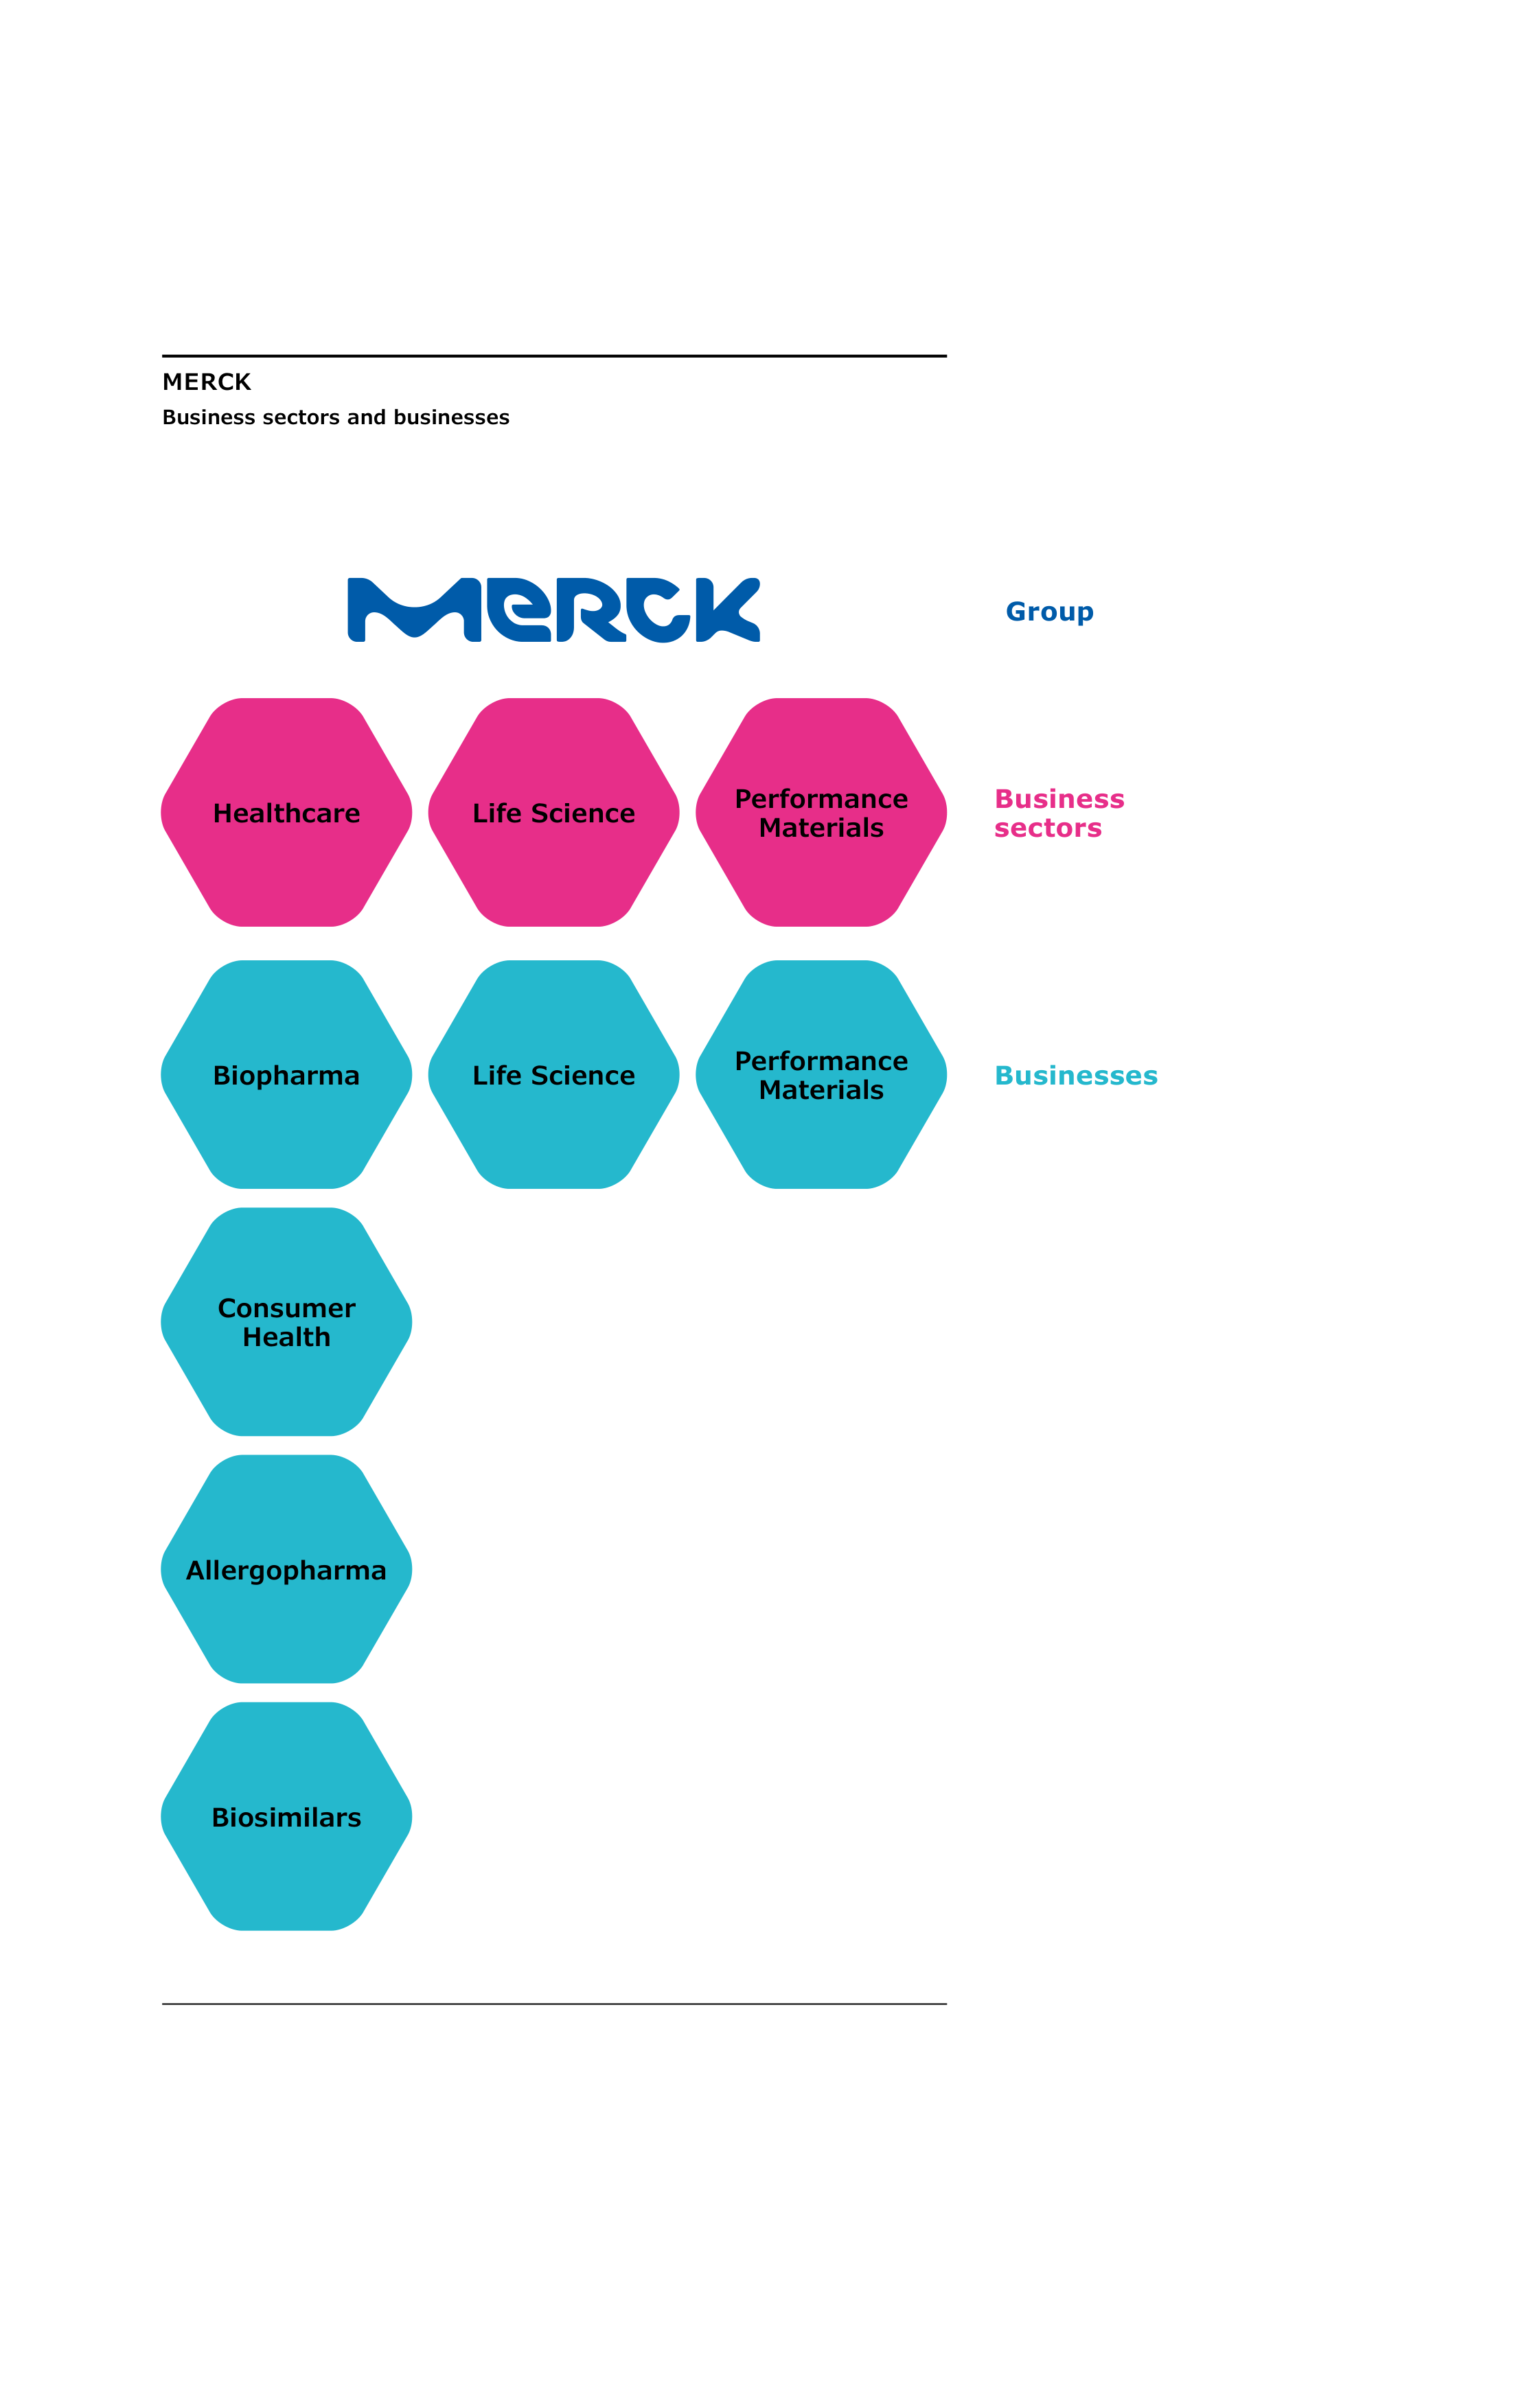
Performance
Materials
Life Science
Biopharma
Consumer
Health
Allergopharma
Biosimilars
Performance
Materials
Business
sectors
Businesses
Group
Healthcare
Life Science
MERCK
Business sectors and businesses
Merck has
fundamentally changed over the past ten years. We have developed from a classic supplier of
pharmaceuticals and chemicals to a global science and technology company. With our unique
combination of highly specialized biopharmaceutical, life science and materials businesses, we
are in a position today to offer solutions to support global megatrends such as health and digita
l
ization. Our new brand communicates this new direction to our customers, partners and applicants.
We want to be recognizable and remain visible as Merck so as to strengthen our well-known brand
name. To achieve this, we have adopted a bold and vibrant appearance.
‟
Today,
Merck is better positioned
than ever before. We can be proud
of what Merck is today: a leading
science and technology company
whose ideas and products can
really make a difference in the world.
With our three business sectors
Healthcare, Life Science and
Performance Materials, we are not
only successful, but also improve
the lives of patients, customers and
partners all over the world.”
Karl-Ludwig Kley
Chairman of the Executive Board
Innovations are the essence of our activities. We work enthusiastically to develop
future-oriented technologies and invest all our strength in promising areas of
research such as cancer therapy, fertility treatment and new medicines, as well as
in the development of cutting-edge materials for displays. The magazine in this
annual report shows how we work on improving human life through technological
progress on a daily basis.
HIGHLIGHTS OF
2015
6 – 7
A CLEAR VIEW
8 – 13
At the new Merck Innovation Center,
scientists are working to develop future-
oriented products and solutions, such as
an ingenious artificial eye lens in which
liquid crystal technology is used.
READY FOR
PRINTING
14 – 19
OLED displays offer captivating advan-
tages, whether for smartphones or large
televisions.
With innovative printing
processes, Merck wants to play a pio-
neering role in this field.
PROGRESS
20 – 23
Immuno-oncological therapies represent
a new era in cancer treatment. Merck
and Pfizer aim to unlock the potential of
this area of research through a strategic
alliance.
AWARENESS
24 – 27
With its Capacity Advancement Program,
Merck aims to strengthen its education
and prevention efforts among people
living in developing countries. The focus
is on diabetes, cancer and fertility treat
ment.
GROWTH
28 – 30
Having completed the acquisition of the
laboratory supply company Sigma-Aldrich,
Merck is now one of the leading players
in the global life science industry – and
also has a superb e-commerce platform.
4
Magazine
Table of contents
To Our Shareholders
31 – 42
033
Letter from Karl-Ludwig Kley
038
The Executive Board
040
Our Shares
Combined
Management Report*
43 – 144
045
Fundamental Information about the Group
045
Merck
052
Objectives and Strategies
058
Internal Management System
062
Corporate Responsibility
070
Research and Development
080
People at Merck
086
Report on Economic Position
086
Macroeconomic and
Sector-Specific Environment
088
Review of Forecast against Actual
Business Developments
092
Course of Business and Economic Position
092
Merck
103
Healthcare
109
Life Science
114
Performance Materials
119
Corporate and Other
120
Report on Risks and Opportunities
131
Report on Expected Developments
136
Report in accordance with section 315 (4)
of the German Commercial Code (
HGB
)
138
Additional information on Merck KGaA in
accordance with the German Commercial
Code (
HGB
)
144
Subsequent Events
Corporate Governance
145 – 168
147
Capital structure and governance bodies
of Merck KGaA
148
Statement on Corporate Governance
164
Report of the Supervisory Board
166
Objectives of the Supervisory Board with
respect to its composition
Consolidated
Financial Statements
169 – 257
172
Consolidated Income Statement
173
Consolidated Statement of Comprehensive Income
174
Consolidated Balance Sheet
175
Consolidated Cash Flow Statement
176
Consolidated Statement of Changes in Net Equity
178
Notes to the Group Accounts
258
Responsibility Statement
259
Auditor’s Report
260
Business Development 2011 – 2015
262
Information and Service
Financial Calendar for 2016
*
The management report of Merck KGaA has been combined
with the Group management report and published in both
the 2015 Merck Annual Report and the Annual Financial
Statements of Merck KGaA. The annual financial statements
and the combined management report of the Merck Group
and Merck KGaA for 2015 have been filed with the electro
n-
ic German Federal Gazette and are available on the website
of the German company register.
Table of contents
Annual Report
5
6
Magazine
Highlights of 2015
Highlights
of 2015
March
4
Merck enables employees to share
in the company’s success
We paid out a total of around € 300 mil-
lion to employees around the world in
recognition of our business success in
2014, making this our highest profit-
sharing payment ever. The good results
of 2014 were mainly due to the success-
ful implementation of the ‟Fit for 2018”
transformation and growth program.
April
25
German Innovation Award
We received the German Innovation
Award of the German Federal Ministry
for Economic Affairs and Energy for
our innovative liquid crystal technology.
A few weeks earlier (March 22), we had
also been awarded the Innovation Prize
of German Industry in the ‟companies
with innovative HR concepts” category
for the Merck Serono Innovation Cup
and Innospire initiatives.
May
28
Opening of the
OLED
Application
Center in Korea
We opened our new
OLED
Application
Center (
OAC
) in Pyeongtaek, Korea.
With this € 7 million investment, we are
strengthening our
OLED
research activi
ties and Korea’s leading role in the
display industry.
June
3
Launch of our Curiosity Campaign
in the United States
Launch of the cross-business ‟Smarter,
Together” campaign. With the initiative,
we underscored our rich history of
innovation and relentless questioning
in the United States, the world’s largest
pharmaceutical market. Our campaign
aims to encourage scientists and engi-
neers, among others, all over the
world
to share their passion and curiosity.
Highlights of 2015
Magazine
7
June
19
New
OLED
production unit
in Darmstadt
We laid the cornerstone for a new
OLED
materials production unit in Darmstadt.
Production of high-purity
OLED
materials
for use in state-of-the-art displays
and
lighting systems is scheduled to start in
the approximately 2,000 square meter
building in summer 2016. Costing around
€ 30 million, the project is one of the
largest single investments made at the
site in recent years.
October
1
Innovation Center inaugurated
We opened our Innovation Center in
Darmstadt, thereby creating a new
platform for innovations. The aims are
to promote the innovative potential of
employees and give external innovators
the opportunity to develop their ideas
with our support.
October
13
Stefan Oschmann appointed new
Chairman of the Executive Board
The Board of Partners of E. Merck KG
appointed Stefan Oschmann as the new
Chairman of the Executive Board and
CEO
of Merck KGaA. On conclusion of
the Annual General Meeting on April 29,
2016, he will succeed Karl-Ludwig Kley,
who will then retire after nine years at
the helm.
October
14
Merck brand relaunched
We announced the relaunch of our brand
identity. The revamped visual appear-
ance and the introduction of a new logo
reflect the transformation into a global
science and technology company. Out-
side the United States and Canada, we
operate uniformly as Merck.
November
2
Merck distinguished as a top
employer by Science magazine
We were chosen as one of the world’s
best employers in the biopharmaceutical
industry by Science magazine, an inde-
pendent international publication.
November
18
Sigma-Aldrich acquisition closes
With the acquisition of Sigma-Aldrich
for around US$ 17 billion, we completed
the largest acquisition in our company’s
history, thus establishing one of the
leading players in the over € 100 bil-
lion life science industry and a business
with
around 20,000 employees, 300,000
products and approximately one million
customers.
November
20
Merck intends to double its
presence in Africa by 2020
During its visit to Africa, our Executive
Board announced plans to double the
company’s headcount and sales on the
continent within the next five years. To
achieve further growth, we are count-
ing on the entrepreneurial spirit and
innovative strength of this region.


8
Magazine
A clear view
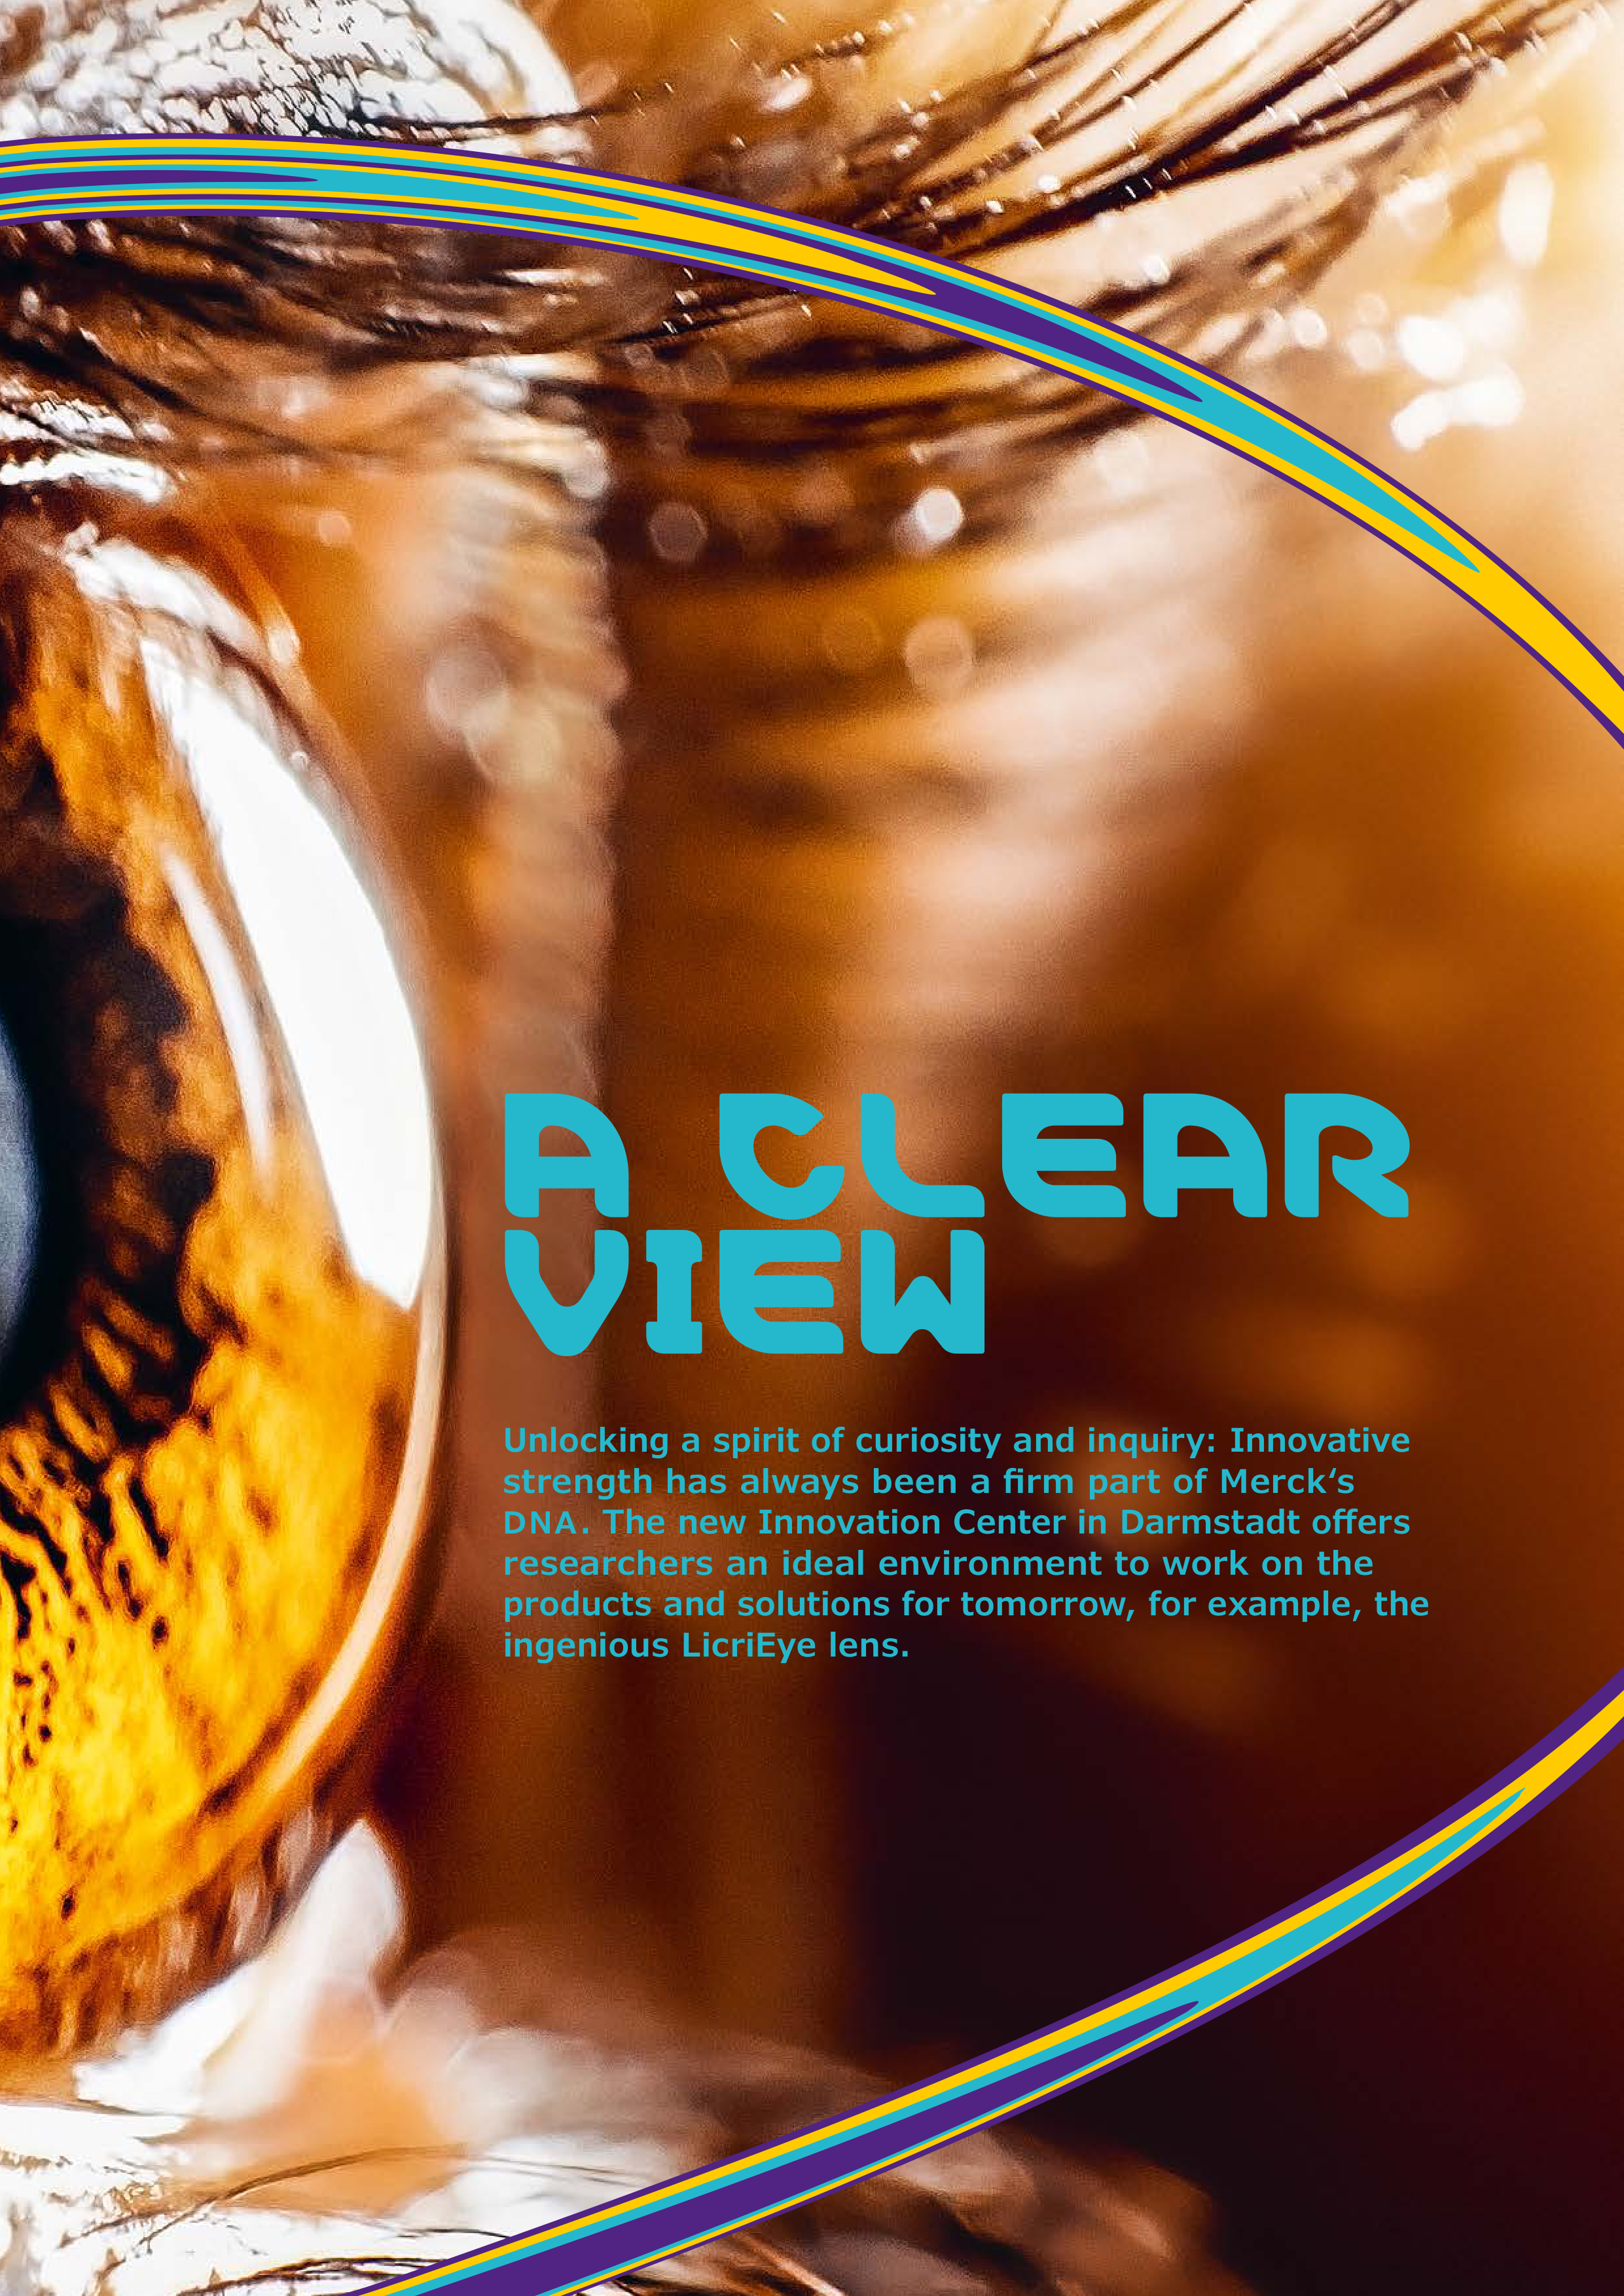

Unlocking a spirit of curiosity and inquiry: Innovative
strength has always been a firm part of Merck‘s
DNA
. The new Innovation Center in Darmstadt offers
researchers an ideal environment to work on the
products and solutions for tomorrow, for example, the
ingenious LicriEye lens.
A CLEAR
VIEW
10
Magazine
A clear view
It’s a melting pot of a broad assortment of ideas. At the
Innovation Center in Darmstadt, interdisciplinary teams from
all three Merck business sectors are passionately pursuing
promising developments. In order to intensively work on
their discoveries inside the modern, newly constructed light-
gray building with its wide window façade, most of the teams
were the winners of company-internal competitions. They have
thus already cleared the first hurdle on the road to success.
The focal point: Merck’s liquid crystal expertise
The LicriEye project team, which comprises experts from
Performance Materials and Healthcare working hand in hand,
is pursuing a clear view in two senses. The project, which is
still in the early stages of development, is focusing on a novel
way of treating cataracts, a widespread eye disorder. A cata-
ract is a clouding of the lens in the eye, which commonly
occurs in people over the age of 65. People with cataracts
increasingly have problems with blurry and distorted vision
and they have trouble seeing contrasts or bright colors. In
most cases, this is a process that advances slowly and, if left
untreated, could lead to blindness. Cataracts are treated by
having them surgically removed in an outpatient procedure
that usually takes around 15 minutes. Cataract surgery ranks
among the most frequently performed operations worldwide.
During surgery, an incision is made to remove the patient’s
clouded lens, which is then replaced by an intraocular artificial
lens. The post-operative result depends on the precision of
the implanted lens.
“
An improperly measured artificial lens
can only be subsequently corrected
by surgically replacing the lens. Addi
tional research is definitely required
and development potential exists.”
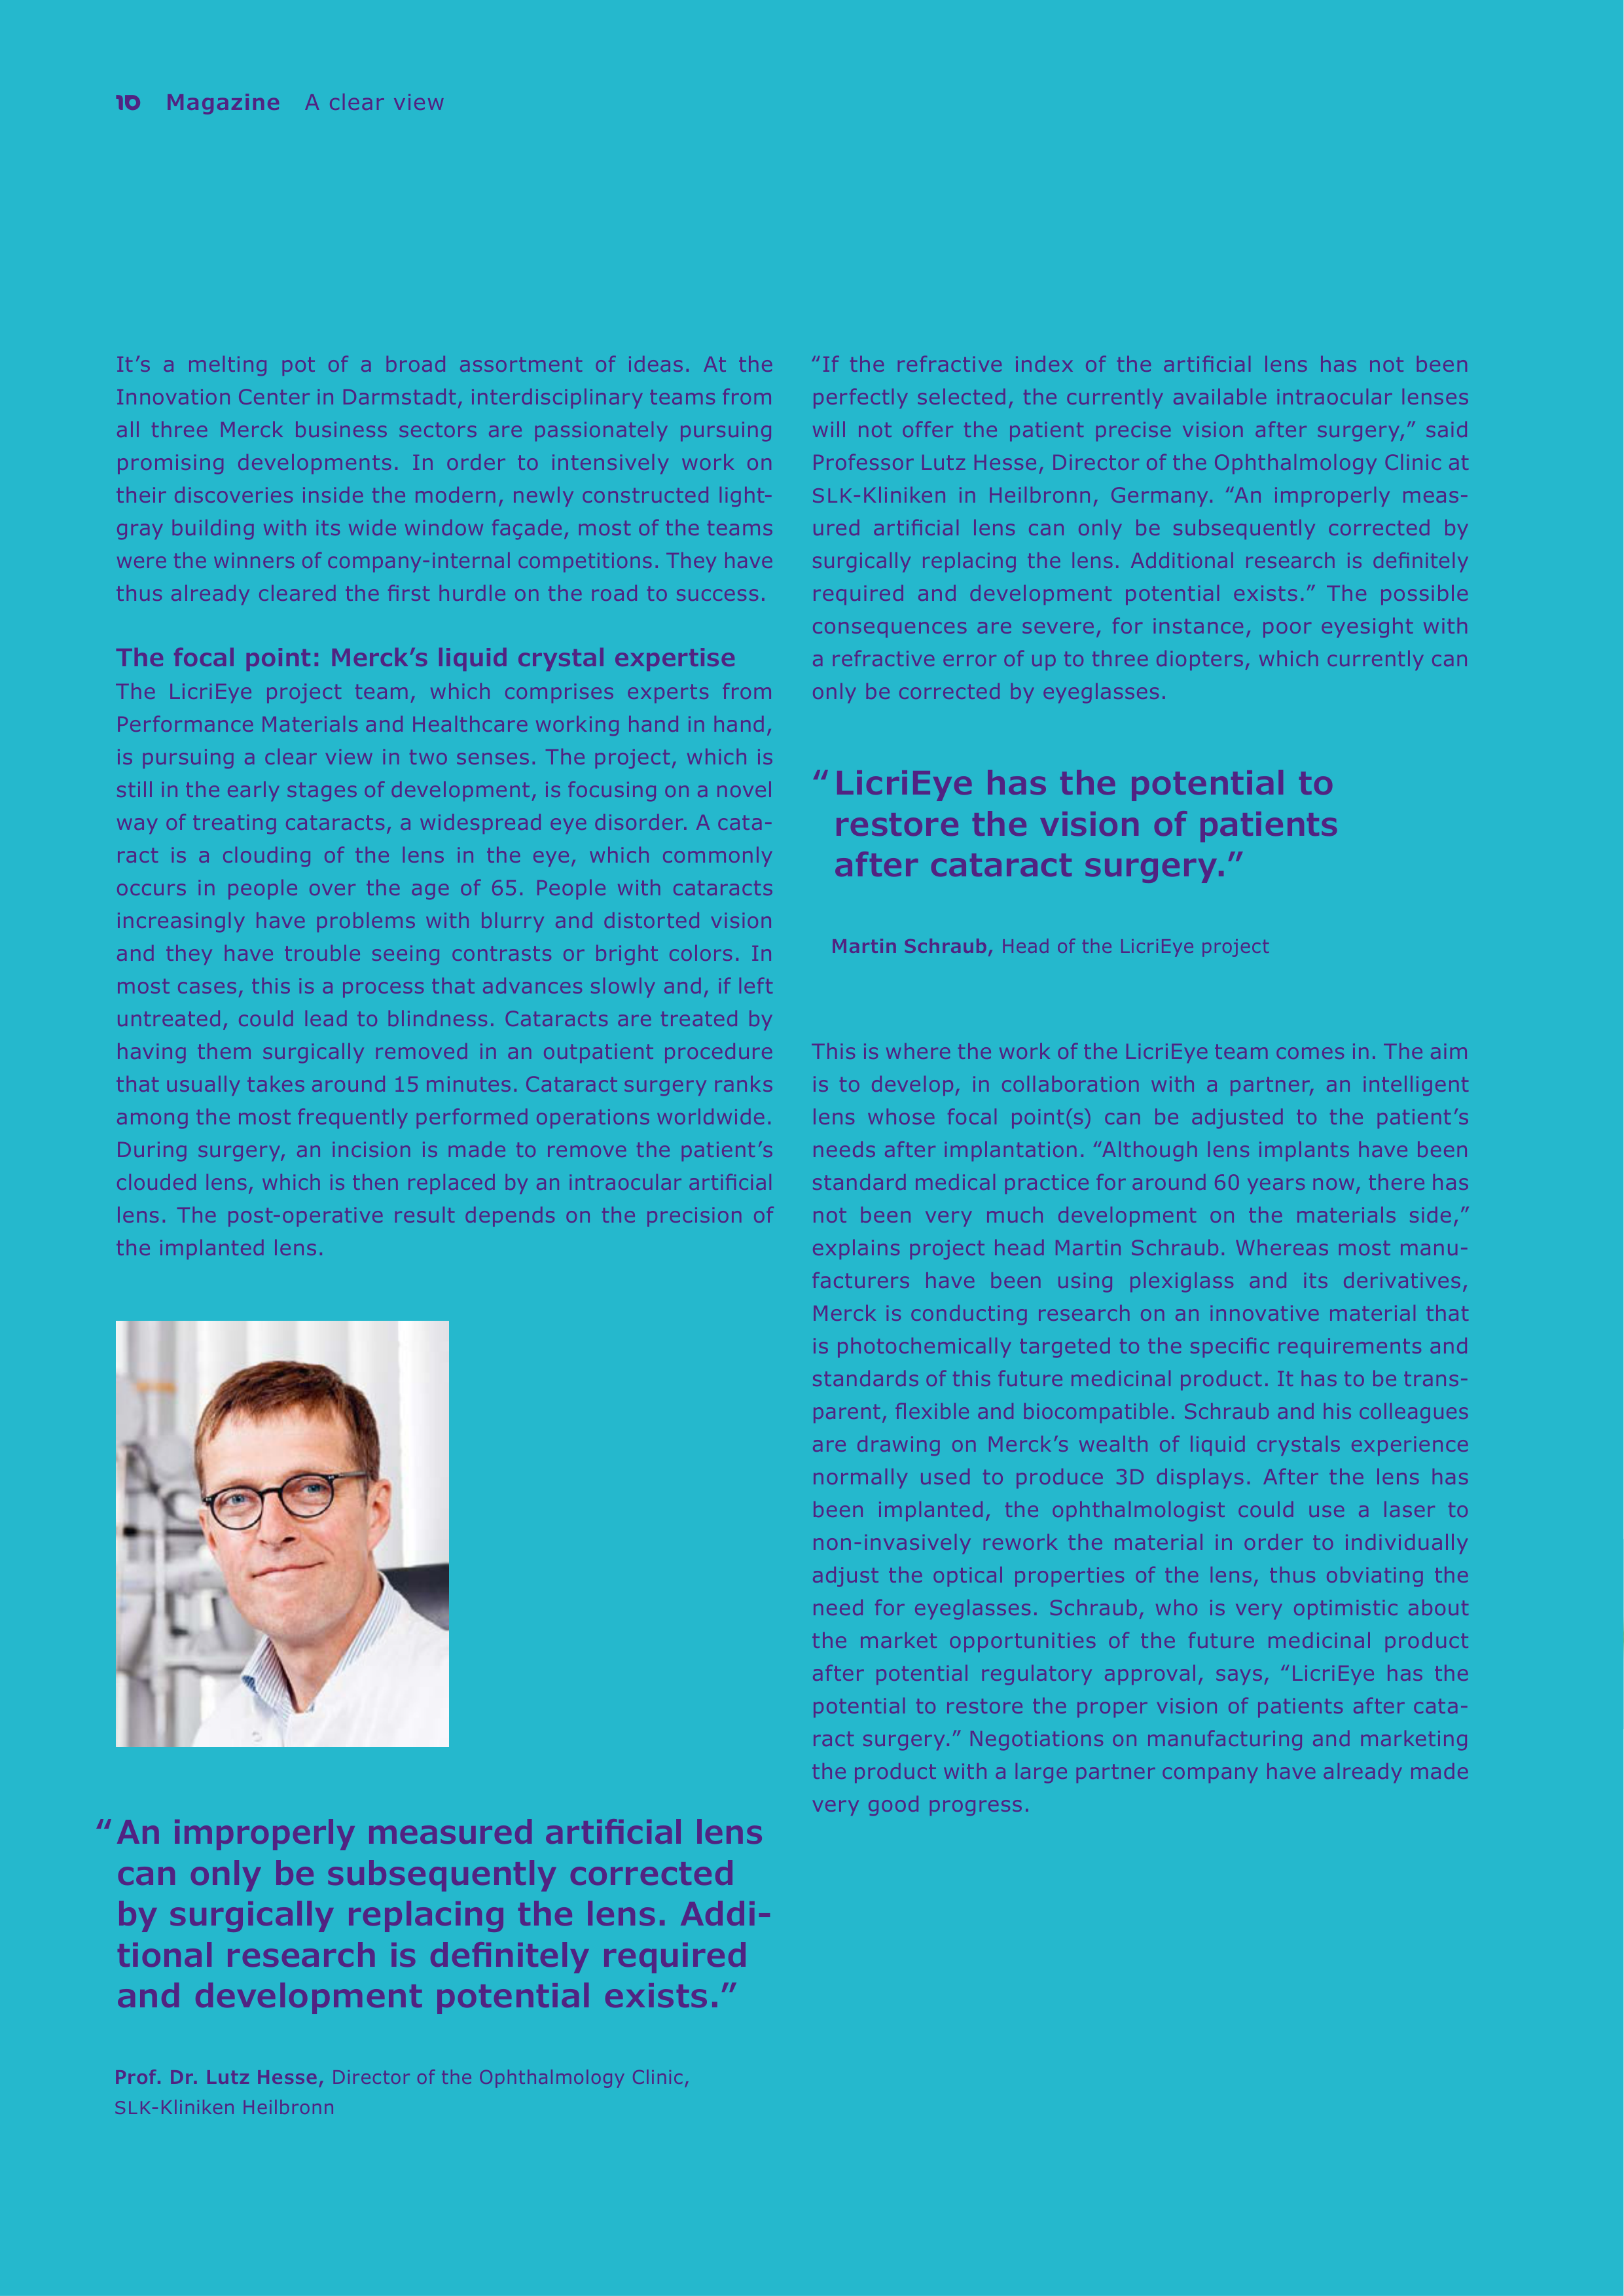
Prof. Dr. Lutz Hesse,
Director of the Ophthalmology Clinic,
SLK
-Kliniken Heilbronn
‟If the refractive index of the artificial lens has not been
perfectly selected, the currently available intraocular lenses
will not offer the patient precise vision after surgery,” said
Professor Lutz Hesse, Director of the Ophthalmology Clinic at
SLK
-Kliniken in Heilbronn, Germany. ‟An improperly meas-
ured artificial lens can only be subsequently corrected by
surgically replacing the lens. Additional research is definitely
required and development potential exists.” The possible
consequences are severe, for instance, poor eyesight with
a refractive error of up to three diopters, which currently can
only be corrected by eyeglasses.
This is where the work of the LicriEye team comes in. The aim
is to develop, in collaboration with a partner, an intelligent
lens whose focal point(s) can be adjusted to the patient’s
needs after implantation. ‟Although lens implants have been
standard medical practice for around 60 years now, there has
not been very much development on the materials side,”
explains project head Martin Schraub. Whereas most manu
facturers have been using plexiglass and its derivatives,
Merck is conducting research on an innovative material that
is photochemically targeted to the specific requirements and
standards of this future medicinal product. It has to be trans-
parent, flexible and biocompatible. Schraub and his colleagues
are drawing on Merck’s wealth of liquid crystals experience
normally used to produce 3D displays. After the lens has
been implanted, the ophthalmologist could use a laser to
non-invasively rework the material in order to individually
adjust the optical properties of the lens, thus obviating the
need for eyeglasses. Schraub, who is very optimistic about
the market opportunities of the future medicinal product
after potential regulatory approval, says, ‟LicriEye has the
potential to restore the proper vision of patients after cata-
ract surgery.” Negotiations on manufacturing and marketing
the product with a large partner company have already made
very good progress.
“ LicriEye has the potential to
restore the vision of patients
after cataract surgery.”
Martin Schraub,
Head of the LicriEye project
A clear view
Magazine
11
With the use of a LicriEye lens,
the possibility of the patient not
having perfect vision after sur-
gery also exists. But now the
ophthalmologist might be able
to adjust the lens using a laser
and restore the patient's proper
eyesight. The LicriEye project
team is applying Merck's exper-
tise in reactive mesogens, a sub-
stance class produced by Merck
Performance Materials and used
along with other substances in
3D displays.
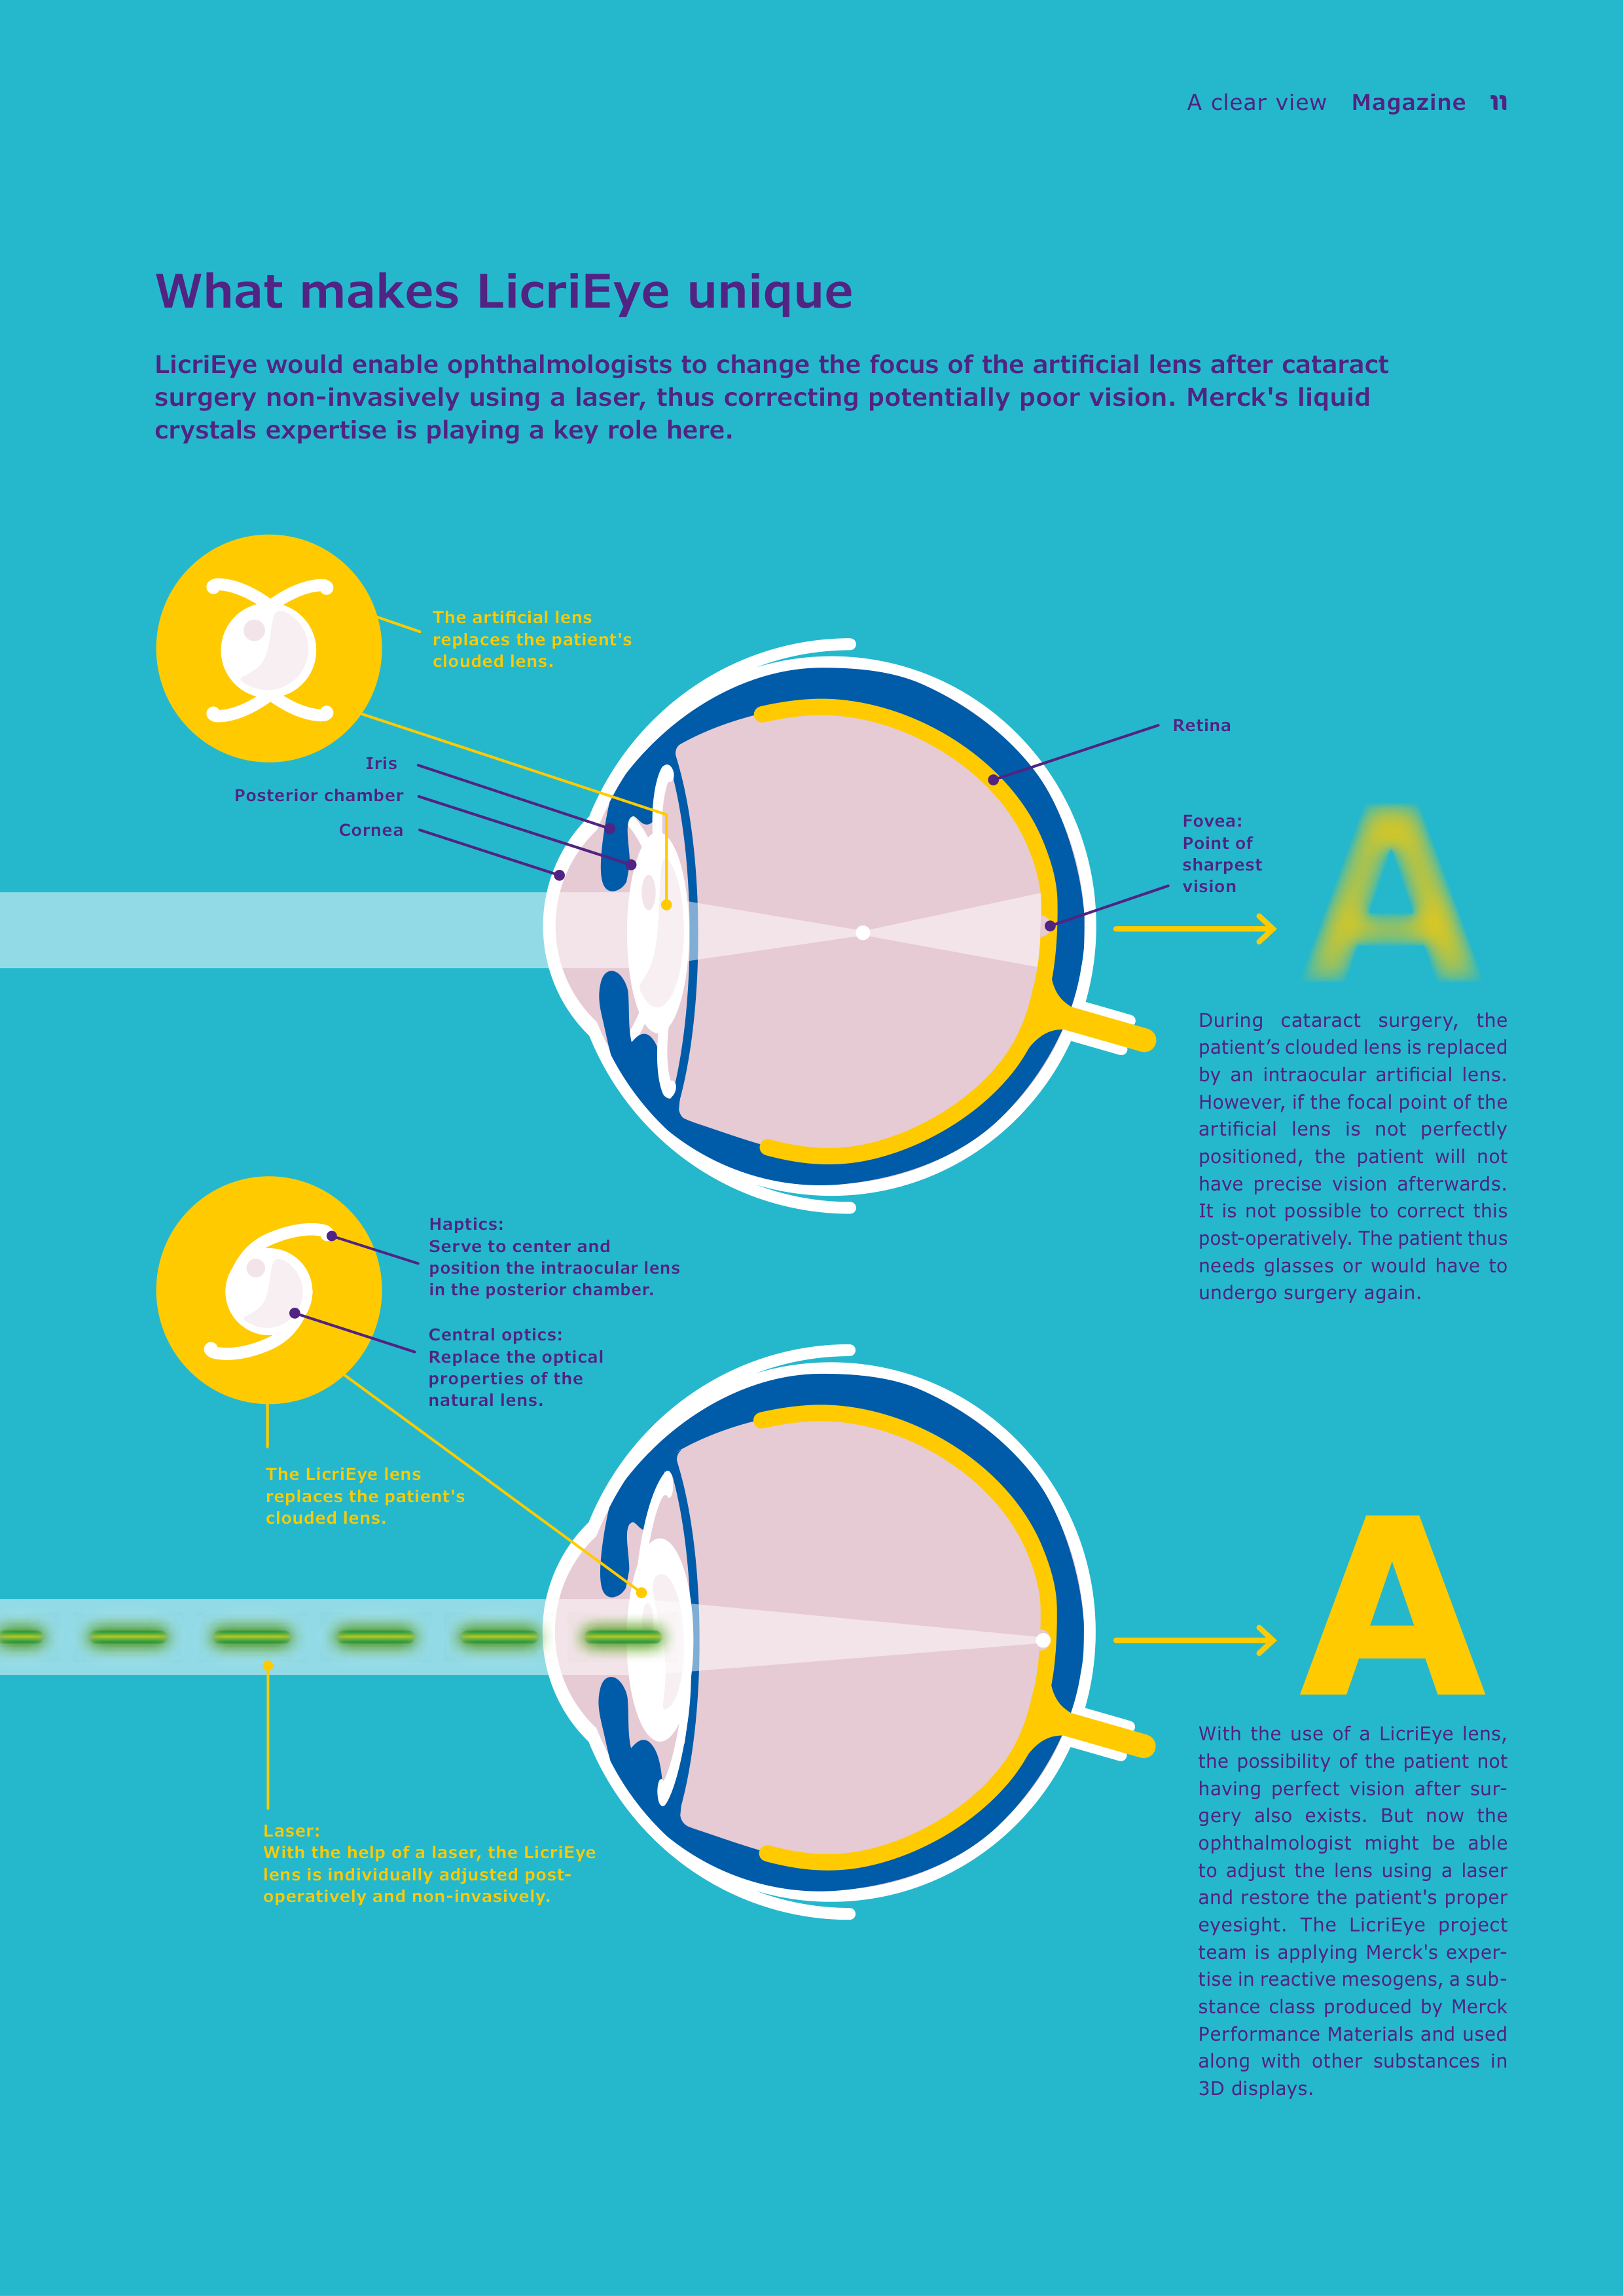
What makes LicriEye unique
LicriEye would enable ophthalmologists to change the focus of the artificial lens after cataract
surgery non-invasively using a laser, thus correcting potentially poor vision. Merck's liquid
crystals expertise is playing a key role here.
Iris
Retina
Posterior chamber
Cornea
Fovea:
Point of
sharpest
vision
During cataract surgery, the
patient’s clouded lens is replaced
by an intraocular artificial lens.
However, if the focal point of the
artificial lens is not perfectly
positioned, the patient will not
have precise vision afterwards.
It is not possible to correct this
post-operatively. The patient thus
needs glasses or would have to
undergo surgery again.
The LicriEye lens
replaces the patient's
clouded lens.
Haptics:
Serve to center and
position the intraocular lens
in the posterior chamber.
Central optics:
Replace the optical
properties of the
natural lens.
Laser:
With the help of a laser, the LicriEye
lens is individually adjusted post-
operatively and non-invasively.
The artificial lens
replaces the patient's
clouded lens.


12
Magazine
A clear view
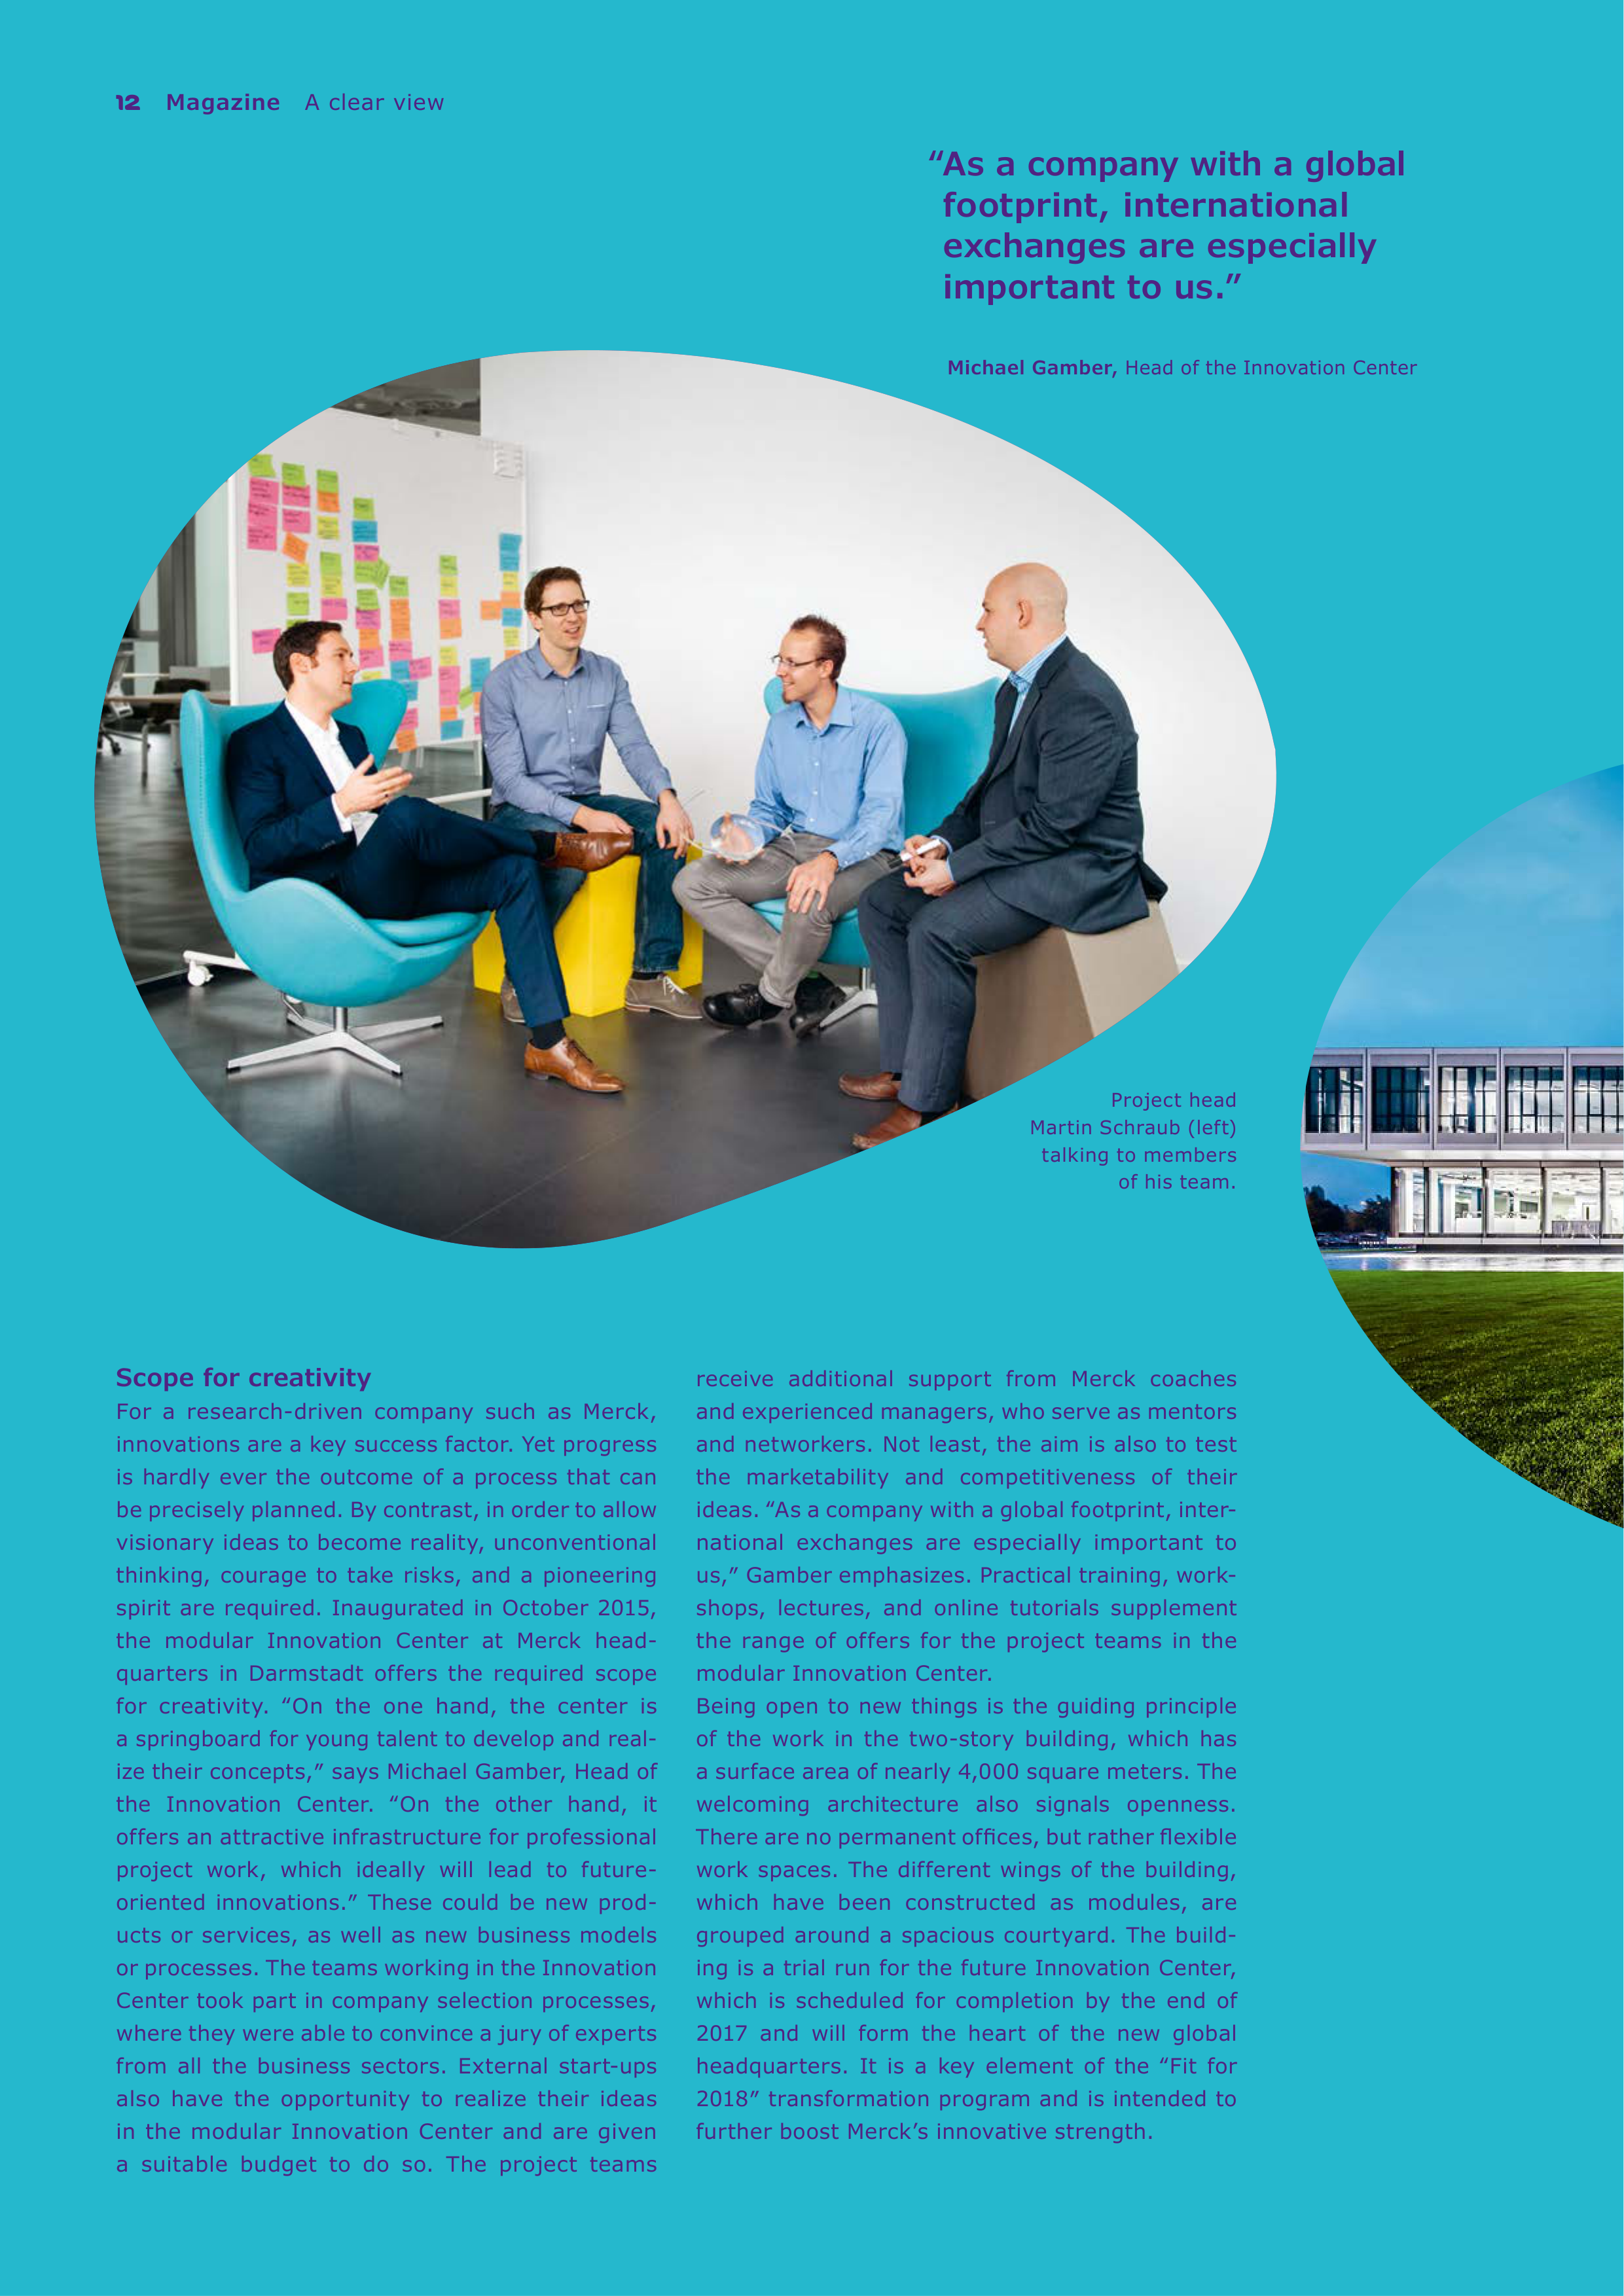
Project head
Martin Schraub (left)
talking to members
of his team.
Scope for creativity
For a research-driven company such as Merck,
innovations are a key success factor. Yet progress
is hardly ever the outcome of a process that can
be precisely planned. By contrast, in order to allow
visionary ideas to become reality, unconventional
thinking, courage to take risks, and a pioneering
spirit are required. Inaugurated in October 2015,
the modular Innovation Center at Merck head-
quarters in Darmstadt offers the required scope
for creativity. ‟On the one hand, the center is
a springboard for young talent to develop and real-
ize
their concepts,″ says Michael Gamber, Head of
the Innovation Center. ‟On the other hand, it
offers an attractive infrastructure for professional
project work, which ideally will lead to future-
oriented innovations.″ These could be new prod-
ucts or services, as well as new business models
or processes. The teams working in the Innovation
Center took part in company selection processes,
where they were able to convince a jury of experts
from all the business sectors. External start-ups
also have the opportunity to realize their ideas
in the modular Innovation Center and are given
a suitable budget to do so. The project teams
receive additional support from Merck coaches
and experienced managers, who serve as mentors
and networkers. Not least, the aim is also to test
the marketability and competitiveness of their
ideas. ‟As a company with a global footprint, inter-
national exchanges are especially important to
us,″ Gamber emphasizes. Practical training, work-
shops, lectures, and online tutorials supplement
the range of offers for the project teams in the
modular Innovation Center.
Being open to new things is the guiding principle
of the work in the two-story building, which has
a surface area of nearly 4,000 square meters. The
welcoming architecture also signals openness.
There are no permanent offices, but rather flexible
work spaces. The different wings of the building,
which have been constructed as modules, are
grouped around a spacious courtyard. The build-
ing is a trial run for the future Innovation Center,
which is scheduled for completion by the end of
2017 and will form the heart of the new global
headquarters. It is a key element of the ‟Fit for
2018″ transformation program and is intended to
further boost Merck’s innovative strength.
“As a company with a global
footprint, international
exchanges are especially
important to us.”
Michael Gamber,
Head of the Innovation Center
A clear view
Magazine
13
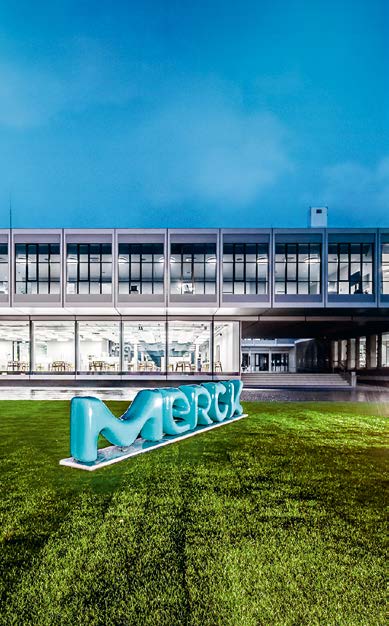
Realizing ideas:
The Innovation Center
offers young talent
scope for creativity.
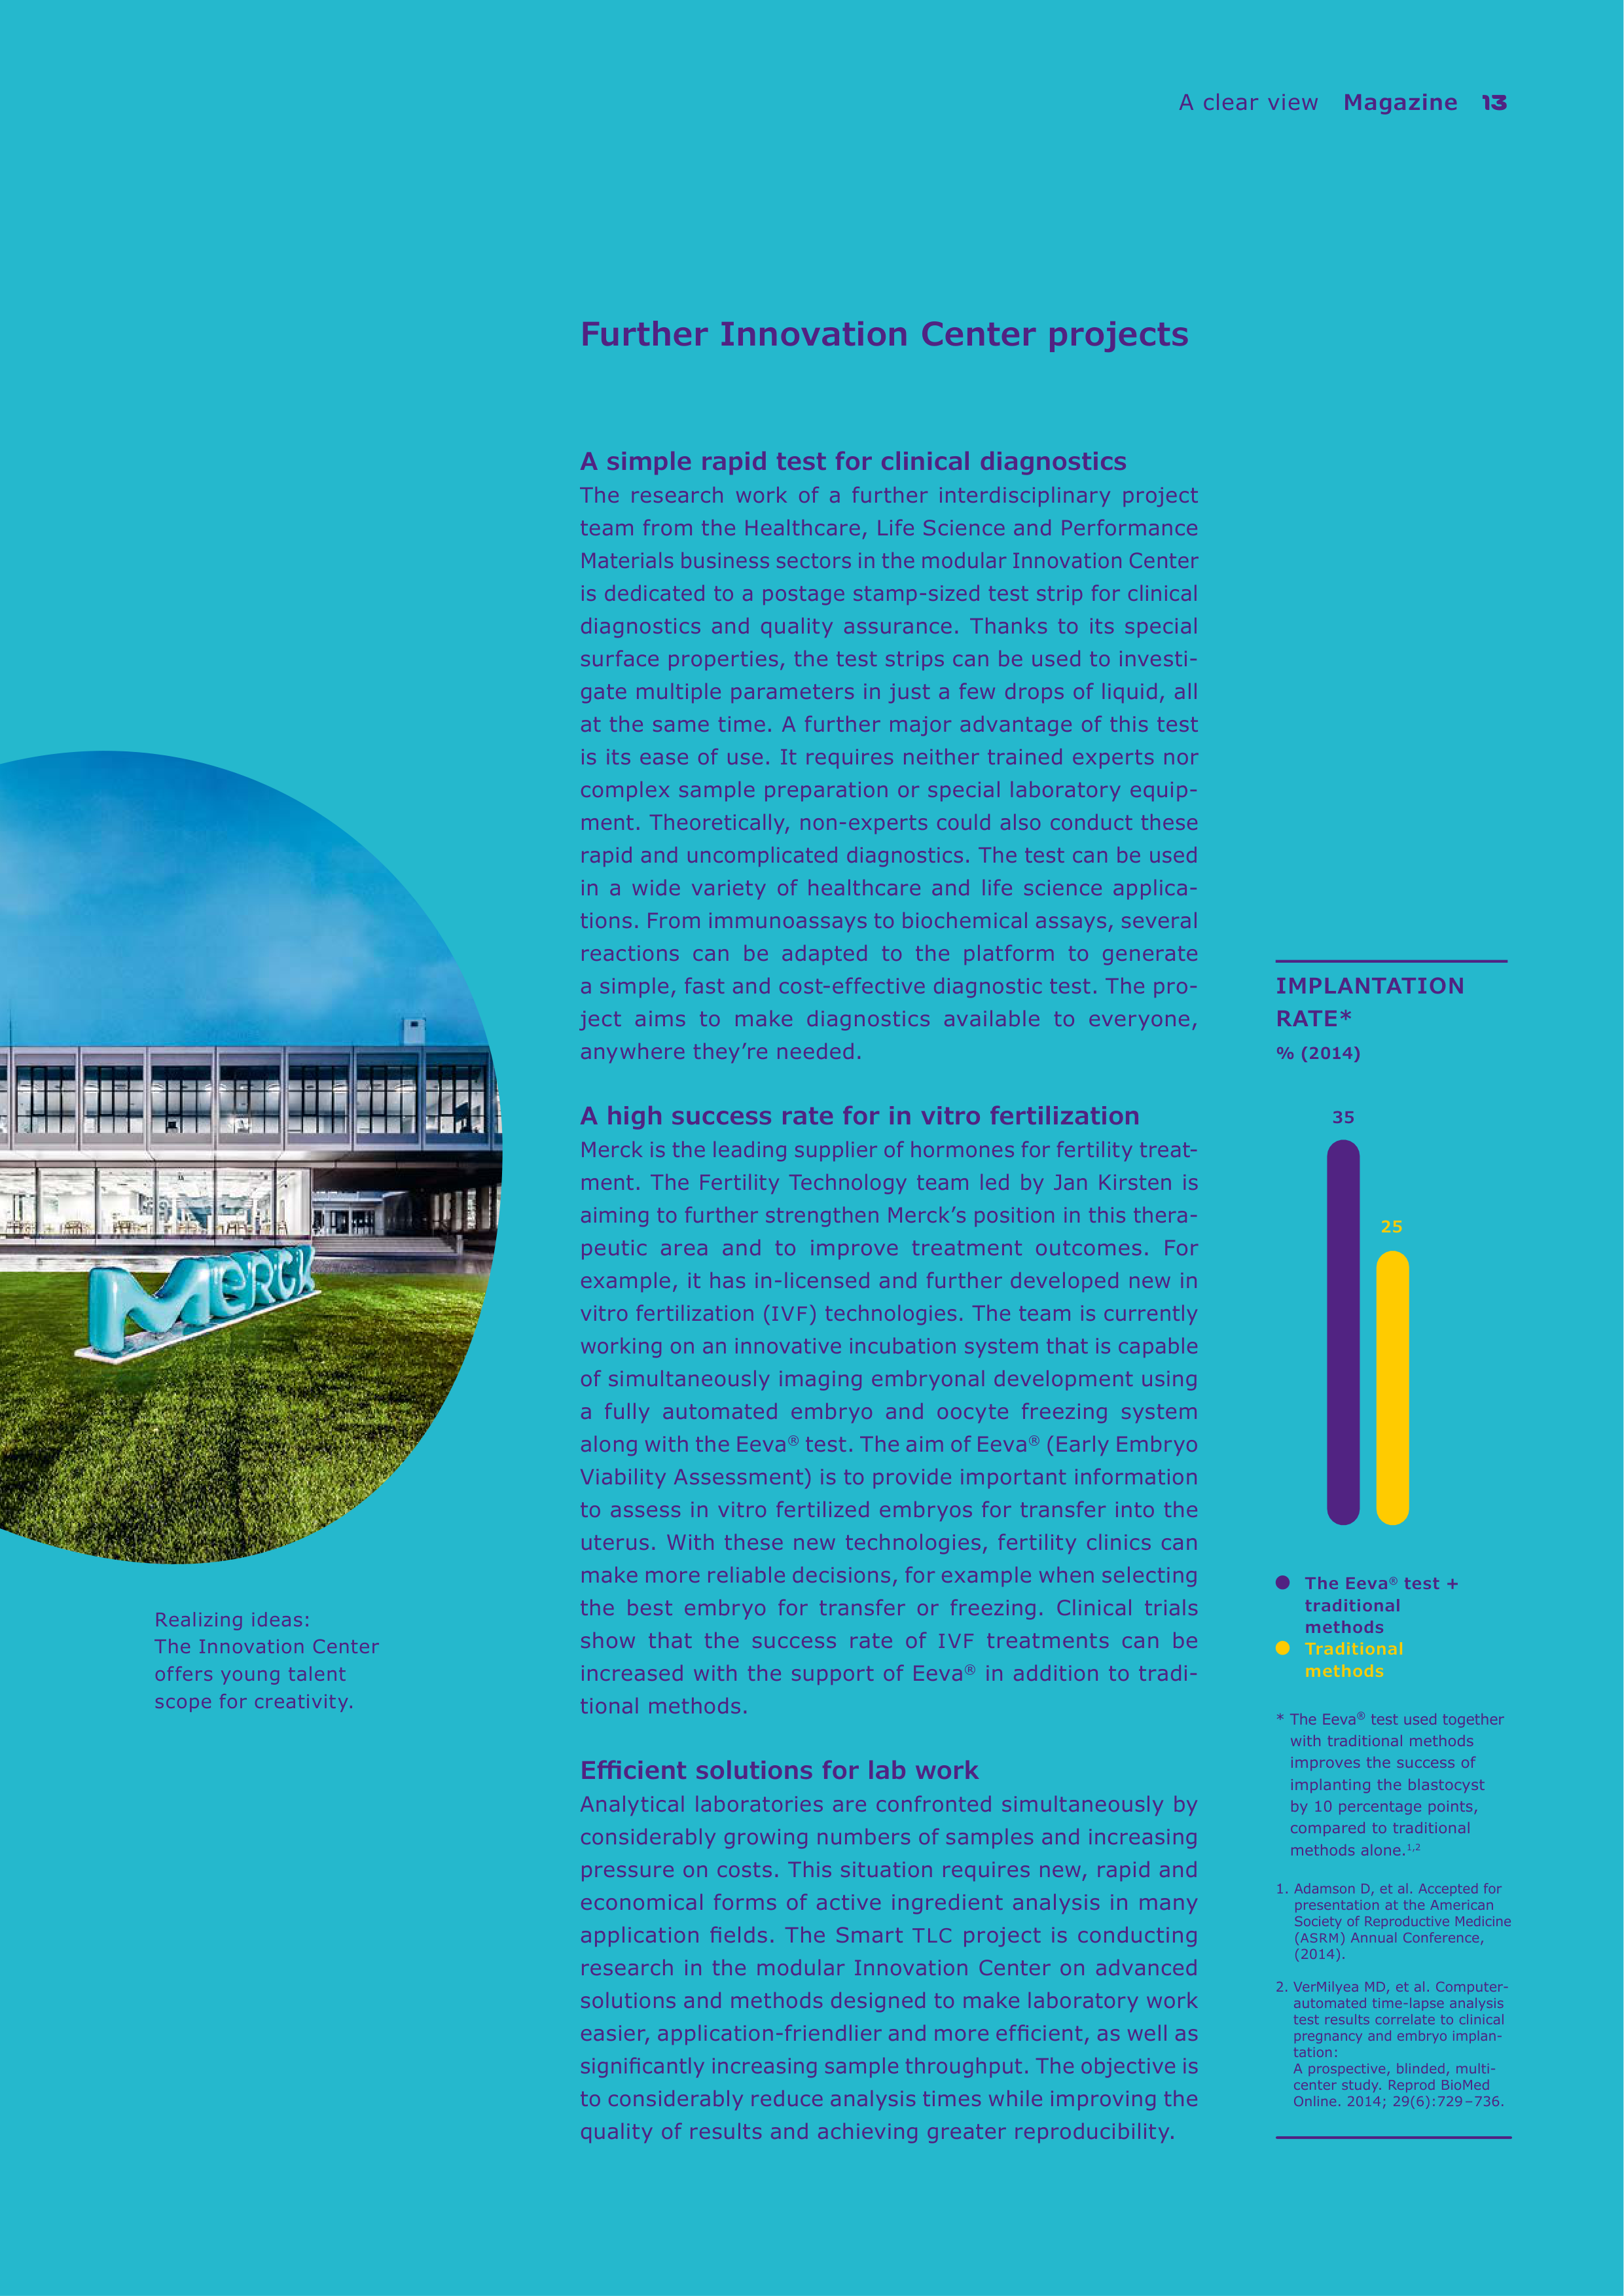
IMPLANTATION
RATE*
% (2014)
The Eeva
®
test +
traditional
methods
Traditional
methods
Further Innovation Center projects
A simple rapid test for clinical diagnostics
The research work of a further interdisciplinary project
team from the Healthcare, Life Science and Performance
Materials business sectors in the modular Innovation Center
is dedicated to a postage stamp-sized test strip for clinical
diagnostics and quality assurance. Thanks to its special
surface properties, the test strips can be used to investi-
gate multiple parameters in just a few drops of liquid, all
at the same time. A further major advantage of this test
is its ease of use. It requires neither trained experts nor
complex sample preparation or special laboratory equip-
ment. Theoretically, non-experts could also conduct these
rapid and uncomplicated diagnostics. The test can be used
in a wide variety of healthcare and life science applica-
tions. From immunoassays to biochemical assays, several
reactions can be adapted to the platform to generate
a simple, fast and cost-effective diagnostic test. The pro-
ject aims to make diagnostics available to everyone,
anywhere they’re needed.
A high success rate for in vitro fertilization
Merck is the leading supplier of hormones for fertility treat
ment. The Fertility Technology team led by Jan Kirsten is
aiming to further strengthen Merck’s position in this thera-
peutic area and to improve treatment outcomes. For
example, it has in-licensed and further developed new in
vitro fertilization (
IVF
) technologies. The team is currently
working on an innovative incubation system that is capable
of simultaneously imaging embryonal development using
a fully automated embryo and oocyte freezing system
along with the Eeva
®
test. The aim of Eeva
®
(Early Embryo
Viability Assessment) is to provide important information
to assess in vitro fertilized embryos for transfer into the
uterus. With these new technologies, fertility clinics can
make more reliable decisions, for example when selecting
the best embryo for transfer or freezing. Clinical trials
show that the success rate of
IVF
treatments can be
increased with the support of Eeva
®
in addition to tradi
tional methods.
Efficient solutions for lab work
Analytical laboratories are confronted simultaneously by
considerably growing numbers of samples and increasing
pressure on costs. This situation requires new, rapid and
economical forms of active ingredient analysis in many
application fields. The Smart
TLC
project is conducting
research in the modular Innovation Center on advanced
solutions and methods designed to make laboratory work
easier, application-friendlier and more efficient, as well as
significantly increasing sample throughput. The objective is
to considerably reduce analysis times while improving the
quality of results and achieving greater reproducibility.
*
The Eeva
®
test used together
with traditional methods
improves the success of
implanting the blastocyst
by 10 percentage points,
compared to traditional
methods alone.
1,2
1.
Adamson D, et al. Accepted for
presentation at the American
Society of Reproductive Medicine
(
ASRM
) Annual Conference,
(2014).
2.
VerMilyea MD, et al. Computer-
automated time-lapse analysis
test results correlate to clinical
pregnancy and embryo implan
tation:
A prospective, blinded, multi-
center study. Reprod BioMed
Online. 2014; 29(6):729 – 736.
35
25

14
Magazine
Ready for printing
Brilliant colors, excellent image quality, high efficiency:
OLED
displays offer captivating advantages, whether for smartphones
or large televisions. So far, producing
OLED
displays has been
complex and costly. However, innovative printing processes, which
Merck has been intensively developing for several years, are set
to open up a “shining new era” soon.
READY FOR
PRINTING
Ready for printing
Magazine
15
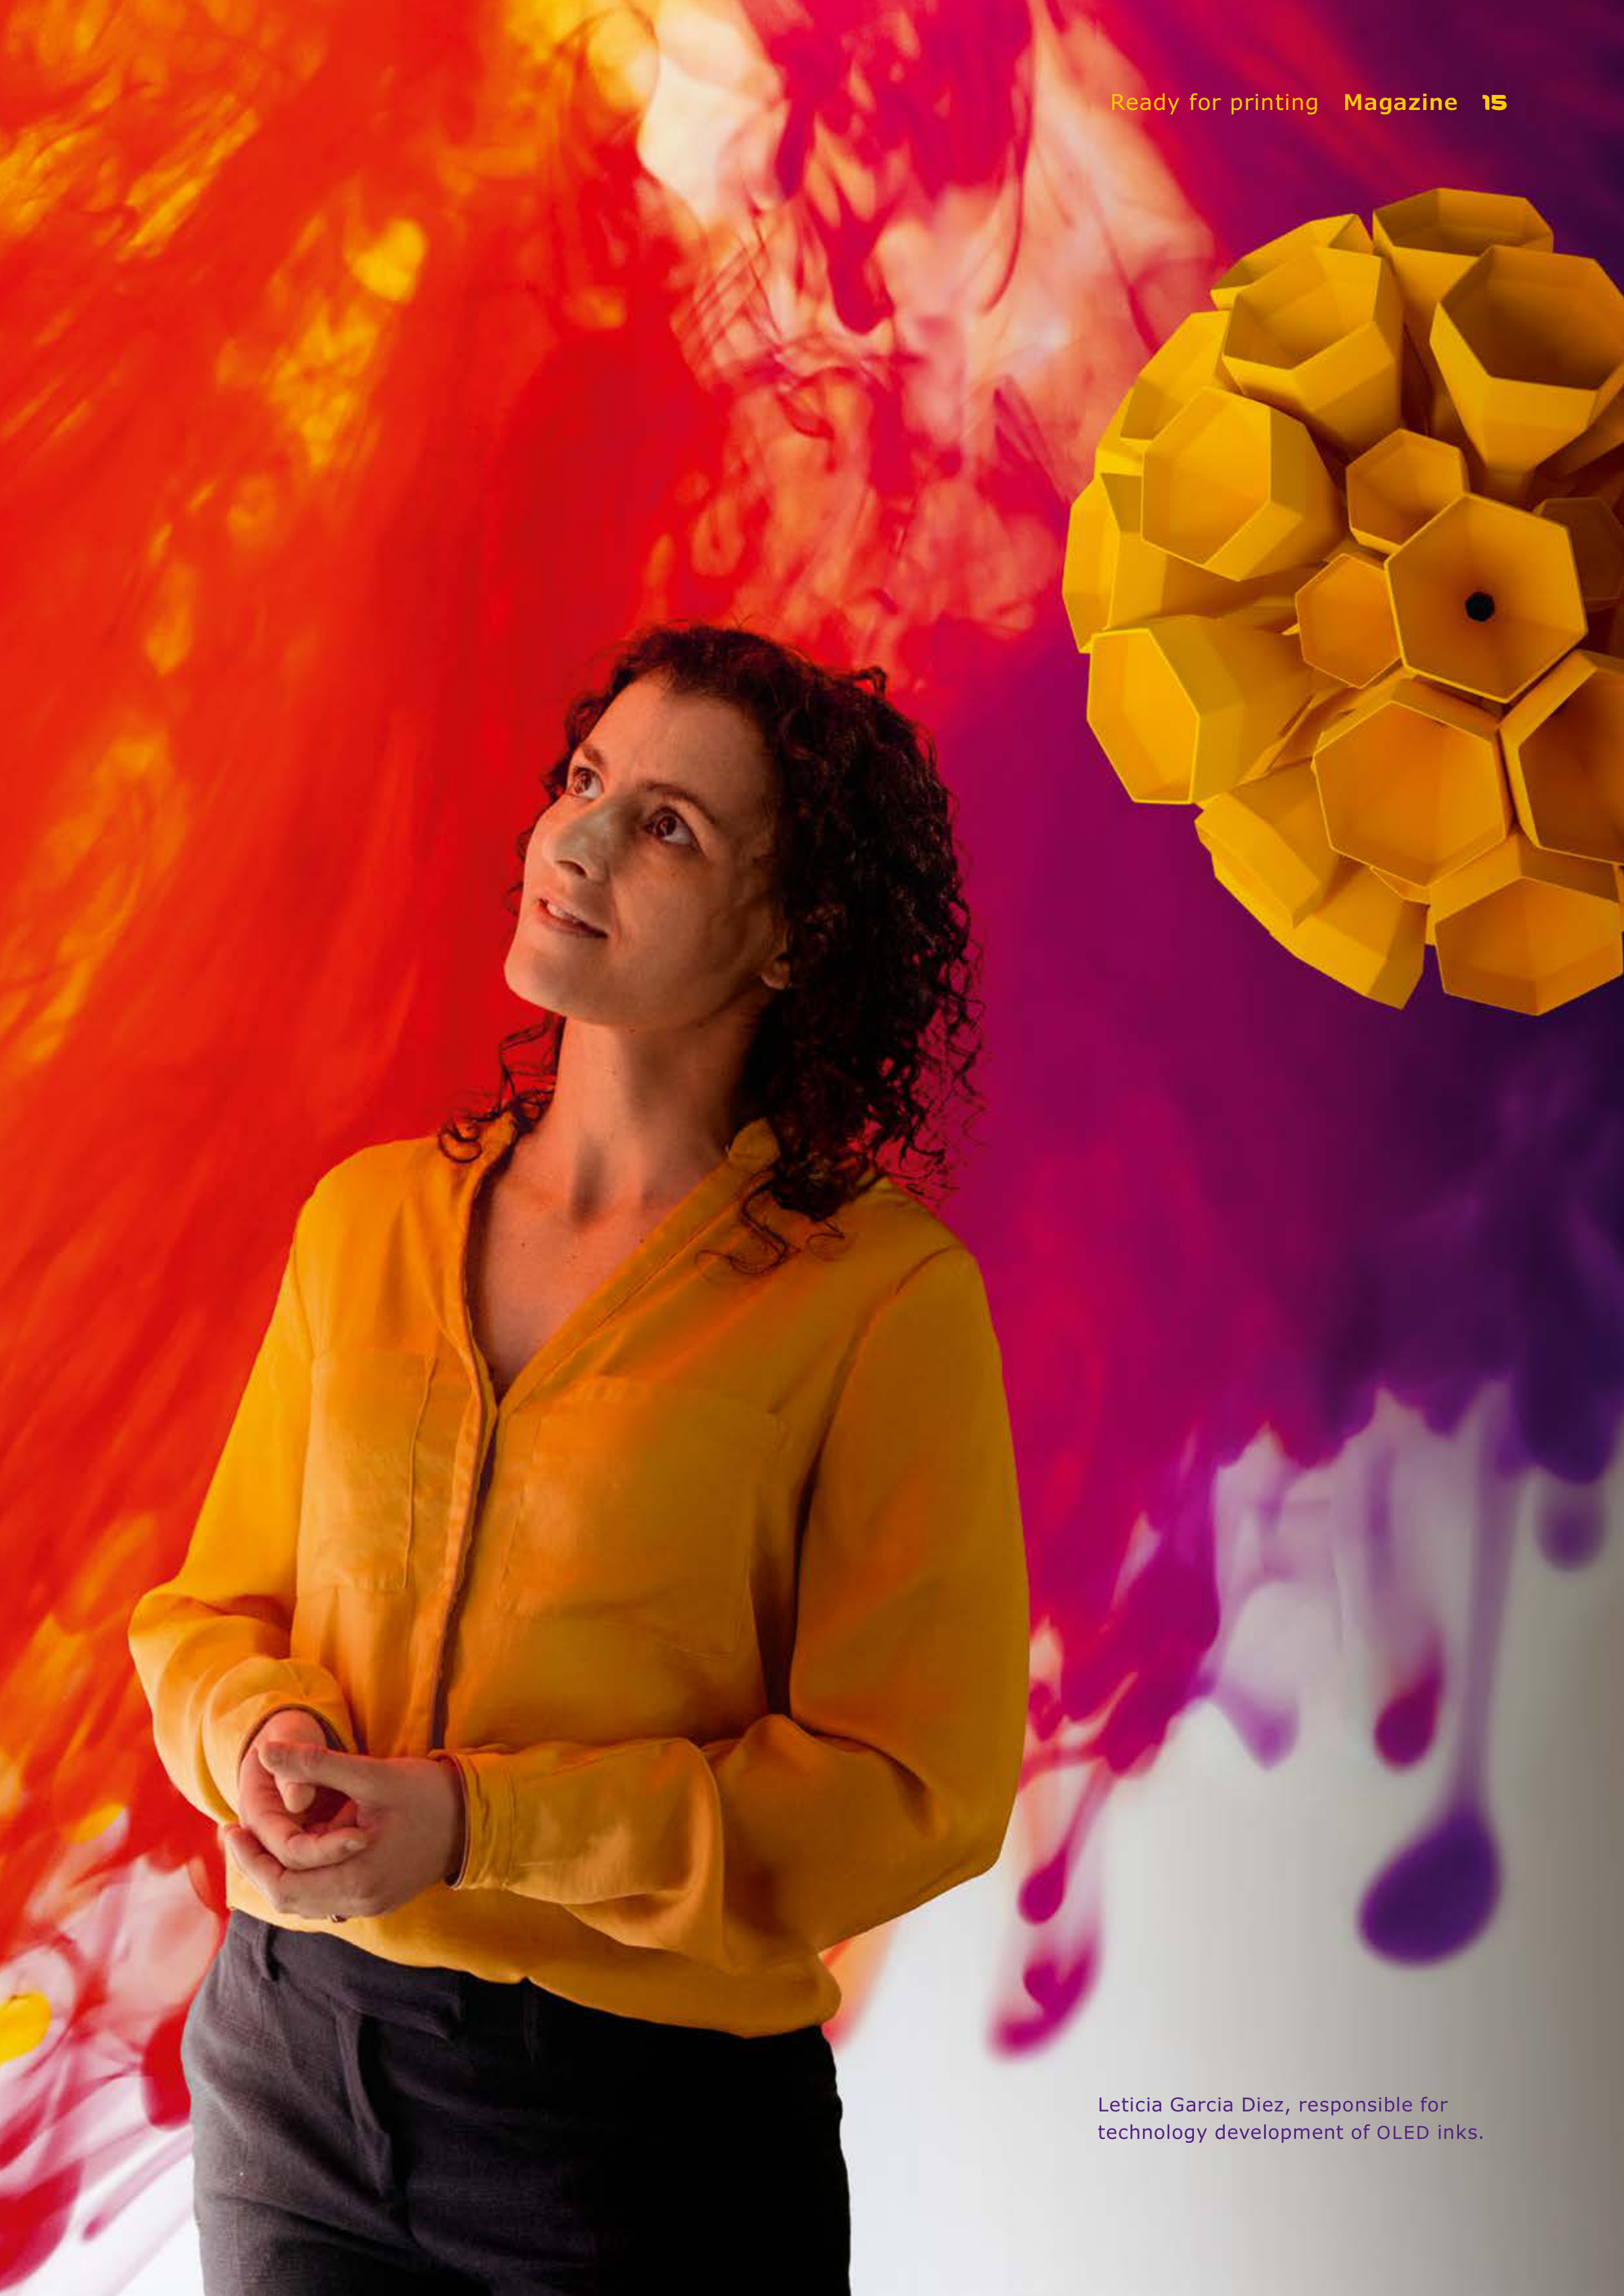
Leticia Garcia Diez, responsible for
technology development of
OLED
inks.
16
Magazine
Ready for printing
What was still the future yesterday is
now history today in the fast-paced and
highly innovative electronics industry.
But now comes the next ‟big thing″
in display technology, which experts
predict will have enormous potential.
Organic light-emitting diodes, or
OLED
s
for short, are likely to capture the mar-
kets in a wide variety of applications
soon. They are already lighting up the
displays of many mobile phones. And
they are also starting to be used in
televisions to provide a colorful and
contrast-rich viewing experience. There
are hardly any limits to the imagination
as far as the future use of
OLED
displays
in multimedia is concerned. Transparent
screens as well as houses, façades and
windows with an enchanting shine, huge
display panels and traffic control sys-
tems, as well as flexible displays that can
be bent, folded and rolled up. Designers
are already enthusiastic about the
diverse possibilities of filigree illumi-
nated tiles. And the automotive indus-
try is also showing a keen interest in
using
OLED
s, for example as rear lights.
A shining example
But what makes
OLED
s so promising
for the future? ‟A major advantage is
the fact that semiconducting organic
materials light up on their own when
an
electric voltage is applied,″ explains
Herwig Buchholz, Global Head of R&D
OLED
Chemistry & Strategic Develop-
ments at Merck. ‟In contrast to liquid
crystal displays,
OLED
s do not need
any backlighting, so the displays can be
extremely thin.″ Every single one of
the millions of pixels in a high-resolution
TV screen consists of one light-emitting
diode each in red, green and blue.
Whereas liquid crystals (LCs) act as a
switchable filter and still transmit some
light even if they are switched to dark,
OLED
s only emit colored light when
activated. From every viewing angle,
this produces extremely high-contrast,
sharp, colorful images with very fast
response times. Other advantages of
organic light-emitting diodes are their
long lifetime and high energy efficiency.
Costly vapor
So why haven't
OLED
s become the global
standard yet? On the one hand, liquid
crystals, a well-established field in which
Merck is the market and technology
leader, continue to meet increasing qual-
ity
requirements. On the other hand,
OLED
production poses a challenge as
it is still very complex and costly. For
each diode, several ultrathin layers of
material must be deposited with pin-
point precision in very small portions
onto a glass plate. The closer the diodes
are to one another, the higher the res-
olution of the display. In the currently
prevailing coating process, a metal mask
is used to evaporate and deposit the
OLED
materials. This process is repeated
several times with different materials
and masks. High costs and low material
utilization are major disadvantages of
this process. More than half of the
OLED
materials are lost during deposition.
And last but not least, the energy and
environmental footprint of this method is
rather modest. ‟For technical and finan-
cial reasons, the evaporation method
has limitations in the mass production
of large-area
OLED
displays,″ says Anja
Jatsch, Project Manager
OLED
Formula-
tion. ‟For television screens, our cus-
tomers are currently using a process
that combines white
OLED
s with color
filters. This is yielding very good results
for televisions with very large screens.”
Both mass and class
The key to future success is an innova-
tive printing technology that Merck has
been developing intensively for several
years. The pioneering achievement com-
bines the advantages of two different
classes of materials – printing solutions
of small molecules and semiconducting
polymers. Small soluble molecules sig-
nificantly increase the coating efficiency,
while the printing process makes it pos-
sible to coat large surfaces with high
homogeneity and low material consum
p-
tion. ‟The use of inkjet technology brings
the mass production of large
OLED
television screens within reach,” says
Jatsch.
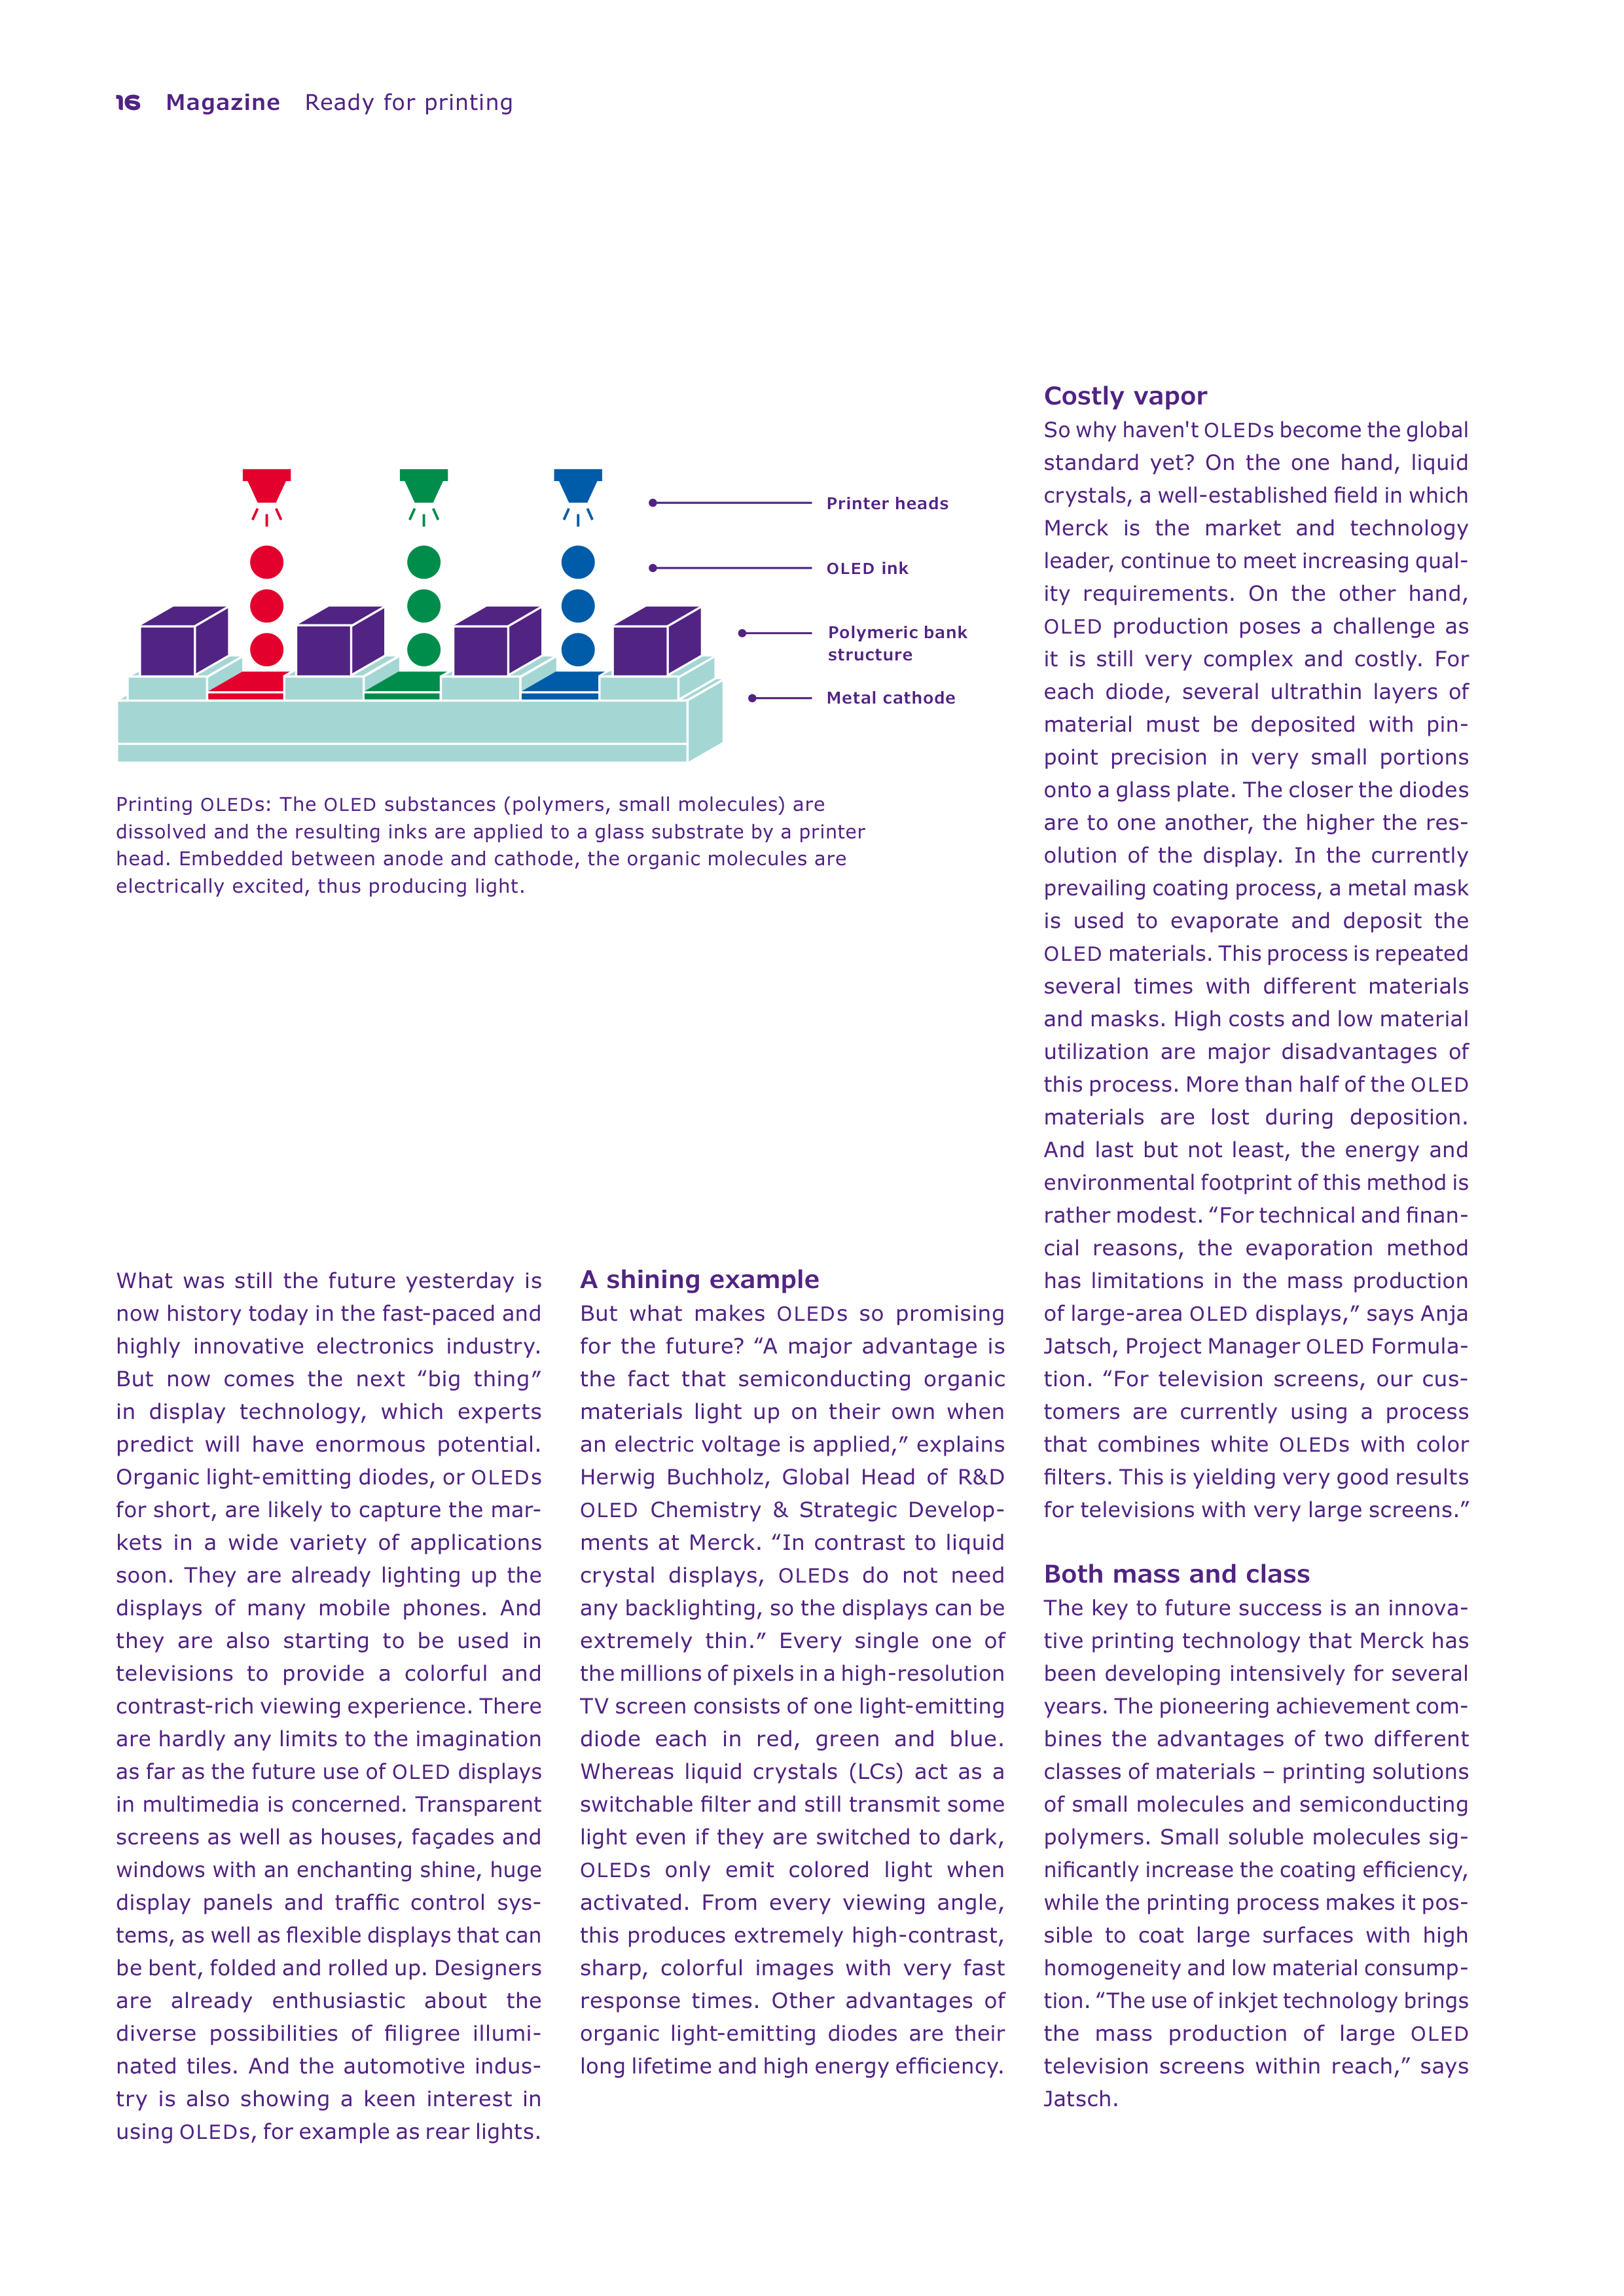
Printing
OLED
s: The
OLED
substances (polymers, small molecules) are
dissolved and the resulting inks are applied to a glass substrate by a printer
head. Embedded between anode and cathode, the organic molecules are
electrically excited, thus producing light.
Polymeric bank
structure
OLED
ink
Printer heads
Metal cathode
Ready for printing
Magazine
17
Merck
OLED
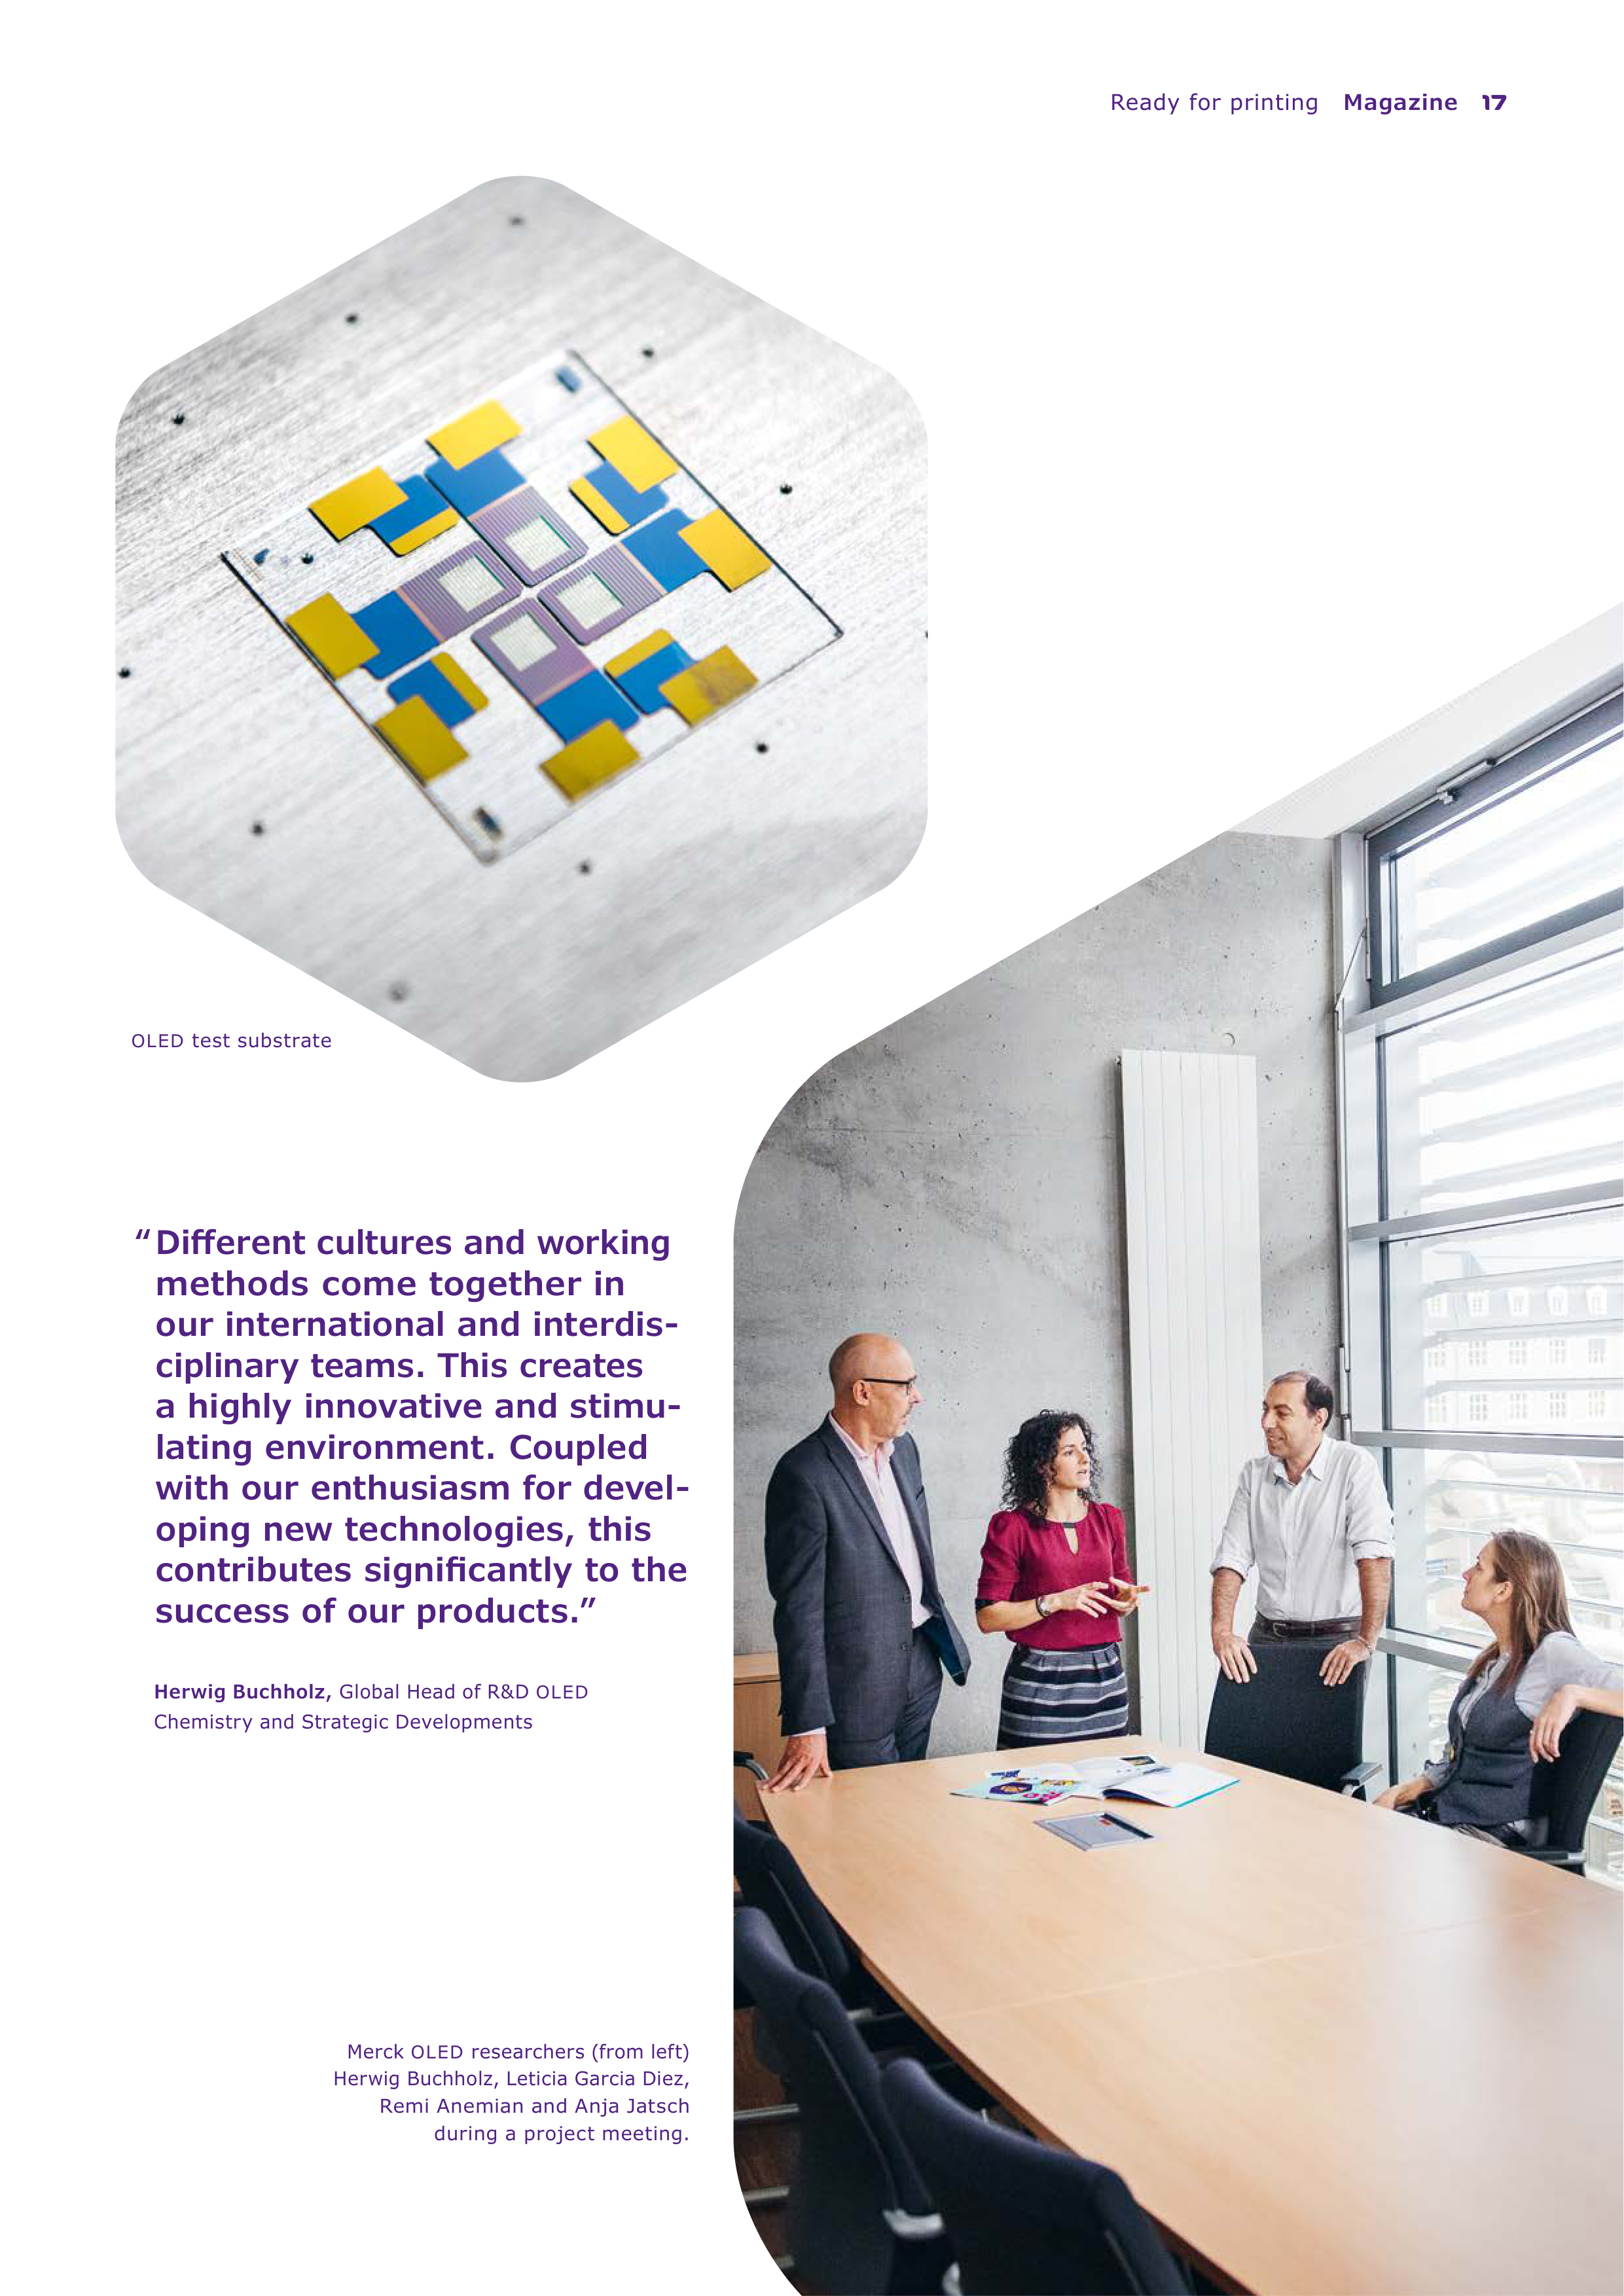
researchers (from left)
Herwig Buchholz, Leticia Garcia Diez,
Remi Anemian and Anja Jatsch
during a project meeting.
“ Different cultures and working
methods come together in
our international and interdis-
ciplinary teams. This creates
a highly innovative and stimu-
lating environment. Coupled
with our enthusiasm for devel-
oping new technologies, this
contributes significantly to the
success of our products.”
Herwig Buchholz,
Global Head of R&D
OLED
Chemistry and Strategic Developments
OLED
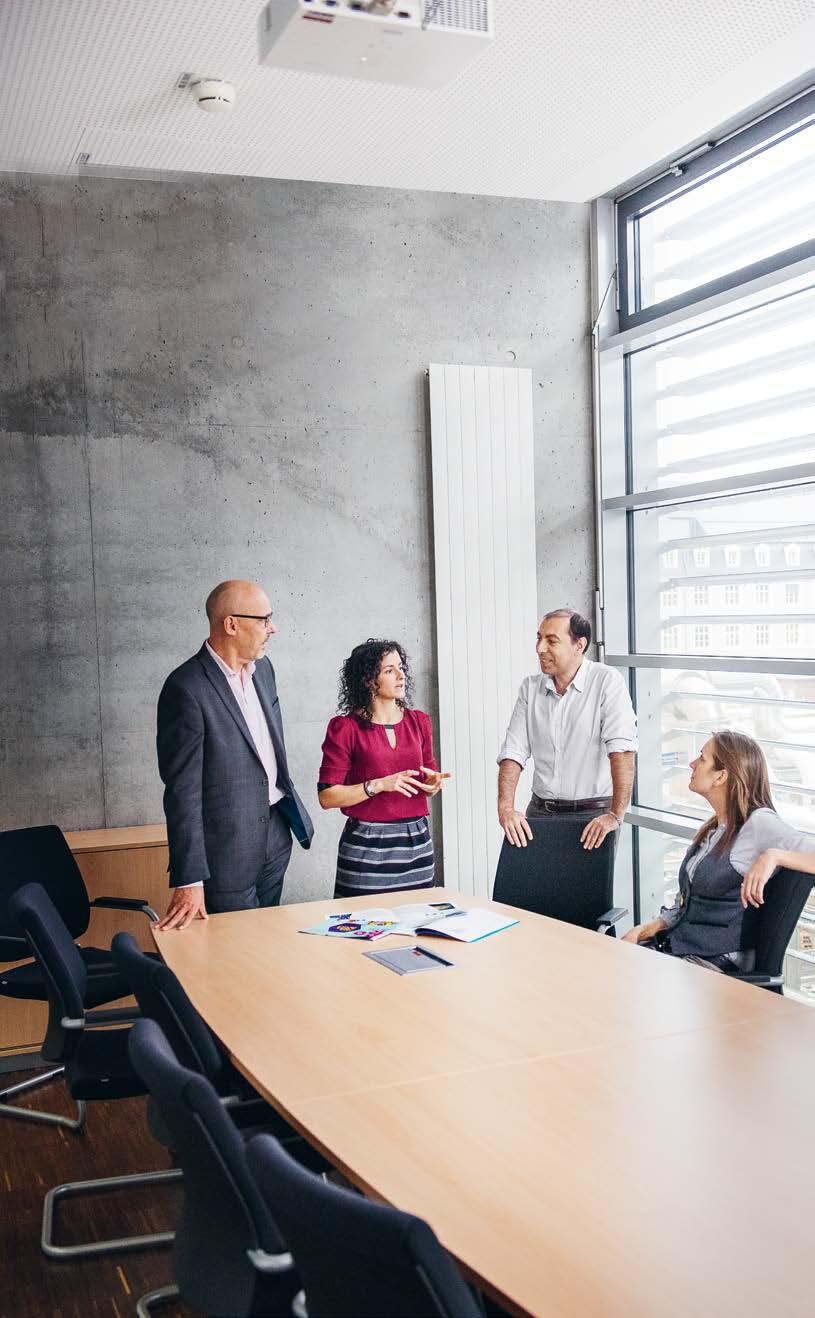
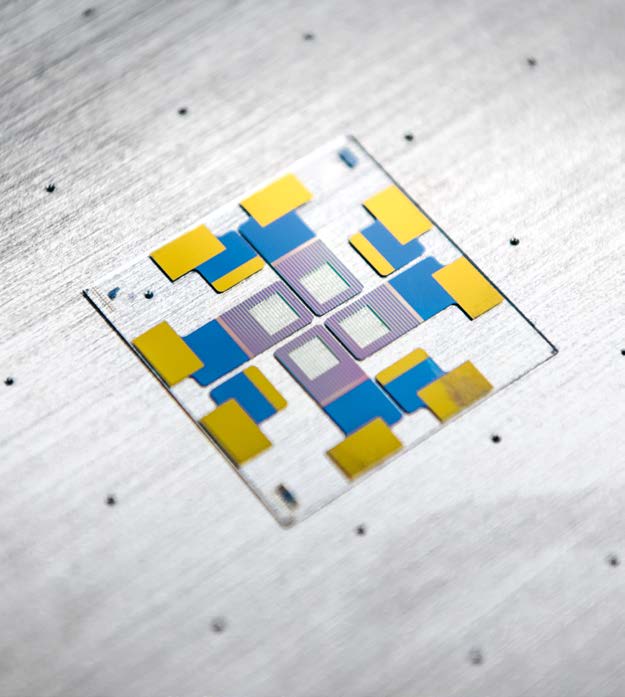
test substrate

18
Magazine
Ready for printing
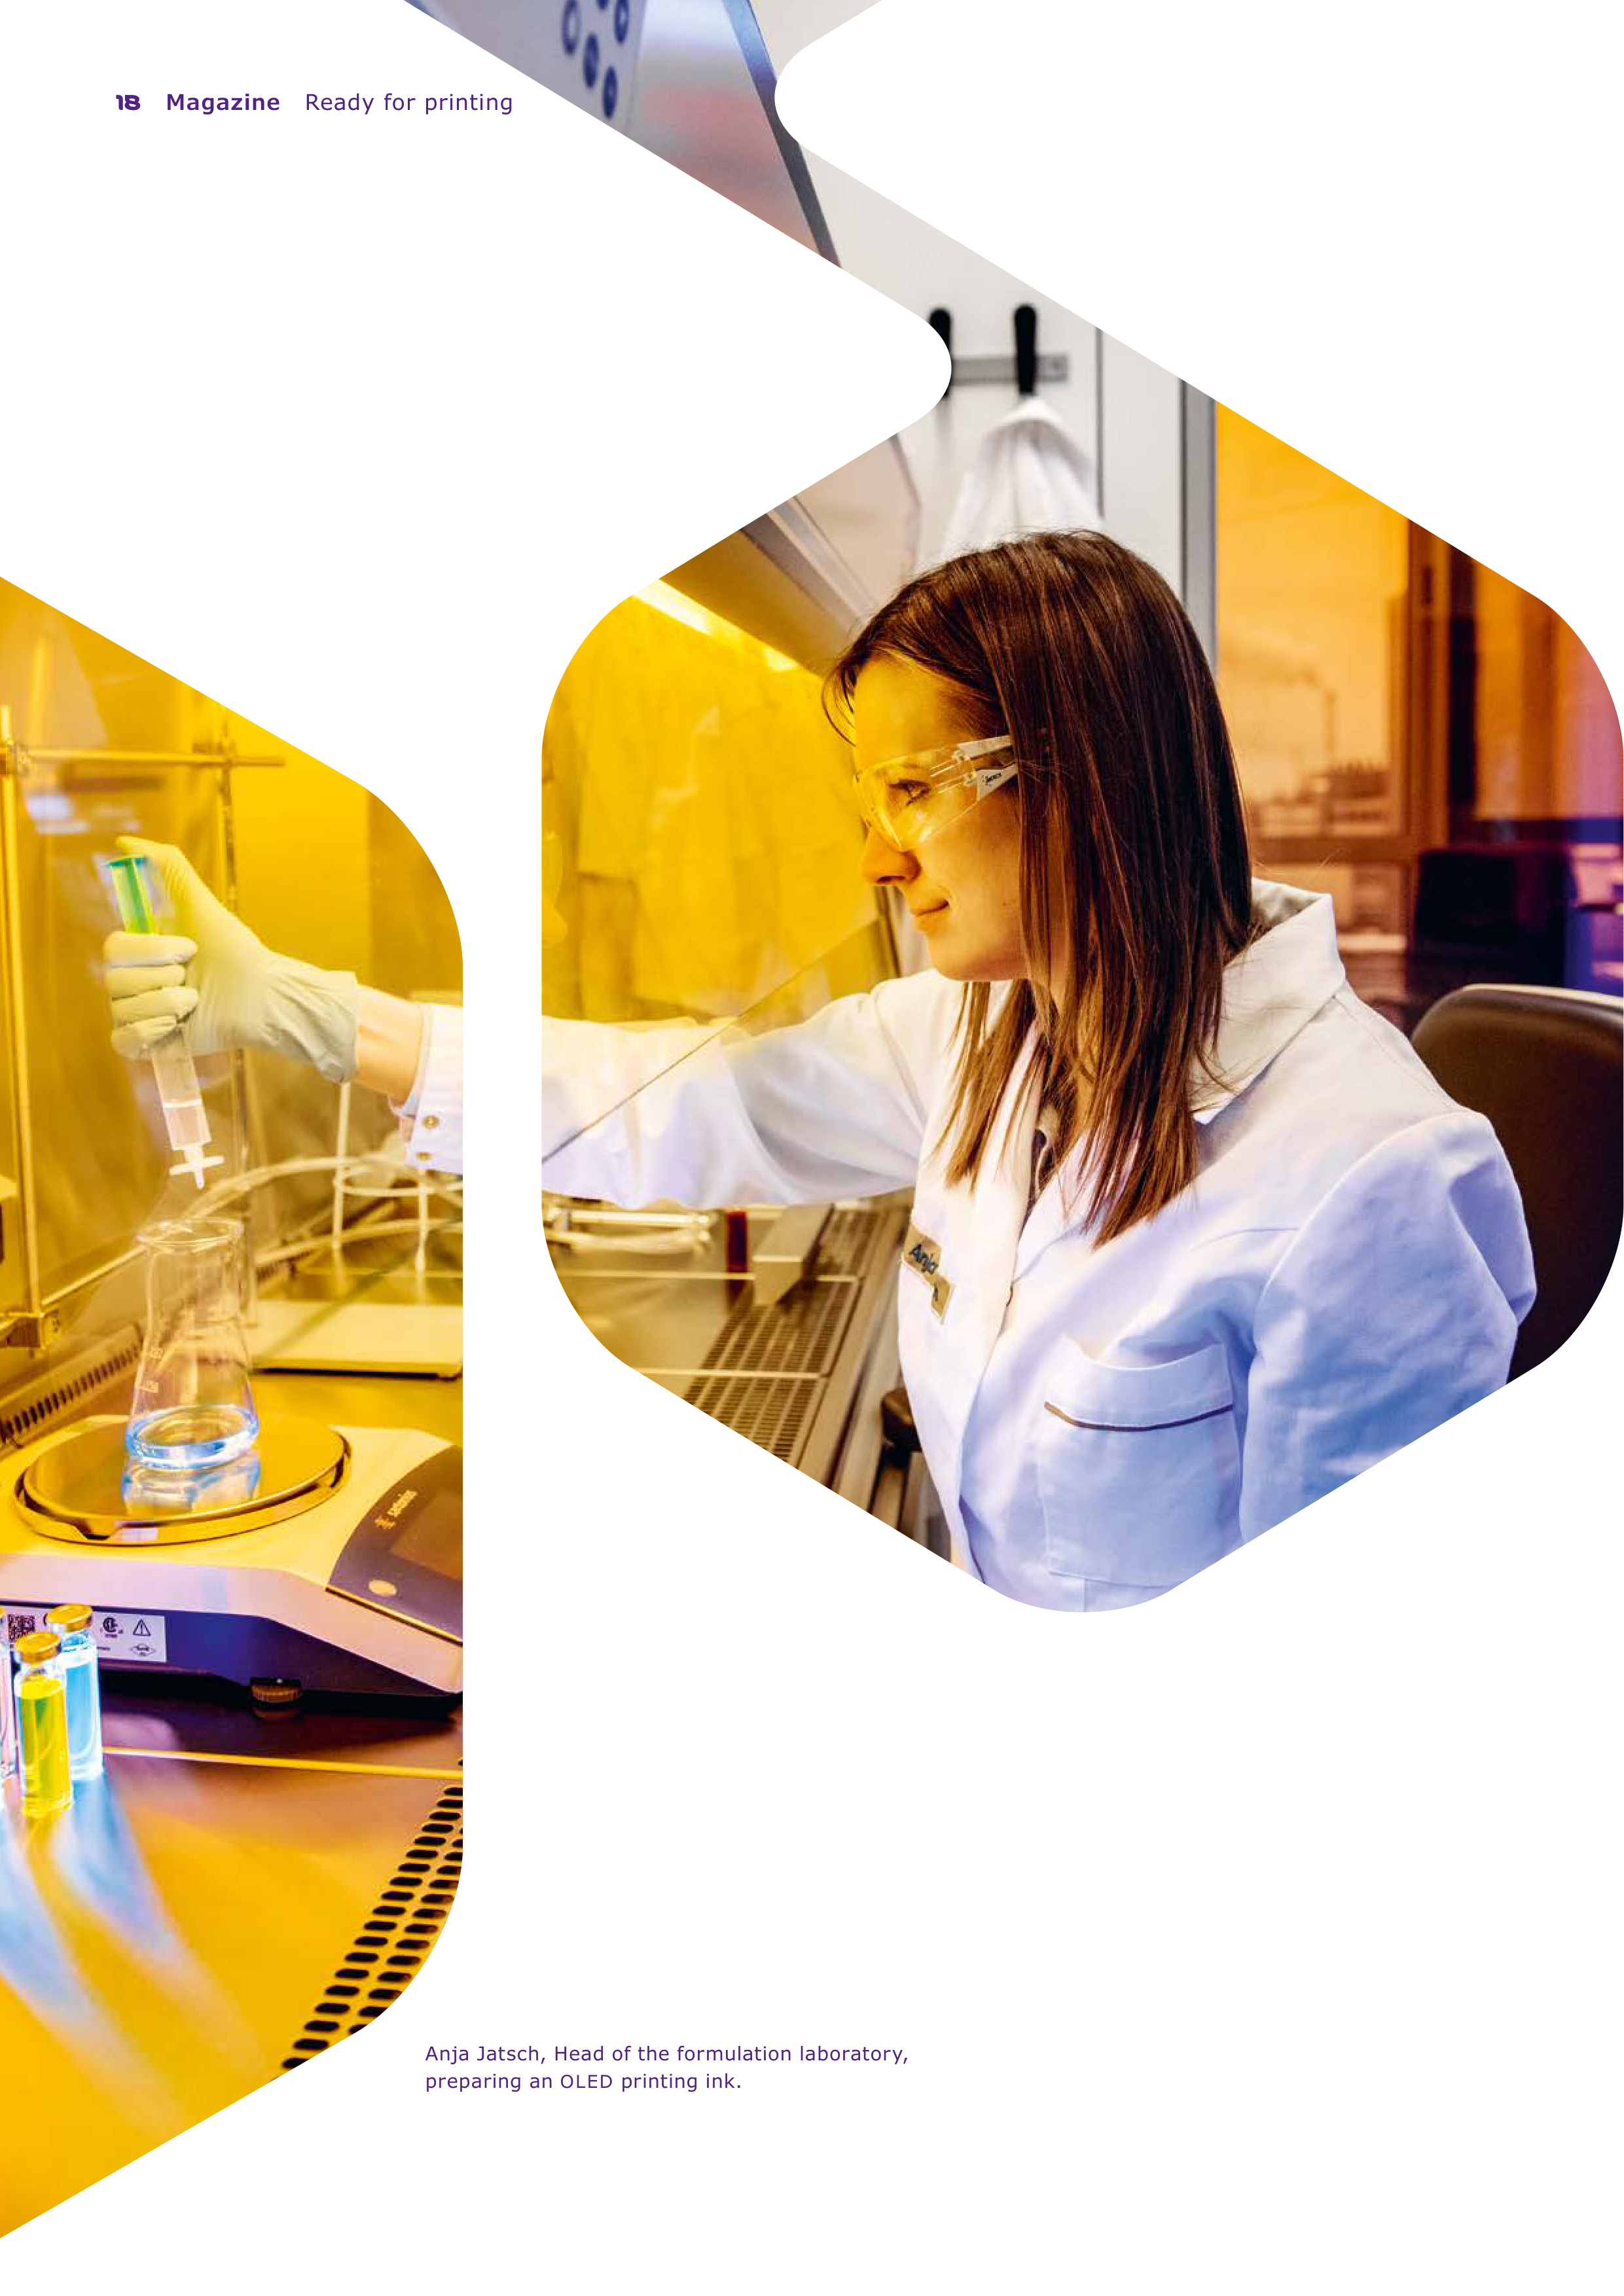
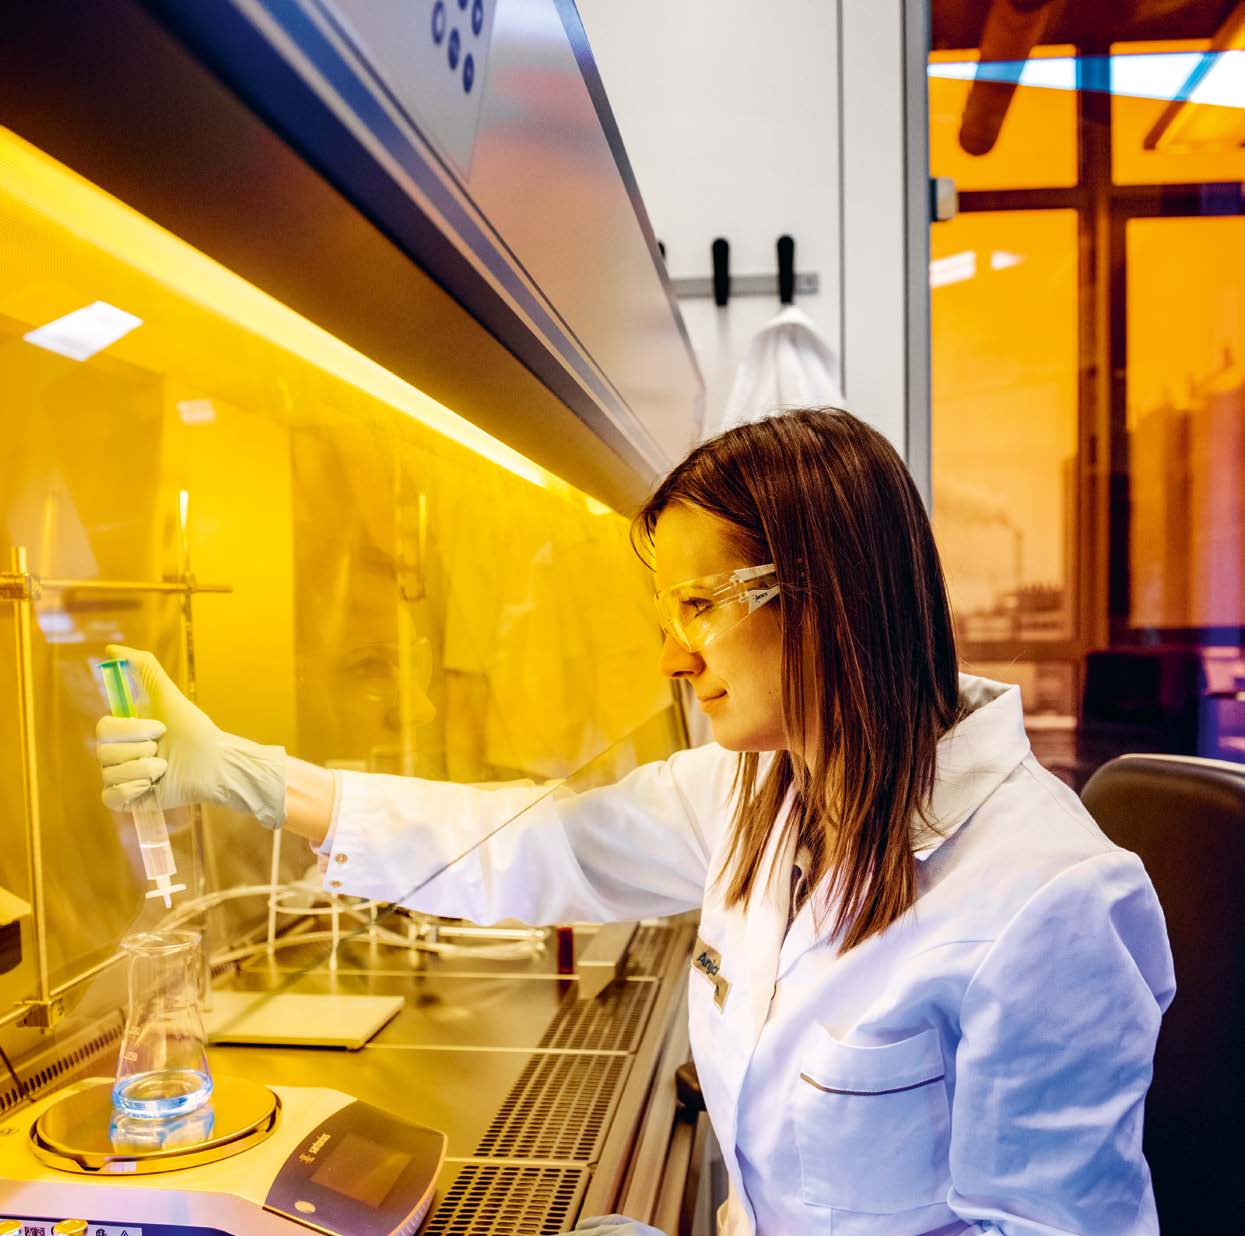
Anja Jatsch, Head of the formulation laboratory,
preparing an
OLED
printing ink.

Ready for printing
Magazine
19
“The use of inkjet technology
brings the mass production of
large
OLED
televisions within
reach.”
Anja Jatsch
, Project Manager
OLED
Formulation
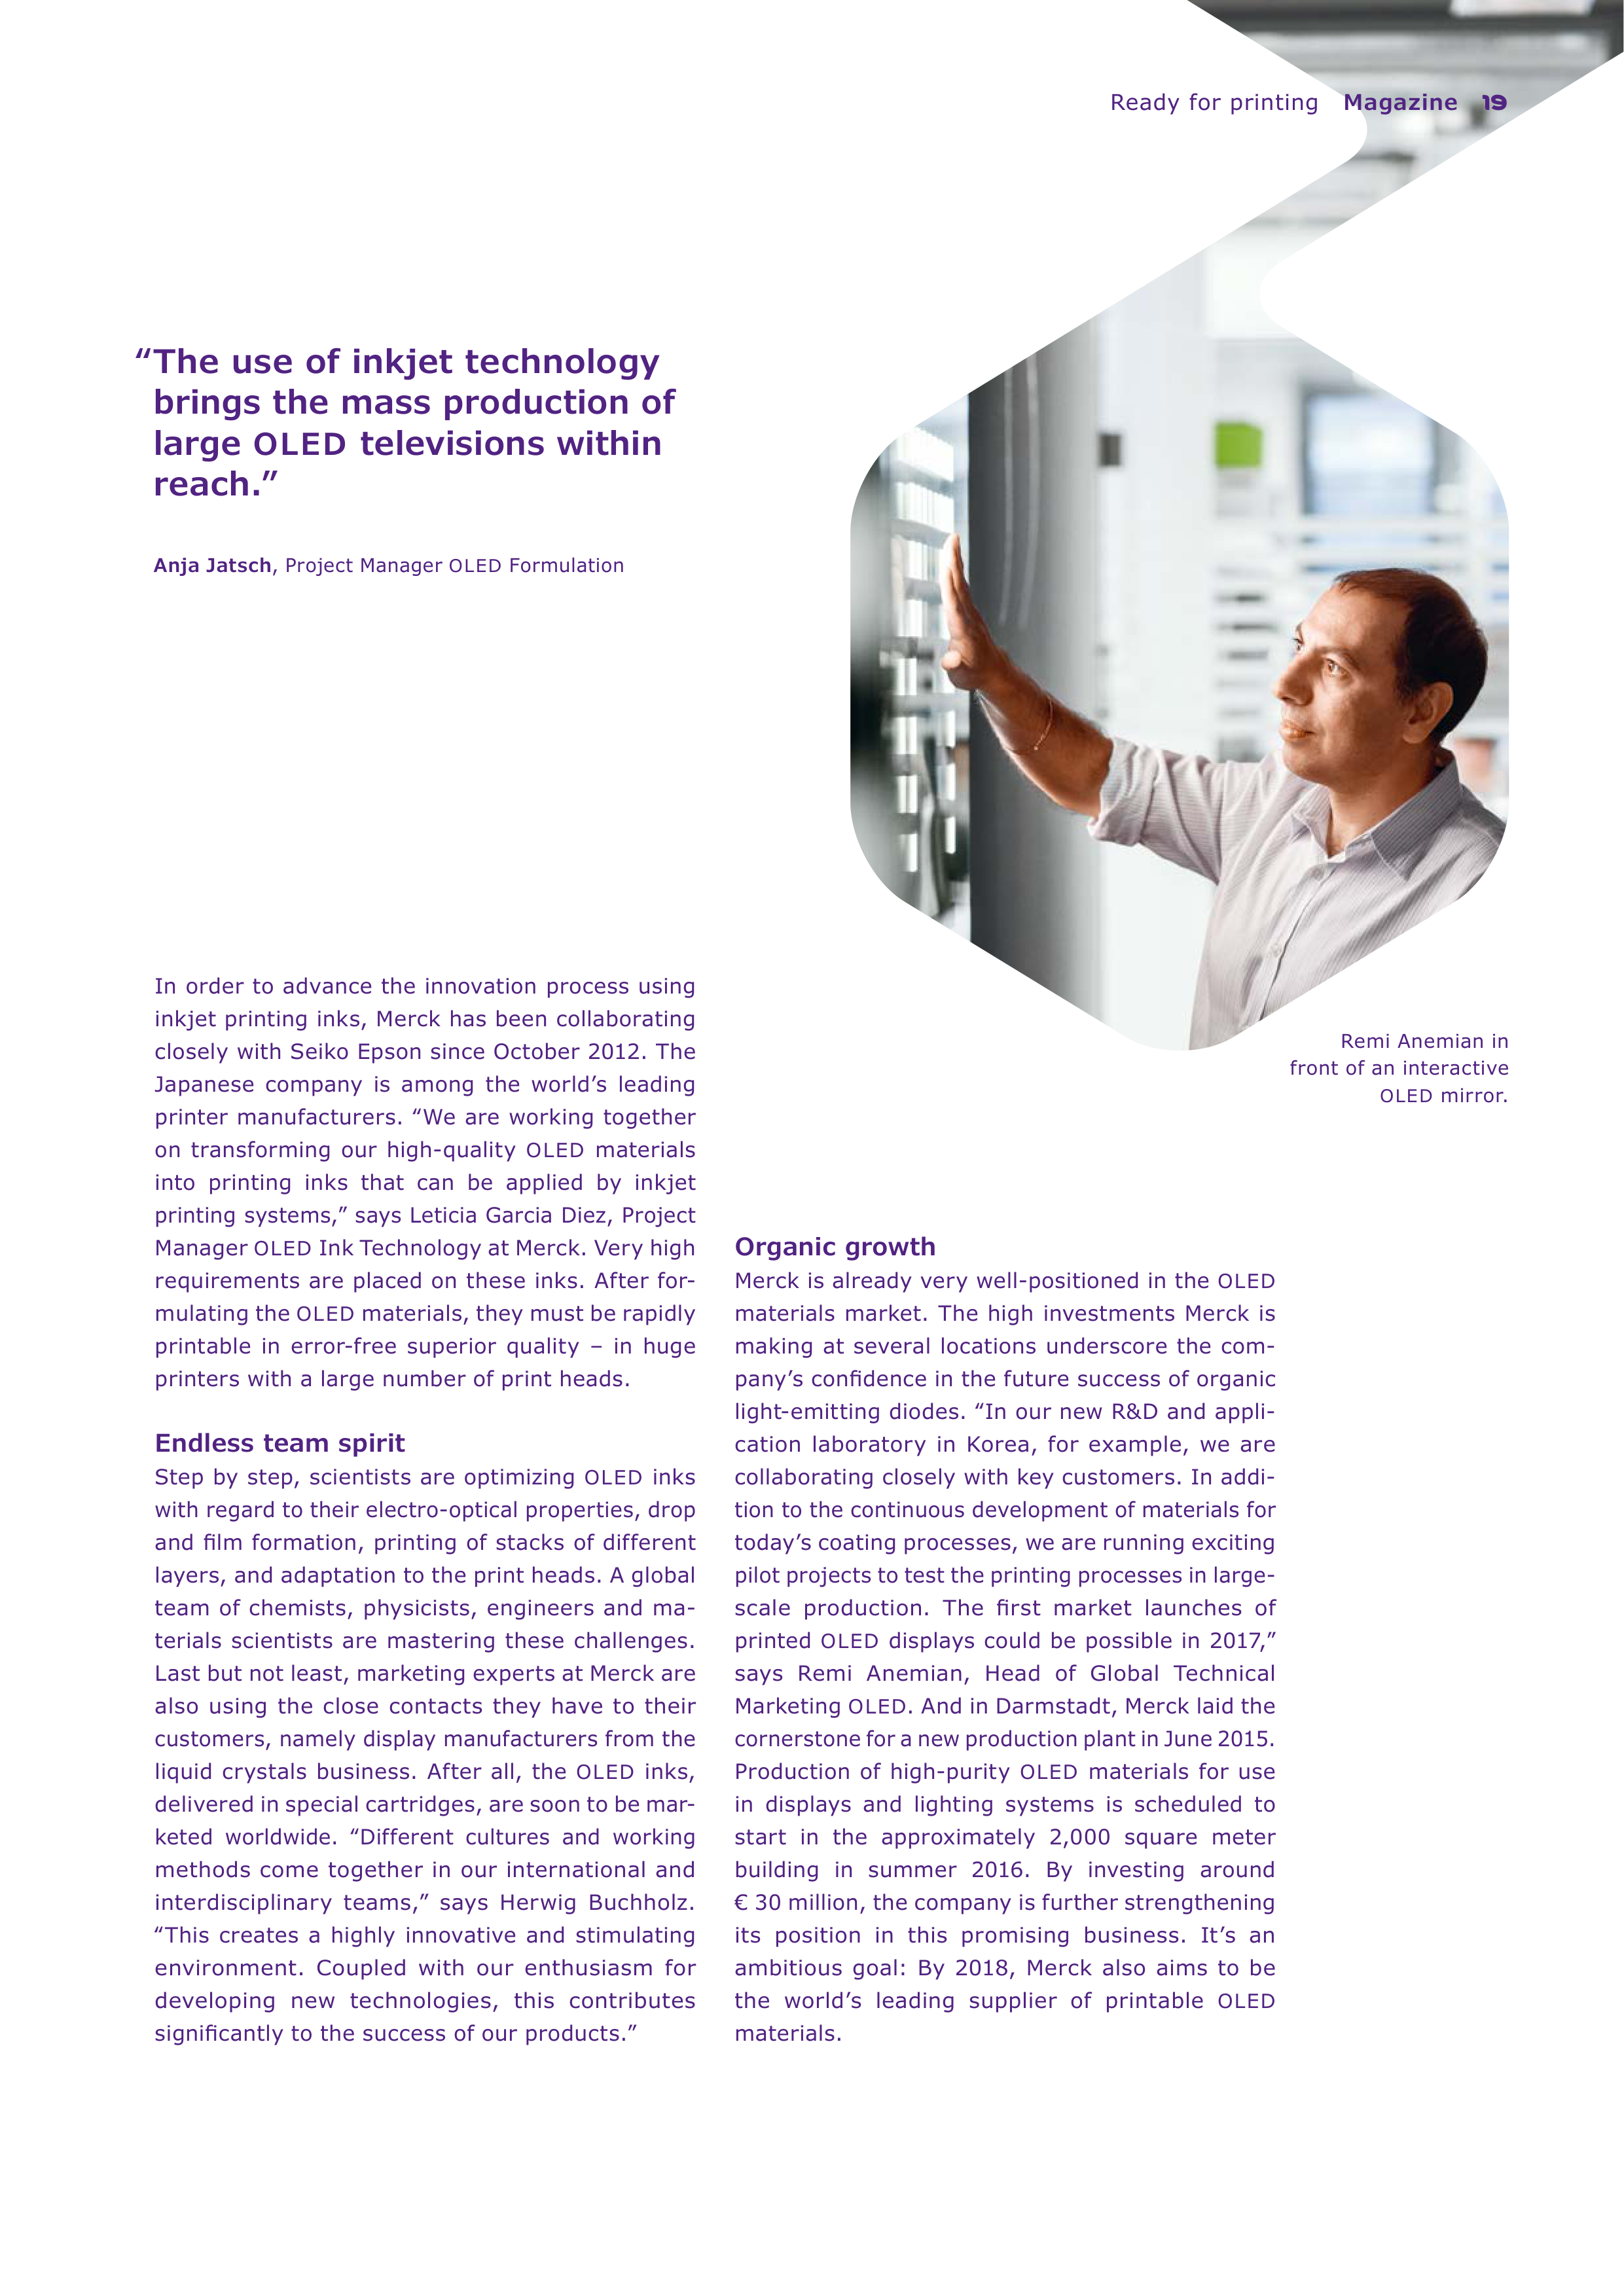
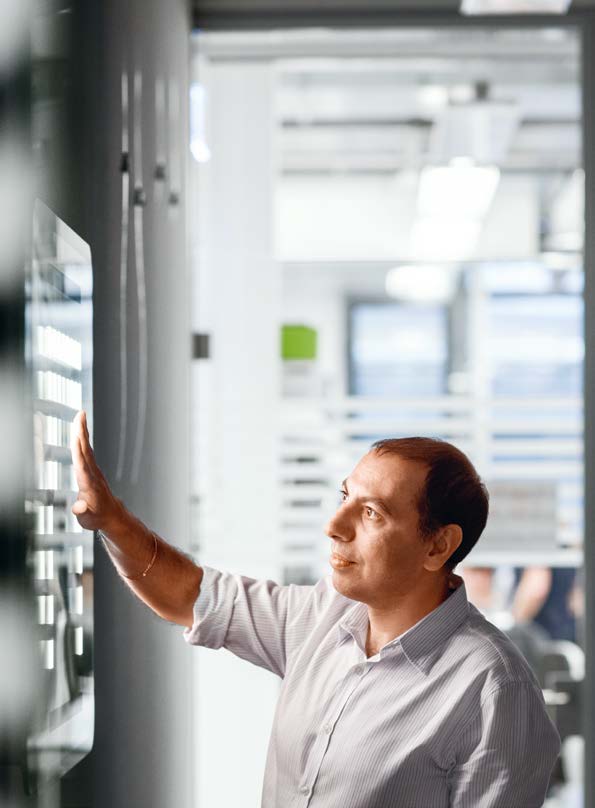
Remi Anemian in
front of an interactive
OLED
mirror.
In order to advance the innovation process using
inkjet printing inks, Merck has been collaborating
closely with Seiko Epson since October 2012. The
Japanese company is among the world’s leading
printer manufacturers. ‟We are working together
on transforming our high-quality
OLED
materials
into printing inks that can be applied by inkjet
printing systems,” says Leticia Garcia Diez, Project
Manager
OLED
Ink Technology at Merck. Very high
requirements are placed on these inks. After for-
mulating the
OLED
materials, they must be rapidly
printable in error-free superior quality – in huge
printers with a large number of print heads.
Endless team spirit
Step by step, scientists are optimizing
OLED
inks
with regard to their electro-optical properties, drop
and film formation, printing of stacks of different
layers, and adaptation to the print heads. A global
team of chemists, physicists, engineers and ma
terials scientists are mastering these challenges.
Last but not least, marketing experts at Merck are
also using the close contacts they have to their
customers, namely display manufacturers from the
liquid crystals business. After all, the
OLED
inks,
delivered in special cartridges, are soon to be
mar-
keted worldwide. ‟Different cultures and working
methods come together in our international and
interdisciplinary teams,” says Herwig Buchholz.
‟This creates a highly innovative and stimulating
environment. Coupled with our enthusiasm for
developing new technologies, this contributes
significantly to the success of our products.”
Organic growth
Merck is already very well-positioned in the
OLED
materials market. The high investments Merck is
making at several locations underscore the com-
pany’s confidence in the future success of organic
light-emitting diodes. ‟In our new R&D and appli-
cation laboratory in Korea, for example, we are
collaborating closely with key customers. In addi-
tion to the continuous development of materials for
today’s coating processes, we are running exciting
pilot projects to test the printing processes in large-
scale production. The first market launches of
printed
OLED
displays could be possible in 2017,”
says Remi Anemian, Head of Global Technical
Marketing
OLED
. And in Darmstadt, Merck laid the
cornerstone for a new production plant in June 2015.
Production of high-purity
OLED
materials for use
in displays and lighting systems is scheduled to
start in the approximately 2,000 square meter
building in summer 2016. By investing around
€ 30 million, the company is further strengthening
its position in this promising business. It’s an
ambitious goal: By 2018, Merck also aims to be
the world’s leading supplier of printable
OLED
materials.
PROGRESS
20
Magazine
Progress
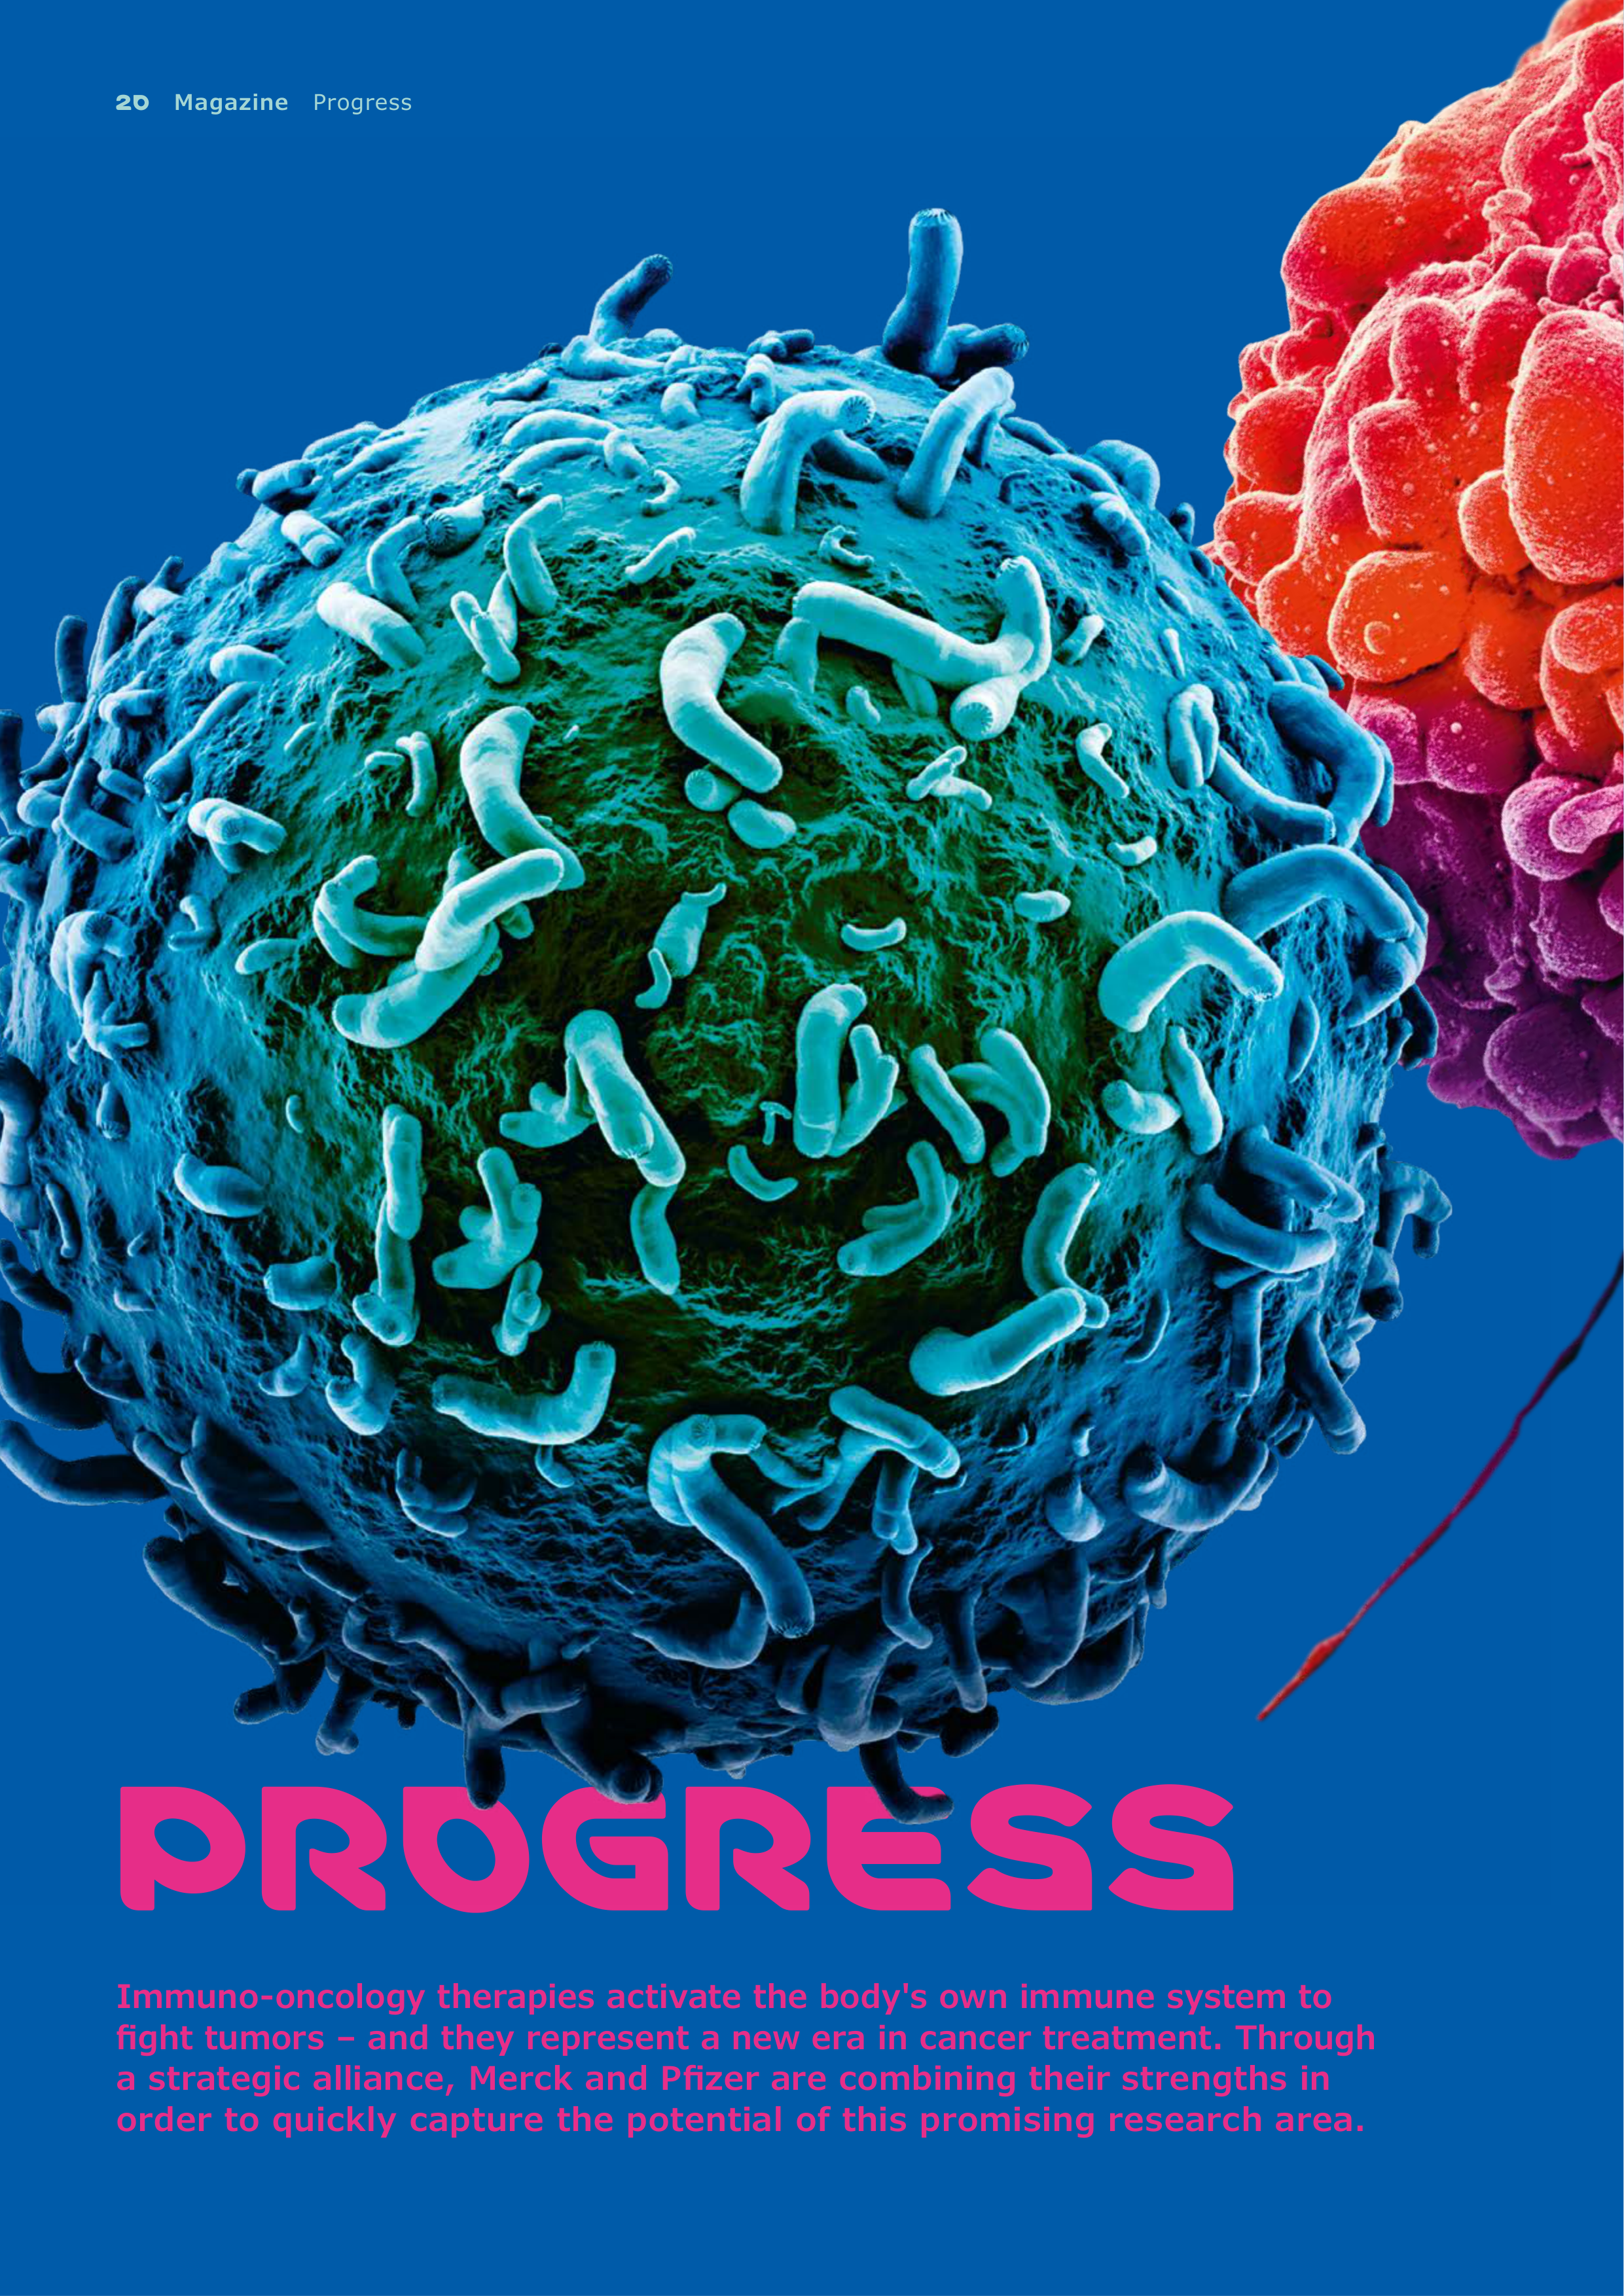
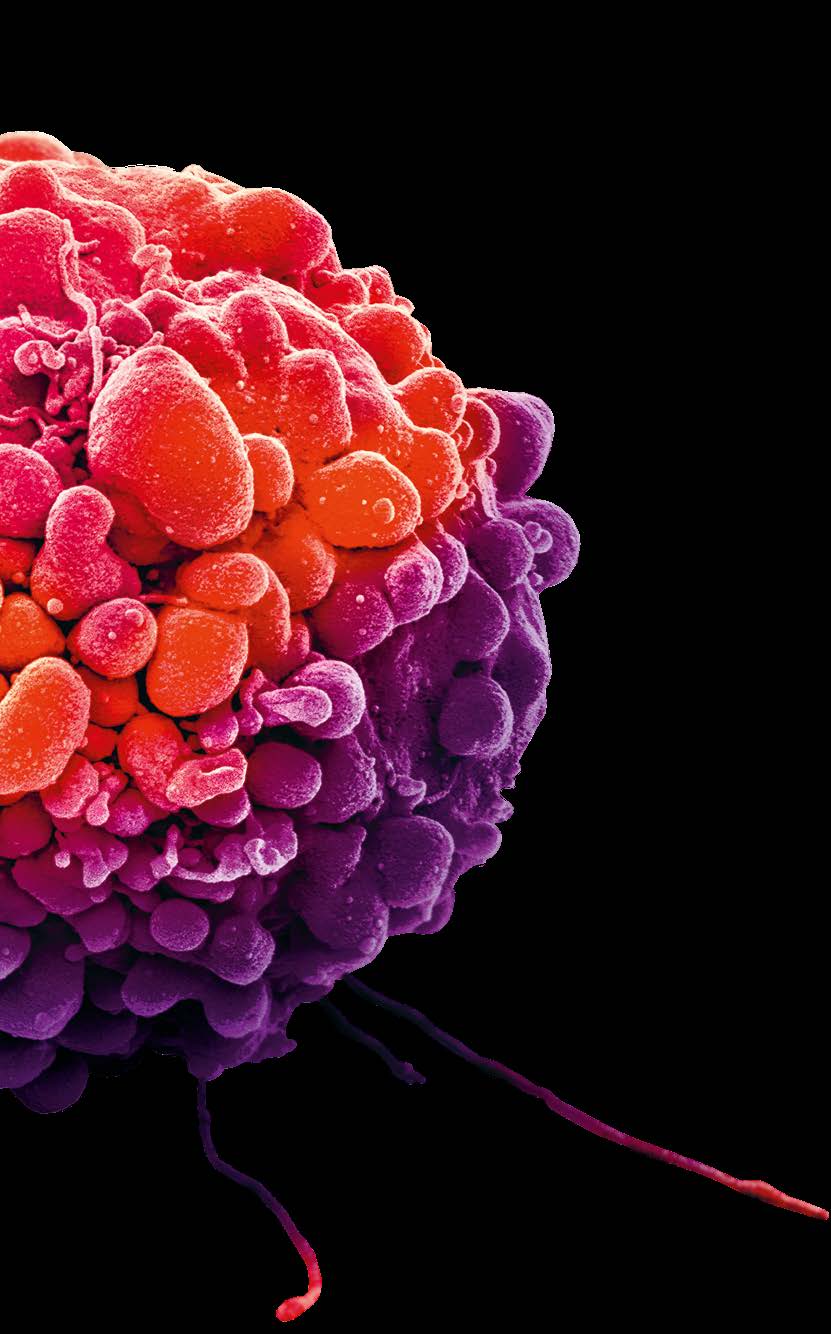
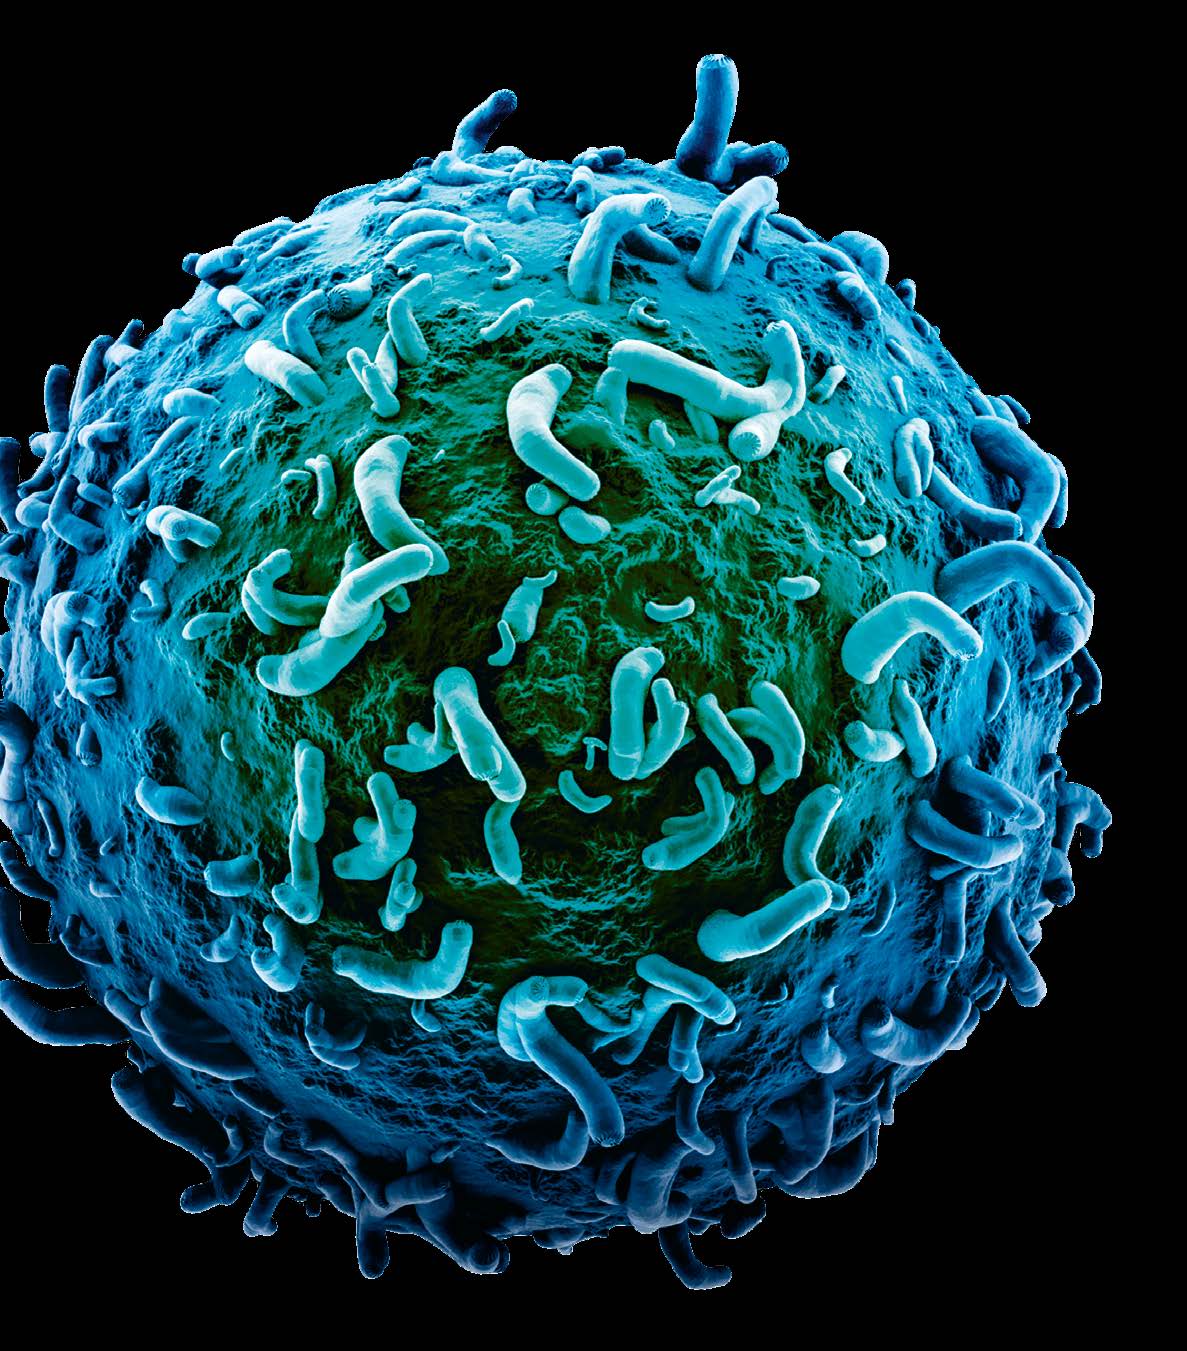
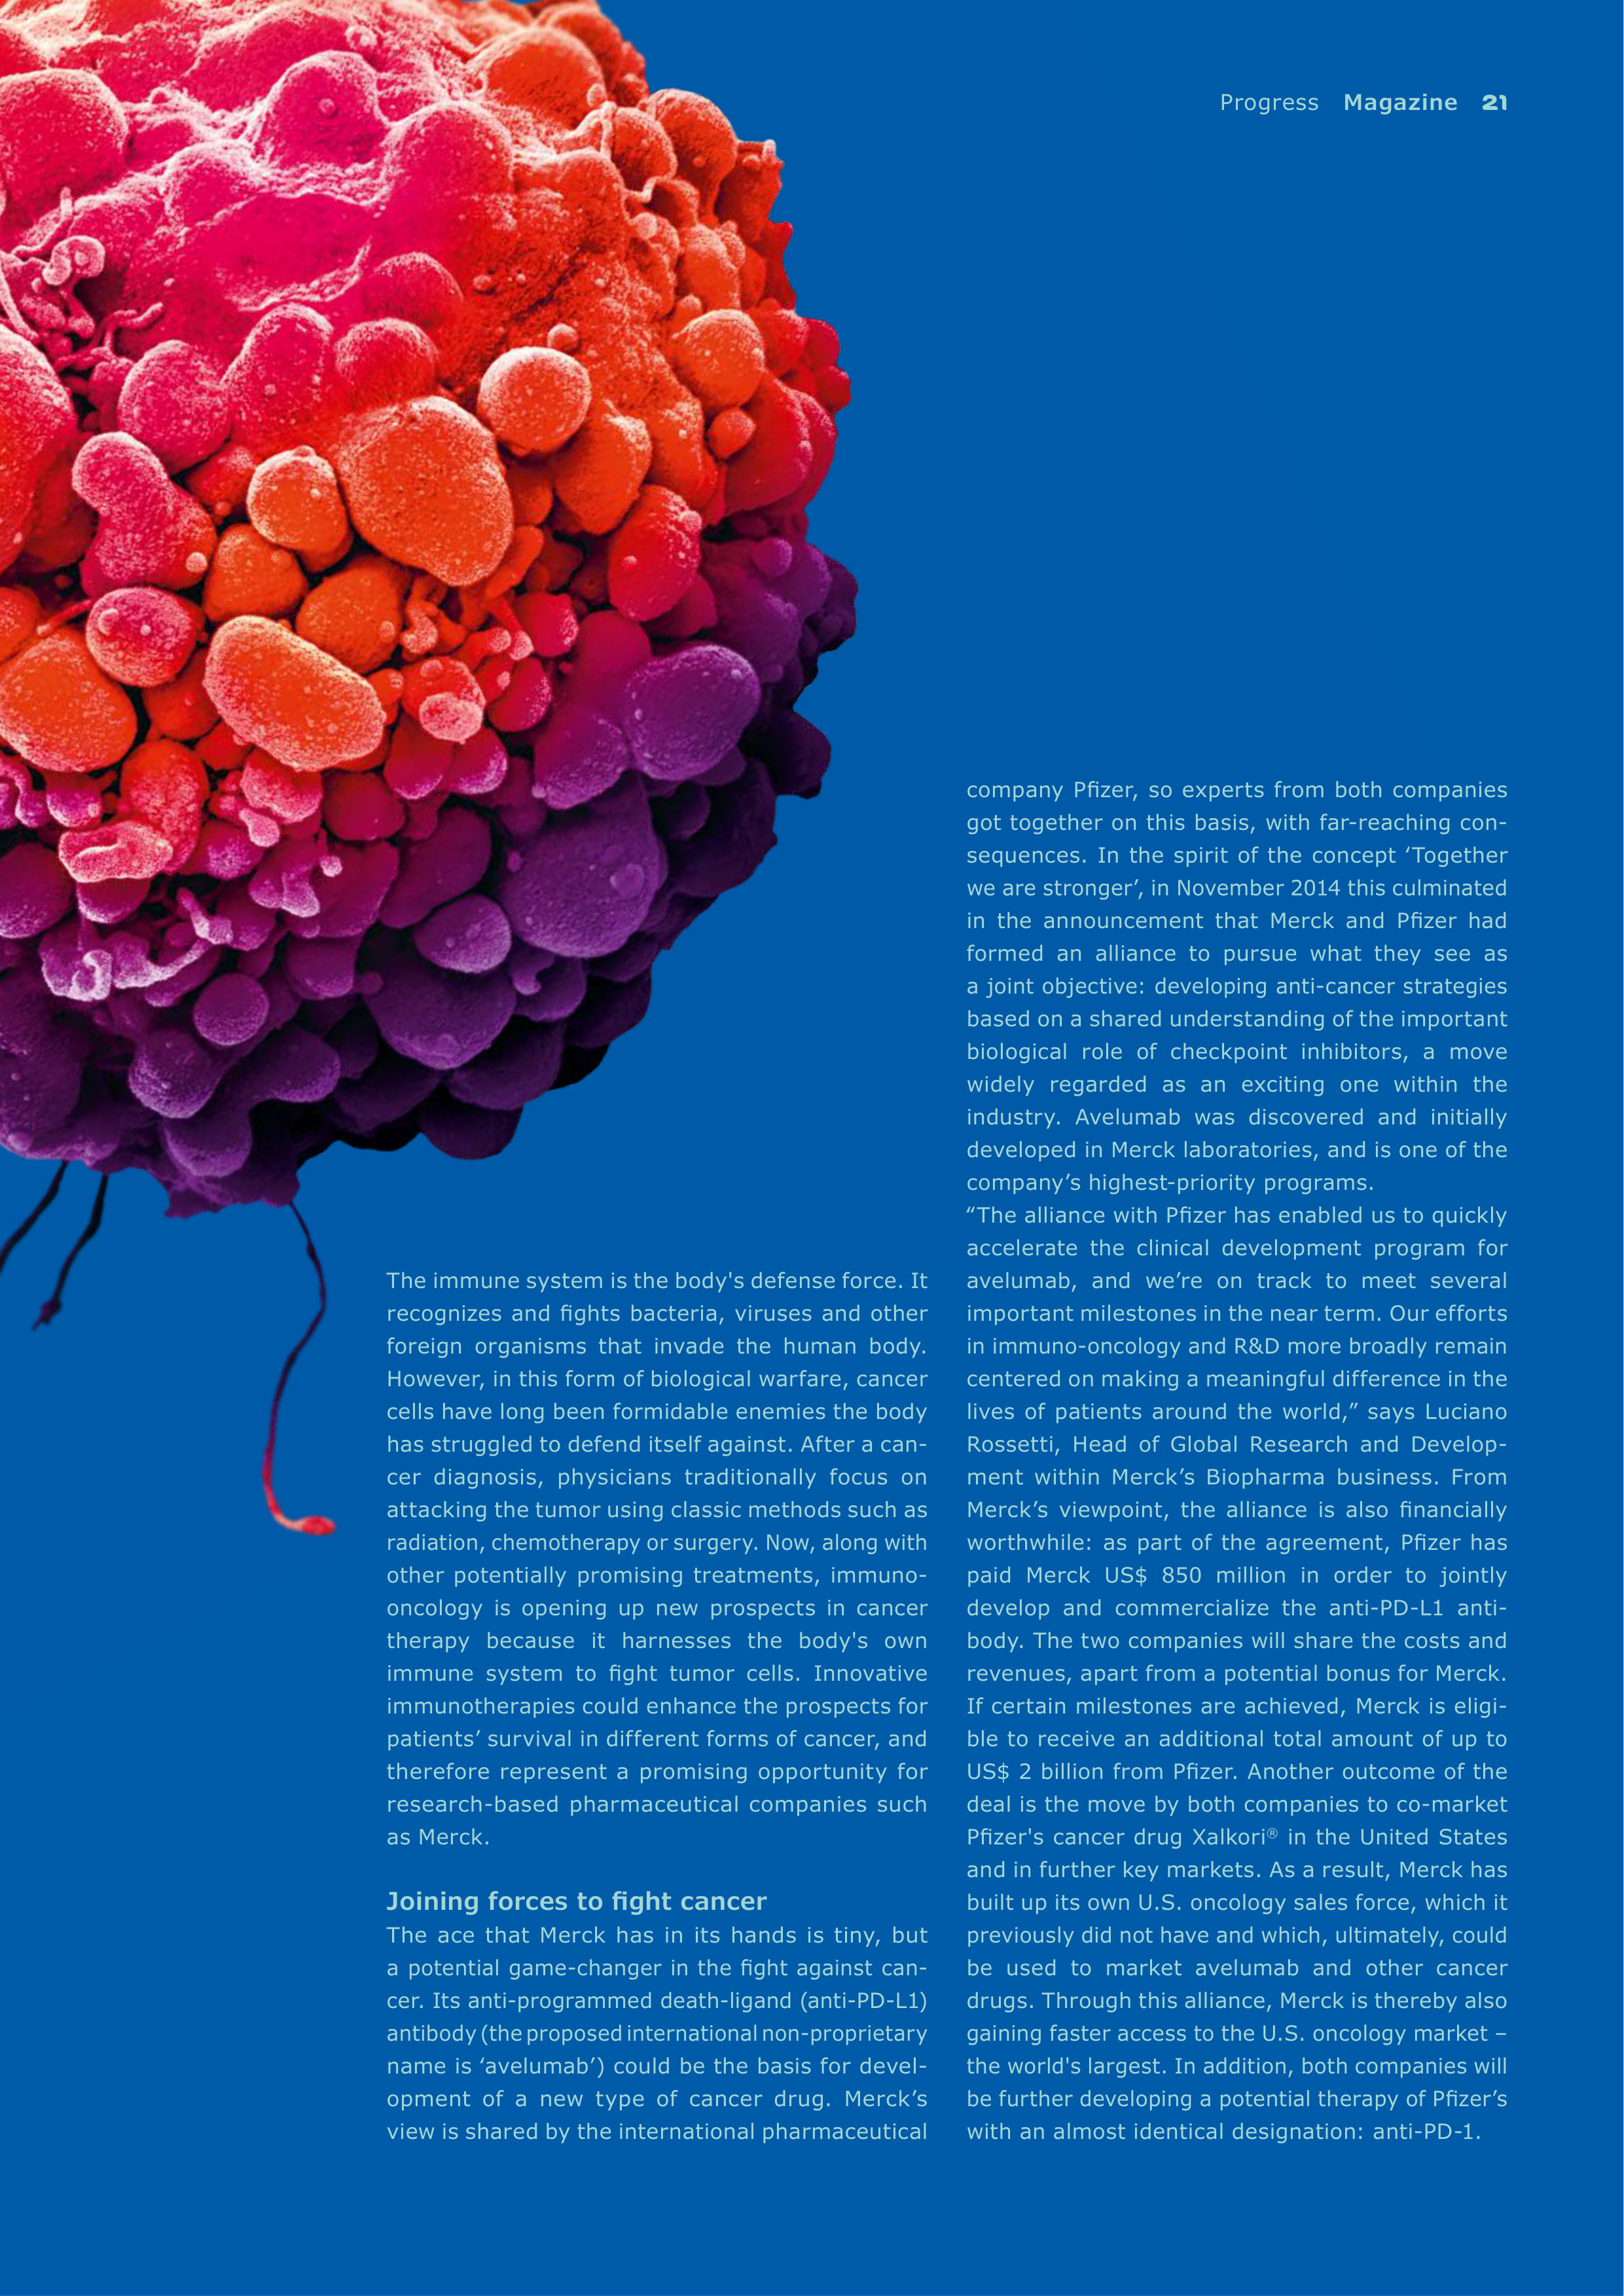
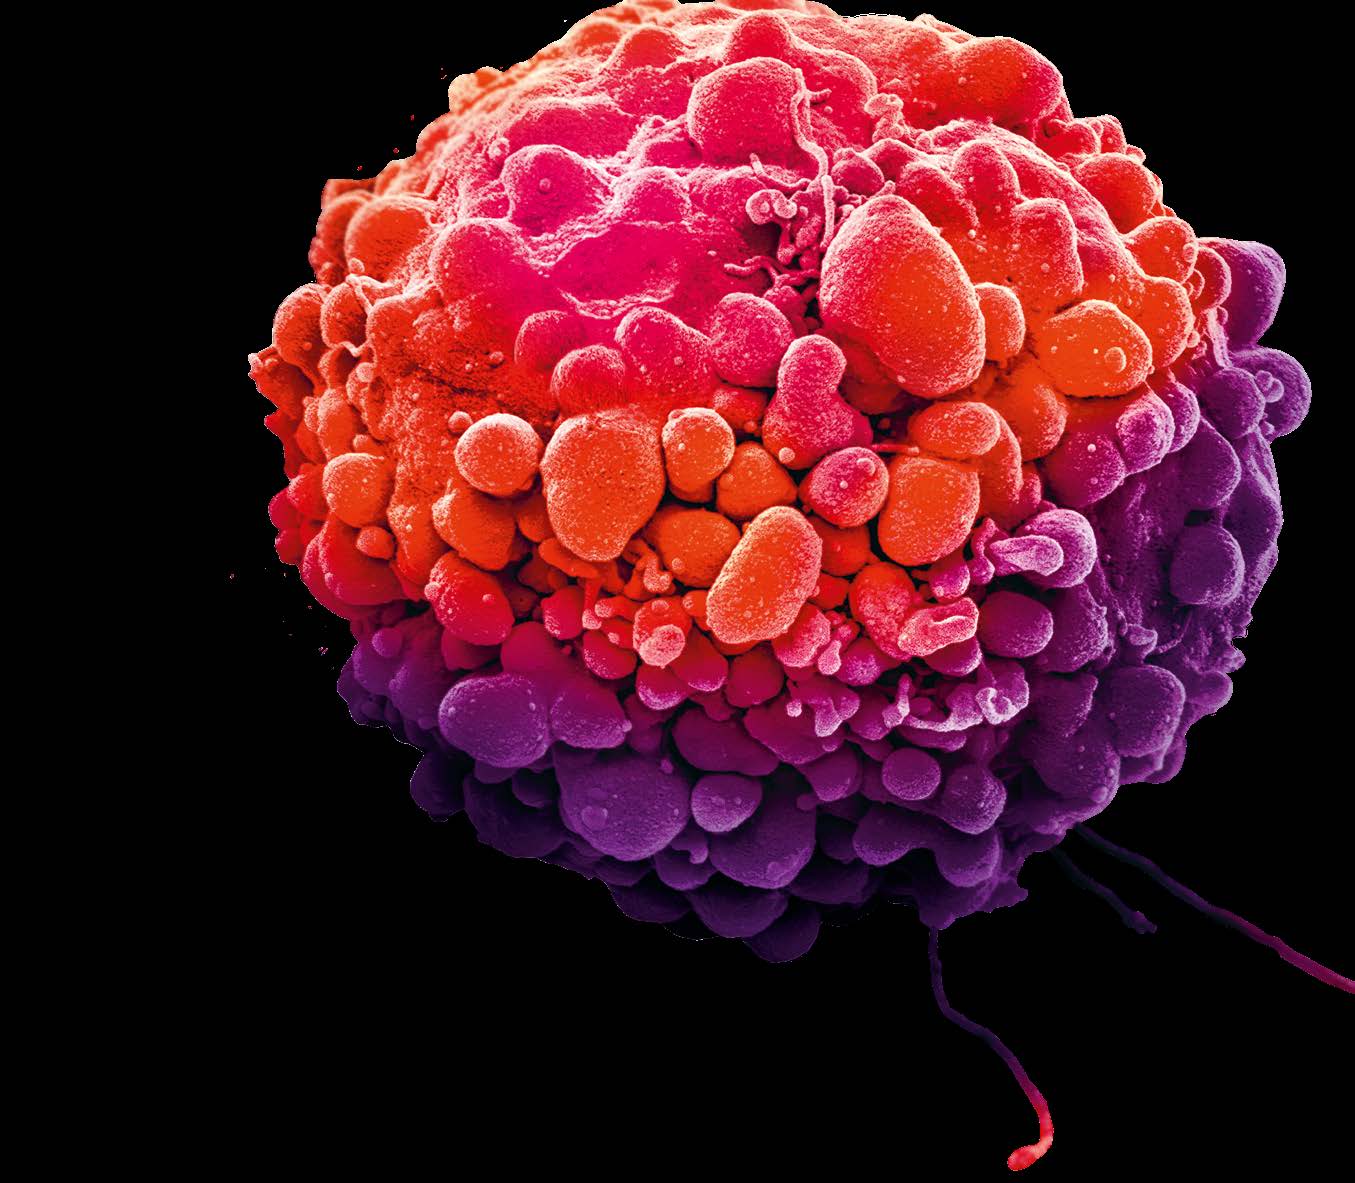
Immuno-oncology therapies activate the body's own immune system to
fight tumors – and they represent a new era in cancer treatment. Through
a strategic alliance, Merck and Pfizer are combining their strengths in
order to quickly capture the potential of this promising research area.
Progress
Magazine
21
The immune system is the body's defense force. It
recognizes and fights bacteria, viruses and other
foreign organisms that invade the human body.
However, in this form of biological warfare, cancer
cells have long been formidable enemies the body
has struggled to defend itself against. After a can-
cer diagnosis, physicians traditionally focus on
attacking the tumor using classic methods such as
radiation, chemotherapy or surgery. Now, along with
other potentially promising treatments, immuno-
oncology is opening up new prospects in cancer
therapy because it harnesses the body's own
immune system to fight tumor cells. Innovative
immunotherapies could enhance the prospects for
patients’ survival in different forms of cancer, and
therefore represent a promising opportunity for
research-based pharmaceutical companies such
as Merck.
Joining forces to fight cancer
The ace that Merck has in its hands is tiny, but
a potential game-changer in the fight against can-
cer. Its anti-programmed death-ligand (anti-PD-L1)
antibody (the proposed international non-proprietary
name is ‛avelumab’) could be the basis
for devel-
opment of a new type of cancer drug. Merck’s
view is shared by the international pharmaceutical
company Pfizer, so experts from both companies
got together on this basis, with far-reaching con-
sequences. In the spirit of the concept ‛Together
we are stronger’, in November 2014 this culminated
in the announcement that Merck and Pfizer had
formed an alliance to pursue what they see as
a joint objective: developing anti-cancer strategies
based on a shared understanding of the important
biological role of checkpoint inhibitors, a move
widely regarded as an exciting one within the
industry. Avelumab was discovered and initially
developed in Merck laboratories, and is one of the
company’s highest-priority programs.
‟The alliance with Pfizer has enabled us to quickly
accelerate the clinical development program for
avelumab, and we’re on track to meet several
important milestones in the near term. Our efforts
in immuno-oncology and R&D more broadly remain
centered on making a meaningful difference in the
lives of patients around the world,” says Luciano
Rossetti, Head of Global Research and Develop-
ment within Merck’s Biopharma business. From
Merck’s viewpoint, the alliance is also financially
worthwhile: as part of the agreement, Pfizer has
paid Merck US$ 850 million in order to jointly
develop and commercialize the anti-PD-L1 anti-
body. The two companies will share the costs and
revenues, apart from a potential bonus for Merck.
If certain milestones are achieved, Merck is eligi-
ble to receive an additional total amount of up to
US$ 2 billion from Pfizer. Another outcome of the
deal is the move by both companies to co-market
Pfizer's cancer drug Xalkori
®
in the United States
and in further key markets. As a result, Merck has
built up its own U.S. oncology sales force, which it
previously did not have and which, ultimately, could
be used to market avelumab and other cancer
drugs. Through this alliance, Merck is thereby also
gaining faster access to the U.S. oncology market –
the world's largest. In addition, both companies will
be further developing a potential therapy of Pfizer’s
with an almost identical designation: anti-PD-1.
22
Magazine
Progress
A camouflaged attack
So why are scientists excited about anti-
PD-L1 antibodies? In order to explain
the relatively complex functions of anti-
PD-L1 and anti-PD-1, we need to consider
the purpose of the immune system. Its
capability as a successful defense against
invaders that cause disease (patho-
gens) depends on a collective effort by
organs, tissues and the immune cells,
commonly known as white blood cells.
Immune cells first scan the tissue for
any sign of injury, infection and general
malfunction, including signs of uncon-
trolled cell division that could poten-
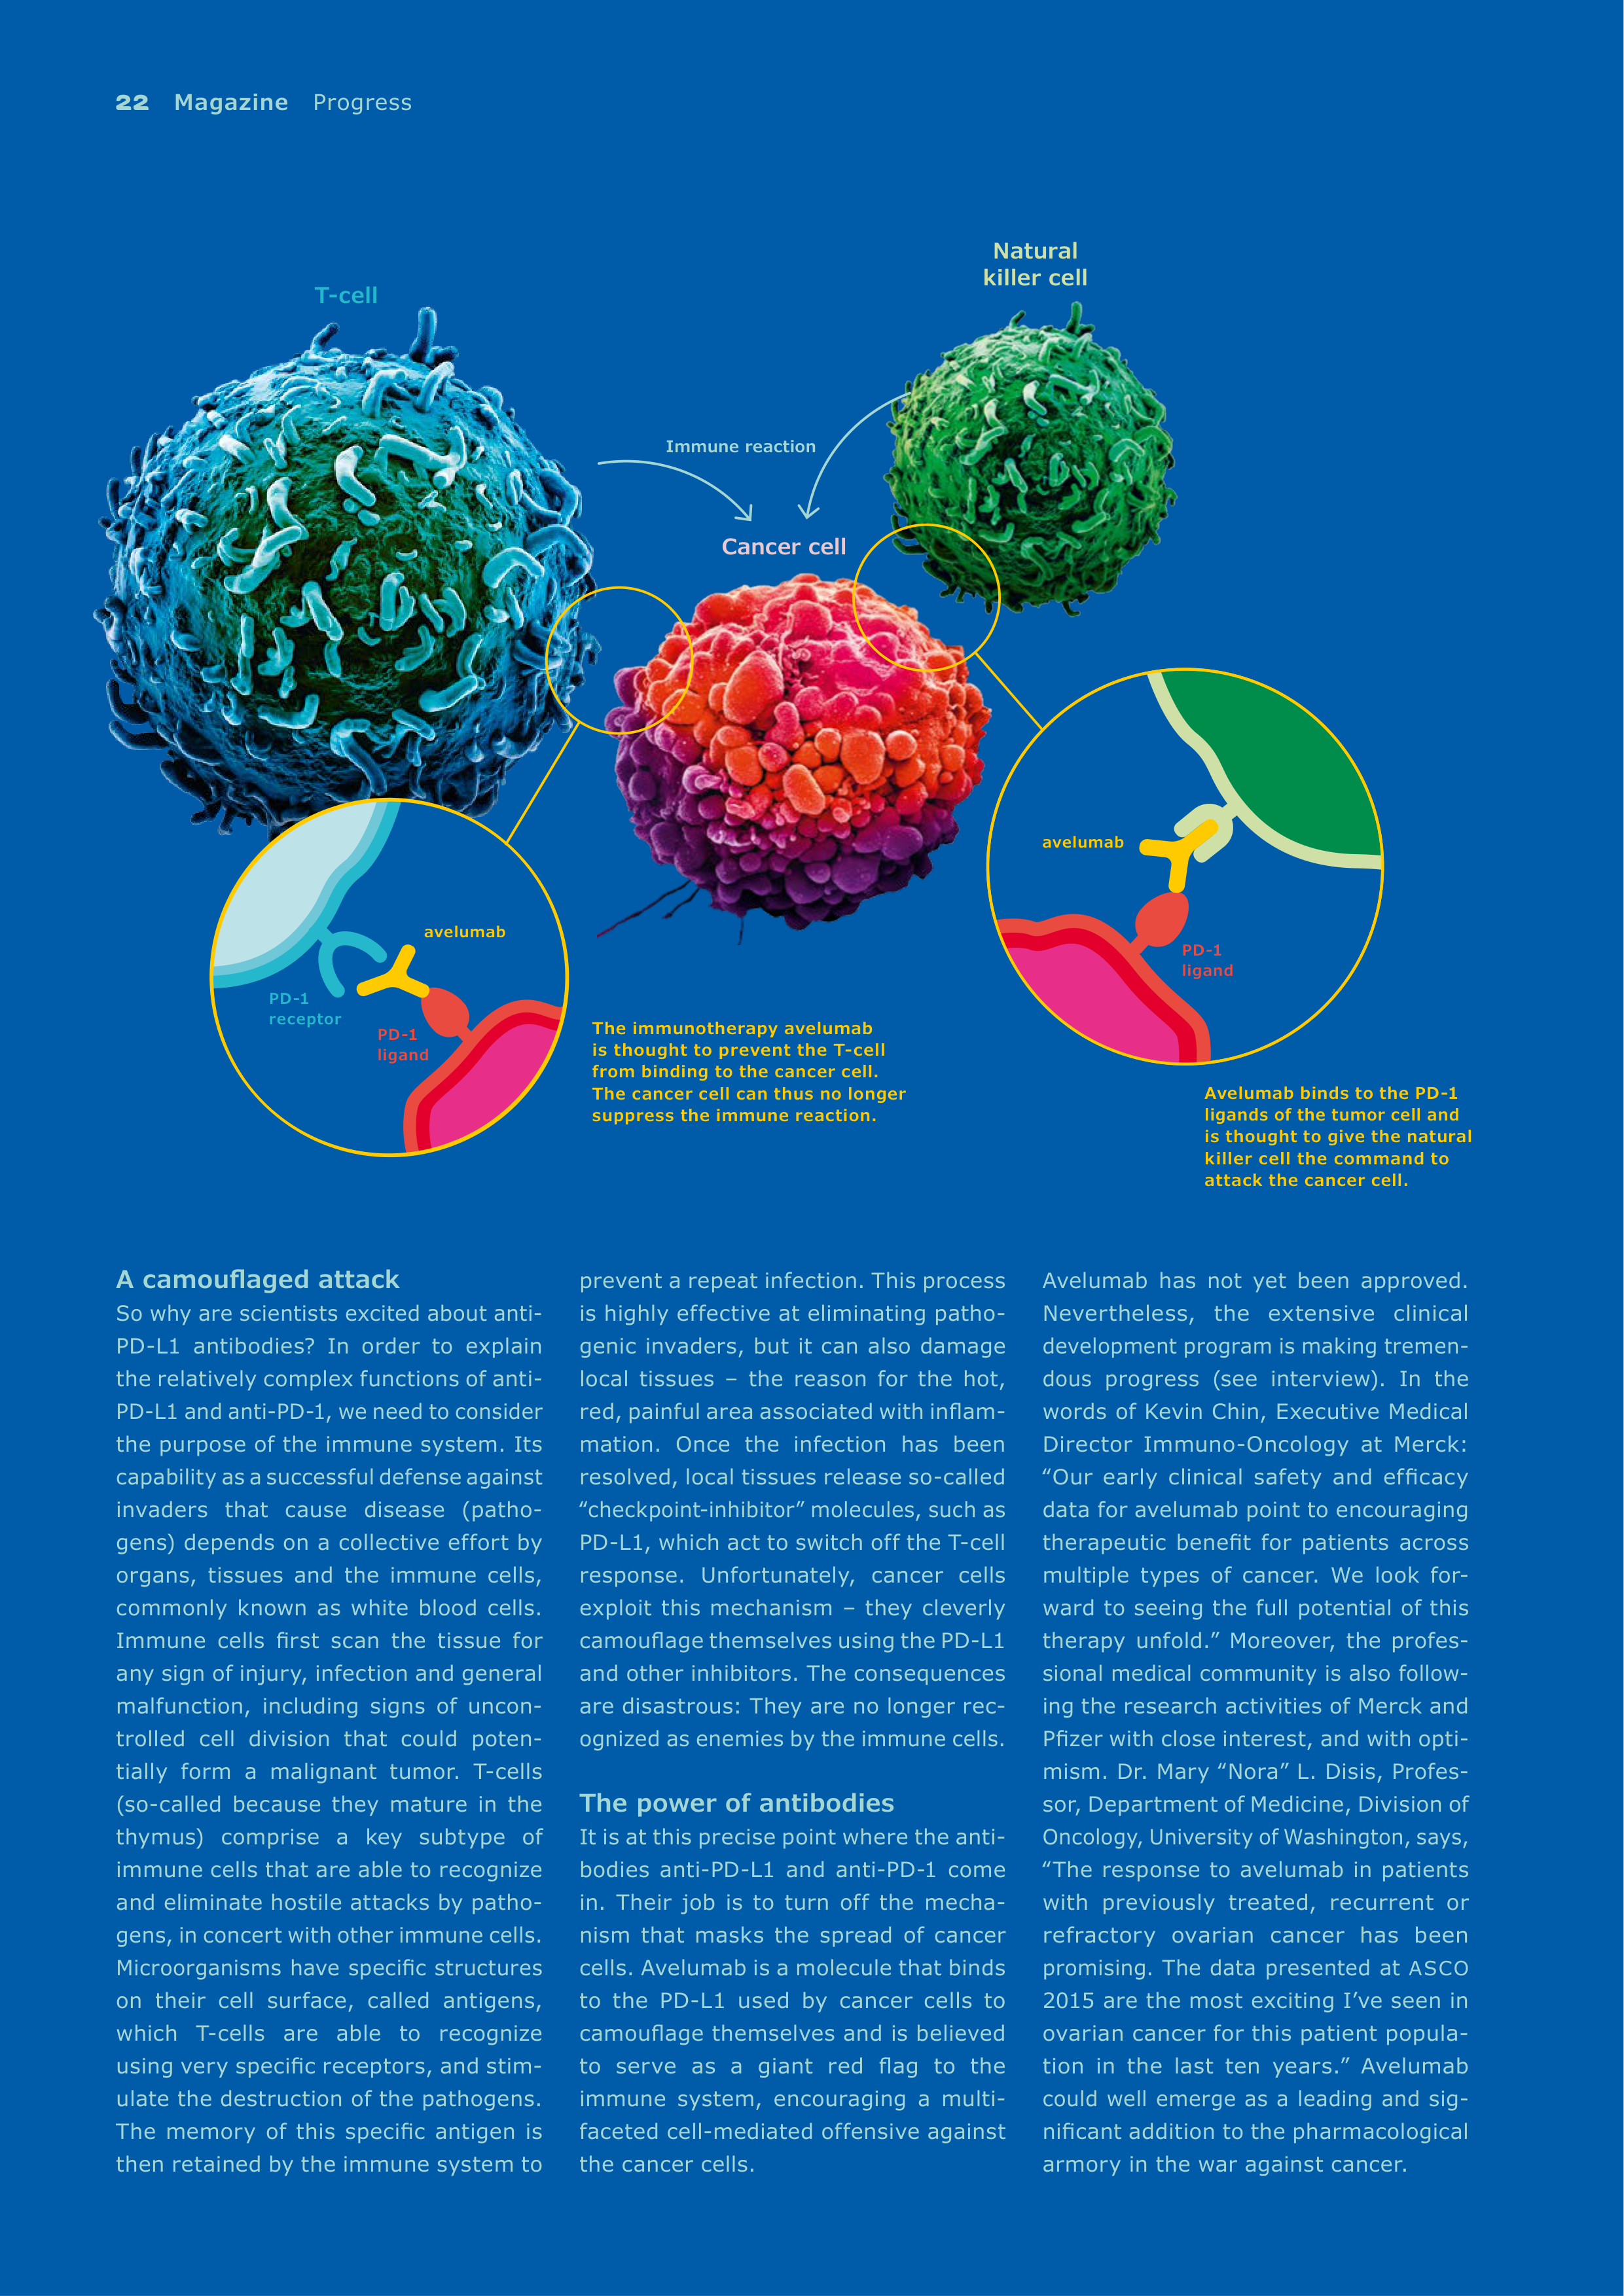
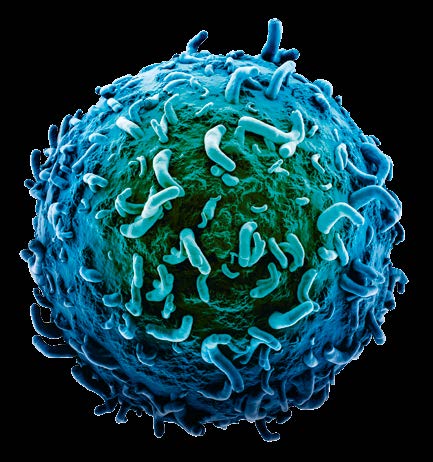
tially form a malignant tumor. T-cells
(so-called because they mature in the
thymus) comprise a key subtype of
immune cells that are able to recognize
and eliminate hostile attacks by patho-
gens, in concert with other immune cells.
Microorganisms have specific structures
on their cell surface, called antigens,
which T-cells are able to recognize
using very specific receptors, and stim-
ulate the destruction of the pathogens.
The memory of this specific antigen is
then retained by the immune system to
prevent a repeat infection. This process
is highly effective at eliminating patho-
genic invaders, but it can also damage
local tissues – the reason for the hot,
red, painful area associated with inflam-
mation. Once the infection has been
resolved, local tissues release so-called
‟checkpoint-inhibitor” molecules, such as
PD-L1, which act to switch off the T-cell
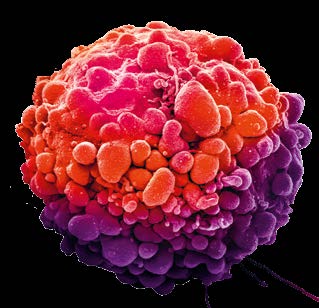
response. Unfortunately, cancer cells
exploit this mechanism – they cleverly
camouflage themselves using the PD-L1
and other inhibitors. The consequences
are disastrous: They are no longer rec-
ognized as enemies by the immune cells.
The power of antibodies
It is at this precise point where the anti-
bodies anti-PD-L1 and anti-PD-1 come
in. Their job is to turn off the mecha-
nism that masks the spread of cancer
cells. Avelumab is a molecule that binds
to the PD-L1 used by cancer cells to
camouflage themselves and is believed
to serve as a giant red flag to the
immune system, encouraging a multi-
faceted cell-mediated offensive against
the cancer cells.
Avelumab has not yet been approved.
Nevertheless, the extensive clinical
development program is making tremen-
dous
progress (see interview). In the
words of Kevin Chin, Executive Medical
Director Immuno-Oncology at Merck:
‟Our early clinical safety and efficacy
data for avelumab point to encouraging
therapeutic benefit for patients across
multiple types of cancer. We look for-
ward to seeing the full potential of this
therapy unfold.” Moreover, the profes-
sional medical community is also follow-
ing
the research activities of Merck and
Pfizer with close interest, and with opti-
mism. Dr. Mary ‟Nora” L. Disis, Profes-
sor, Department of Medicine, Division of
Oncology, University of Washington, says,
‟The response to avelumab in patients
with previously treated, recurrent or
refractory ovarian cancer has been
promising. The data presented at
ASCO
2015 are the most exciting I’ve seen in
ovarian cancer for this patient popula-
tion in the last ten years.” Avelumab
could well emerge as a leading and
sig-
nificant addition to the pharmacological
armory in the war against cancer.
Cancer cell
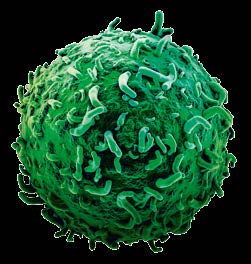
Natural
killer cell
Immune reaction
T-cell
Avelumab binds to the PD-1
ligands of the tumor cell and
is thought to give the natural
killer cell the command to
attack the cancer cell.
PD-1
ligand
avelumab
The immunotherapy avelumab
is thought to prevent the T-cell
from binding to the cancer cell.
The cancer cell can thus no longer
suppress the immune reaction.
avelumab
PD-1
receptor
PD-1
ligand
Progress
Magazine
23
Andrew Schiermeier, General Manager
of the Merck-Pfizer Immuno-Oncology
Alliance and Head of Global Oncology at
Merck.
What are the key strategic drivers
of the Merck-Pfizer alliance?
Andrew Schiermeier:
We are combining
our resources and expertise because we
share a vision of making a real differ-
ence to patients with cancer. Our focus
is on jointly investigating avelumab* in
different cancer indications: We will
explore its potential as a single agent
and in various combinations with our
collective portfolio of approved and
investigational oncology therapies. The
alliance enables the companies to quickly
move into the first wave of potential
immuno-oncology-based monotherapy
treatment regimens and to potentially
take a leadership position in the next
wave of immuno-oncology combination
therapies.
Where does the main potential of
immuno-oncology and specifically
of avelumab lie?
Andrew Schiermeier:
Cancer immu-
notherapies work by harnessing the
body’s own immune system to attack
a tumor, either by restoring or boosting
an immune response to a malignant
tumor. Avelumab is thought to enable
the activation of T-cells and the adap-
tive immune system, while leaving other
PD-1 interactions intact. Early data also
suggest avelumab may possess unique
features, including the possible engage-
ment of the innate immune system.
Through clinical trials, we want to iden-
tify whether this effect may benefit
patients.
What are the biggest challenges
in the clinical development
program of avelumab?
Andrew Schiermeier:
With the
JAVELIN
p
rogram, we aim to evaluate the poten-
tial for PD-L1 inhibition with avelumab to
treat multiple types of cancer. With more
than 1,500 patients treated to date, it is
among the largest exploratory study
programs in immuno-oncology. In 2015,
more than 20 clinical programs were
initiated, six of which are pivotal trials.
Avelumab is currently being studied in
over 15 tumor types.
What is the current status and
when do you expect the market
launch of avelumab?
Andrew Schiermeier:
By the 2016
Annual Meeting of the American Society
of Clinical Oncology
(
ASCO
), the
JAVELIN
program is expected to include up to
25 trials studying avelumab as a single-
agent and combination therapy. We
expect the first potential market launch
in 2017, with the alliance working toward
at least one additional launch per year
until 2022.
* Avelumab is the proposed International Nonproprietary
Name (
INN
) for the anti-PD-L1 monoclonal antibody
(previously known as
MSB0010718C
).
“ The data presented
at
ASCO
2015 are
the most exciting
I’ve seen in ovarian
cancer for this
patient population in
the last ten years.”
Dr. Mary “Nora” L. Disis,
Professor, Department of
Medicine, Division of Oncology,
University of Washington
“ We’re combining our resources
and expertise”
Interview with Andrew Schiermeier, Head of the Merck-Pfizer Alliance



24
Magazine
Awareness
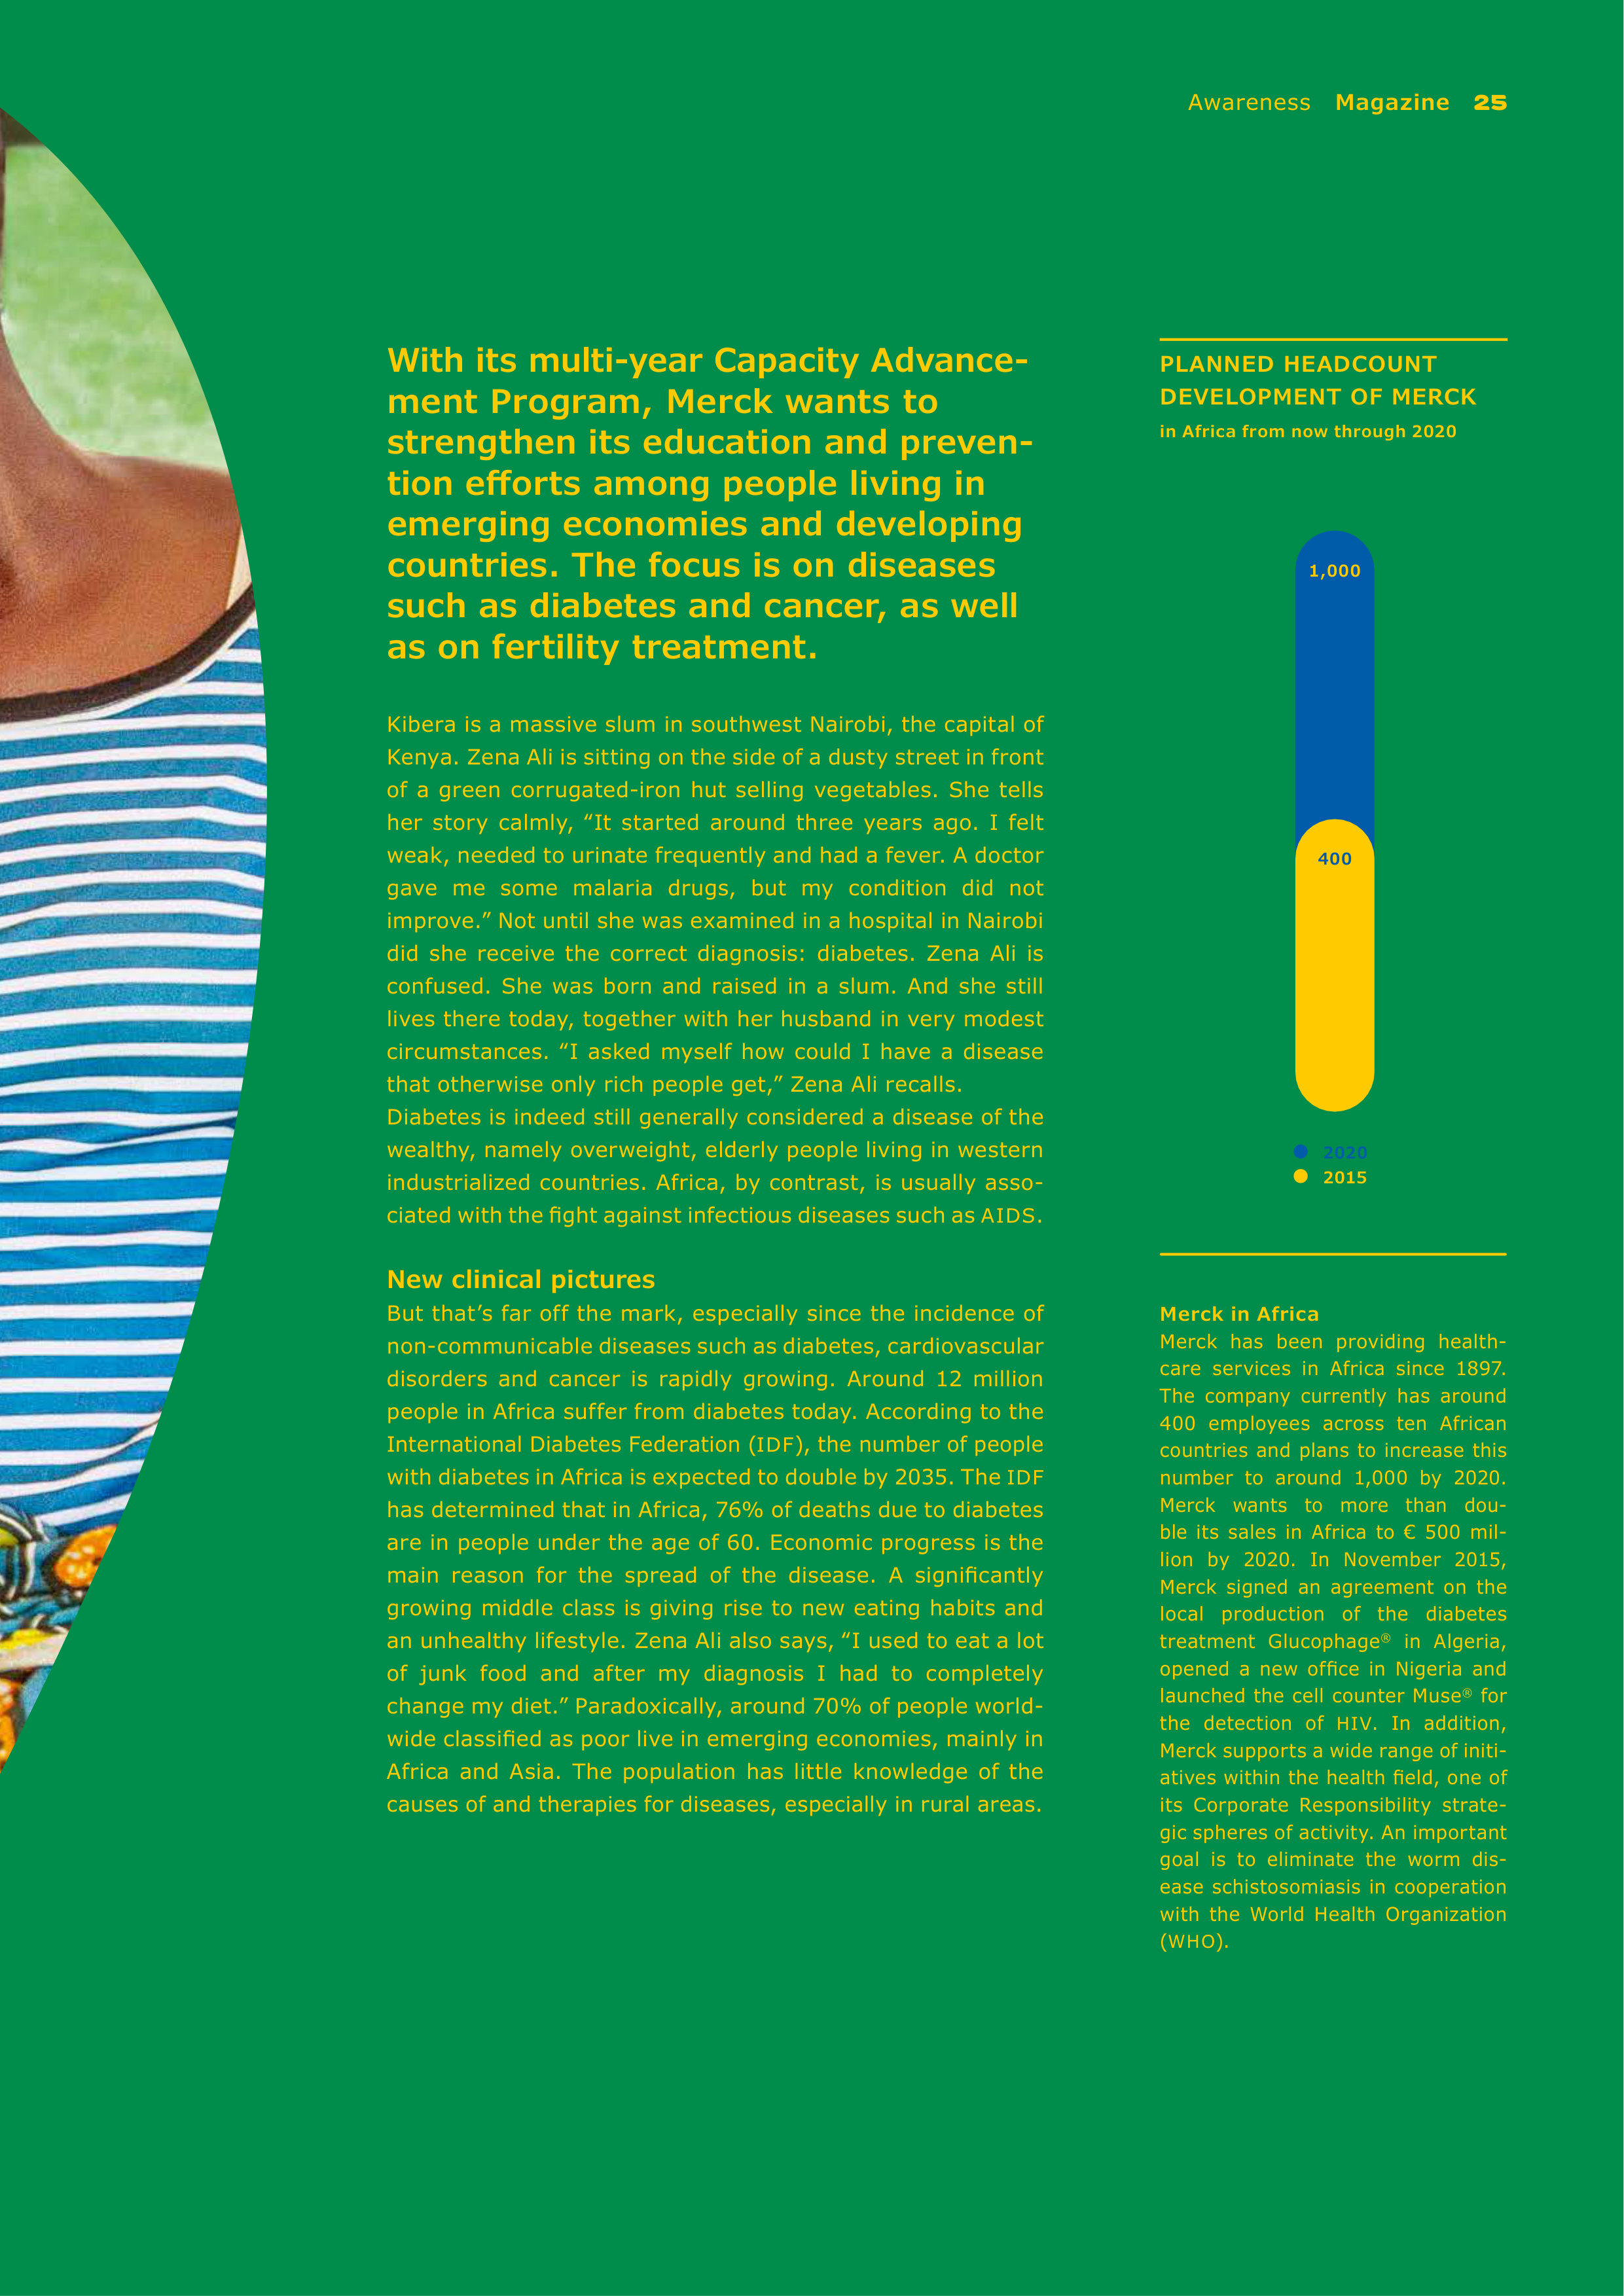
A young woman participating in
a free diabetes screening offered
through Merck’s
CAP
initiative.
AWARE
NESS


Awareness
Magazine
25
With its multi-year Capacity Advance-
ment Program, Merck wants to
strengthen its education and preven-
tion efforts among people living in
emerging economies and developing
countries. The focus is on diseases
such as diabetes and cancer, as well
as on fertility treatment.
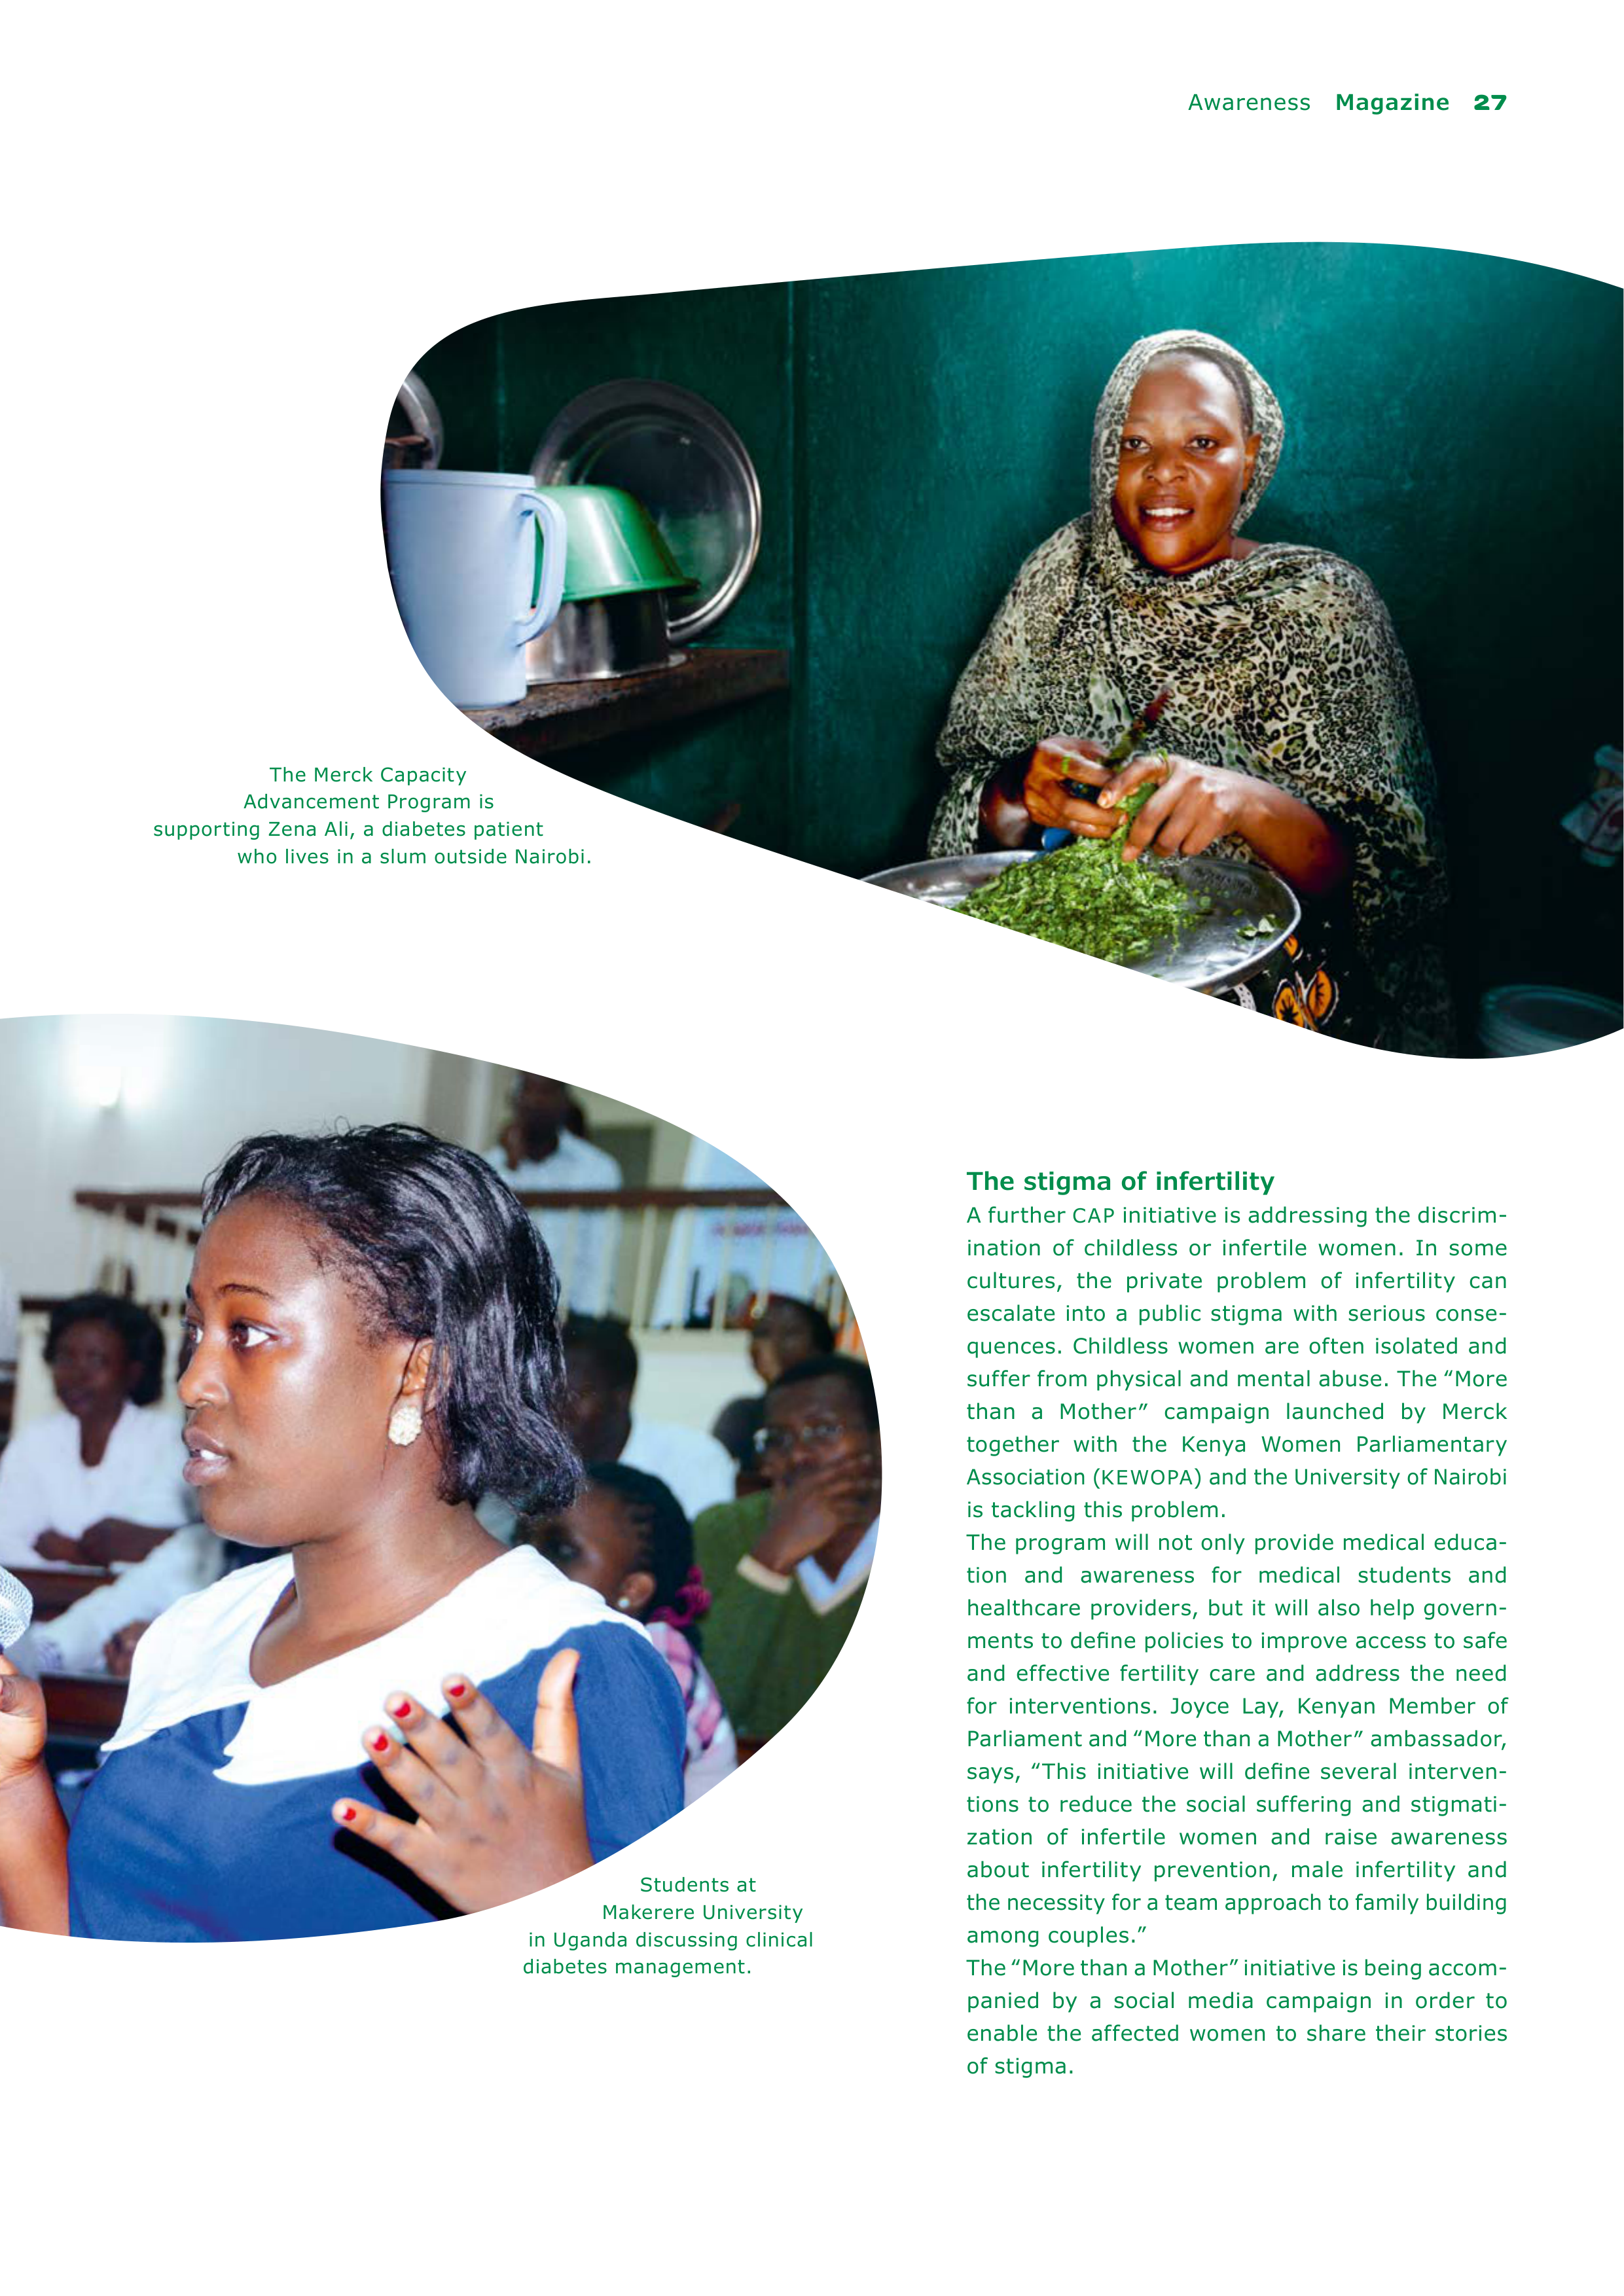
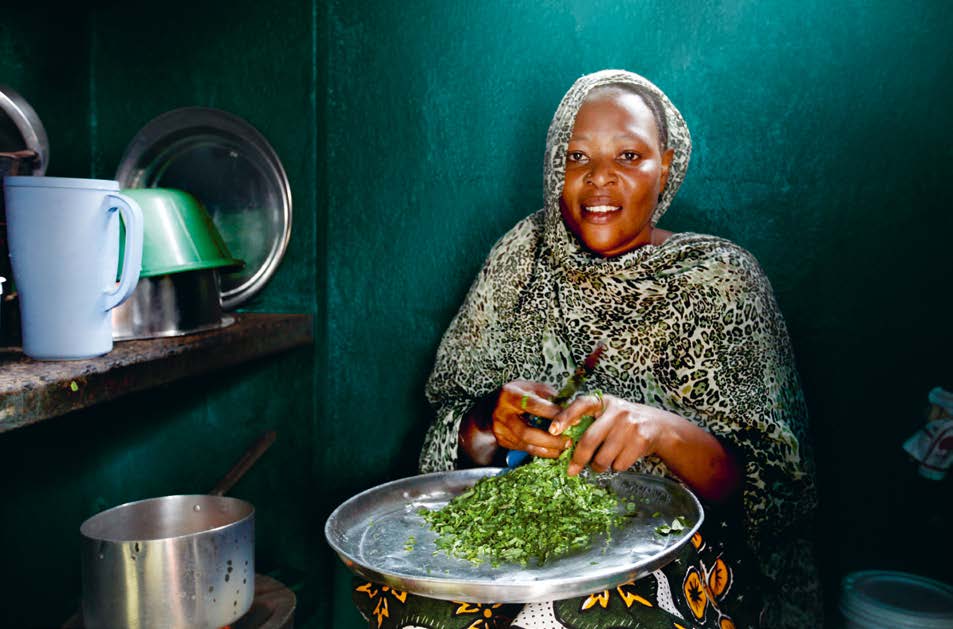
Kibera is a massive slum in southwest Nairobi, the capital of
Kenya. Zena Ali is sitting on the side of a dusty street in front
of a green corrugated-iron hut selling vegetables. She tells
her story calmly, ‟It started around three years ago. I felt
weak, needed to urinate frequently and had a fever. A doctor
gave me some malaria drugs, but my condition did not
improve.” Not until she was examined in a hospital in Nairobi
did she receive the correct diagnosis: diabetes. Zena Ali is
confused. She was born and raised in a slum. And she still
lives there today, together with her husband in very modest
circumstances. ‟I asked myself how could I have a disease
that otherwise only rich people get,” Zena Ali recalls.
Diabetes is indeed still generally considered a disease of the
wealthy, namely overweight, elderly people living in western
industrialized countries. Africa, by contrast, is usually asso-
ciated with the fight against infectious diseases such as
AIDS
.
New clinical pictures
But that’s far off the mark, especially since the incidence of
non-communicable diseases such as diabetes, cardiovascular
disorders and cancer is rapidly growing. Around 12 million
people in Africa suffer from diabetes today. According to the
International Diabetes Federation (
IDF
), the number of people
with diabetes in Africa is expected to double by 2035. The
IDF
has determined that in Africa, 76% of deaths due to diabetes
are in people under the age of 60. Economic progress is the
main reason for the spread of the disease. A significantly
growing middle class is giving rise to new eating habits and
an unhealthy lifestyle. Zena Ali also says, ‟I used to eat a lot
of junk food and after my diagnosis I had to completely
change my diet.” Paradoxically, around 70% of people world-
wide classified as poor live in emerging economies, mainly in
Africa and Asia. The population has little knowledge of the
causes of and therapies for diseases, especially in rural areas.
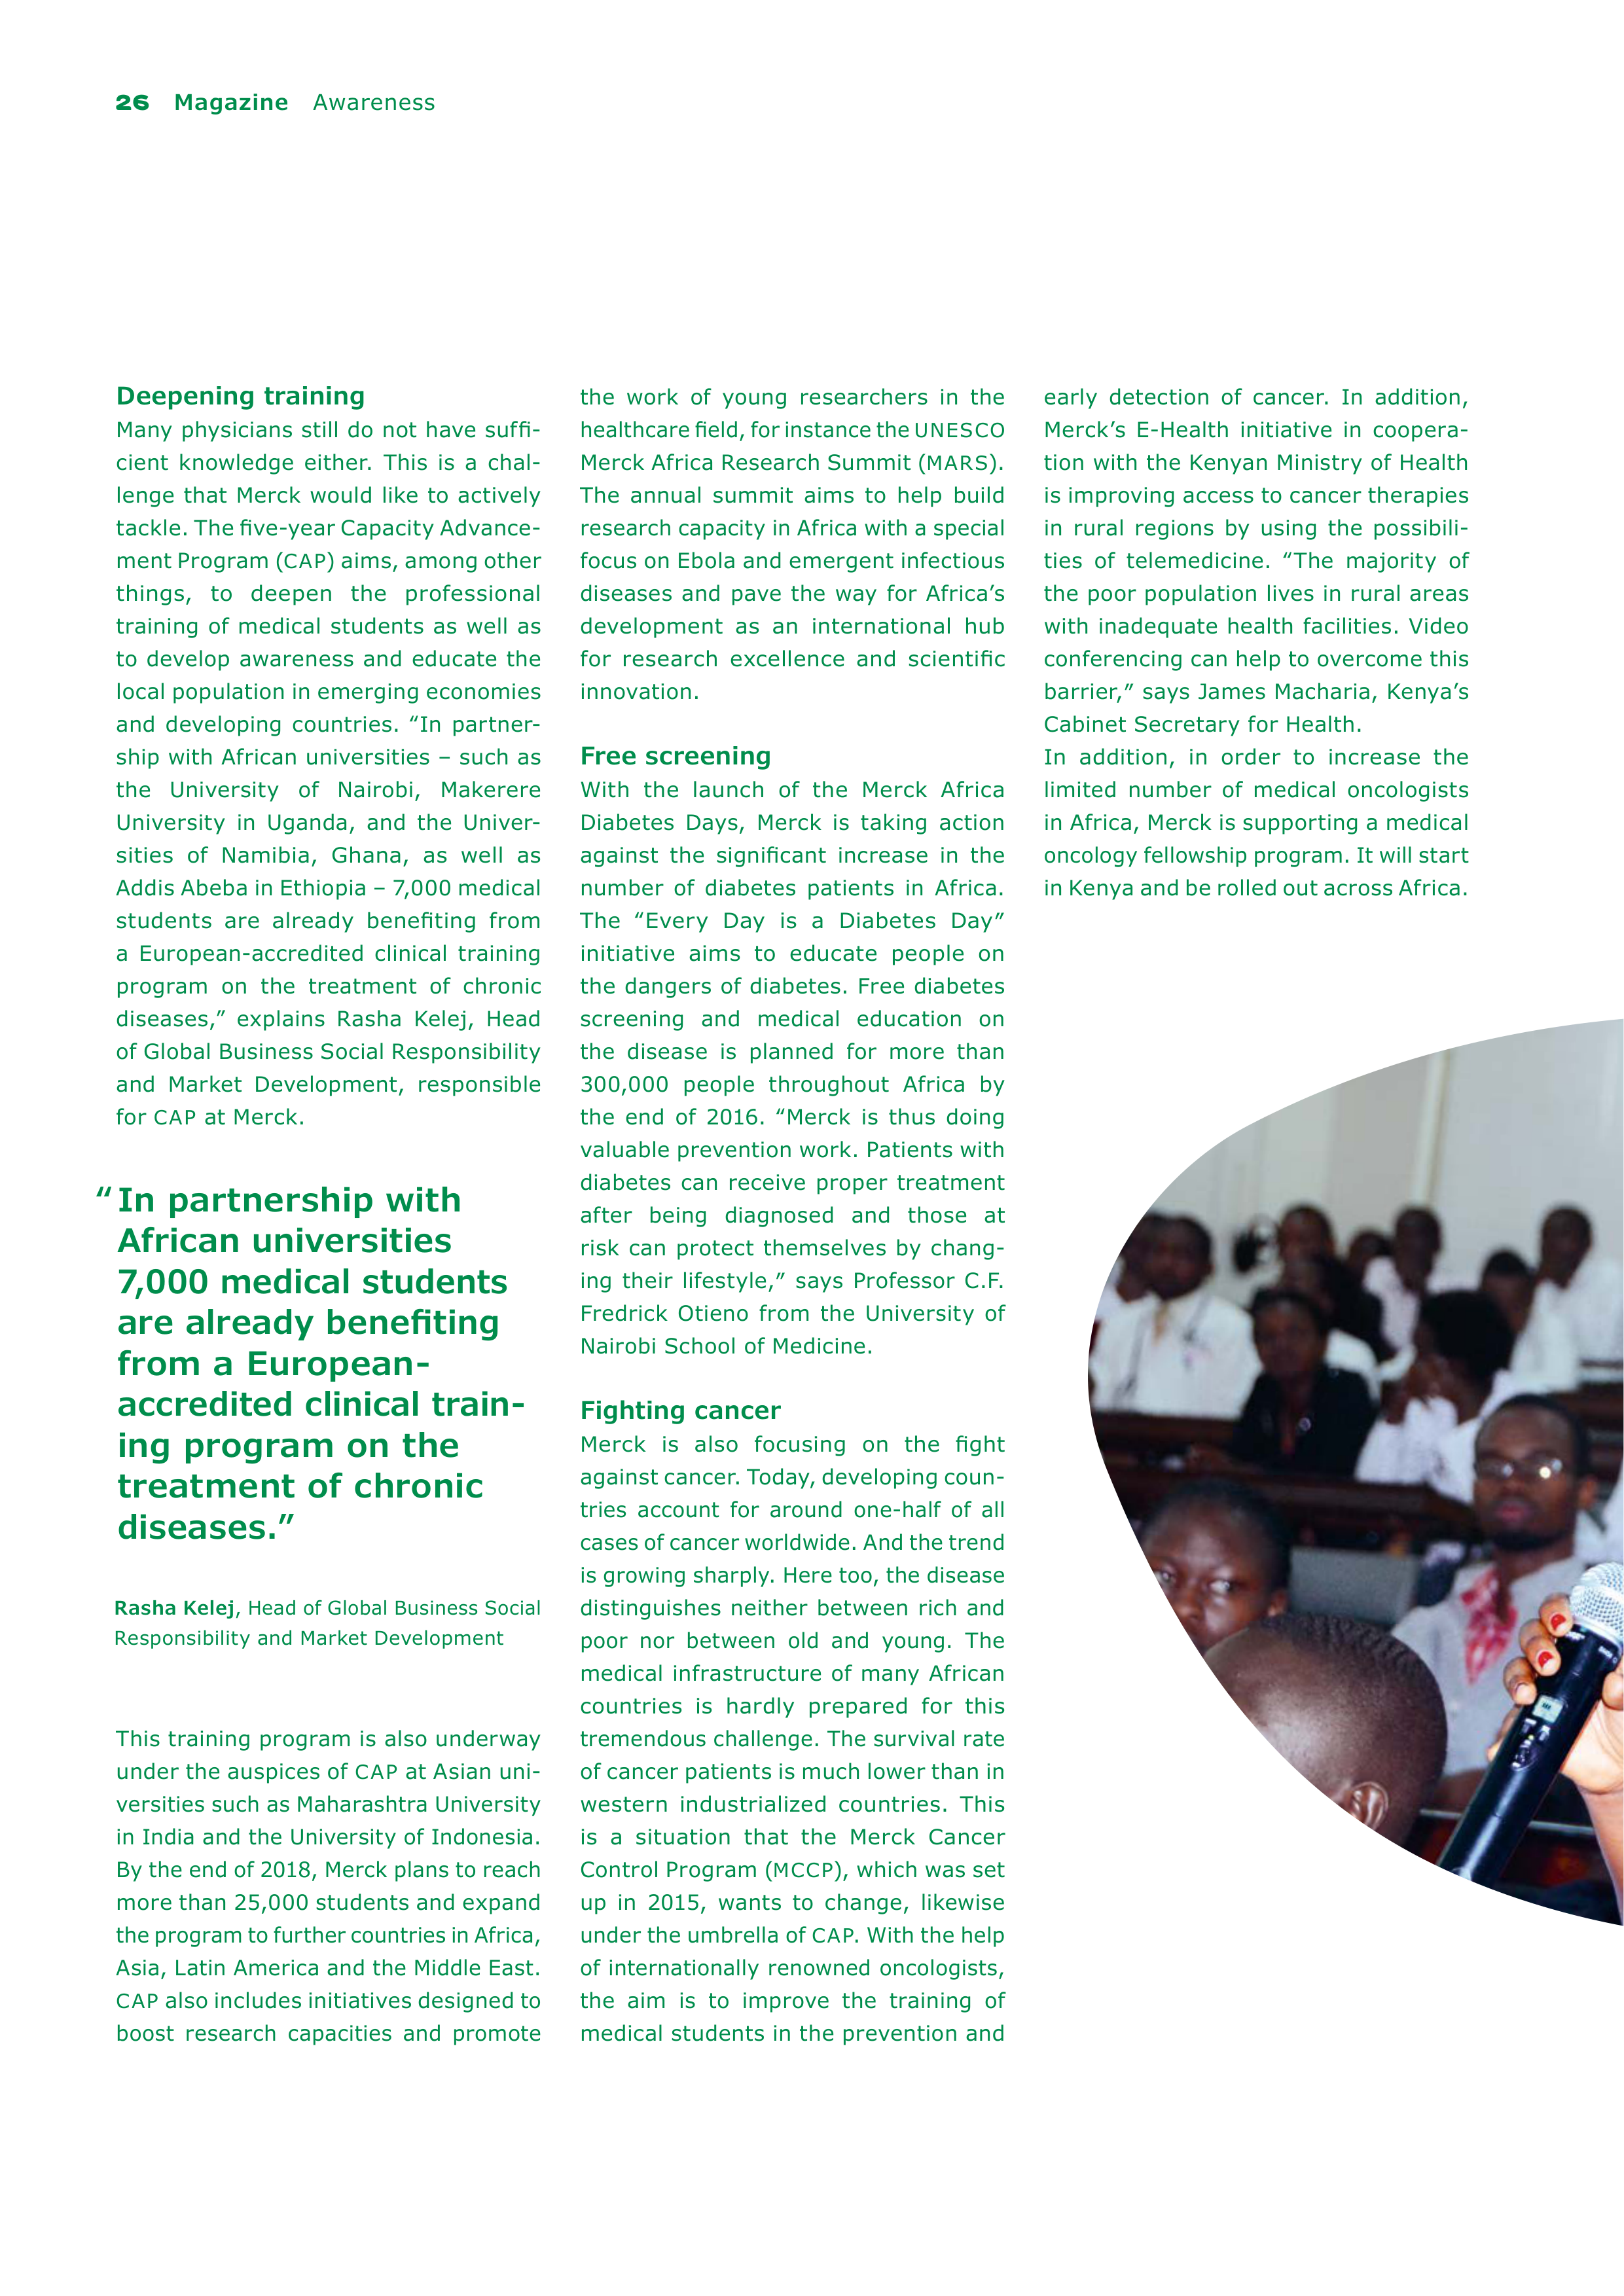
PLANNED HEADCOUNT
DEVELOPMENT OF MERCK
in Africa from now through 2020
Merck in Africa
Merck has been providing health-
care
services in Africa since 1897.
The company currently has around
400 employees across ten African
countries and plans to increase this
number to around 1,000 by 2020.
Merck wants to more than dou-
ble
its sales in Africa to € 500 mil-
lion by 2020. In November 2015,
Merck signed an agreement on the
local production of the diabetes
treatment Glucophage
®
in Algeria,
opened a new office in Nigeria and
launched the cell counter Muse
®
for
the detection of
HIV
. In addition,
Merck supports a wide range of initi-
atives within the health field, one of
its Corporate Responsibility strate-
gic spheres of activity. An important
goal is to eliminate the worm dis-
ease schistosomiasis in cooperation
with the World Health Organization
(
WHO
).
2020
2015
1,000
400

26
Magazine
Awareness
Deepening training
Many physicians still do not have suffi-
cient knowledge either. This is a chal-
lenge that Merck would like to actively
tackle. The five-year Capacity Advance-
ment Program (
CAP
) aims, among other
things, to deepen the professional
training of medical students as well as
to develop awareness and educate the
local population in emerging economies
and developing countries. ‟In partner-
ship with African universities – such as
the University of Nairobi, Makerere
University in Uganda, and the Univer
sities of Namibia, Ghana, as well as
Addis Abeba in Ethiopia – 7,000 medical
students are already benefiting from
a European-accredited clinical training
program on the treatment of chronic
diseases,” explains Rasha Kelej, Head
of Global Business Social Responsibility
and Market Development, responsible
for
CAP
at Merck.
This training program is also underway
under the auspices of
CAP
at Asian uni-
versities such as Maharashtra University
in India and the University of Indonesia.
By the end of 2018, Merck plans to reach
more than 25,000 students and expand
the program to further countries in Africa,
Asia, Latin America and the Middle East.
CAP
also includes initiatives designed
to
boost research capacities and promote
the work of young researchers in the
healthcare field, for instance the
UNESCO
Merck Africa Research Summit (
MARS
).
The annual summit aims to help build
research capacity in Africa with a special
focus on Ebola and emergent infectious
diseases and pave the way for Africa’s
development as an international hub
for research excellence and scientific
innovation.
Free screening
With the launch of the Merck Africa
Diabetes Days, Merck is taking action
against the significant increase in the
number of diabetes patients in Africa.
The ‟Every Day is a Diabetes Day″
initiative aims to educate people on
the
dangers of diabetes. Free diabetes
screening and medical education on
the disease is planned for more than
300,000 people throughout Africa by
the end of 2016. ‟Merck is thus doing
valuable prevention work. Patients with
diabetes can receive proper treatment
after being diagnosed and those at
risk can protect themselves by chang-
ing their lifestyle,″ says Professor C.F.
Fredrick Otieno from the University of
Nairobi School of Medicine.
Fighting cancer
Merck is also focusing on the fight
against cancer. Today, developing coun-
tries account for around one-half of all
cases of cancer worldwide. And the trend
is growing sharply. Here too, the disease
distinguishes neither between
rich and
poor nor between old and young.
The
medical infrastructure of many African
countries is hardly prepared for this
tremendous challenge. The survival rate
of cancer patients is much lower than in
western industrialized countries. This
is a situation that the Merck Cancer
Control Program (
MCCP
), which was set
up in 2015, wants to change, likewise
under the umbrella of
CAP
. With the help
of internationally renowned oncologists,
the aim is to improve the training of
medical students in the prevention and
early detection of cancer. In addition,
Merck’s E-Health initiative in coopera-
tion with the Kenyan Ministry of Health
is improving access to cancer therapies
in rural regions by using the possibili-
ties of telemedicine. ‟The majority of
the poor population lives in rural areas
with inadequate health facilities. Video
conferencing can help to overcome this
barrier,″ says James Macharia, Kenya’s
Cabinet Secretary for Health.
In addition, in order to increase the
limited number of medical oncologists
in Africa, Merck is supporting a medical
oncology fellowship program. It will start
in Kenya and be rolled out across Africa.
“ In partnership with
African universities
7,000 medical students
are already benefiting
from a European-
accredited clinical train-
ing program on the
treatment of chronic
diseases.”
Rasha Kelej
, Head of Global Business Social
Responsibility and Market Development

Awareness
Magazine
27
The Merck Capacity
Advancement Program is
supporting Zena Ali, a diabetes patient
who lives in a slum outside Nairobi.
Students at
Makerere University
in Uganda discussing clinical
diabetes management.
The stigma of infertility
A further
CAP
initiative is addressing the discrim-
ination of childless or infertile women. In some
cultures, the private problem of infertility can
escalate into a public stigma with serious conse-
quences. Childless women are often isolated and
suffer from physical and mental abuse. The ‟More
than a Mother″ campaign launched by Merck
together with the Kenya Women Parliamentary
Association (
KEWOPA
) and the University of Nairobi
is tackling this problem.
The program will not only provide medical educa-
tion and awareness for medical students and
healthcare providers, but it will also help govern-
ments to define policies to improve access to safe
and effective fertility care and address the need
for interventions. Joyce Lay, Kenyan Member of
Parliament and ‟More than a Mother″ ambassador,
says, ‟This initiative will define several interven-
tions to reduce the social suffering and stigmati-
zation of infertile women and raise awareness
about infertility prevention, male infertility and
the necessity for a team approach to family building
among couples.”
The ‟More than a Mother” initiative is being accom-
panied by a social media campaign in order to
enable the affected women to share their stories
of stigma.
28
Magazine
Growth
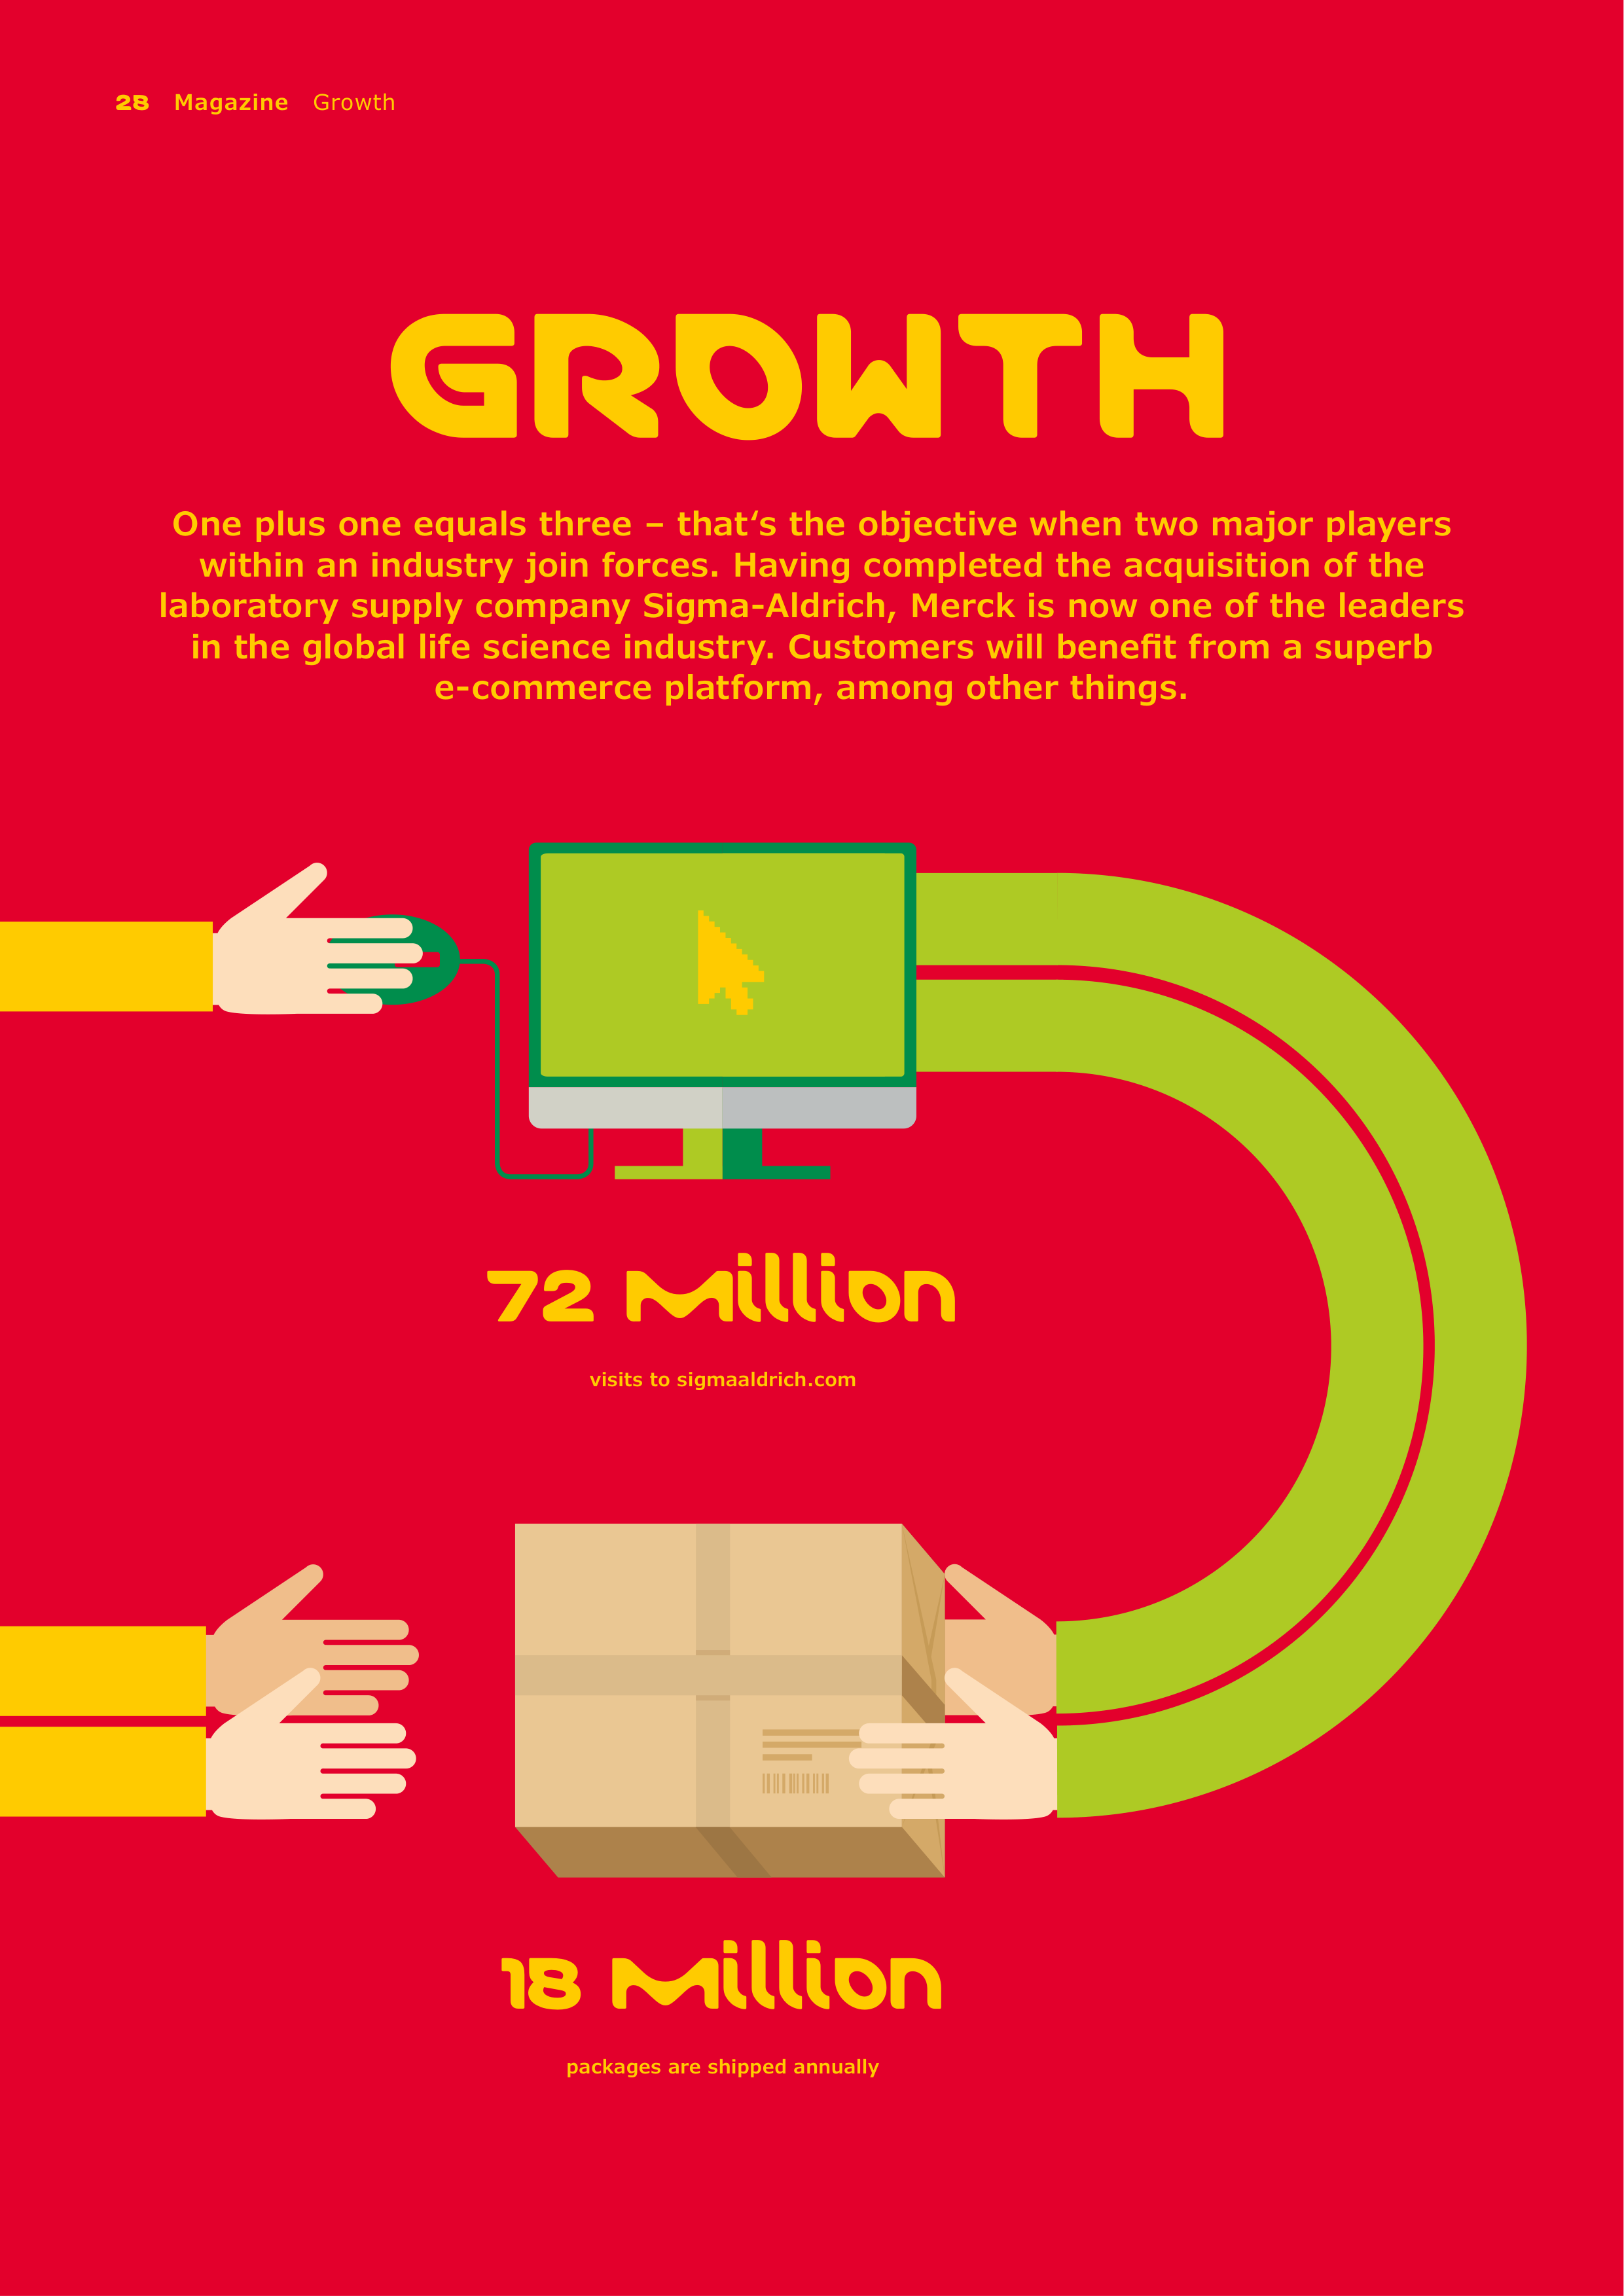
72 million
visits to sigmaaldrich.com
GROWTH
One plus one equals three – that‘s the objective when two major players
within an industry join forces. Having completed the acquisition of the
laboratory supply company Sigma-Aldrich, Merck is now one of the leaders
in the global life science industry. Customers will benefit from a superb
e-commerce platform, among other things.
18 million
packages are shipped annually
Growth
Magazine
29
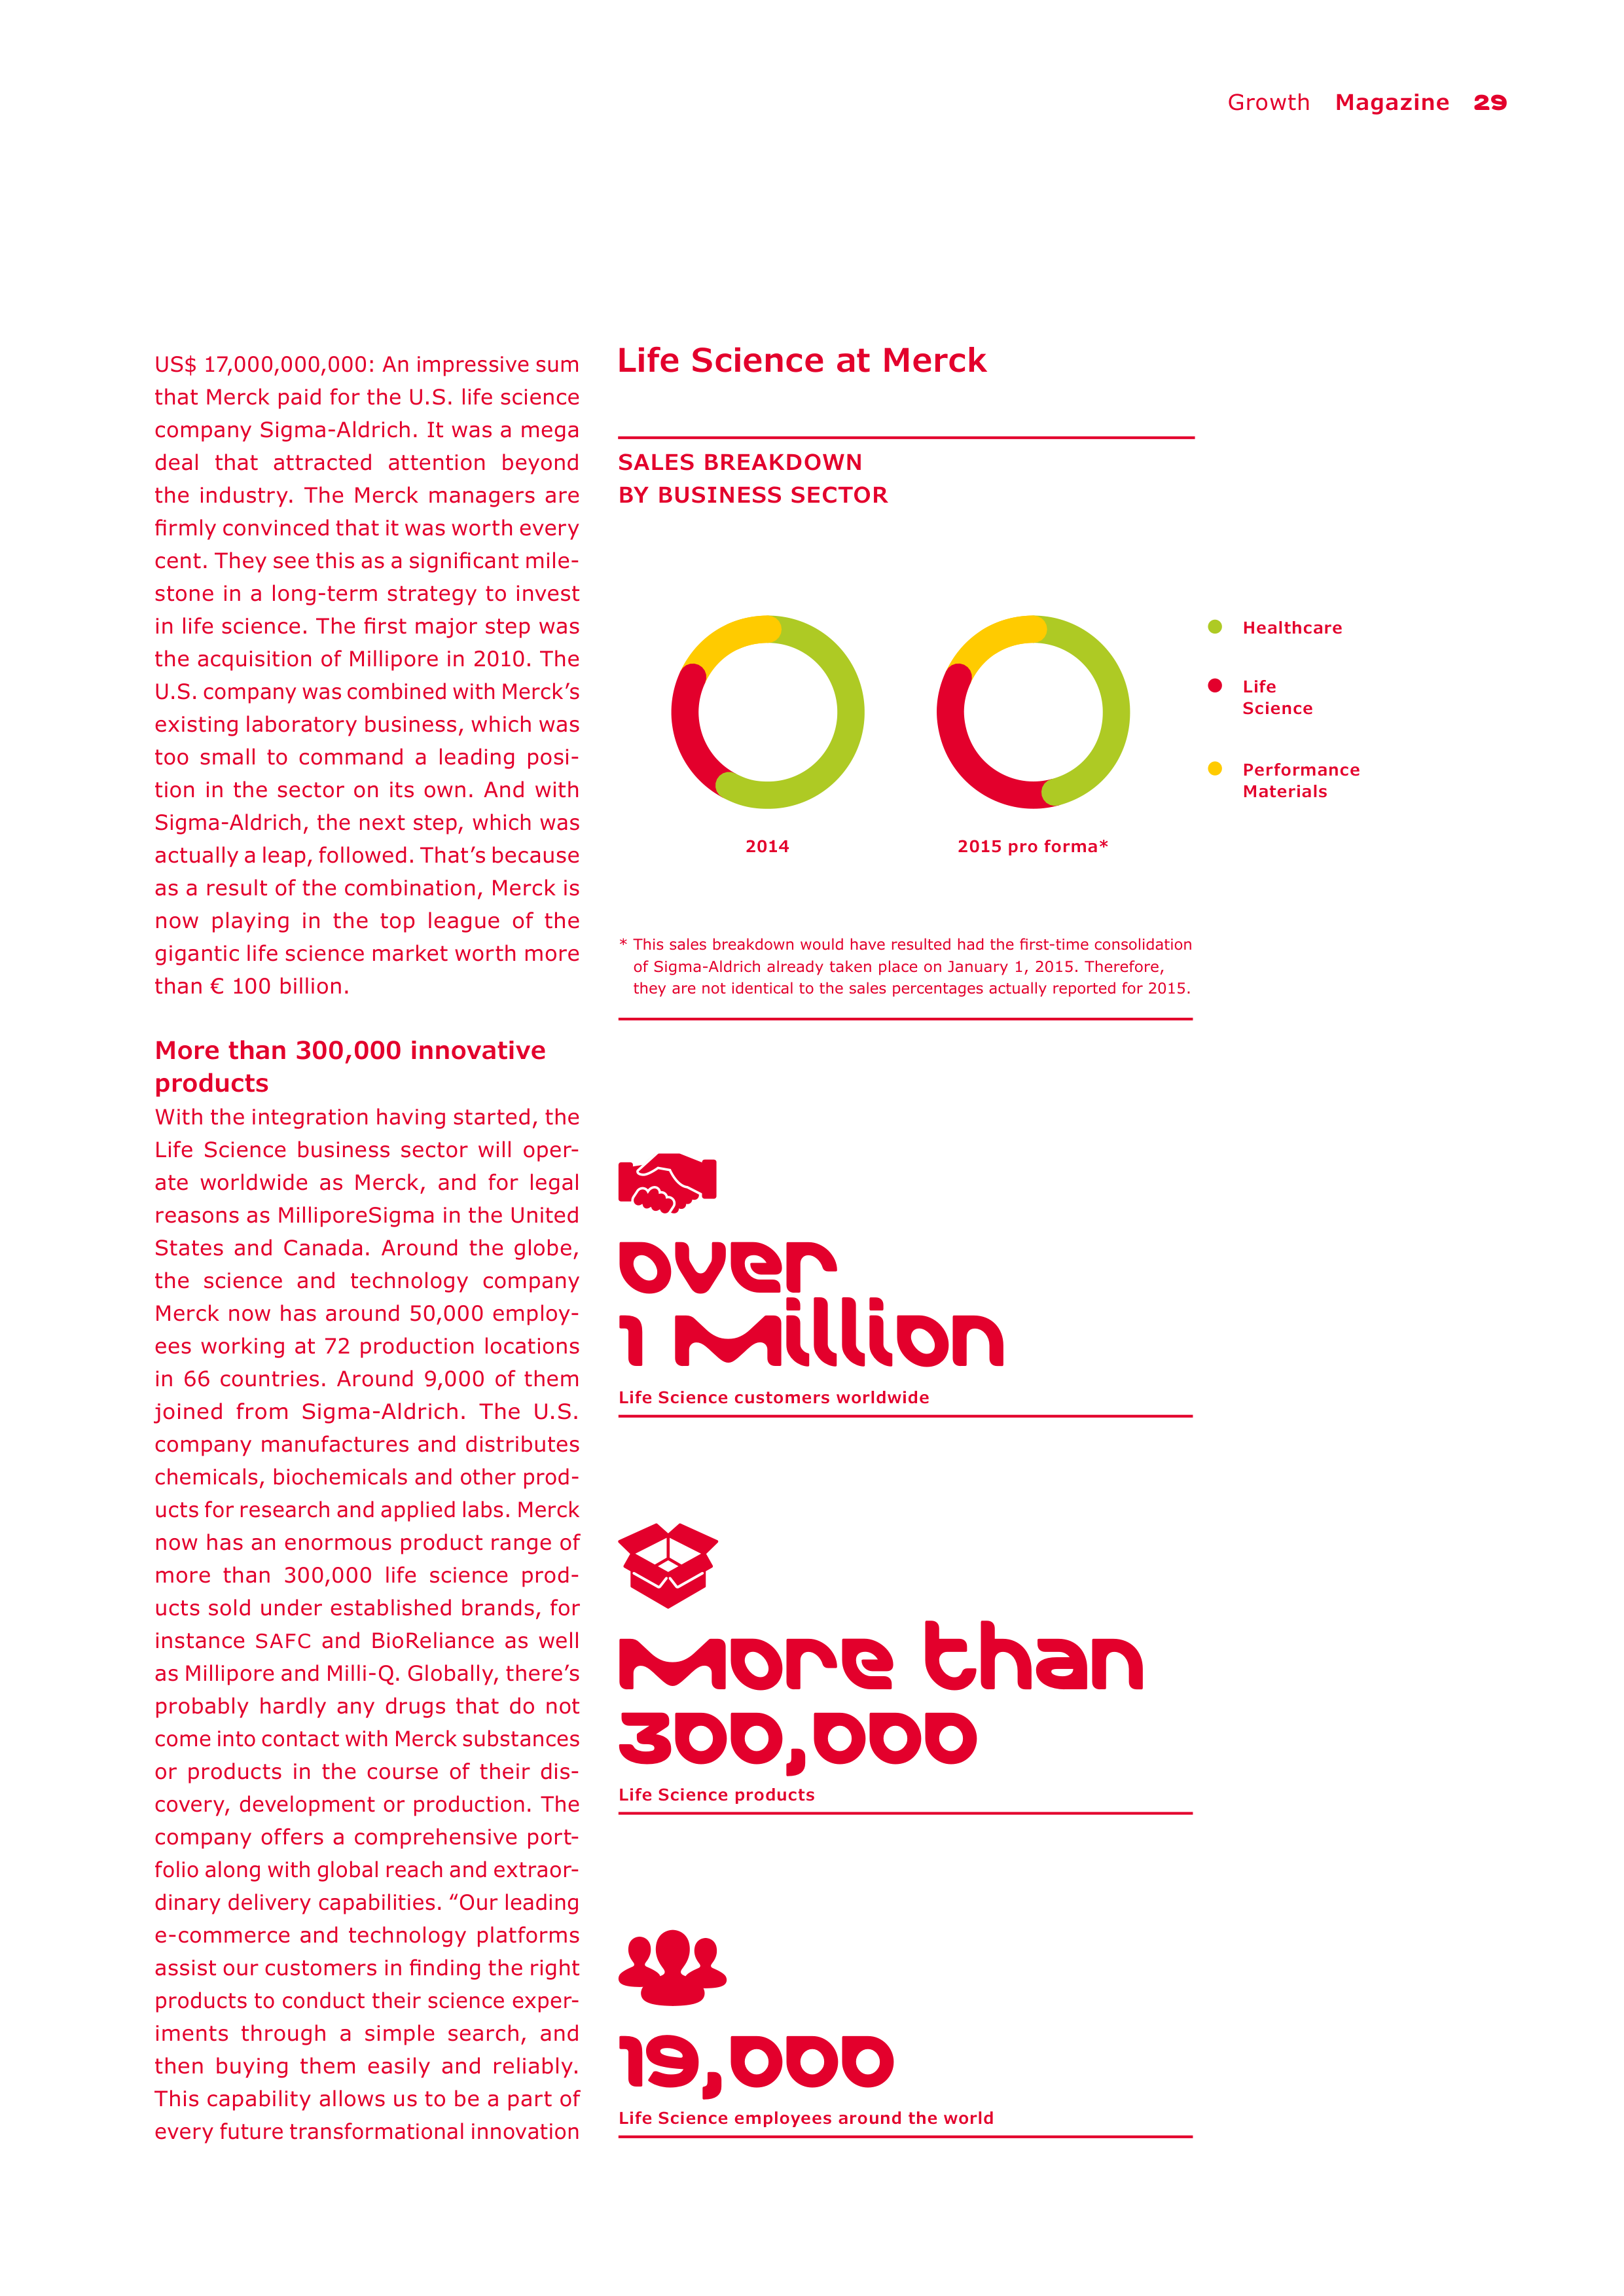
Healthcare
Performance
Materials
Life
Science
US$ 17,000,000,000: An impressive sum
that Merck paid for the U.S. life science
company Sigma-Aldrich. It was a mega
deal that attracted attention beyond
the industry. The Merck managers are
firmly convinced that it was worth every
cent. They see this as a significant mile-
stone in a long-term strategy to invest
in life science. The first major step was
the acquisition of Millipore in 2010. The
U.S. company was combined with Merck’s
existing laboratory business, which was
too small to command a leading posi-
tion in the sector on its own. And with
Sigma-Aldrich, the next step, which was
actually a leap, followed. That’s because
as a result of the combination, Merck is
now playing in the top league of the
gigantic life science market worth more
than € 100 billion.
More than 300,000 innovative
products
With the integration having started, the
Life Science business sector will oper-
ate worldwide as Merck, and for legal
reasons as MilliporeSigma in the United
States and Canada. Around the globe,
the science and technology company
Merck now has around 50,000 employ-
ees working at 72 production locations
in 66 countries. Around 9,000 of them
joined from Sigma-Aldrich. The U.S.
company manufactures and distributes
chemicals, biochemicals and other prod
ucts for research and applied labs. Merck
now has an enormous product range of
more than 300,000 life science prod-
ucts sold under established brands, for
instance
SAFC
and BioReliance as well
as Millipore and Milli-Q. Globally, there’s
probably hardly any drugs that do not
come into contact with Merck substances
or products in the course of their dis-
covery, development or production. The
company offers a comprehensive port-
folio along with global reach and extra
or-
dinary delivery capabilities. ‟Our leading
e-commerce and technology platforms
assist our customers in finding the right
products to conduct their science exper-
iments through a simple search, and
then buying them easily and reliably.
This capability allows us to be a part of
every future transformational innovation
SALES BREAKDOWN
BY BUSINESS SECTOR
2014
Life Science at Merck
over
1 million
Life Science customers worldwide
more than
300,000
Life Science products
19,000
Life Science employees around the world
2015 pro forma*
* This sales breakdown would have resulted had the first-time consolidation
of Sigma-Aldrich already taken place on January 1, 2015. Therefore,
they are not identical to the sales percentages actually reported for 2015.
30
Magazine
Growth
was also one of the key drivers of the
acquisition. Of course Merck will utilize
the platform in order to market not only
the Sigma-Aldrich additions, but also
its legacy life science products. With
just a few clicks, millions of visitors
to the portal can search the compre-
hensive electronic catalog, select and
purchase products. Visitors find exactly
what they are looking for as well as
recommended related products based
on real-time behavioral analytics. As
a leader in online scientific content,
Merck is also able to provide the rele-
vant white papers, protocols and peer
review articles. With an order number
or credit card, customers can use the
secure platform to quickly and easily
order products, look up prices, select
rush delivery, plan the delivery date,
check invoices, and much more. "Our
e-commerce platform integrates all our
capabilities to provide customers with
easy access to all that we can offer
them," says Christos Ross, Head of
Integrated Supply Chain Operations.
Not only the e-commerce platform, but
also the entire supply chain is highly
efficient. The majority of the hundreds of
thousands of products can be delivered
within 24 hours around the world. "Our
primary objective is to deliver quality
products to our customers through our
manufacturing operations and a com-
bined network of 130 global distribution
centers to get the right product to the
right place at the right time," empha-
sizes Ross. To fuel its growth strategy in
the digital age, Merck is thus counting
on e-commerce as a distribution channel
so that its billion dollar investment in
the life science sector will soon pay off.
in the life science market,″ says Silji
Abraham, Chief Infor
mation Officer for
Life
Science. ‟And I
can easily imagine
a future where our products and services
are found in every lab around the world.″
Close to customers
In order to solve the toughest problems
in the industry, the new team is inten-
sifying its collaboration with the global
scientific community, in other words
customers. In the dynamically growing
international life science market, it’s
clear that customer needs are growing.
They want top quality, global solutions,
a broad range of possibilities and first-
rate services. So the aim is to perfectly
fulfill these needs in order to further
raise competitiveness. After all, what’s
good for customers is also good for
business and employees. In research,
development and along the entire bio-
tech production chain, Merck wants to
offer scientists the best possible sup-
port – through professional competence
in applications technology and process
planning. In order to be close to cus-
tomers, independent commercial areas
are organized into regions. The chief
aims are to further and launch innova-
tions that are aligned with industry
needs.
Efficient e-commerce platform
When it comes to winning over cus-
tom
ers from the scientific community,
an efficient e-commerce platform is
another important factor. And that's
where Merck is well ahead of the game.
By acquiring Sigma-Aldrich, the com-
pany has the leading e-commerce plat-
form in the life science industry, which
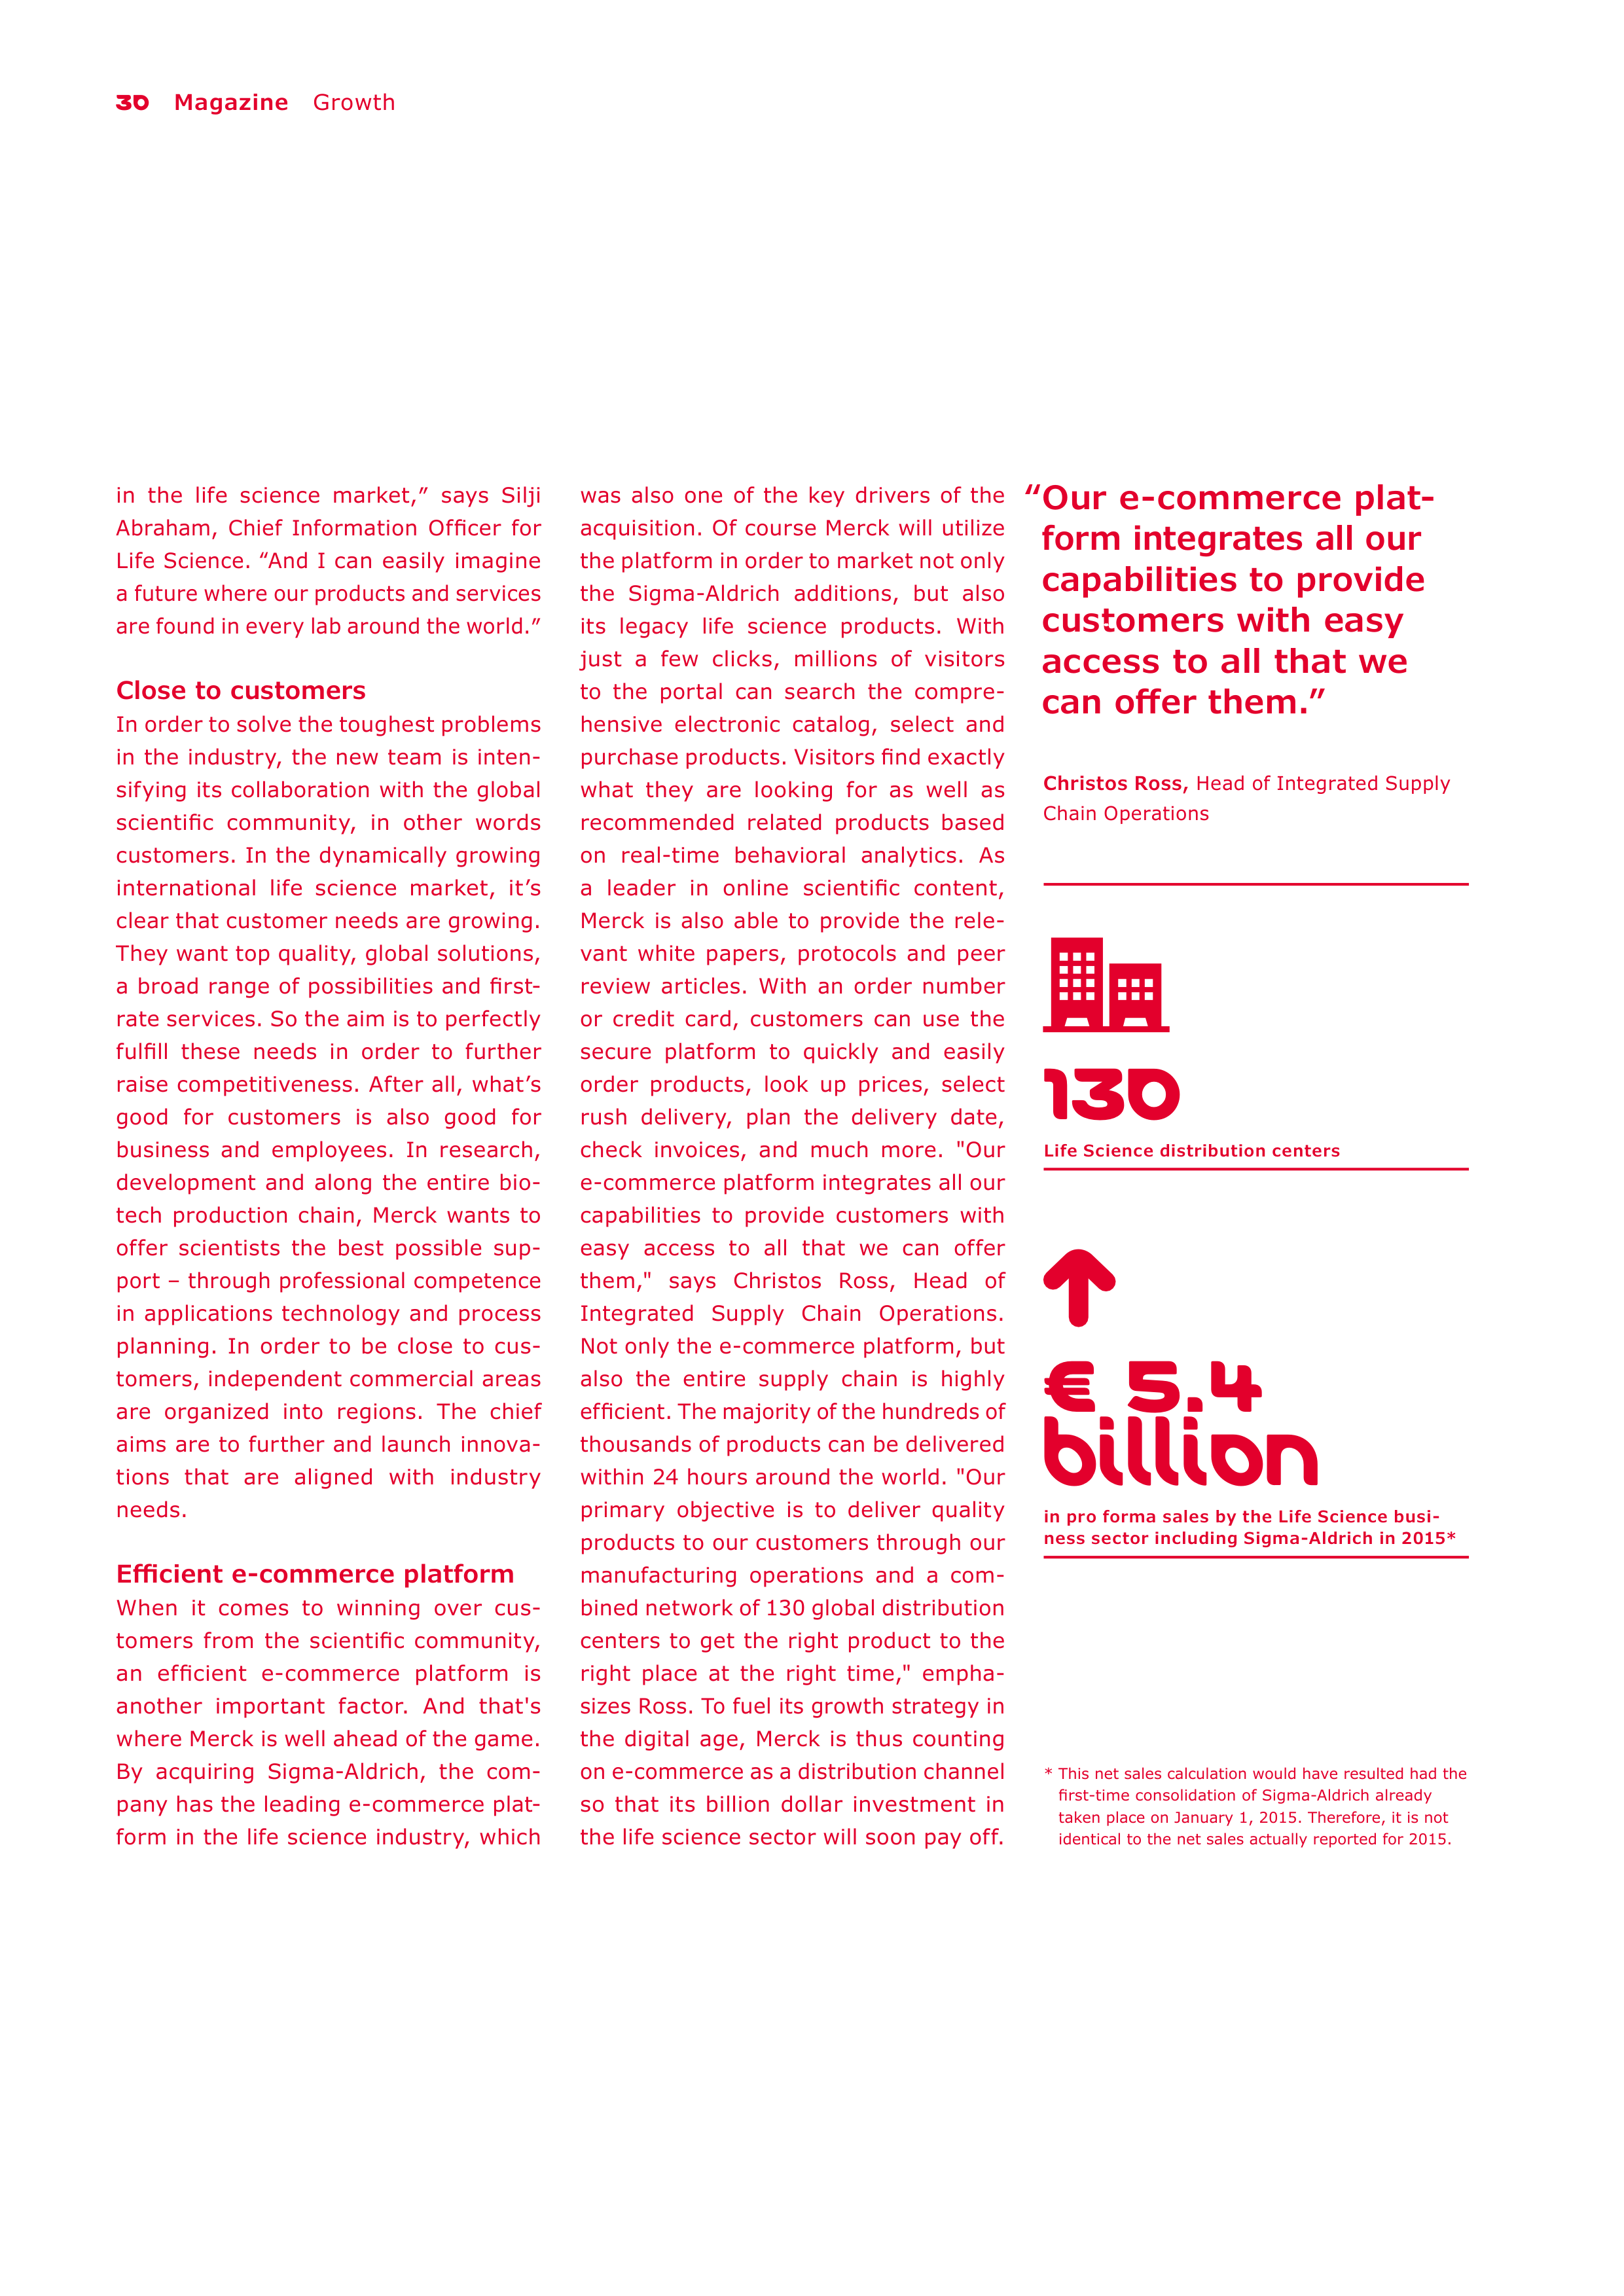
“Our e-commerce plat-
form integrates all our
capabilities to provide
customers with easy
access to all that we
can offer them.”
Christos Ross,
Head of Integrated Supply
Chain Operations
130
Life Science distribution centers
€ 5.4
billion
in pro forma sales by the Life Science busi-
ness sector including Sigma-Aldrich in 2015*
* This net sales calculation would have resulted had the
first-time consolidation of Sigma-Aldrich already
taken place on January 1, 2015. Therefore, it is not
identical to the net sales actually reported for 2015.
01
TO OUR
SHAREHOLDERS
Pages 31 – 42
TO OUR
SHAREHOLDERS
Pages 31 – 42
033
Letter from Karl-Ludwig Kley
038
The Executive Board
040
Our Shares

Letter from Karl-Ludwig Kley
To Our Shareholders
33
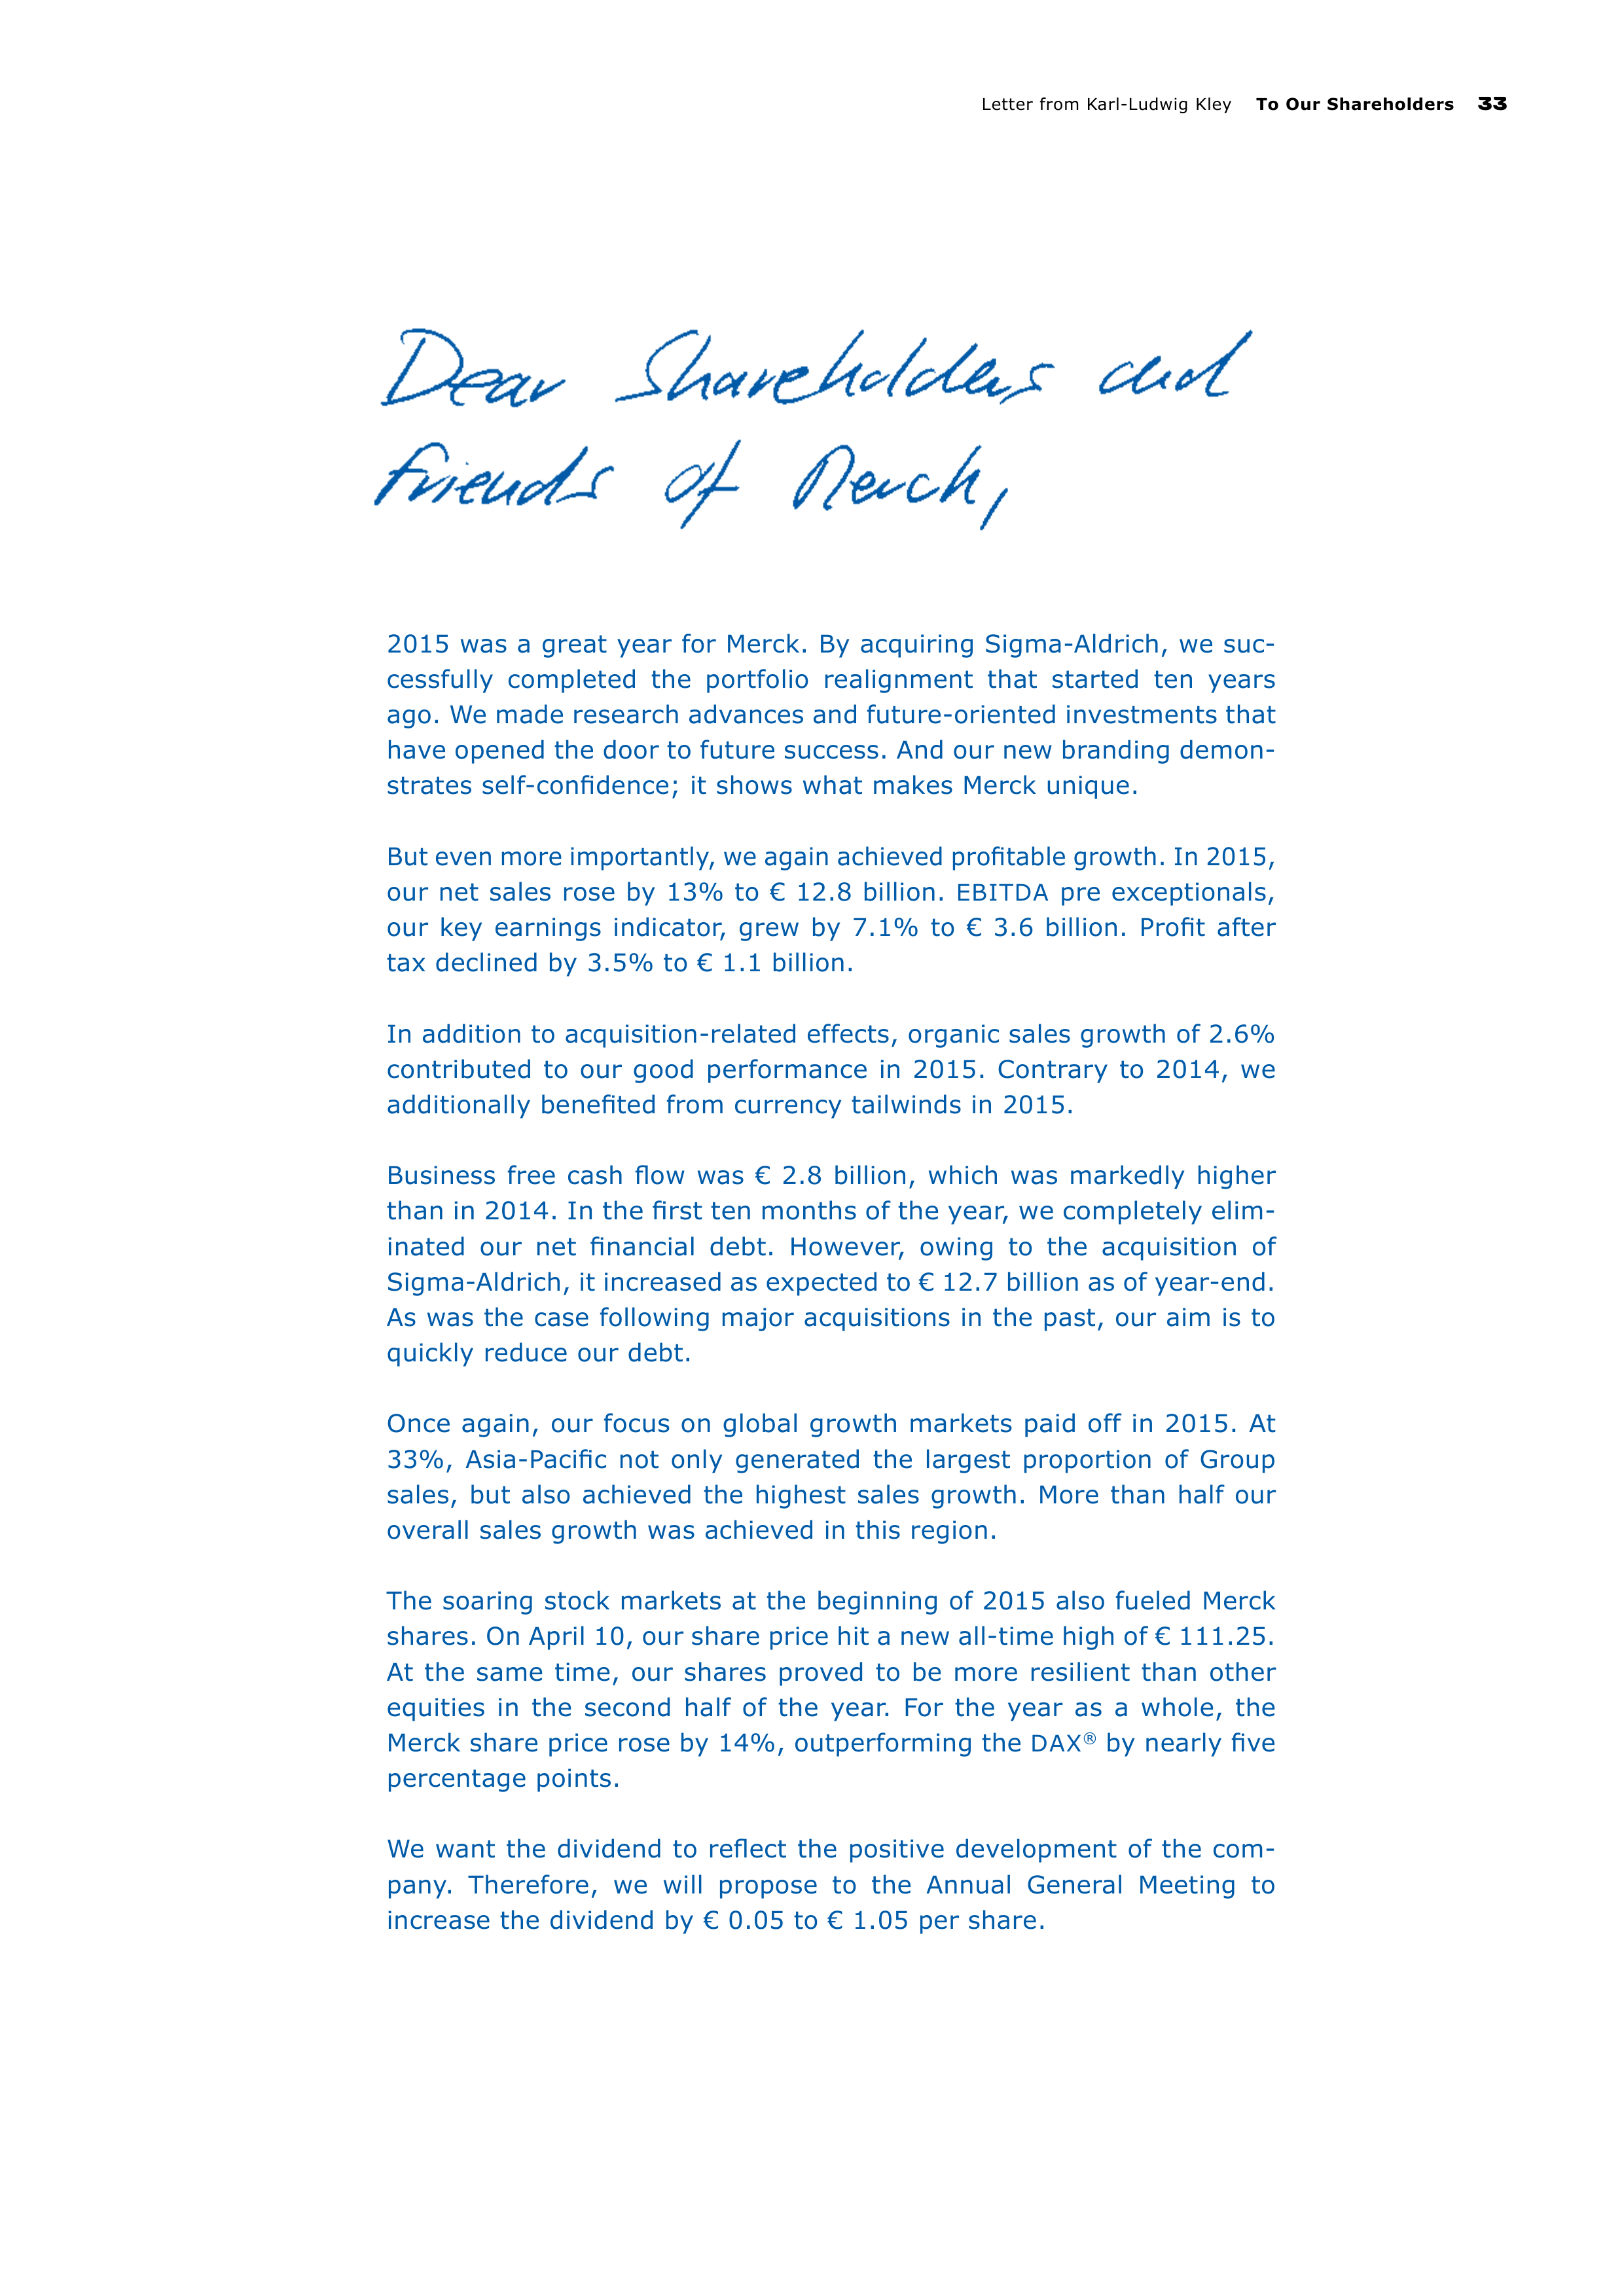
2015 was a great year for Merck. By acquiring Sigma-Aldrich, we suc-
cessfully completed the portfolio realignment that started ten years
ago. We made research advances and future-oriented investments that
have opened the door to future success. And our new branding demon-
strates self-confidence; it shows what makes Merck unique.
But even more importantly, we again achieved profitable growth. In 2015,
our net sales rose by 13% to € 12.8 billion.
EBITDA
pre exceptionals,
our key earnings indicator, grew by 7.1% to € 3.6 billion. Profit after
tax declined by 3.5% to € 1.1 billion.
In addition to acquisition-related effects, organic sales growth of 2.6%
contributed to our good performance in 2015. Contrary to 2014, we
additionally benefited from currency tailwinds in 2015.
Business free cash flow was € 2.8 billion, which was markedly higher
than in 2014. In the first ten months of the year, we completely eli
m-
inated our net financial debt. However, owing to the acquisition of
Sigma-Aldrich, it increased as expected to € 12.7 billion as of year-end.
As was the case following major acquisitions in the past, our aim is to
quickly reduce our debt.
Once again, our focus on global growth markets paid off in 2015. At
33%, Asia-Pacific not only generated the largest proportion of Group
sales, but also achieved the highest sales growth. More than half our
overall sales growth was achieved in this region.
The soaring stock markets at the beginning of 2015 also fueled Merck
shares. On April 10, our share price hit a new all-time high of € 111.25.
At the same time, our shares proved to be more resilient than other
equities in the second half of the year. For the year as a whole, the
Merck share price rose by 14%, outperforming the
DAX
®
by nearly five
percentage points.
We want the dividend to reflect the positive development of the com-
pany. Therefore, we will propose to the Annual General Meeting to
increase the dividend by € 0.05 to € 1.05 per share.
34
To Our Shareholders
Letter from Karl-Ludwig Kley
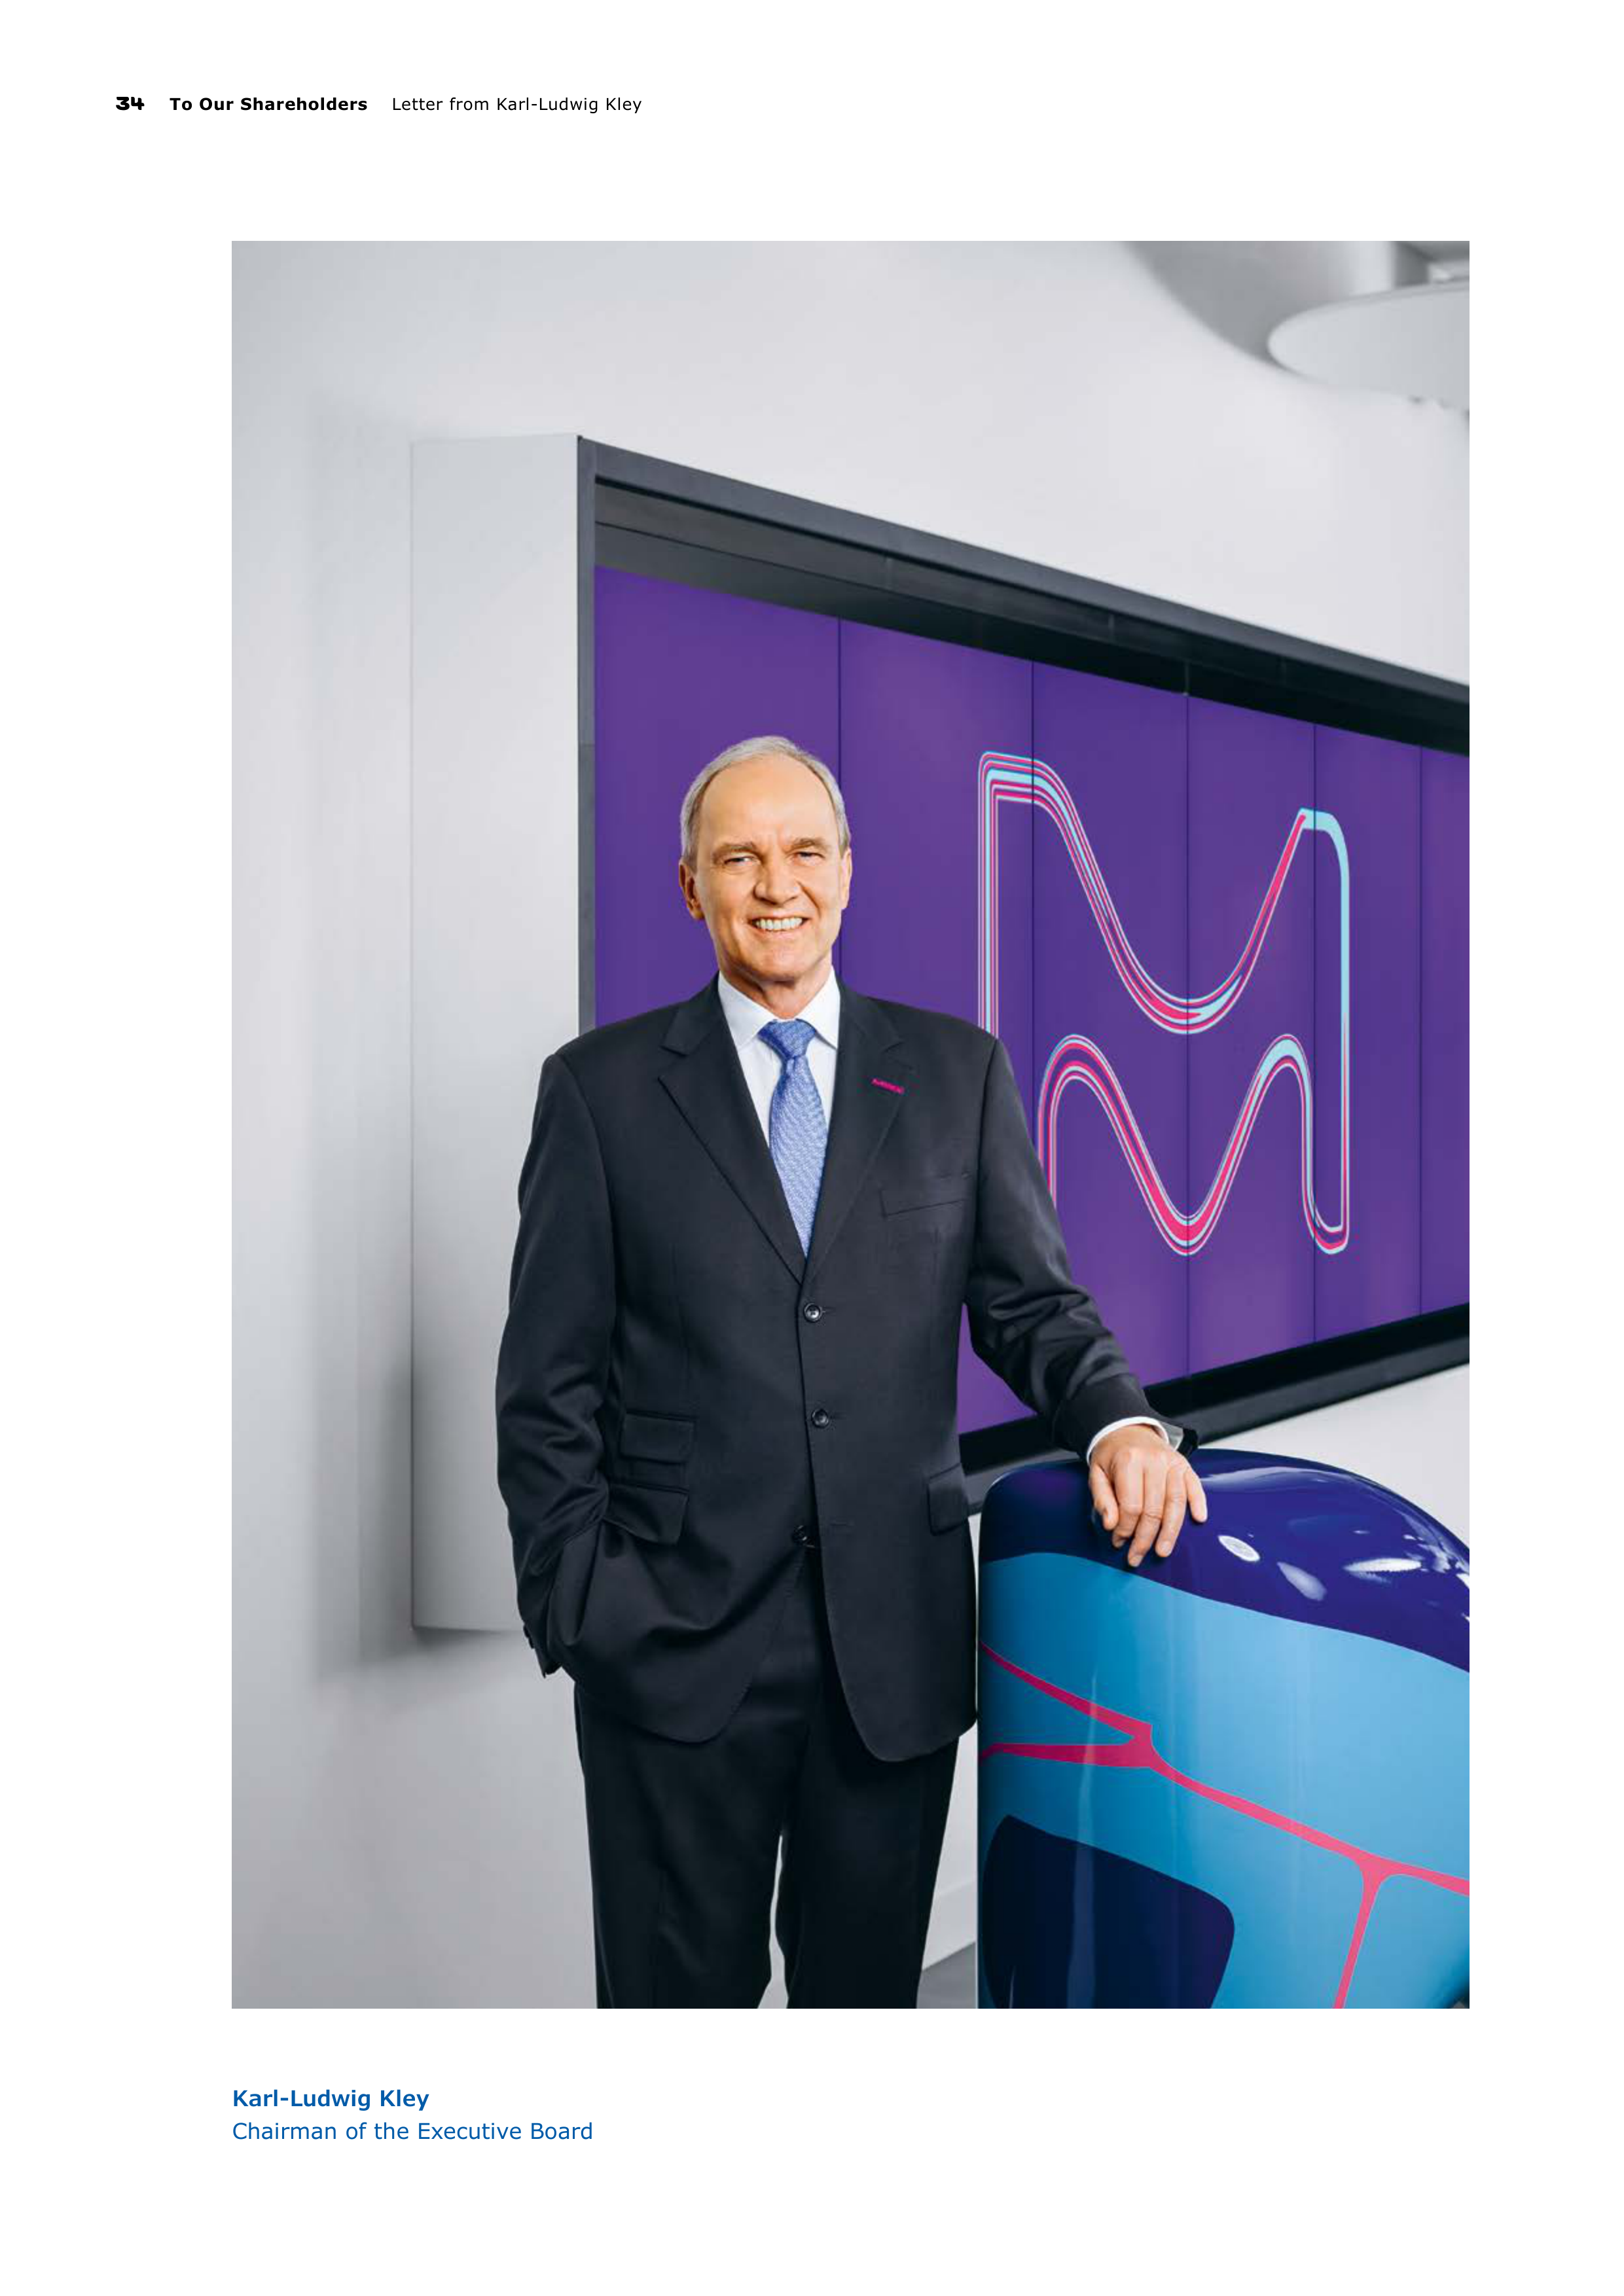
Karl-Ludwig Kley
Chairman of the Executive Board
Letter from Karl-Ludwig Kley
To Our Shareholders
35
Five changes that took place in 2015 were particularly important to
Merck’s strategic development:
• The acquisition of the life science company Sigma-Aldrich is the big-
gest takeover in our company’s history of nearly 350 years. Merck has
thus become one of the world’s largest players in the life science
industry. We can now offer our customers a broader product portfolio
than any other company and we now have the leading e-commerce
platform in the sector.
With this move, we have not only considerably expanded our Life
Science business, but also completed the realignment of our portfolio
for now. Since 2007, we have been repositioning Merck through
acquisitions and divestments. This has fundamentally changed the
company and secured its future viability. Today, Merck has three
strong pillars: Healthcare, Life Science and Performance Materials.
Each business sector can now further develop and grow its busi-
nesses, both with its own resources and in synergy with the other
business sectors.
• In 2015, our immuno-oncology research made good progress. Its aim
is to harness the human immune system to fight cancer cells. As of
the end of 2015, we had commenced 20 clinical trials designed to test
the efficacy of our active ingredient avelumab. Lung, ovarian, gastric,
and bladder cancer are the most important indications.
The results so far are promising and have been recognized by the
regulatory authorities in Europe and the United States. We are
convinced that Merck can make an important contribution in immuno-
oncology and sustainably improve the lives of patients. We want to
become a leader in this highly promising market.
• Once again, Performance Materials proved to be a reliable source of
strength and innovative ability in 2015. We clearly defended our
global market leadership in liquid crystals, particularly thanks to
continuous new developments. For example,
UB
-
FFS
technology
represented a breakthrough in the energy efficiency of displays for
mobile devices. We won the German Innovation Award for this in 2015.
The
OLED
(organic light-emitting diodes) business has exceeded our
own expectations. It has grown rapidly and we have gained numerous
new customers. By investing in research and production in Korea and
Darmstadt, we are paving the way for further success in this future
market.
36
To Our Shareholders
Letter from Karl-Ludwig Kley
• We want to become even more innovative and pursue opportunities
beyond our existing businesses. This is why we are building
an Innovation Center at the heart of our global headquarters in
Darmstadt. The construction work is making good progress.
In 2015, a modular Innovation Center was inaugurated. Internal
project teams and selected start-ups moved in to start work on inter-
disciplinary approaches and pursue new ideas. The businesses will
still be responsible for product innovations and developing existing
technologies further. But with the Innovation Center, we are creating
scope to move beyond this. That’s because we not only want to be
part of technological trends, we want to shape them.
• The launch of our new branding attracted attention well beyond our
company. It is vibrant and bold – and suits us splendidly. Merck has
changed considerably in recent years. We are no longer a traditional
supplier of chemicals and pharmaceuticals, but rather a leading
science and technology company with global reach. With the new
brand, we can present Merck the way it is today. The fascinating world
seen through a microscope gave us inspiration for the design of the
visual elements.
We’re showing that we are a strong, unified company, which is why we
stopped using the independent divisional brands. Merck Serono and
Merck Millipore are now simply called Merck. Unfortunately, nothing has
changed in terms of the fact that we need to operate under different
names in the United States and Canada. However, the new brand
gives us creative possibilities to show on both sides of the Atlantic that
we are one. And it strongly differentiates us from the competition. We
are now universally unmistakable.
As you can see, a lot changed at Merck in 2015. At the same time, we
remained true to our entrepreneurial values. We are resolutely focused
on what customers and patients want and need. Our commitment
to quality and our passion for discoveries are unabated. We are aiming
for long-term, sustainable growth in line with our six company values –
courage, achievement, responsibility, respect, integrity, and transpar-
ency – as the yardstick for our work.
This combination of a strong identity and a willingness to embrace
change is what makes Merck successful – and always will.
Merck is better positioned than ever before. We can be proud of what
Merck is today: a leading science and technology company whose ideas
and products can really make a difference in the world. With our three
business sectors Healthcare, Life Science and Performance Materials, we
are not only successful, but also improve the lives of patients, customers
and partners around the world.
Letter from Karl-Ludwig Kley
To Our Shareholders
37
Our nearly 50,000 employees make all of this possible. Across the globe,
they seek new solutions and the best answers for our customers. Through
their passion for discovery, creativity and personal commitment, they
build Merck’s success each and every day. I owe my thanks to every
single one of them.
As already announced in October 2015, I will resign as Chairman of the
Executive Board at the end of April 2016. Over the past several years,
my successor Stefan Oschmann and I have cooperated superbly. He
has significantly helped to make Merck fit for the future. I know that
the company is in good hands with him.
My years at Merck were challenging, exciting and fulfilling. It was a priv-
ilege
to lead this great company through major changes and to set the
course for a successful future. I thank you for your trust and support
during this time. Please remain loyal to Merck and look forward to the
next chapter of this company’s nearly 350-year success story.
Karl-Ludwig Kley
Chairman of the Executive Board
38
To Our Shareholders
The Executive Board
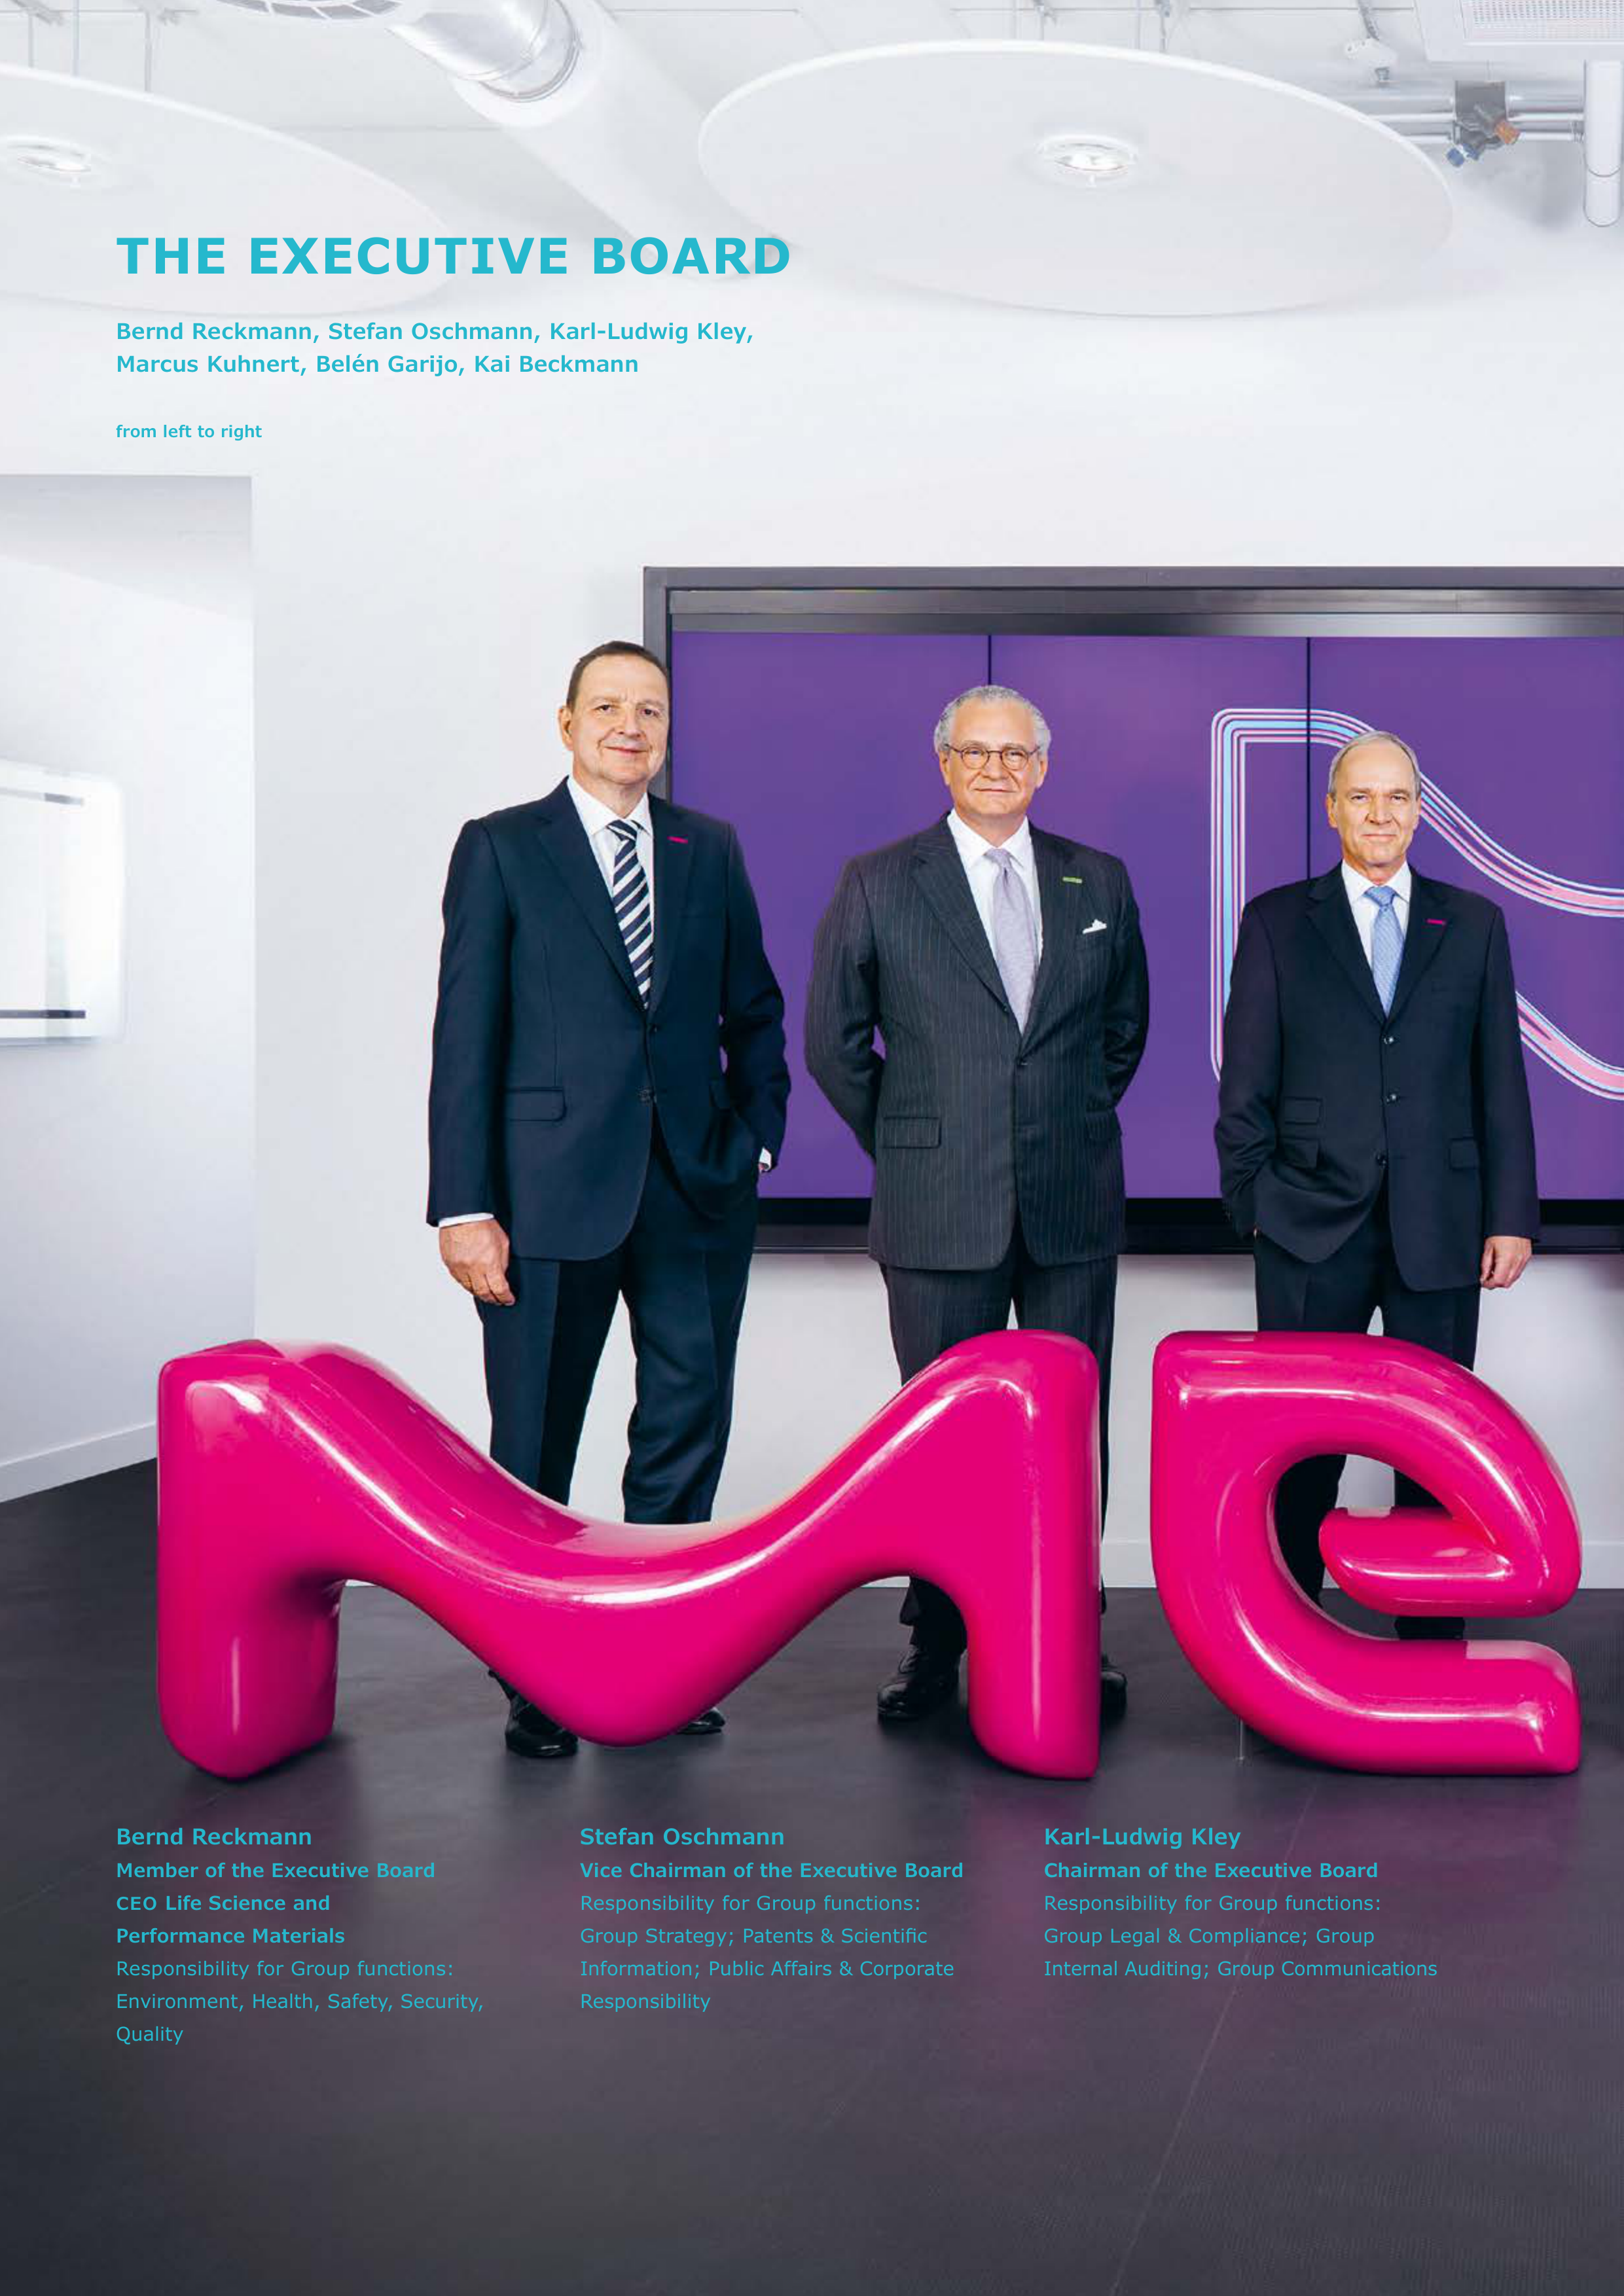
THE EXECUTIVE BOARD
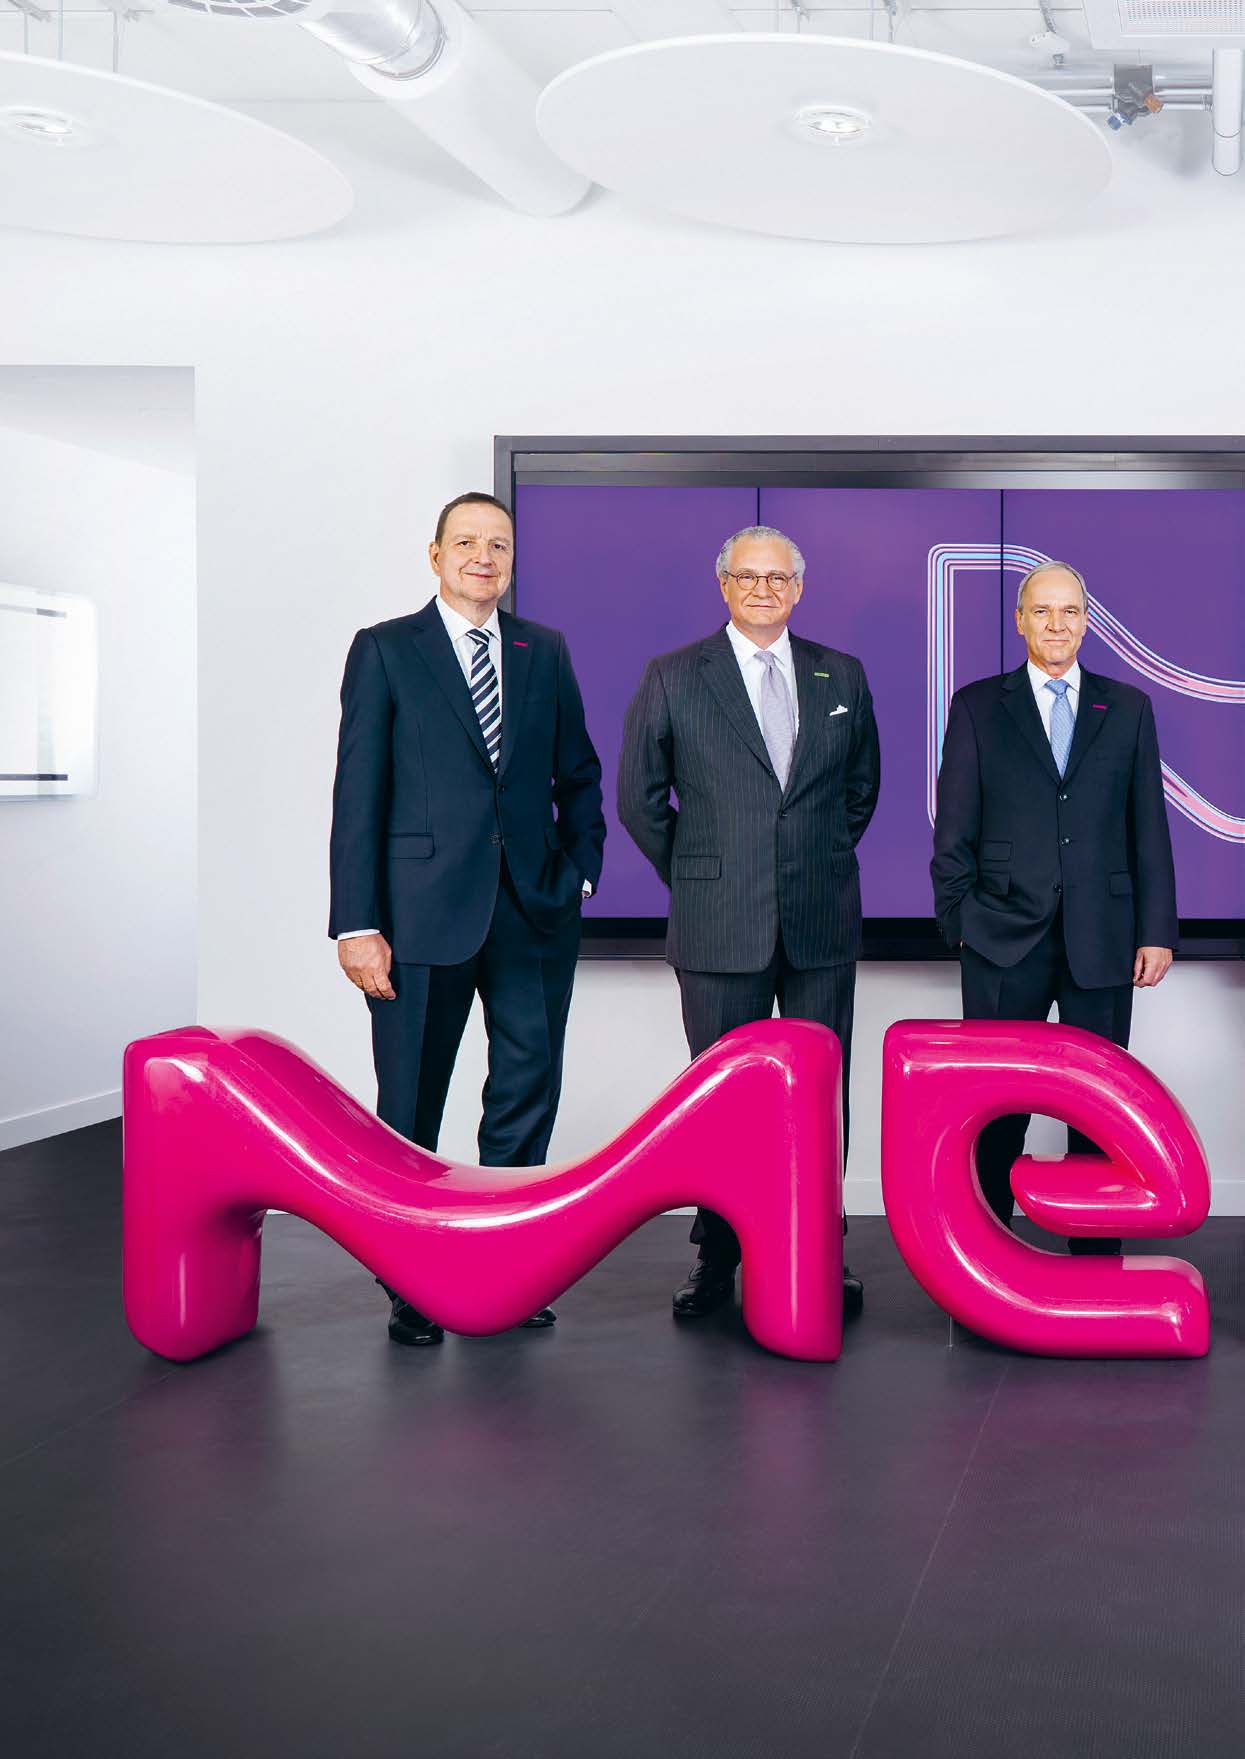
Bernd Reckmann, Stefan Oschmann, Karl-Ludwig Kley,
Marcus Kuhnert, Belén Garijo, Kai Beckmann
from left to right
Bernd Reckmann
Member of the Executive Board
CEO
Life Science and
Performance Materials
Responsibility for Group functions:
Environment, Health, Safety, Security,
Quality
Stefan Oschmann
Vice Chairman of the Executive Board
Responsibility for Group functions:
Group Strategy; Patents & Scientific
Information; Public Affairs & Corporate
Responsibility
Karl-Ludwig Kley
Chairman of the Executive Board
Responsibility for Group functions:
Group Legal & Compliance; Group
Internal Auditing; Group Communications
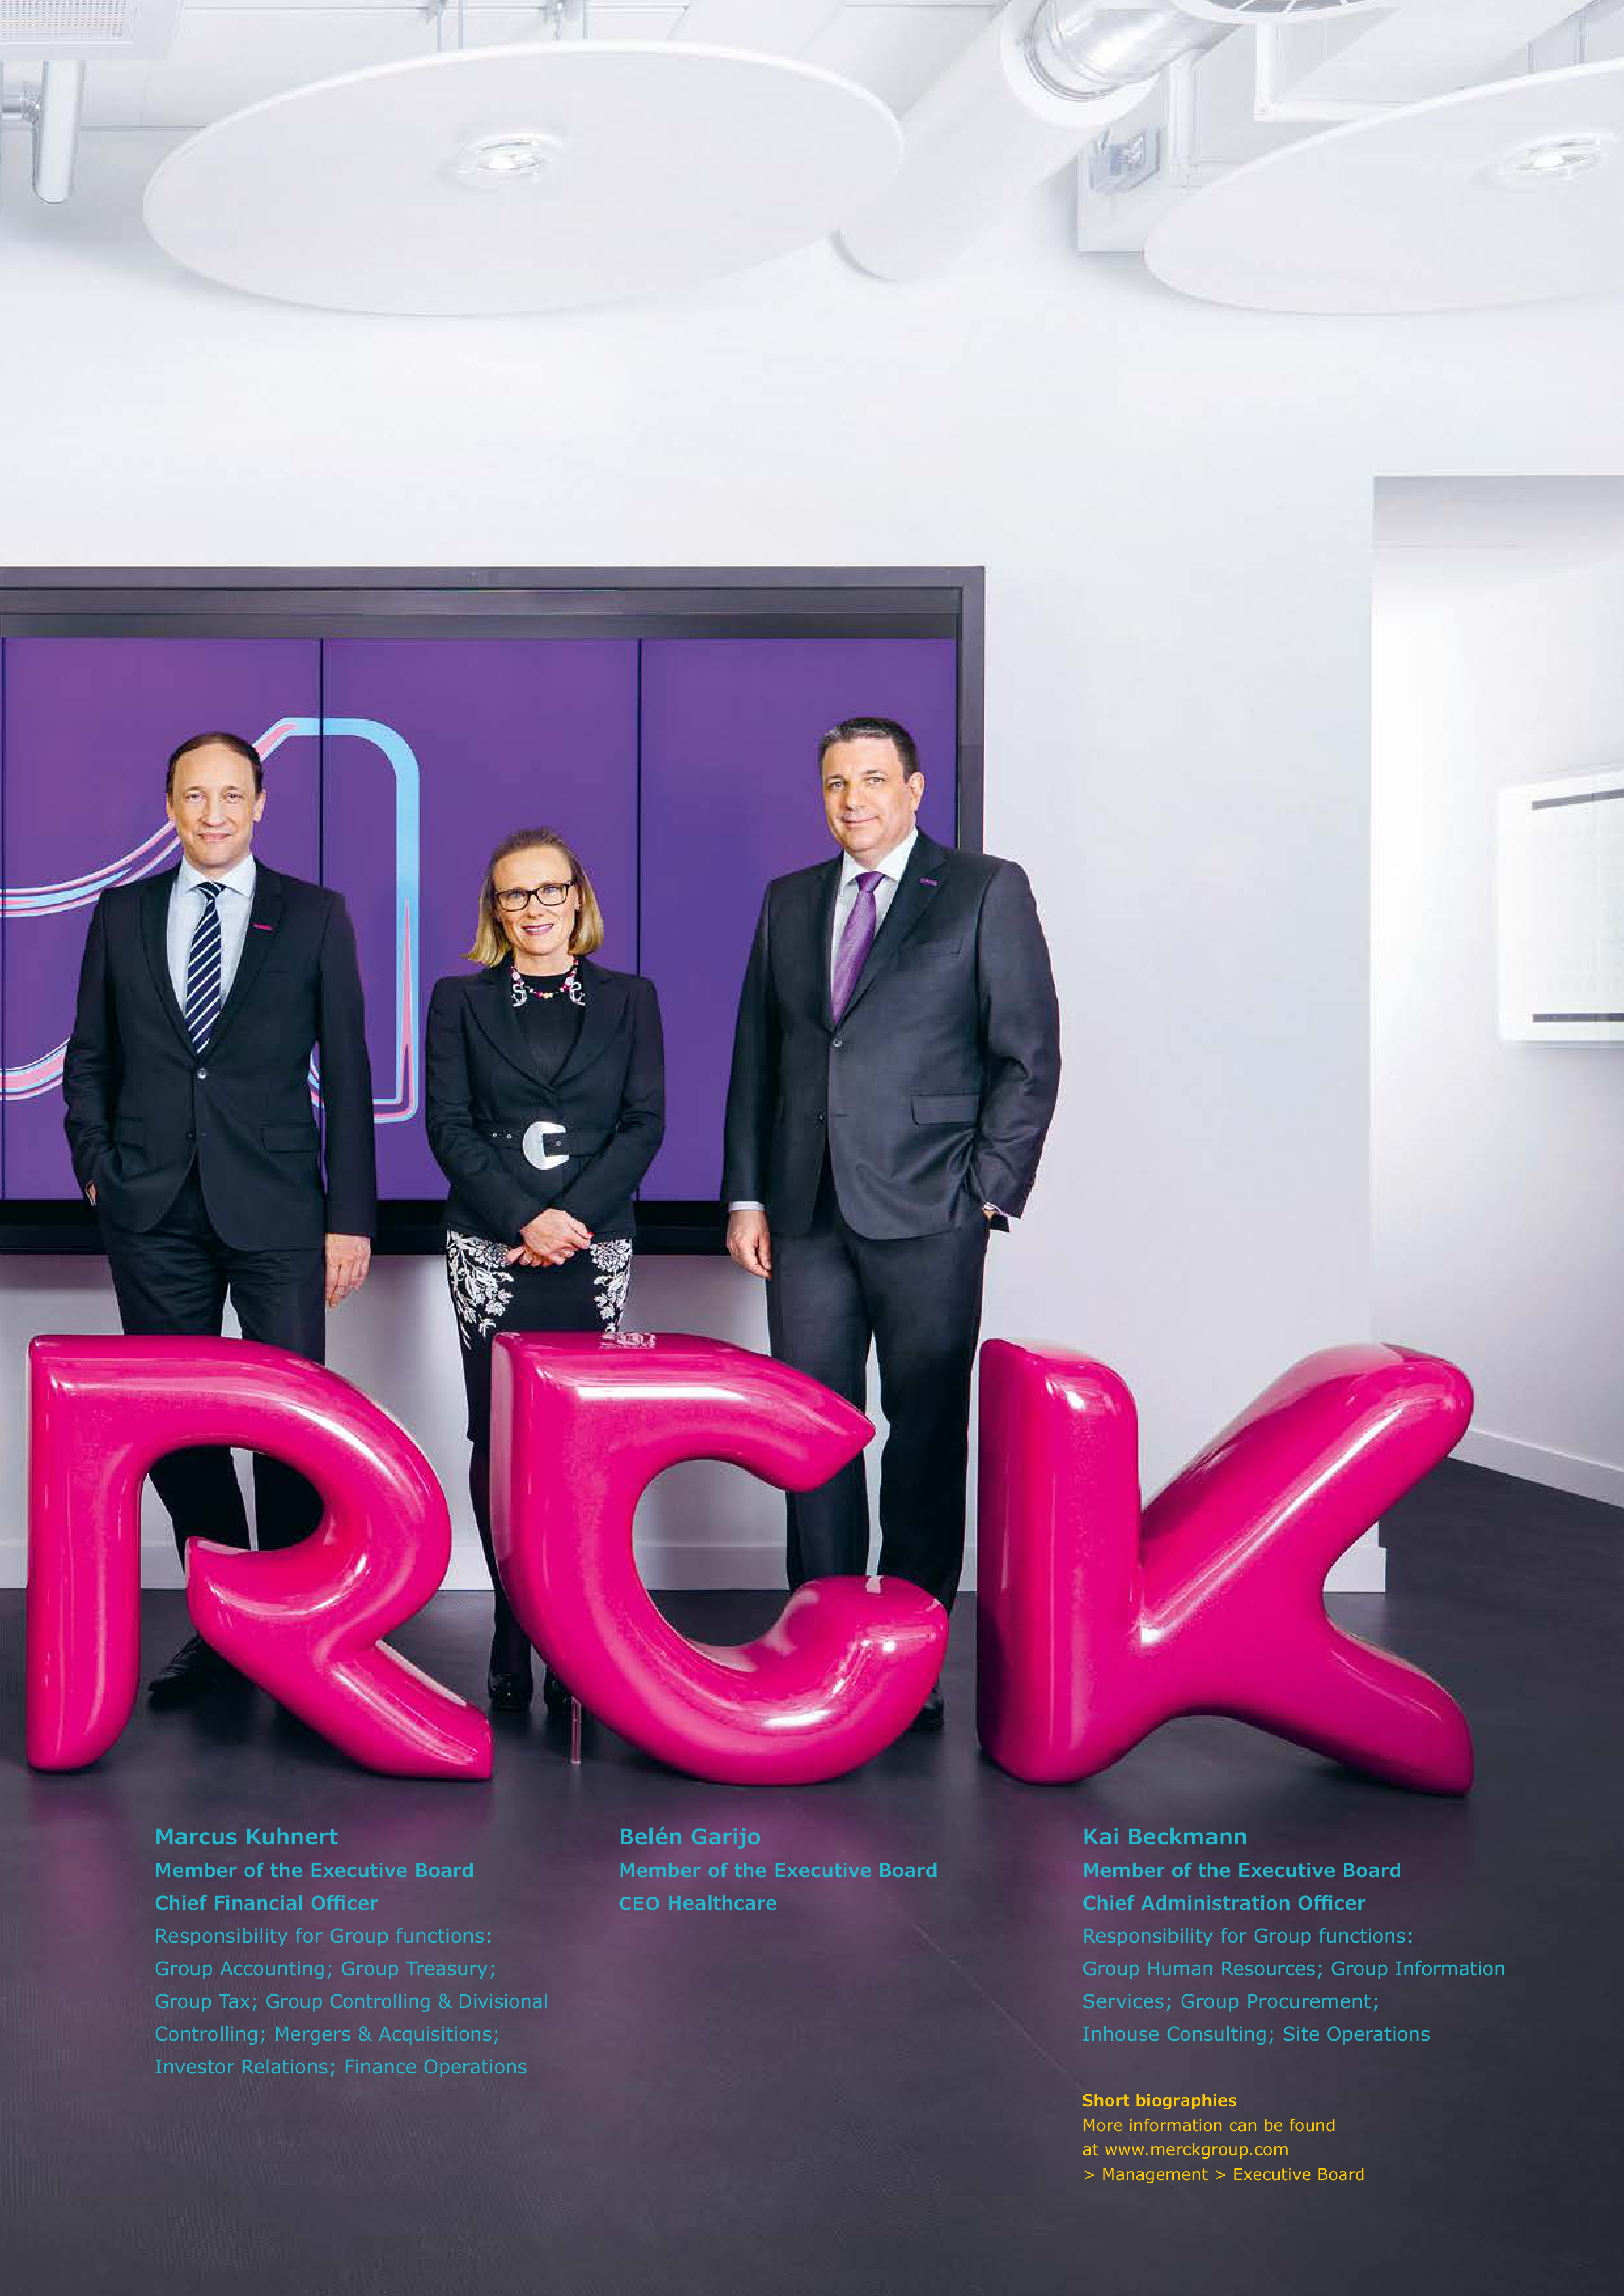
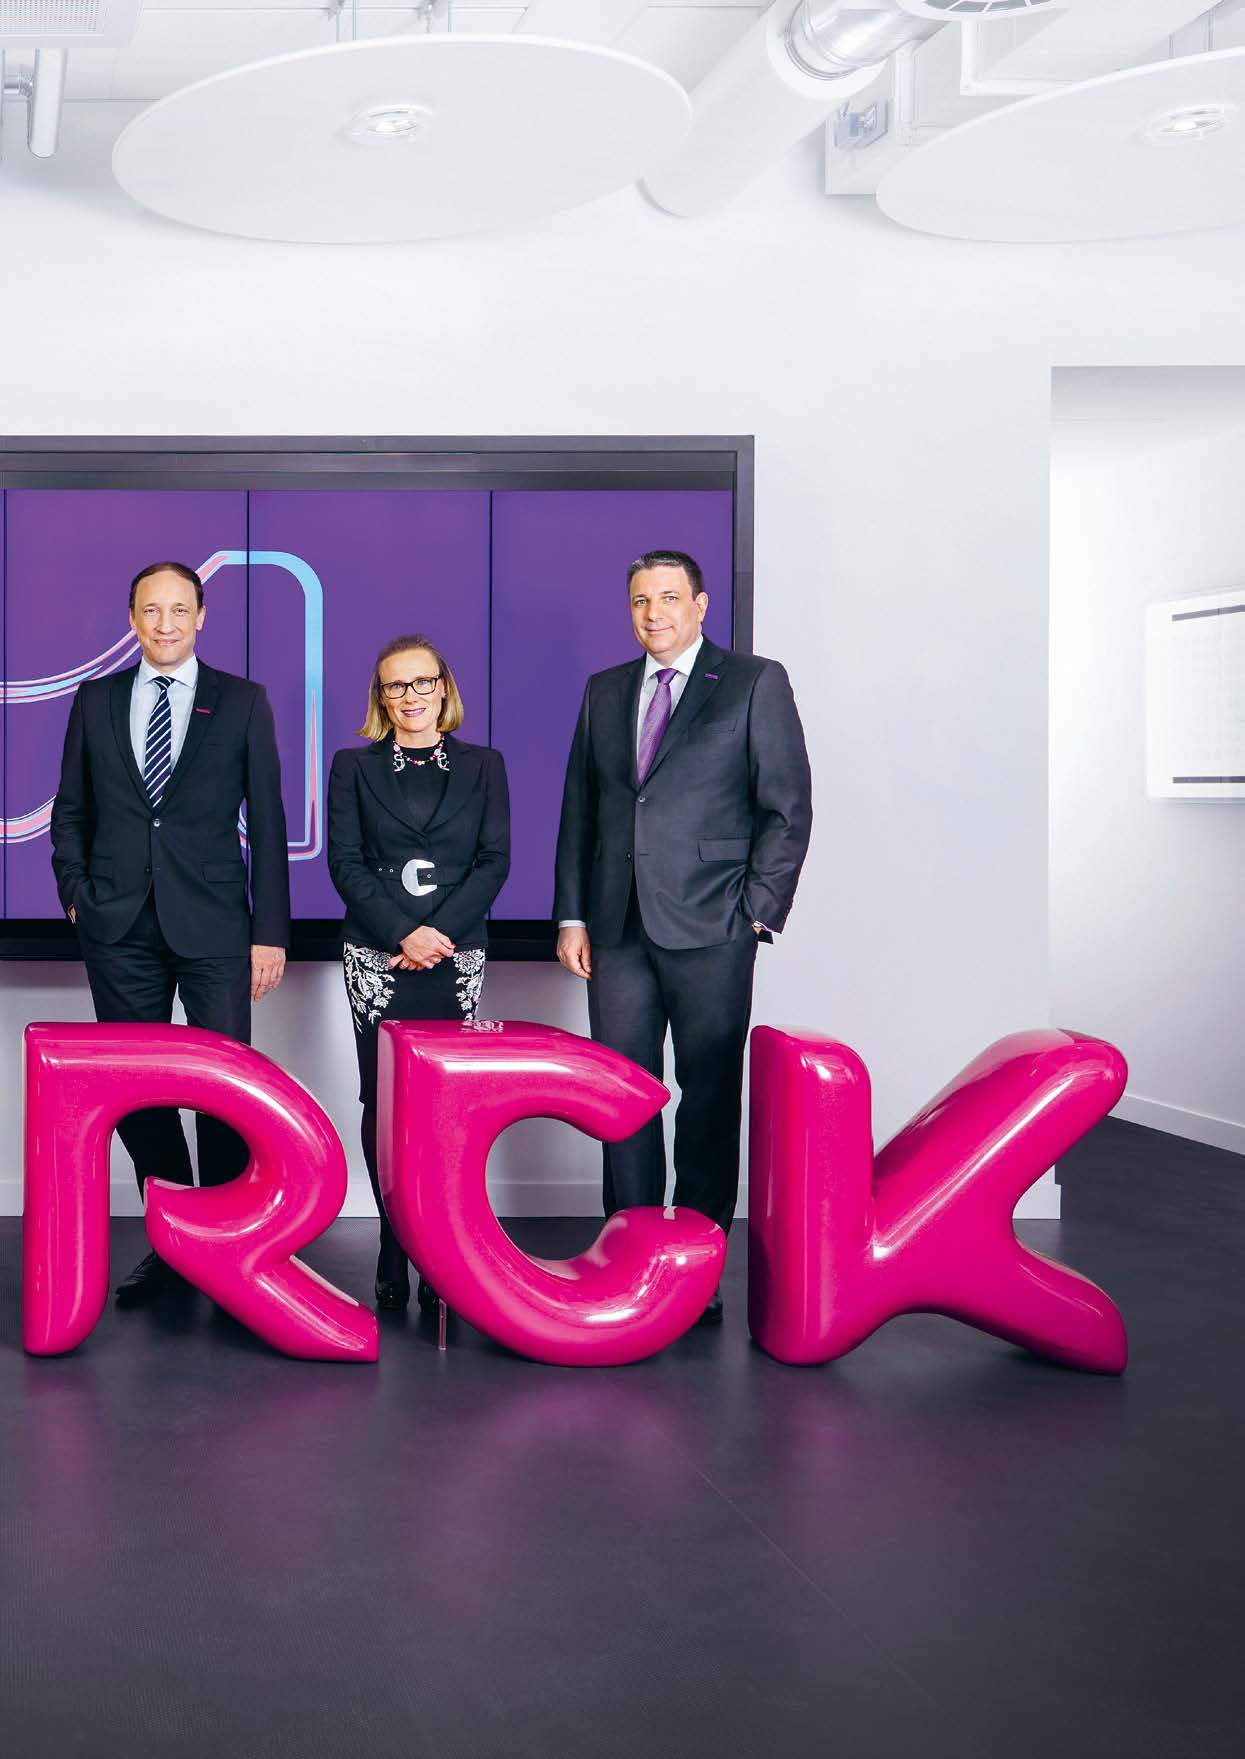
The Executive Board
To Our Shareholders
39
Marcus Kuhnert
Member of the Executive Board
Chief Financial Officer
Responsibility for Group functions:
Group Accounting; Group Treasury;
Group Tax; Group Controlling & Divisional
Controlling; Mergers & Acquisitions;
Investor Relations; Finance Operations
Belén Garijo
Member of the Executive Board
CEO
Healthcare
Kai Beckmann
Member of the Executive Board
Chief Administration Officer
Responsibility for Group functions:
Group Human Resources; Group Information
Services; Group Procurement;
Inhouse Consulting; Site Operations
Short biographies
More information can be found
at www.merckgroup.com
> Management > Executive Board
40
To Our Shareholders
Our Shares
OUR SHARES
At a glance
For the stock markets, 2015 was a highly volatile year overall.
This was also reflected by the development of our share price,
which nevertheless rose by 14% during the course of 2015.
Merck shares thus again outperformed the relevant com
para
tive indices. The performance of Merck shares was nearly
five percentage points better than that of the
DAX
®
. In com-
parison with the respective industry indices for the pharma-
ceutical and chemical sectors, the development of our share
price exceeded both by around nine percentage points.
Continuing the strong development of 2014 almost seam-
lessly, our shares reached their annual high of € 111.25 on
April 10, 2015, which also represented an all-time high. This
was followed by a period of significant general market weak-
ness caused by renewed uncertainty among market partici-
pants with respect to the European debt crisis, weak economic
data from China, and the imminent change in interest rates
in the United States. During this phase, which lasted until
October 2015, both the relevant comparative indices as well
as Merck shares incurred noticeable share price corrections.
Our shares hit their annual low of € 74.90 on October 14,
2015, then continually recovered to close nearly 20% higher
at € 89.57 on December 30, 2015.
From the capital market perspective, the Merck news flow during
the first half of the year reflected not only the continued strong
business figures, but mainly also the latest developments
leading to the completion of the Sigma-Aldrich acquisition,
which closed on November 18, 2015. Important events in the
second half of the year, which were received very positively by
market participants, included the detailed and transparent
report on the development of our pharmaceutical pipeline, which
we gave during a conference call on October 1, 2015, as well as
the successful Capital Market Day held on December 10, 2015.
Thanks to its new format, the latter event gave investors and
analysts the opportunity to get to know management repre-
sentatives from all business sectors and to engage in close
dialogue with them.
The average daily trading volume of our shares decreased by
around 12% from approximately 639,000 in 2014 to 563,000
in 2015. In 2015, North America again accounted for the largest
percentage of shares in free float. However, compared with the
previous year, this figure decreased to around 37% (2014:
47%). By investor type,
GARP
(growth at reasonable price)
and value investors continued to dominate. At the end of 2015,
the top five investors held around 23% of the free float (end
of 2014: 39%).
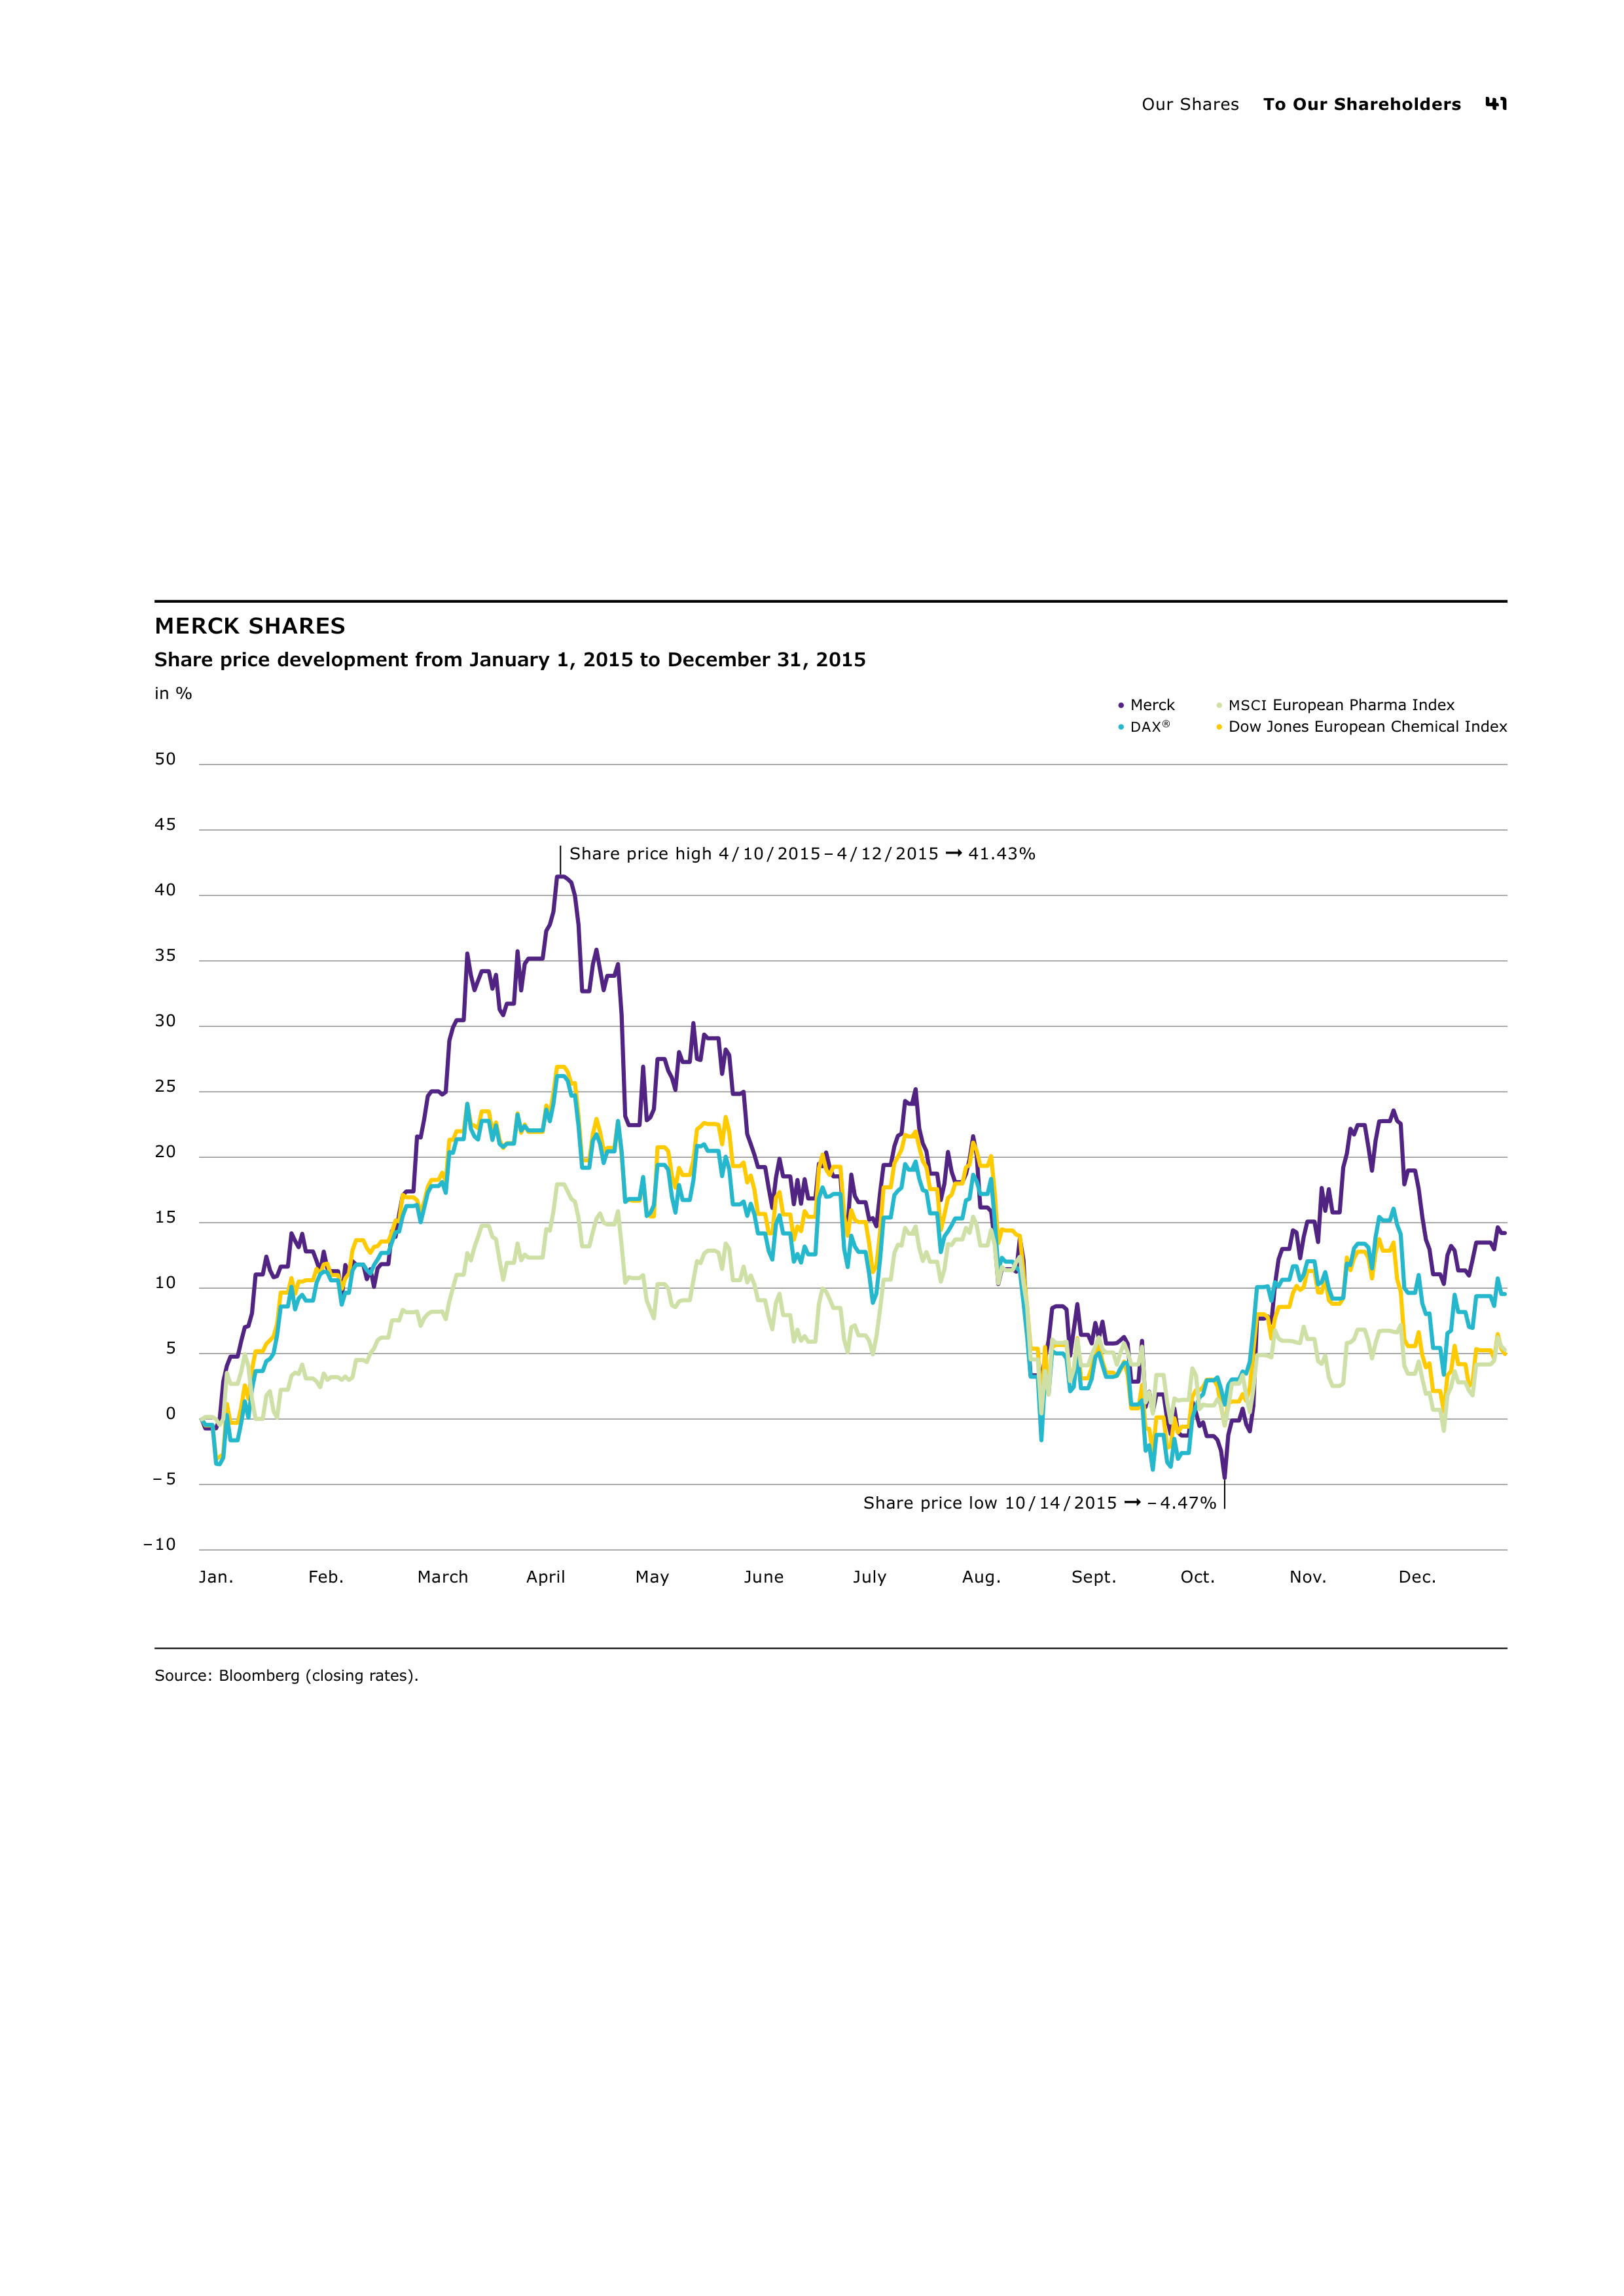
Our Shares
To Our Shareholders
41
MERCK SHARES
Share price development from January 1, 2015 to December 31, 2015
in %
50
45
40
35
30
25
20
15
10
– 10
5
– 5
0
Share price high 4 / 10 / 2015 – 4 / 12 / 2015
➞
41.43%
Share price low 10 / 14 / 2015
➞
– 4.47%
Source: Bloomberg (closing rates).
•
Merck
•
DAX
®
•
MSCI
European Pharma Index
•
Dow Jones European Chemical Index
Jan.
Feb.
March
April
May
June
July
Oct.
Aug.
Nov.
Sept.
Dec.
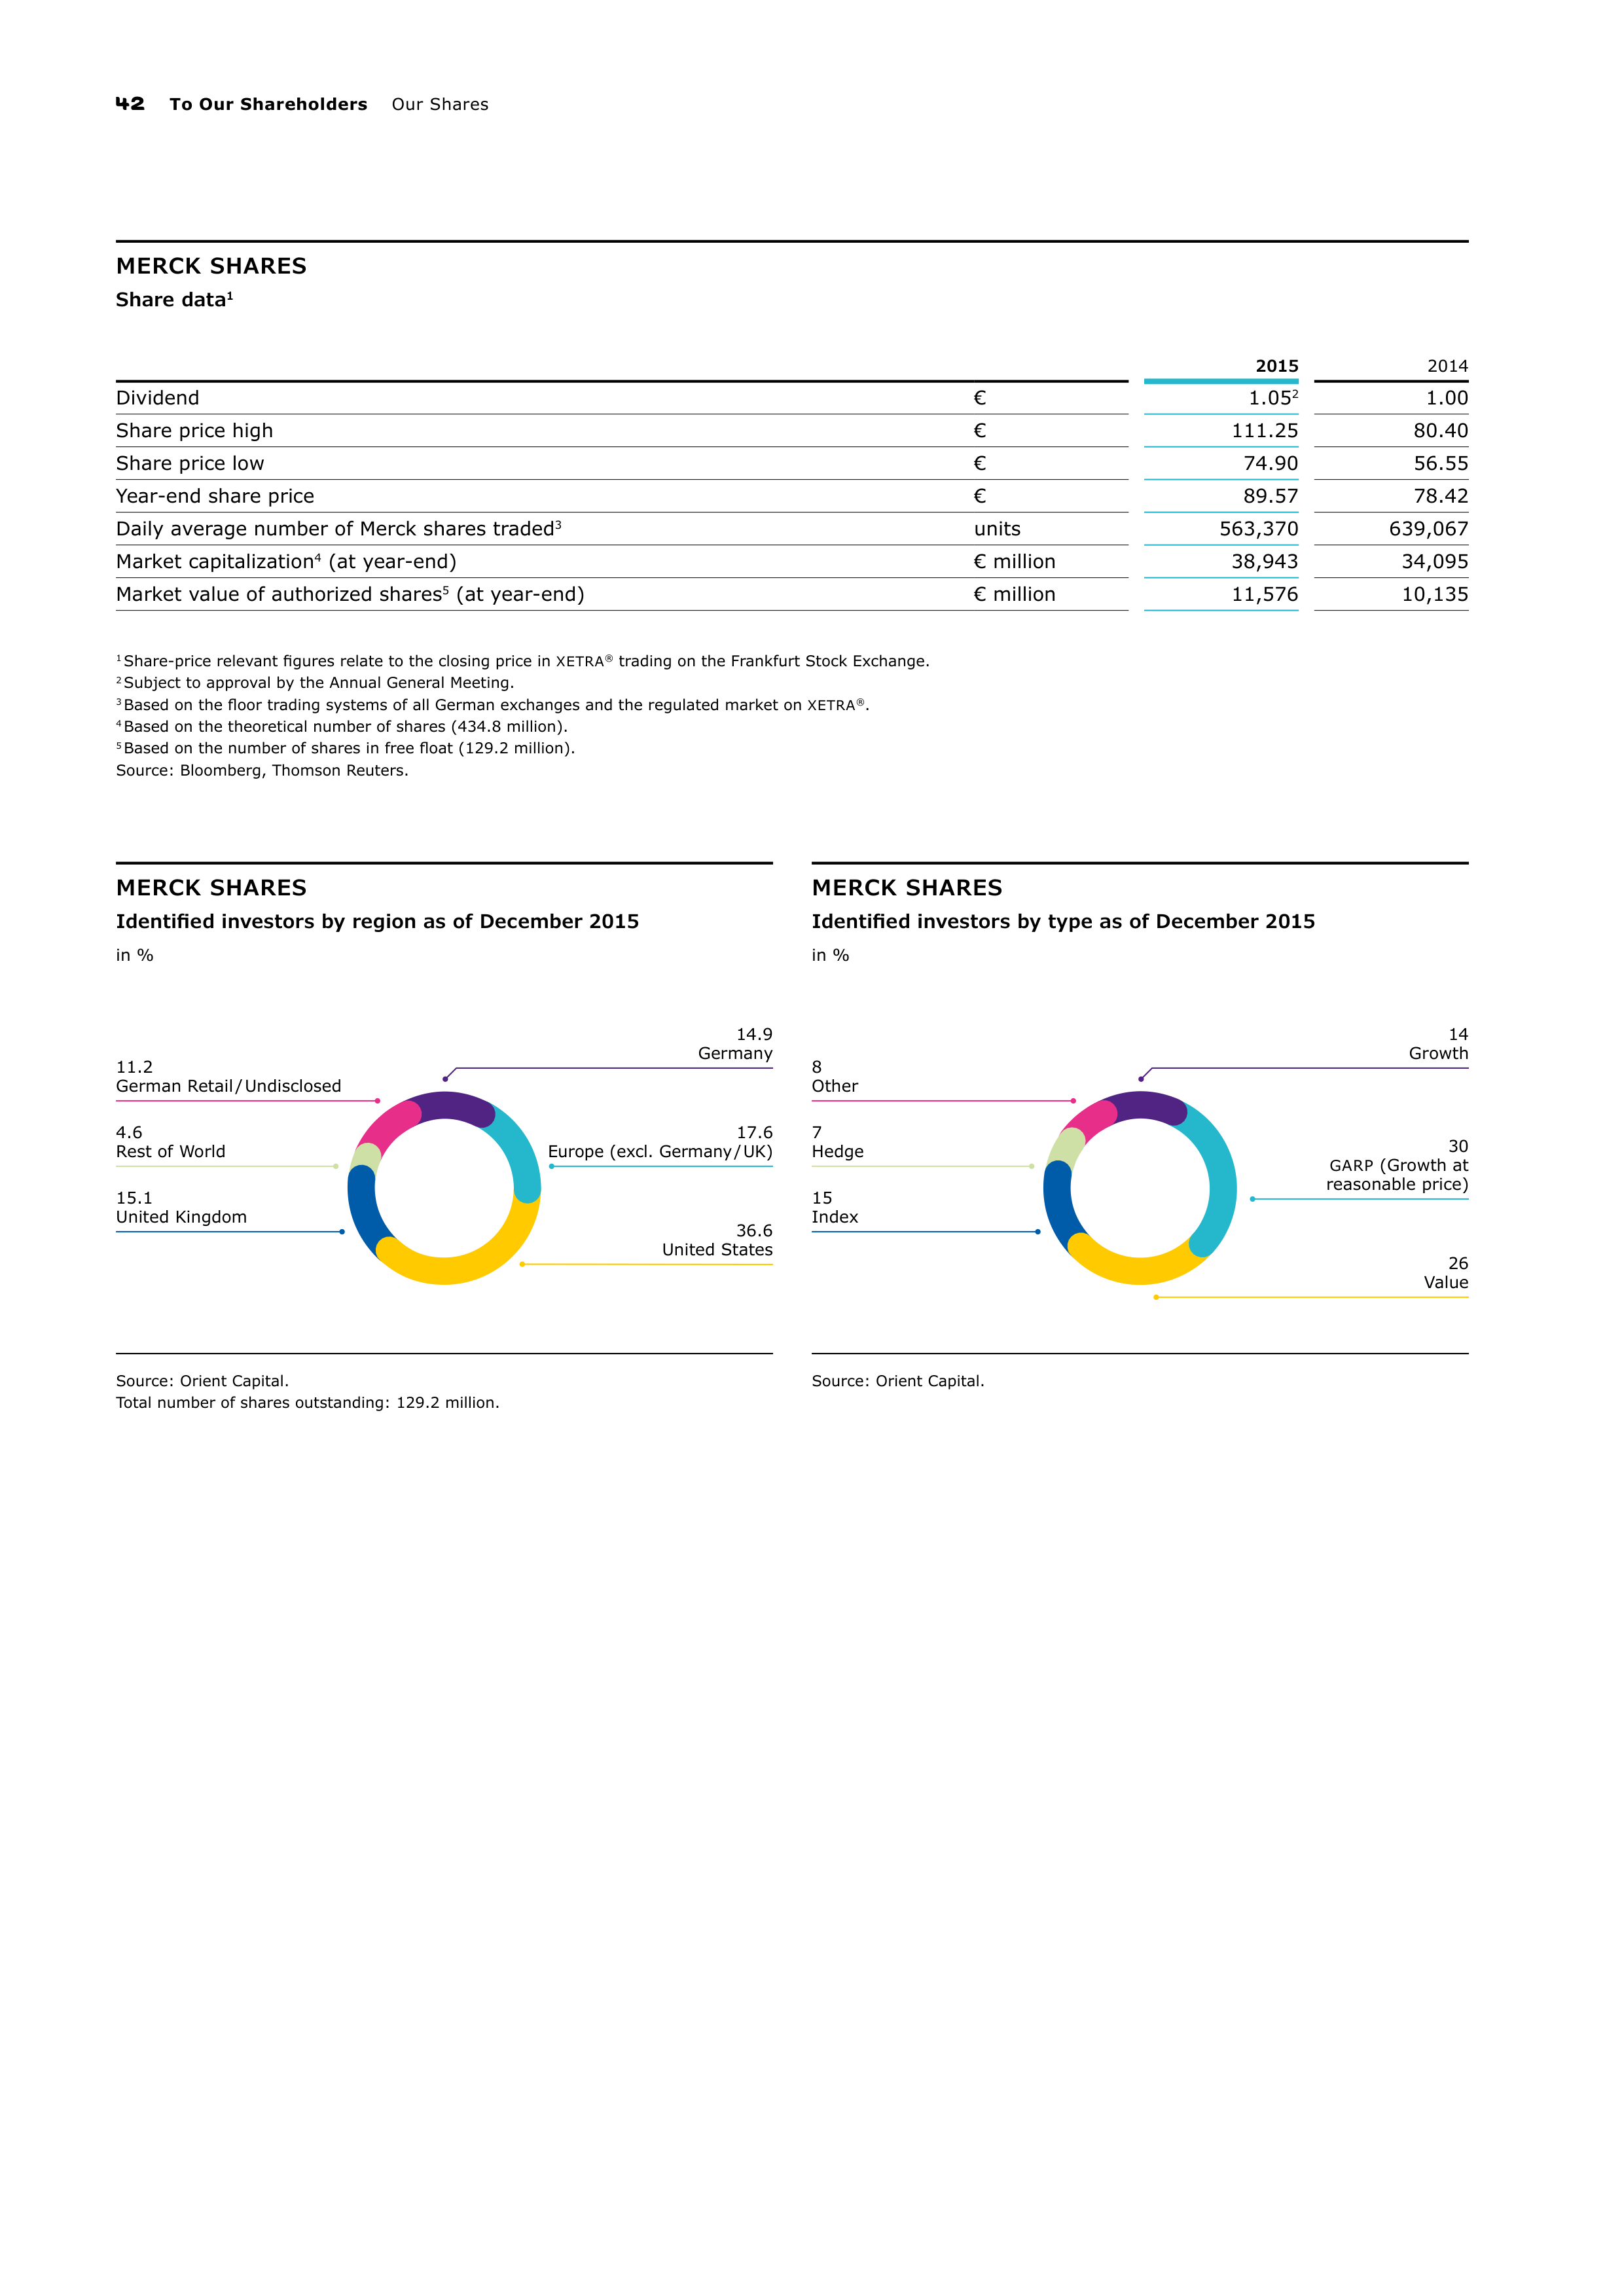
42
To Our Shareholders
Our Shares
Source: Orient Capital.
Total number of shares outstanding: 129.2 million.
MERCK SHARES
Identified investors by region as of December 2015
in %
14.9
Germany
17.6
Europe (excl. Germany / UK)
15.1
United Kingdom
4.6
Rest of World
36.6
United States
11.2
German Retail / Undisclosed
Source: Orient Capital.
MERCK SHARES
Identified investors by type as of December 2015
in %
14
Growth
30
GARP
(Growth at
reasonable price)
15
Index
7
Hedge
26
Value
8
Other
MERCK SHARES
Share data
1
2015
2014
Dividend
€
1.05
2
1.00
Share price high
€
111.25
80.40
Share price low
€
74.90
56.55
Year-end share price
€
89.57
78.42
Daily average number of Merck shares traded
3
units
563,370
639,067
Market capitalization
4
(at year-end)
€ million
38,943
34,095
Market value of authorized shares
5
(at year-end)
€ million
11,576
10,135
1
Share-price relevant figures relate to the closing price in
XETRA
®
trading on the Frankfurt Stock Exchange.
2
Subject to approval by the Annual General Meeting.
3
Based on the floor trading systems of all German exchanges and the regulated market on
XETRA
®
.
4
Based on the theoretical number of shares (434.8 million).
5
Based on the number of shares in free float (129.2 million).
Source: Bloomberg, Thomson Reuters.
02
Combined
Management
ReporT
Pages 43 – 144
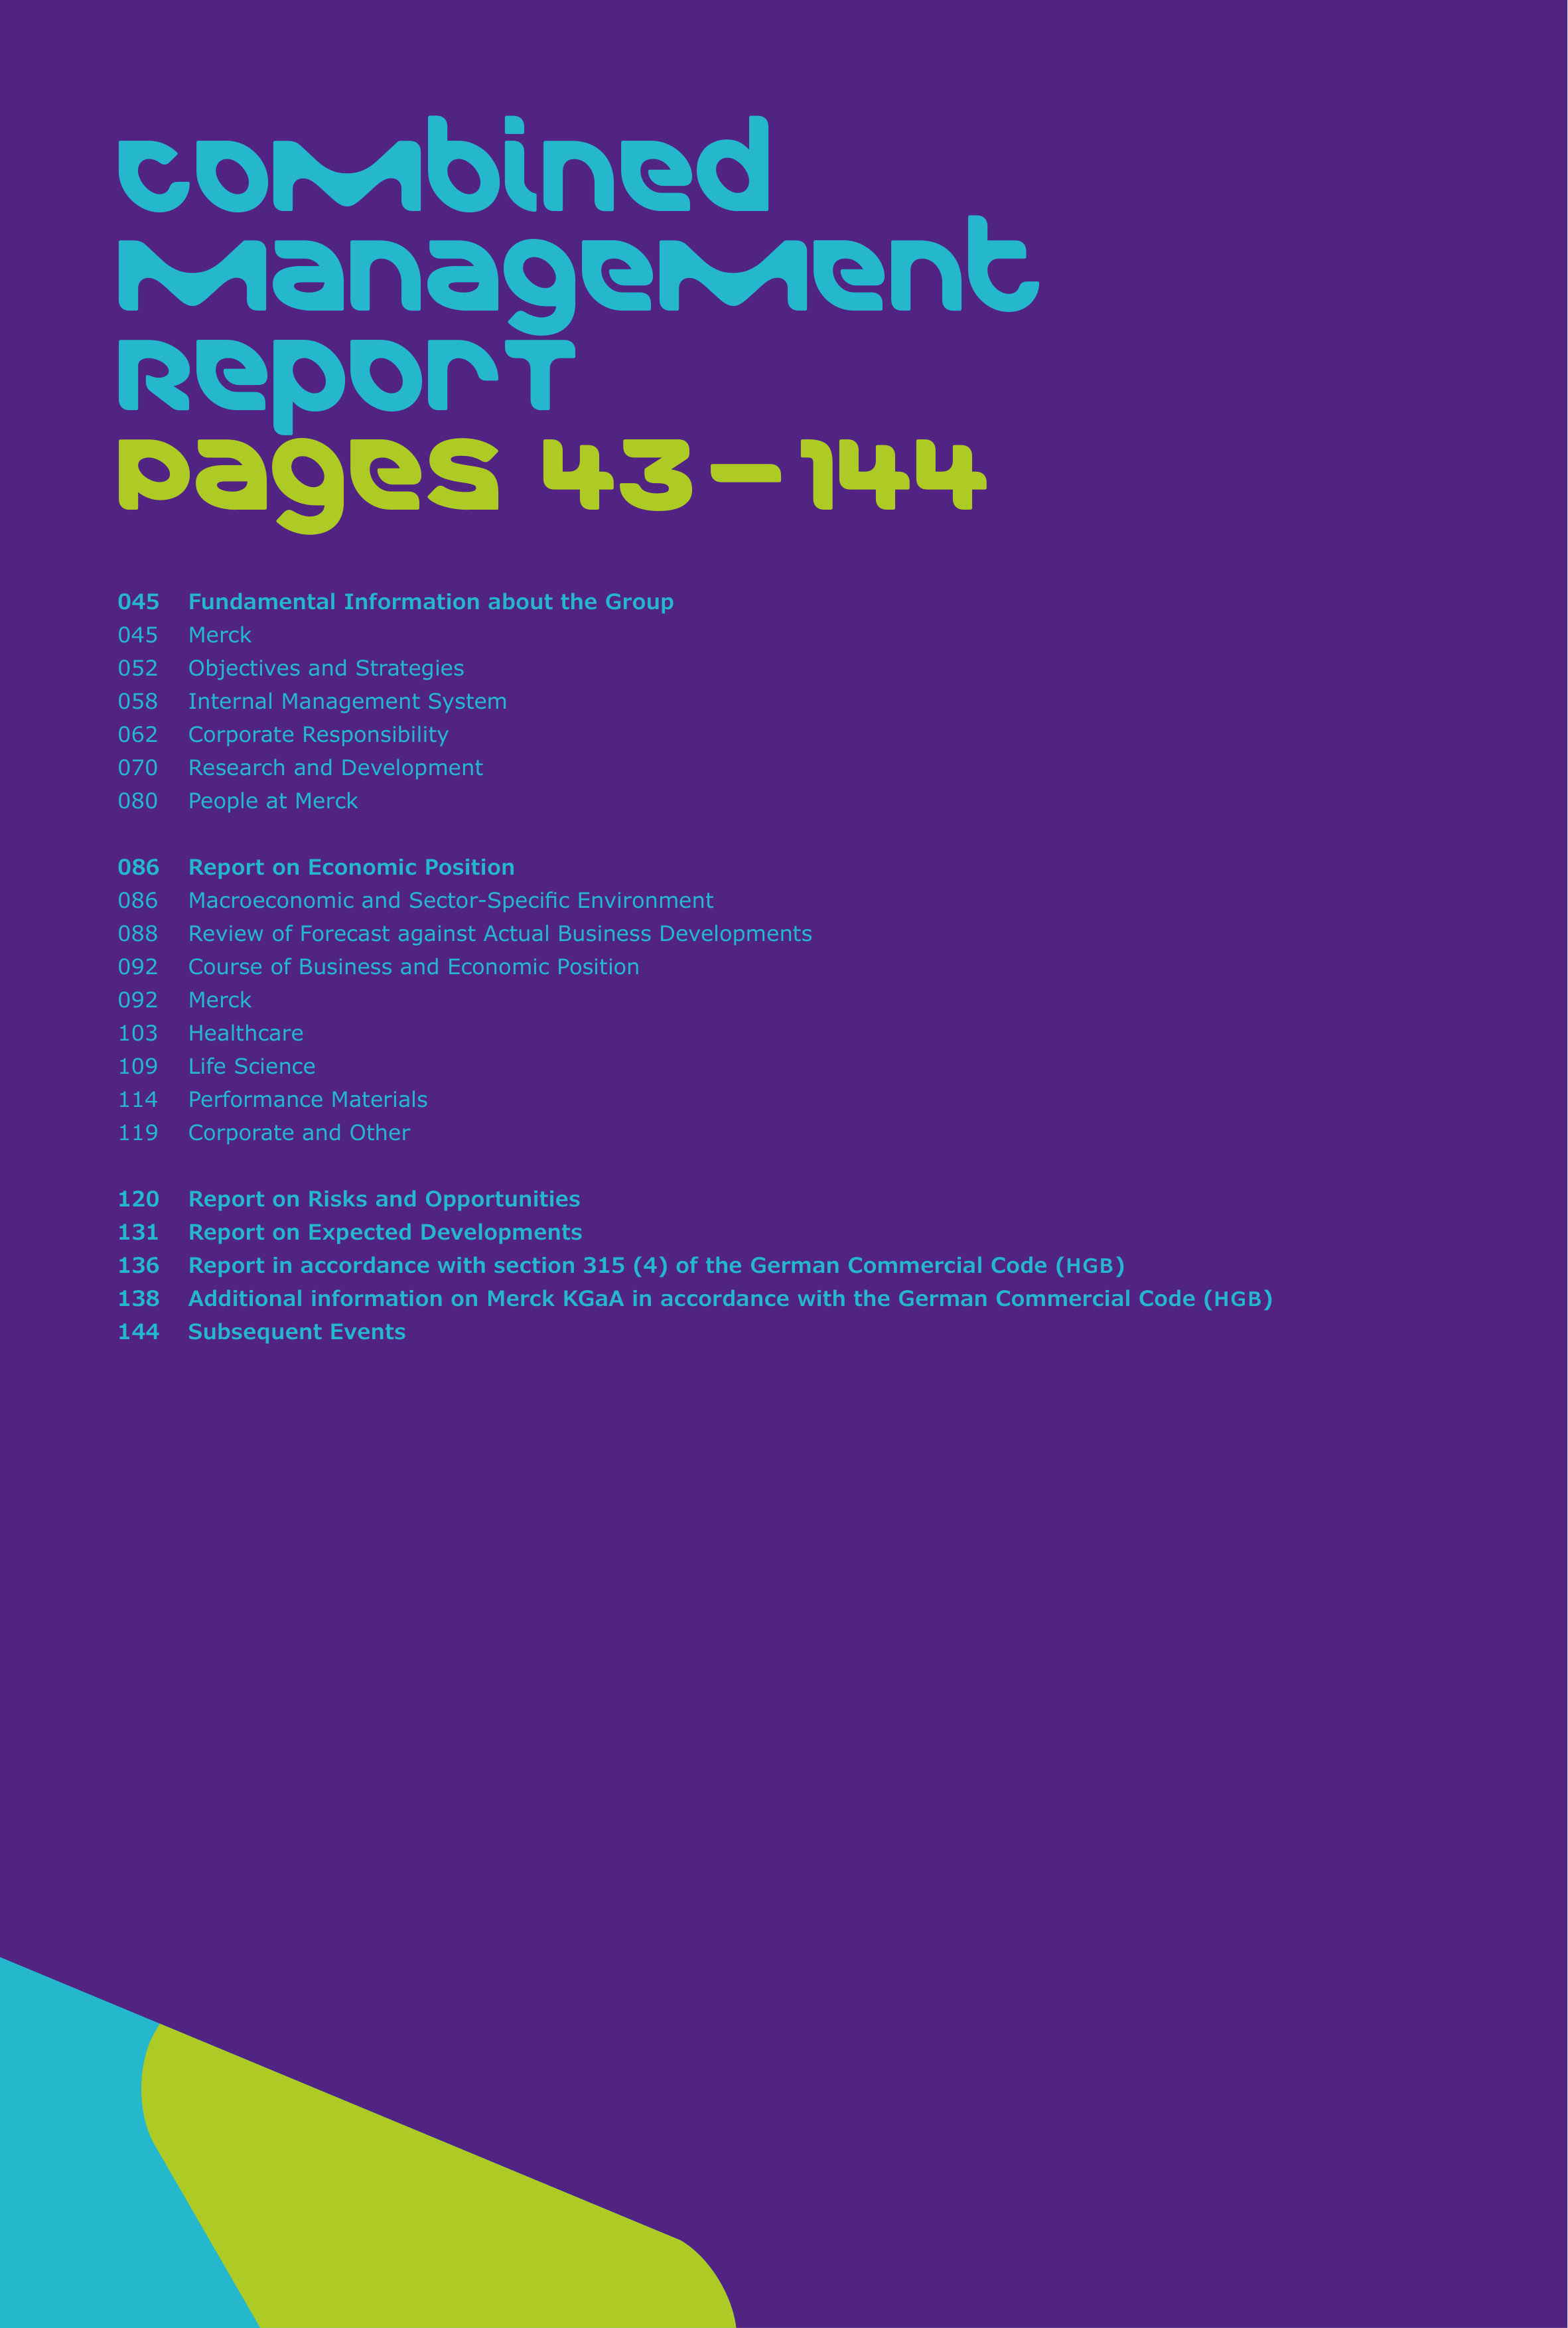
Combined
Management
ReporT
Pages 43 – 144
045
Fundamental Information about the Group
045
Merck
052
Objectives and Strategies
058
Internal Management System
062
Corporate Responsibility
070
Research and Development
080
People at Merck
086
Report on Economic Position
086
Macroeconomic and Sector-Specific Environment
088
Review of Forecast against Actual Business Developments
092
Course of Business and Economic Position
092
Merck
103
Healthcare
109
Life Science
114
Performance Materials
119
Corporate and Other
120
Report on Risks and Opportunities
131
Report on Expected Developments
136
Report in accordance with section 315 (4) of the German Commercial Code (
HGB
)
138
Additional information on Merck KGaA in accordance with the German Commercial Code (
HGB
)
144
Subsequent Events
Mer
Fundamental Information about the Group
Combined Management Report
45
FUNDAMENTAL INFORMATION ABOUT
THE GROUP
Merck
We are a global science and technology company head-
quartered in Darmstadt, Germany.
In October 2015, we repositioned our corporate brand.
The fundamental redesign of our visual appearance and
the introduction of a new logo reflect our transformation
into a global science and technology company. At the same
time, we simplified the brand architecture. We hold the
global rights to the Merck name and brand and will also
operate globally as Merck in the future – the only excep-
tions are Canada and the United States. In these countries
we operate as
EMD
Serono in the Biopharma business, as
MilliporeSigma – following the completed acquisition of
Sigma-Aldrich – in the Life Science business, and as
EMD
Performance Materials in the materials business.
With a history of nearly 350 years, we are the oldest
chemical and pharmaceutical company in the world. Our
product portfolio ranges from innovative pharmaceuticals
and biopharmaceuticals, to life science tools, specialty
chemicals, and high-tech materials.
Since January
1, 2015, in line with our strategic
direction, Merck has comprised three business sectors:
Healthcare, Life Science and Performance Materials. These
encompass the Group’s six businesses. Our financial
reporting has also followed this structure since January 1,
2015, with five regions: Europe, North America, Asia-
Pacific (
APAC
), Latin America as well as Middle East and
Africa (
MEA
).
Merck had 49,613 employees worldwide on December 31,
2015 compared with 39,639 on December 31, 2014, which
was prior to the acquisition of Sigma-Aldrich.
Healthcare
Our Healthcare business sector comprises the four businesses
Biopharma, Consumer Health, Biosimilars, and Allergopharma.
In 2015, the Healthcare business sector generated 54% of
Group sales and 50% of
EBITDA
pre exceptionals (excluding
Corporate and Other), making it the largest of our three busi-
ness sectors.
Since January 1, 2015, Belén Garijo has been the member
of the Executive Board responsible for the Healthcare business
sector. The regions of Europe and North America generated
60% of Healthcare’s net sales in 2015. In recent years, we
have steadily expanded the presence of this business sector in
growth markets. In 2015, the Asia-Pacific and Latin America
regions accounted for 34% of its sales.
Biopharma
Our Biopharma business discovers, develops, manufactures,
and markets innovative pharmaceutical and biological prescrip-
tion
drugs to treat cancer, multiple sclerosis (MS), infertility
and growth disorders, as well as certain cardiovascular and
metabolic diseases. With headquarters in Darmstadt, Germany,
we offer leading brands in specialty medicine indications. We
are advancing our research and development (R&D) portfolio
across the areas of oncology, immuno-oncology and immunol-
ogy, and continue to invest in developing programs in multiple
sclerosis. With our expertise in discovery and early develop-
ment, as well as approximately 25 projects in clinical devel-
op
ment, we are focused on delivering differentiated new ther-
apies to patients with unmet medical needs.
Biopharma’s top-selling medicine is Rebif
®
(interferon
beta-1a), an important product for people living with MS.
Multiple sclerosis is one of the most common neurological
diseases among young adults. We signaled our continuing
commitment to this disease area on September 11, 2015,
when we announced that we had submitted a letter of intent
to the European Medicines Agency (
EMA
) to file a Marketing
Authorization Application (
MAA
) for our investigational treat-
ment cladribine tablets. The letter initiates a process to address
pre-submission requirements. Submission plans for other parts
of the world are being further developed and executed.
Erbitux
®
is the second best-selling drug in the portfolio of
the Biopharma business and its flagship product in oncology.
The product is a standard of care in multiple lines of metastatic
colorectal cancer (m
CRC
) therapy as well as of both recurrent /
metastatic and locally advanced squamous cell carcinoma of
the head & neck (
SCCHN
).
In November 2014, Merck entered into a global strategic
alliance with Pfizer Inc. to develop and commercialize avelumab*,
an investigational anti-PD-L1 antibody initially discovered
and
developed by us and currently in co-development as a potential
treatment for multiple tumor types. The alliance is designed to
boost the two companies’ presence in immuno-oncology. Both
companies have also agreed to combine resources and exper-
tise to advance Pfizer’s preclinical-stage anti-PD-1 antibody
(PF-06801591) into Phase I trials. In 2015, together with Pfizer
we initiated six pivotal trials for avelumab, including first-
and second-line non-small cell lung cancer (
NSLC
), platinum-
resistant ovarian cancer, first- and third-line gastric cancer,
and first-line bladder cancer. Additionally, avelumab is cur-
rently being investigated in a Phase II study of patients with
metastatic Merkel cell carcinoma.
* Avelumab is the proposed International Nonproprietary Name (
INN
) for the anti-PD-L1 monoclonal antibody, previously known as
MSB
0010718C.
46
Combined Management Report
Fundamental Information about the Group
Mer
As part of the strategic alliance, we are co-promoting Pfizer’s
anaplastic lymphoma kinase (
ALK
) inhibitor Xalkori
®
(crizo-
tinib), a medicine to treat
ALK
+ metastatic non-small cell lung
cancer, in the United States and several other key markets.
Under the agreement, Xalkori
®
is being co-promoted in two
waves, the first of which started in the second and third
quarters of 2015 in the United States, Canada, Japan and five
European Union countries (France, Germany, Italy, Spain, and
the United Kingdom). In the United States and Canada,
Xalkori
®
is being co-promoted by
EMD
Serono, the brand
under which our U.S. and Canadian Biopharma business
operates. The second wave will begin in 2016 and includes
China and Turkey.
The co-promotion term will last through December 31, 2020
for Canada, France, Germany, Italy, Japan, Spain, the
United
Kingdom, and the United States. It will run from January 1,
2016 through December 31, 2021 in China and Turkey.
In the
first year, we will receive compensation associated with our
promotion of Xalkori
®
, followed by an 80% (Pfizer), 20%
(Merck) profit sharing on the product in subsequent years.
On December 7, 2015, we announced our decision not to
pursue evofosfamide (hypoxia-activated prodrug) further in soft
tissue sarcoma and pancreatic cancer since, despite signs of
activity in locally advanced and metastatic pancreatic cancer,
two Phase
III
studies did not meet pre-specified primary end-
points. We therefore decided not to pursue the evofosfamide
development program further.
Our Biopharma business also offers products that help cou-
ples
to conceive a child. The products in our Fertility franchise
are an important growth driver for our Biopharma business
with an increasing demand in growth markets and the trend of
couples postponing childbearing until later in life when natural
fertility is in decline. As market leader and innovator, we are
the only company that has a complete and clinically proven
portfolio of fertility drugs for every stage of the reproductive
cycle, including recombinant versions of the three hormones
needed to treat infertility. We combine an over 60-year heritage
of fertility expertise and are committed to improving treatment
outcomes, as well as developing and providing innovative
products and devices. In 2015, we won the Red Dot Award:
Product Design 2015 for our fertility pens, used to inject
hormones for follicle stimulation.
To build on our strengths in fertility hormones, we are
offering an additional comprehensive portfolio of highly inno-
vative fertility technologies from incubation to freezing. This
comprises the Gavi™, Geri™ and Gems™ product lines. Gavi™
is the world’s first automated vitrification instrument, using an
automated and standardized laboratory protocol. Geri™ is an
innovative benchtop incubator with individually controlled
incubation chambers per patient to minimize disruptive events
to the early-stage embryo. Gems™ is the latest generation of
Genea Biomedx culture media allowing for high quality embryo
cultivation. Gavi™, and Geri™ received the CE mark clearance
in Europe in 2015. The three product lines have not yet been
cleared for use in the United States.
To further strengthen our offering, our Biopharma busi-
ness
established the joint development hub
ART
innovations
together with Genea. Founded to develop an innovative pipeline
of fertility technologies and services,
ART
innovations helps to
support patients undergoing assisted reproductive technology
(
ART
) and provides healthcare pro
fessionals with innovations
to generate objective information to
make important treatment
decisions. Furthermore, we formed the Global Fertility Alli-
ance, a collaboration with Illumina Inc.
and Genea Limited to
advance excellence and standardization in
Fertility.
Also in 2015, we launched a new version of the Eeva
®
Test
with the Xtend Algorithm, the advanced version of a non-invasive
test to aid embryo assessment within assisted reproductive
technology. The new version builds on the scientific and clini-
cal record of our Eeva
®
System.
The General Medicine franchise mainly includes brands
to treat cardiometabolic diseases. Although no longer patent-
protected, the excellent brand equity built over decades makes
our flagship products cornerstones for the treatment of chronic
cardiovascular or metabolic diseases. This applies, for example,
to Glucophage
®
containing the active ingredient metformin,
the drug of choice for first-line treatment of type 2 diabetes;
to Concor
®
containing bisoprolol, the leading beta-blocker for
chronic cardiovascular diseases such as hypertension, coronary
artery disease and chronic heart failure, for which around
12 million patients are treated every year; and to Euthyrox
®
(levothyroxine), the leading treatment for hypothyroidism.
Demand for cardiometabolic therapies is continuously ris-
ing, particularly in growth markets. This is due to both increas-
ing life expectancy and in part also to growing prosperity in
these regions, along with the resulting changes in lifestyle and
dietary habits. Beyond developing life cycle management
products to capitalize on our strong brand equity, we entered
into a long-term strategic partnership with Lupin Ltd. of India
to broaden the General Medicine portfolio in growth markets to
include affordable, high-quality medicines. The main products
of the Endocrinology franchise are Saizen
®
(somatropin) and
Kuvan
®
(sapropterin dihydrochloride).
In October 2015, we announced that we would return the
rights for Kuvan
®
to BioMarin in order to fully focus on our core
businesses while giving patients continued support from a part-
ner dedicated to orphan diseases. We remain highly committed
to patients in the field of endocrinology, and in particular to
advancing the treatment of growth hormone-deficient patients
with Saizen
®
. Also in October 2015, Frost & Sullivan recog-
nized Merck’s growth hormone franchise with the European
Competitive Strategy Innovation and Leadership Award.
Furthermore, for several years we have been developing
award-winning novel injection devices that make injections
more user-friendly and at the same time more reliable for
patients than conventional or prefilled syringes. In addition,
these products make it easier for healthcare practitioners and
patients to ensure adherence and thus to reach their treatment
goals. Examples are the easypod™ electromechanical injection
devices, the only growth hormone injection device of its kind,
for the delivery of Saizen
®
, and RebiSmart™ for Rebif
®
(inter-
feron beta-1a). Additionally, both easypod™ and RebiSmart™
are able to wirelessly transfer data such as injection times,
dates and doses to the Web-based software systems easypod™
connect and MSdialog.
Mer
Fundamental Information about the Group
Combined Management Report
47
Consumer Health
In our Consumer Health business, we manufacture and market
over-the-counter pharmaceuticals and food supplements,
focusing on a number of well-known strategic brands. These
include Neurobion
®
, Bion
®
, Seven Seas
®
, Nasivin
®
, Femibion
®
,
and Dolo-Neurobion
®
, as well as Floratil
®
, Sangobion
®
,
Vigantoletten
®
, Apaisyl
®
, and Kytta
®
. Ranking 11
th
in the
global
OTC
market, we have a high market penetration in
Europe, Latin America, Asia-Pacific, and Middle East and
Africa. Our growth rates are particularly strong in Chile,
Colombia, Ecuador, India, Indonesia, Mexico, the Philippines,
and Saudi Arabia.
Global megatrends favor the future growth of the Merck
Consumer Health business. People are becoming more health-
conscious and concerned with their own physical well-being.
Preventive healthcare and as little invasive medication as
possible are becoming increasingly important – in both estab-
lished and growth markets, characterized by a growing middle
class with specific needs.
We continue to pursue the ‟3 x 3 strategy”. The aim is to
deliberately invest in about 15 to 20 key countries in order to
be present in each with at least three leading brands and to
achieve a respective local market share of at least 3%. This
should be accomplished by organic growth, geographic expan-
sion and eventually smaller, tactical acquisitions of brands
which fit into the strategy and ideally into the existing product
categories.
For example, in 2015 we began the launch of our Bion
®
brand in Brazil to add another potentially leading brand to the
local portfolio. In addition, the Vigantol
®
, Anemidox
®
/ Confer
®
and Hepabionta
®
brands were transferred from Biopharma to
Consumer Health to leverage them through consumerization.
Biosimilars
Our Biosimilars business is committed to providing access to
high-quality biologics to more patients all over the globe. In
addition, we are developing a biosimilars portfolio focused on
oncology and inflammatory disorders through both in-house
research and development expertise in biologics and partner-
ships with other biosimilar players. In 2015, we moved bio
similar candidates into clinical development. The first Phase
III
study for a biosimilar will be initiated in the first quarter of 2016.
Biosimilars is an attractive market in which Merck is
well-positioned since we can build on existing strengths and
capabilities across the biosimilars value chain. This includes
the ability to leverage internal assets or source capabilities
from suppliers to ensure compliance with regulatory require-
ments, secure market access across key growth markets,
leverage commercial manufacturing capabilities and flexibility,
as well as adopt a tailored go-to-market approach.
We have also established a strategic alliances with Dr. Reddy’s
in India to co-develop multiple cancer drugs and with Bionovis
in Brazil to supply the Brazilian market with biological products
under the Product Development Partnership (
PDP
) policy of the
Brazilian Ministry of Health.
Allergopharma
Our allergy business Allergopharma is one of the leading
companies in the field of allergen immunotherapy (
AIT
). The
Allergopharma portfolio includes a diverse spectrum of approved
allergen products that meet high quality standards.
AIT
(hypo-
sensitization, desensitization, specific immunotherapy) is the
only causal therapy for treating allergies to unavoidable aller-
gens.
We manufacture products to diagnose and treat type 1
allergies such as hay fever or allergic asthma. Merck’s allergy
business offers high-dose, hypoallergenic, standardized prod-
ucts for allergen immunotherapy of pollen and mite allergies.
These allergoids have a special focus in Allergopharma’s
product portfolio and constitute a cornerstone in its integrated
health approach for patients suffering from these conditions. For
effective treatment, reliable diagnosis is key. Allergopharma
offers a broad range of diagnostics in the field of
allergies
with more than 100 single allergens, providing physicians with
the specific tools needed to identify the substances causing an
allergy. In addition, Allergopharma provides individual aller-
gen extracts on a named patient basis, which are needed to
treat less frequent allergies – personalized medicine has been
a reality for Allergopharma for many years now. Products of
Allergopharma are available in more than 20 markets world-
wide.
The market for causal allergy therapies is a global growth
market. On the one hand, the global growth expected by
market researchers will be generated by an increasing number
of people with allergies, and on the other hand it is based on
the rising use of allergen immunotherapy in many growth
markets.
By expanding production and thus our capacities in Reinbek
as of 2017, we want to increase our global presence and help
to meet increasingly high manufacturing standards.
48
Combined Management Report
Fundamental Information about the Group
Mer
Life Science
The purpose of our Life Science business sector is to solve the
world’s toughest life science problems by collaborating with
the global scientific community. We have a broad product
and technology portfolio and offer innovative solutions for
scientists and engineers in the life science industry.
Life science comprises the research branches concerned
with the structure and behavior of living organisms. Our prod-
ucts and services are used in the research, development and
manufacture of biotechnological and pharmaceutical drug
therapies, as well as in research and application laboratories.
In addition, our products and services also reach adjacent
markets such as the food and beverage industry.
For the Life Science business sector, the most important
event of 2015 was the completion in autumn 2015 of the
acquisition of the Sigma-Aldrich Corporation (Sigma-Aldrich).
The takeover of this U.S. life science company was the largest
in Merck’s corporate history.
In 2015, the Life Science business sector contributed 26%
to Group sales and 22% to
EBITDA
pre exceptionals (excluding
Corporate and Other). With the acquisition of Sigma-Aldrich and
the first-time consolidation for a full year, these percentages
are set to increase significantly in 2016, thus further raising
the importance of the Life Science business sector.
On April 13, 2015, we had already announced Udit Batra’s
appointment to lead the combined Life Science business of
Merck Millipore and Sigma-Aldrich. This appointment took
effect upon the successful completion of the acquisition in
November 2015.
In the course of 2015, the aim was to secure numerous
antitrust approvals needed for the acquisition of Sigma-
Aldrich. An important milestone here was European Commis-
sion approval, which was granted subject to certain conditions
in June. This was followed by antitrust approvals in Japan and
from the Chinese Ministry of Commerce. Prior to that we had
secured antitrust clearance from the United States, Taiwan,
South Africa, Russia, Serbia, Israel, and Ukraine. In order to
fulfill the EU commitments, Merck and Sigma-Aldrich had to
agree to sell parts of Sigma-Aldrich’s solvents and inorganics
business in Europe. This included the sale of Sigma-Aldrich’s
manufacturing assets in Seelze, Germany, the divestment of
solvents and inorganics sold by Sigma-Aldrich worldwide
under the Fluka, Riedel-de-Haen and Hydranal brands, as well
as a temporary license to the Sigma-Aldrich brand for the
supply of solvents and inorganics in the European Economic
Area. On October 20, 2015, we announced that an agreement
had been reached to sell the relevant businesses in Europe to
Honeywell in fulfilment of commitments made to the European
Union in order to win antitrust approval of the acquisition of
Sigma-Aldrich.
Approval from Brazil’s Council for Economic Defense in
August marked the final outstanding clearance after Israel and
South Korea had also granted their approvals. Following the
receipt of all the necessary antitrust approvals for the acqui-
si
tion of Sigma-Aldrich, we announced the transaction closing
on November 18, 2015.
By acquiring Sigma-Aldrich, we have become one of the lead-
ers in the global life science industry worth more than
€ 100 billion. With this new combination we will be able to
serve life science customers around the world with a highly
attractive set of established brands such as Millipore, Sigma-
Aldrich, Milli-Q,
SAFC
and BioReliance. Moreover, we have
a highly efficient supply chain through which we can support
the delivery of more than 300,000 products. In the laboratory
and academia business, we offer our customers an extensive
and customized range of products across laboratory chemi-
cals, biologics and reagents. In pharma and biopharma produc-
tion,
Sigma-Aldrich complements our existing products and
capabilities with additions along the entire value chain of drug
production and validation.
While Sigma-Aldrich will largely be integrated into our Life
Science business sector, we decided that the
SAFC
Hitech
business will be integrated into our Performance Materials
business sector and will operate as part of the Integrated
Circuit Materials business unit.
SAFC
Hitech and Performance
Materials offer complementary technologies, making these
two businesses a natural fit.
In 2015, our Life Science business sector comprised three
business areas: Lab Solutions, Process Solutions and Bio
science.
On this basis, our Life Science business generates recur-
ring sales and stable, attractive cash flows in an industry that
is characterized by stringent regulatory requirements. A highly
diversified and loyal customer base additionally ensures a low
risk profile. In the future, Life Science will benefit from an
even broader portfolio, a highly efficient supply chain including
a superb e-commerce platform, and a global reach.
Following the completion of the Sigma-Aldrich acquisition,
we put in place Strategic Marketing & Innovation teams (
SMI
s)
to promote and deliver innovation tailored to our life science
customers’ needs. These take the place of the previous busi-
ness areas (Lab Solutions, Process Solutions and Bioscience).
Going forward, our Life Science business sector will thus be
organized around three customer segments: Research Solutions
focuses on academia, Process Solutions supports biopharma
ceutical production, and Applied Solutions serves clinical and
diagnostic testing laboratories as well as the food and environ-
mental industries. The
SMI
teams will be responsible for defining
customer segment strategy, product portfolio and product value
propositions. In the newly combined business, life science has
commercial areas which are managed by region and customer
segment to leverage regional and local expertise. There
are
two commercial areas – one dedicated to the lab customers
between Research and Applied and one dedicated to the
Process Solution customers (including the
SAFC
customer
base). The commercial areas are responsible for marketing,
sales as well as customer and dealer relationships.
Mer
Fundamental Information about the Group
Combined Management Report
49
In 2015, our Lab Solutions business covered demand for prod-
ucts for research as well as analytical and clinical laboratories
in a wide variety of industries. The business area accounted
for 36% of our Life Science sales in 2015. Laboratory water
equipment, laboratory chemicals and consumables as well as
test solutions make it possible to identify microbial contamina-
tion, for example in pharmaceutical products, food or drinking
water. For inorganic chemistry, we supply ultrapure reagents,
including salts, acids, caustic alkalis and buffering agents, and
we also manufacture reference materials for instrumental
analysis and products for inorganic trace analysis.
Adding to our industry-leading laboratory water equipment,
in 2015 we started with the introduction of our
AFS
®
water puri-
fication
systems. They have been developed to provide clinical
laboratories with an economical and reliable water purification
solution for daily water volumes of up to 3,000 liters.
Later in the year we introduced a new class of spectro
photometers in Europe for analysis of waste water, drinking
water, beverages and process water. Spectroquant
®
Prove is
available in three models and offers the largest choice of water
test kits and methods.
Bioscience accounted for 13% of sales in our Life Science
business sector in 2015. The main product groups of this busi-
ness area in 2015 included tools and consumables for filtration
and sample preparation, reagents and kits for cell biology
experiments, as well as small tools and consumables for cell
analysis. With these products, we support our customers in
understanding complex biological systems and identifying
new target molecules. Our applications help to make research
processes faster and more efficient.
Our new Magna
Ch
IRP
™
RNA
Interactome Kits allow
researchers to more easily identify, recover and analyze
regions of chromatin that interact with chromatin-associated
RNA
s such as long non-coding
RNA
(lnc
RNA
). The kits simplify
the Ch
IRP
method.
A study on our synthetic Strat-M
®
membrane was conducted
by researchers at Josai University in Japan and published in
the January
25, 2015 issue of the ‟European Journal of
Pharmaceutical Sciences”. This study showed that through the
use of our Strat-M
®
membrane as a synthetic non-animal skin
model, it is possible to predict the skin permeation of, for
example, active pharmaceutical ingredients, cosmetic actives,
personal care products and pesticides during studies as effec-
tively as with real human or animal skin.
Our Process Solutions business area, which accounted for
43% of Life Science sales in 2015, offers a diverse range of
products to pharmaceutical and biotechnology companies that
enable customers to develop large- and small-molecule drugs
safely, effectively and cost-efficiently. In addition, the busi
ness
area’s portfolio comprises more than 400 chemicals for the
synthesis of active pharmaceutical ingredients as well as drug
delivery compounds. The offering in biotech production com-
prises products supporting cell growth and gene expression,
a wide range of filtration systems, as well as salts and sugars.
The single-use solutions offered by the Process Solutions busi-
ness provide increased flexibility to biopharma customers since
they eliminate time- and cost-intensive cleaning procedures.
Moreover, these single-use solutions are compatible with various
products, thus reducing investment costs for our customers.
In 2015, we enhanced the application of our existing tan-
gential flow filtration (
TFF
) technology that allows concentra-
tion of process streams without the recirculation required in
traditional
TFF
.
A collaboration with the German company celares GmbH
to provide
PEG
ylation services to customers developing
protein-based therapeutics and biosimilars was established.
celares GmbH is a specialist for
PEG
ylation, a special form of
drug delivery for biopharmaceuticals. This collaboration enables
us to expand our service offering to include conjugation, further
helping our biopharmaceutical and biosimilar customers to
optimize their protein therapeutics and to reduce their time to
market.
In addition, we introduced enhancements to our industry-
leading
EMPROVE
®
portfolio of pharmaceutical raw materials
in 2015. The expanded documentation and regulatory infor-
mation facilitates drug product manufacturers’ risk assess-
ment workflows and supplier qualification. The enhancements
also help drug product manufacturers meet their own internal
quality guidelines as well as those recently published by the
European Commission.
Building on our strong filtration portfolio, we introduced
Millipore Express
®
PHF
(process protection, high-flux) hydro-
philic filters for fast, efficient and economical buffer filtration.
A highlight of 2015 for Process Solutions was a strategic
alliance with Turgut Ilaç, a leading biosimilars company based
in Turkey through which the business area will provide its
Provantage
®
End-to-End services for the development and
manufacturing of biologics. Phase one of the agreement will
focus on monoclonal antibody biosimilars for non-small cell
lung carcinoma and rheumatoid arthritis, the first molecules of
Turgut’s biosimilar pipeline that will be supported by us under
this strategic relationship.
50
Combined Management Report
Fundamental Information about the Group
Mer
Performance Materials
Our entire specialty chemicals business is consolidated in our
Performance Materials business sector. The portfolio includes
high-tech performance chemicals for applications in fields such
as consumer electronics, lighting, coatings, printing technol-
ogy, paints, plastics, and cosmetics. Since January 1, 2015,
Performance Materials has been organized into the following
business units: Display Materials, Pigments & Functional
Materials, Integrated Circuit Materials, and Advanced Tech-
nol
ogies.
Performance Materials’ share of Group sales was 20% and
its share of
EBITDA
pre exceptionals (excluding Corporate and
Other) amounted to 28%. The
EBITDA
margin pre exceptionals
was 44.3% of sales.
Our Liquid Crystals (LC) business, which is part of the
Display Materials business unit, generated more than half of
Performance Materials’ sales in 2015. We have long been the
global market and technology leader in liquid crystal mixtures.
This market is highly consolidated; it is characterized by bar-
riers to market entry due to the technological complexity of
liquid crystals and the high quality requirements of industrial
customers and consumers. Large LC display manufacturers
are among the customers of our Liquid Crystals business. It
comprises the broadest product offering for our customers in
industry, including, for example, liquid crystals optimized for
PS-VA (televisions) and
IPS
(smartphones and tablets) technol-
ogies. In addition, we are continuously setting standards in new
developments. An example of this is our
UB
-
FFS
technology,
which is enabling a breakthrough in the energy efficiency of
displays for smartphones and tablets, and for which we received
the German Innovation Award in 2015.
The Display Materials business unit, which was newly formed
on January 1, 2015, benefited in 2015 from the established
Liquid Crystals business and the complementary former AZ
Electronic Materials (AZ) business (Optronics) with display
materials (for example photoresists), which was integrated
into the business unit. The demand for established liquid
crystal technologies remained robust, also benefiting from the
demand for high-end televisions, for example ultra-HD TVs
with ever larger display diagonals. In 2015, we focused on
developing new application possibilities for liquid crystals,
such as smart windows, so-called liquid crystal windows
(
LCW
s). Liquid crystal windows allow continuously variable
switching from light to dark in just seconds while permitting
a broad color spectrum. In 2014, Merck acquired Peer+, a Dutch
specialist for this technology; the company has meanwhile
been fully integrated. In the first half of 2015, the first
LCW
panels were installed in Merck’s new modular Innovation
Center in Darmstadt. Since then, the new technology has been
presented at exhibitions and a broader market launch is planned
for the coming years. The architectural opportunities offered
by these smart materials were demonstrated in October 2015
at a congress in Chicago, which Merck organized together with
Harvard University Graduate School of Design.
The Pigments & Functional Materials business unit develops
and markets a comprehensive product portfolio of decorative
effect pigments and functional materials. The effect pigments
are primarily used in automotive and industrial coatings,
plastics, printing applications, and cosmetics in order to give
products a unique shine. Functional materials include laser
marking, conductive additives, and applications for counterfeit
protection, as well as high-quality cosmetic active ingredients,
for example for use in skin care, sun protection and insect
repellants.
Mer
Fundamental Information about the Group
Combined Management Report
51
The new Integrated Circuit Materials (
ICM
) business unit was
established on January 1, 2015, from the former semiconductor
business of AZ.
ICM
supplies products for integrated circuits.
As an important partner to leading global electronics manufac-
turers,
ICM
achieves more than 60% of its sales in Asia, and
generates more than three-quarters of its sales with products
that are the leaders in their respective markets. The products
offered by
ICM
are used, among other things, to manufacture
integrated circuits and microelectronic systems, for antireflection
coatings, and for the miniaturization of transistor structures.
The portfolio of the former AZ thus optimally complements the
range of materials offered by Performance Materials.
The Sigma-Aldrich
SAFC
Hitech business consisting of
high-purity materials for silicon semiconductors, compound
semiconductors and other high-tech applications is being fully
integrated into the Integrated Circuit Materials business unit.
It ideally complements our product offering as a leading global
supplier to the electronics and semiconductor industries. In
September we announced the acquisition of Ormet Circuits Inc.
to further bolster the position of Integrated Circuit Materials as
a manufacturer of semiconductor materials and to diversify
the product portfolio.
The Advanced Technologies business unit invests particularly
in future-oriented research and development in Performance
Materials. A very good example of this is our materials for
organic light-emitting diodes (
OLED
s), which are used in new
lighting techniques and display technologies. They enable, for
example, foldable and rollable or transparent displays with
excellent color brilliance and image sharpness. 2015 was the
most successful year to date for our
OLED
materials business.
The performance of the
OLED
materials business was very
positive, not least thanks to the strong growth in demand from
Asian countries. In 2015, it was one of our fastest growing
businesses, with a constantly expanding customer base. Sig-
nificant investments were made in order to set the course for
further progress and success in this future-oriented business.
In May 2015, we inaugurated the
OLED
Application Center in
Pyeongtaek, Korea. Three weeks later, we laid the cornerstone
for a new
OLED
materials production unit in Darmstadt. With
a volume of more than € 30 million, the project is one of the
largest single investments we have made at the Darmstadt
site in recent years.
In June, we acquired the Israeli company Qlight Nanotech,
a leading start-up for research in quantum materials which,
among other things, can further improve the color properties
of displays.
52
Combined Management Report
Fundamental Information about the Group
Objectives and Strategies
Objectives and Strategies
In 2015, the transformation process that we launched
back in 2007 culminated in the successful acquisition of
Sigma-Aldrich. We have transformed from a classic supplier
of chemicals and pharmaceuticals into a leading science
and technology company.
General principles and Group strategy
General principles
Our Group strategy is based on an almost 350-year history of
success. General principles provide stability and guidance in
all our business endeavors. They help those responsible within
the company to shape strategic plans and make decisions.
The partner structure of Merck KGaA with members of the
Merck family as personally liable partners requires the Executive
Board, whose members are also personally liable partners, to
pay special attention to the long-term development of value.
Therefore, sustainability plays a special role for us. The objec-
tive is to align the long-term development of the company
with the legitimate interests of shareholders, whose engage-
ment in the company is normally of a shorter duration. That is
why our business portfolio must always be balanced so that it
reflects an optimum mix of entrepreneurial opportunities and
risks. We achieve this through diversification in the Healthcare,
Life Science and Performance Materials business sectors, as
well as through our geographic breadth with respect to growth
sources.
For us, however, the principle of sustainability applies not
only to economic aspects. Instead, it also encompasses respon-
sibility for society and environmental protection. With our
existing and our future product portfolio, we want to help
solve global challenges and shape a sustainable future. Around
50,000 employees work to further develop technologies that
improve and enhance life, from biopharmaceutical therapies
to treat cancer or multiple sclerosis, to cutting-edge systems
for scientific research and production, to liquid crystals for
smartphones and
LCD
televisions.
Group strategy
In 2007, we started a transformation process to secure our
future through profitable growth in today’s Healthcare, Life
Science and Performance Materials business sectors. With the
completion of the acquisition of Sigma-Aldrich in Novem-
ber 2015, this transformation process achieved its aim. In
recent years, we have thus transformed from a classic chemical
and pharmaceutical group into a leading science and technology
company. This change is also reflected by the repositioning of
the Merck brand, which was launched with a revamped visual
appearance and the introduction of a new logo in October 2015.
The process started with the change program ‟Sustain.
Change. Grow.” and the two major acquisitions of Serono SA
in 2007 and the Millipore Corporation in 2010. In 2011, we
embarked on the ‟Fit for 2018” transformation and growth
program with a new executive management team. In the first
phase, we created the foundation for profitable growth by
introducing a new global leadership organization and a com-
prehensive, Group-wide efficiency program. The second phase,
which started in 2014, was aimed at successively implementing
the growth options identified by establishing three strong plat-
forms for sustainable profitable growth. We are building on our
core competencies:
•
Science and technology
•
Closeness to existing businesses
•
Customer proximity (to offer tailored solutions)
Overall, acquisitions and divestments since 2004 with a total
transaction volume of around € 38 billion have helped cement
the strategic change to a science and technology company.
These also included the acquisition of AZ Electronic Materials,
a leading supplier of high-tech materials for the electronics
industry. A milestone in our growth strategy was the successful
completion of the acquisition of Sigma-Aldrich in 2015, which
has enabled us to become a leading company in the attractive
life science industry. The aim of our strengthened Life Science
business sector is to solve the greatest challenges in the
industry globally. To this end, we now have a considerably
broader range comprising more than 300,000 products offered
via one of the industry's leading e-commerce platforms.
Objectives and Strategies
Fundamental Information about the Group
Combined Management Report
53
The complete overhaul of our brand is to communicate this new
direction to our customers, partners and employees. A more
self-confident and at the same time clearer tone of voice and
the new visual appearance reflect our character as a vibrant
science and technology company, ensuring that we are recog-
nizable and remain visible as Merck. This investment in our
Merck brand is also part of the strategic ‟Fit for 2018” trans-
formation and growth program.
The strategic change is also indicated by the changing
composition of sales, with a growing share of high-quality
and innovative solutions in all three business sectors. The
Healthcare business sector today generates around 60% of
its sales with biopharmaceuticals. In 2006, there was only one
such product, Erbitux
®
, which accounted for less than 10% of
sales. The classic Chemicals business has increasingly become
a premium materials business that offers Merck customers a
wide range of value-adding products. Today, high-tech materials
and life science tools make up around 80% of sales in the Life
Science and Performance Materials business sectors. In 2006,
the share was around 30%.
In addition, the geographic split of sales has changed,
reflecting our mid- to long-term goal to further expand our
strong market position in growth markets. In 2015, the growth
markets of the reported regions Asia-Pacific and Latin America
contributed 43% to Group sales.
With our three business sectors Healthcare, Life Science
and Performance Materials we now hold leading positions in the
corresponding markets. Our goal is to continue to generate
sustainable and profitable growth. We intend to achieve this by
growing organically and further developing our competencies,
as well as by making targeted acquisitions that complement
and expand existing strengths in meaningful ways. Building on
leading products in all our businesses, we aim to generate
income that is largely independent of the prevailing economic
cycles. With innovative products and services and our unique
combination of businesses, we have built the platforms to offer
solutions to support global megatrends triggered for example
by demographic changes or digitalization. Merck aims to drive
innovations within the businesses as well as between and
beyond the existing businesses. In order to foster innovations
across the three businesses and external partners, an Innovation
Center at Group headquarters in Darmstadt was opened in
October 2015 (see page 10 et seq. in the magazine section of
this Annual Report). The company also started a digitalization
initiative aimed at driving digitalization within the business
sectors and set up corresponding projects. A Chief Digital
Officer was appointed in December 2015.
Strategic initiatives
Capability initiatives
As Merck continues to grow in size and the business becomes
increasingly global, we want Merck to be seen as
ONE
com-
pany.
ONE
Merck stands not only for a strong brand, but also
comprises three other capability initiatives that are of strategic
importance for the Group.
The capability initiative
ONE
Merck brand aims to strengthen
the value of the Merck brand, to increase the company’s global
visibility and reputation, and to become more attractive to
customers, partners and talent. Our new brand orientation is
a significant factor in achieving this goal: A self-confident and
expressive design with a new logo and the ‟Vibrant M” as a
distinguishing feature create a visual link between all our global
businesses and products. This focus on Merck as our core brand
will be supported by eliminating the former, separate division
names (with the exception of the United States and Canada).
The framework for talent development, compensation and
performance management is also to be harmonized globally
(
ONE
Talent Development, Rewards and Performance Manage-
ment). As part of this initiative, we established a consistent
and integrated talent and performance management process
and are proactively identifying and sourcing talent, as well as
ensuring workforce diversity.
The goal of the third capability initiative
ONE
Process
Harmonization, Standardization and Excellence is to better
coordinate processes and apply them consistently. This is
particularly the case with software applications. Continuous
improvement will take place through benchmarking. This will
allow us to adapt rapidly to business changes as well as to
integrate future acquisitions into the company seamlessly and
efficiently.
The importance of our headquarters in Darmstadt is also
to increase – along the lines of
ONE
Global Headquarters. Our
headquarters is to become a central location for creativity,
scientific exchange and innovation. With the new Innovation
Center we have created a basis that will allow us to better use
our employees’ innovation potential, optimize cross-functional
and Group-wide collaboration on projects, and also give
external innovators the opportunity to develop their ideas with
support from Merck.
54
Combined Management Report
Fundamental Information about the Group
Objectives and Strategies
Business strategies
Healthcare business sector
Biopharma
We aim to be a preferred global biopharmaceutical partner
through an enduring commitment to transforming patients’
lives with innovative specialty medicines, leading brands and
high-value solutions. Global megatrends such as world popu-
lation growth and a general increase in life expectancy are
bolstering the demand for our products. We are well-positioned
for sustainable growth.
The first pillar of our strategy in Biopharma is to deliver
innovation globally. We have redesigned our R&D operating
model and improved the portfolio decision-making process. We
have drastically improved the quality of our pipeline by aggres-
sively pruning low probability assets and redirecting resources
to priority programs. Efficiency in R&D has been strengthened
with a focus on selected core therapeutic areas – oncology,
immuno-oncology and immunology – and with the depth of
talent in the respective Translational Innovation Platforms. We
have also increased our focus on biomarker-driven programs
to improve patient outcomes. Our development programs
include avelumab, the anti-PD-L1 antibody that we are devel-
oping and will commercialize with Pfizer, and M7824, our first-
in-class bi-functional fusion protein in immuno-oncology;
tepotinib, a c-Met inhibitor in oncology; atacicept and
BTK
i447,
a Bruton’s tyrosine kinase inhibitor, in immunology; and cladrib-
ine
in multiple sclerosis.
In this context, strategic collaborations are an integral part
of delivering on our commitment to transforming the lives of
patients living with serious unmet medical needs. We recognize
the value of collaboration in the research and development of
breakthrough therapies, as well as strengthening our current
portfolio. We look for partners who share our passion for inno-
vation and whose expertise complements our existing portfolio,
and who share our mission to discover treatments that improve
patient lives.
We focus on balancing the right blend of internal capabili-
ties and external partnerships, building strong collaborations
with other leaders in industry including Pfizer, Genea and Bio-
cartis, among others. Our integrated research and develop-
ment capacity is strongly supported by partnering activities to
complement our pipeline, strengthen our technology base and
enhance our scientific capabilities.
The second pillar of our strategy is to maximize our existing
portfolio in developed markets. In the Multiple Sclerosis
franchise, the vision is to remain a leader by providing innova-
tive solutions that include drugs, devices and services to help
people living with multiple sclerosis. We plan to realize the
potential of Rebif
®
, our top-selling product, in an increasingly
competitive multiple sclerosis market. We now have full con-
trol of its promotion since the end of our collaboration with
Pfizer in the United States in this field. We will position Rebif
®
as the best interferon-based therapeutic option for patients
who suffer from the relapsing form of the disease. We are
driving differentiation via smart injection devices and the first
comprehensive support program for patients with multiple
sclerosis including an e-health platform. In Fertility, our focus
is on expanding market leadership and on providing innovative
services and technologies beyond drugs to address patient
needs and to improve outcomes beyond stimulation. In Oncol-
ogy, we promote the value of Erbitux
®
, especially in Europe
and Japan, and emphasize the importance of offering patients
complete testing for
RAS
status in order to ensure optimal
outcomes. Through the co-promotion of Xalkori
®
with Pfizer,
we have entered the United States oncology market and will
prepare for the future launch of avelumab, our anti-PD-L1
antibody across the major markets.
The third pillar of our Biopharma strategy is to expand fur-
ther in growth markets. With a growing middle class, extended
health care coverage, a shift towards chronic diseases, and
rising demand for biologics, growth markets are a key driver
for us. We are implementing strategic growth initiatives in our
General Medicine and specialty medicine franchises to address
specific needs. We are leveraging capabilities and local chan-
nels, for example by extending the breadth and depth of pro-
motion in China, expanding our portfolio via regional and local
licensing, and supporting market developments in Fertility. We
are also investing selectively and growing our flagship brands
with new formulations (Euthyrox
®
and Glucophage
®
), fixed-
dose combinations (Concor
®
) and devices (Saizen
®
). And we
are repatriating business, for example in China and in Russia,
taking back the promotion of Merck products from industry
partners where attractive.
Objectives and Strategies
Fundamental Information about the Group
Combined Management Report
55
Biosimilars
Biosimilars is an attractive market in which we are well-
positioned as we can build on existing strengths and capabili-
ties across the biosimilars value chain. This comprises the
ability to leverage internal assets or source capabilities from
suppliers to ensure compliance with regulatory requirements,
secure market access across key markets including growth
markets, leverage commercial manufacturing capabilities and
flexibility, as well as adopt a tailored go-to-market approach.
In 2015, we made further progress with our biosimilars in
clinical development. The first Phase
III
study for a biosimilar
will start in the first quarter of 2016. We have established
strategic alliances with Dr. Reddy’s in India to co-develop
multiple cancer drugs as well as Bionovis in Brazil to supply
the Brazilian market with biological products under the Product
Development Partnership (
PDP
) policy of the Brazilian Ministry
of Health. Moreover, we are committed to further expand the
Biosimilars business through additional collaboration agree-
ments and partnerships in the future.
Allergopharma
Allergy remains a significant global problem as millions of peo-
ple around the world suffer from allergies. Presently, the only
way to prevent a potential worsening and chronic progression
of the condition is Allergy Immunotherapy (
AIT
) comprising
hyposensitization, desensitization and allergy immunization.
Our Allergopharma business is a manufacturer of
AIT
diagnos-
tics and prescription drugs. The market for causal allergy
ther
apies is a global growth market. As expected by market
researchers, the drivers are an increasing prevalence of aller-
gies in a growing worldwide population as well as the growing
use of Allergy Immunotherapy (
AIT
) in many emerging mar-
kets. A novel state-of-the-art production facility in Reinbek
near Hamburg, will, from 2017 onwards advance global
expansion and ensure that increasingly high manufacturing
standards in the
AIT
industry are met. With its own research
department and in cooperation with research institutes and
other partners, Allergopharma is actively working on improving
the efficacy, convenience and safety of current therapy options
as well as on developing the next generation of drugs for
allergen immunotherapy.
Consumer Health
After strategically realigning our Consumer Health business in
2012 and 2013, we began pursuing an aggressive growth
strategy as of 2014. This growth strategy is captured by
‟3 x 3”, indicating our aim to achieve a market share of at least
3% in each of our top markets (including Brazil, France,
Germany, India, Indonesia, Mexico, Poland, and the United
Kingdom), and at least three so-called ‟lovebrands” in leading
positions within each respective market. An important mile-
stone within the framework of this strategy was the transfer
of the Neurobion
®
and Floratil
®
brands from Biopharma to
Consumer Health in 2014. Following their transfer, both brands
clearly demonstrated potential to focus more closely on con-
sumer wishes and needs in core markets, an approach which
we call ‟consumerization”. For instance, the growth of Floratil
®
in the key market of Brazil increased more than tenfold.
Following this initial move, in 2015 further brand transfers –
such as Vigantol in Germany and Europe or smaller local vitamin
brands in Latin America and Southeast Asia – were success-
fully implemented. In 2015, the Consumer Health business
again achieved very high organic sales growth, thus contribut-
ing noticeably to the growth of the Healthcare business sector.
Further important components of implementing the ‟3 x 3”
strategy are geographic expansion of existing brands into new
markets, such as the market launch of the Bion
®
brand in
Brazil throughout 2015, as well as possible tactical acquisi-
tions, as long as these are in line with the strategic direction.
Life Science business sector
By adding Sigma-Aldrich to our existing Life Science business,
we are now one of the leading players in the attractive global
life science industry with a broad product range in attractive
segments.
For 2016, the two major areas of focus for our Life Science
business sector will be to execute the integration and to lever-
age the synergy potential of the acquisition. A seamless inte-
gration is of utmost importance to both customers and the
organization. At our Capital Market Day in December 2015, we
reiterated that we want to realize the announced synergies of
approximately € 260 million within the third year after closing
and that it is our ambition to be the profitability champion of
the sector.
56
Combined Management Report
Fundamental Information about the Group
Objectives and Strategies
We want to create sustainable value that is based on three
strong strategic levers that form the foundation for future
top-line growth in Life Science: a broad, innovative portfolio,
a balanced geographic footprint and excellent capabilities.
Firstly, as regards the portfolio, with a catalog of more than
300,000 products, we now deliver many of the most highly-
respected brands in the industry, such as Millipore, Sigma-
Aldrich, Milli-Q,
SAFC
and BioReliance. Our offering covers
every step of the biotech production chain, creating a com-
plete end-to-end workflow. Secondly, through the acquisition
of Sigma-Aldrich, we have significantly increased our geo-
graphic footprint, especially our presence in North America.
Our geographic reach now consists of a presence in more than
60 countries. Building on the strengths of each legacy organi-
zation, we aim to increase our access to the Asian and Latin
American processing market and the North American research
market. Thirdly, our capabilities include excellent supply chain
management able to deal with complexity, an outstanding
e-commerce platform to simplify and optimize the customer
experience and the expertise to manage regulatory barriers.
To best meet the needs of our customers and accelerate
innovation, as of 2016 the teams responsible for Life Science
innovation and product development are strategically organized
around our customers – Research Solutions, Process Solutions
and Applied Solutions. Our Research Solutions team is focused
on helping customers to better understand biological function
and disease through a complete portfolio of solutions that en
able scientific discovery. Our Process Solutions team provides
products that meet the highest quality and purity standards
with extensive documentation and services to ensure regulatory
compliance. Our Applied Solutions team is focused on supplying
products and workflow solutions that streamline processes,
lower costs and deliver consistent, reliable results for customers.
Performance Materials business sector
The demand for high-tech products in general and innovative
display solutions in particular has seen high global growth
in recent years. This trend is not expected to weaken in the
coming years. Instead, we assume that increasing demand for
these types of consumer goods will come from an expanding
middle class in growth markets. Therefore, we aim to defend
our position as the market and technology leader for liquid
crystals and further expand it as far as possible.
Since the typical life cycle of liquid crystal mixtures is less
than three years, innovation will remain the key success factor.
Our liquid crystals pipeline is well-stocked with new technolo-
gies such as SA-VA (self-aligned vertical alignment) for large-
area displays as well as
UB
-
FFS
(ultra-brightness fringe field
switching), which has already achieved commercial success in
tablets and smartphones. Apart from established applications
in displays of mobile devices and televisions, we are working
to use our expertise as the global market and technology
leader to capture new fields of use for liquid crystal technol-
ogy, for example for liquid crystal windows (
LCW
s) or mobile
antennas.
Our
OLED
business, which is part of the Advanced Technologies
business unit, posted strong, above-average growth in 2015.
We want to further position ourselves in the
OLED
market and
play a leading role in this market segment in the medium
to long term. Lower production costs for
OLED
displays are
a precondition for this. External partnerships will also be used
in the future to ensure the required exchange of technology
and expertise. This includes for example the partnership with
Seiko Epson, which was signed in 2012. Merck and Seiko
Epson together developed a technology to print
OLED
s. As we
expect
OLED
technology to increase in importance in the
future, we are investing in the development of a comprehen-
sive
OLED
portfolio. Among other things, we are investing in
a new
OLED
production plant at our Darmstadt site, where we
are planning to produce materials for modern flat screens and
lighting starting in summer 2016.
The acquisition of AZ Electronic Materials in 2014 sustain-
ably strengthened and diversified the portfolio and the market
position of our Performance Materials business sector, also
beyond the liquid crystals market. All integration measures
were successfully implemented in 2014, adding a further pre-
mium business to the existing profitable businesses. The new
Integrated Circuit Materials business unit offers ultrapure,
innovative specialty chemicals and materials for use in inte-
grated circuits (semiconductors) and equipment, in flat-panel
displays, and for photolithographic printing. Its business
model is similar to that of the other Performance Materials
business units as it is based on innovation, customer proximity,
high market share, and profitability in the growth areas of
displays, semiconductors, organic electronics, and lighting.
Additionally, the integration of the
SAFC
Hitech business of
Sigma-Aldrich has complemented the product offering of the
Integrated Circuit Materials business unit as a leading global
supplier to the electronics and semiconductor industries.
Within our Pigments & Functional Materials business unit,
the focus of decorative effect pigments is on market and tech-
nological leadership in clearly defined markets for pearl luster
pigments, for instance in applications for high-quality auto-
mo
tive and industrial coatings. The main focus of functional
materials is on niche applications in cosmetics, for example
UV filters, insect protection, anti-aging, as well as technical
functional materials such as laser marking and antistatic appli-
cations.
Strategic financial and dividend policy
We are pursuing a conservative financial policy characterized
by the following aspects:
Financial flexibility and a conservative funding strategy
We ensure that we meet our obligations at all times and
adhere to a conservative and proactive funding strategy that
involves the use of various financial instruments.
Objectives and Strategies
Fundamental Information about the Group
Combined Management Report
57
We have diversified and profitable businesses as the basis for
our strong and sustainable cash flow generation capacity. More-
over,
we have several funding resources in place. A € 2 billion
syndicated loan facility maturing in 2020 exists to cover any
unexpected cash needs. The facility is a pure back-up credit
facility and has not been drawn on so far. In addition, we can
use our € 2 billion commercial paper program to issue short-
term commercial paper with a maturity of up to one year.
Furthermore, we are using bilateral bank loan agreements
with first-class banks in order to optimize the funding struc-
ture and cost. Our € 15 billion Debt Issuance Program as one
of the cornerstone financing vehicles enables us to issue bonds
in Europe at short notice and at any time if markets allow. In
addition, we issued hybrid bonds amounting to € 1.5 billion in
2014 and U.S. dollar bonds amounting to US$ 4 billion in 2015
outside the Debt Issuance Program in order to broaden the
funding basis and to address different investor groups.
Maintaining sustainable and reliable business relations
with a core banking group
We mainly work with a well-diversified, financially stable and
reliable banking group. Due to Merck’s long-term oriented
business approach, bank relationships typically last for many
years and are characterized by professionalism and trust. The
banking group consists of banks with strong capabilities and
expertise in various products and geographic regions. We
regard these banks as strategic partners. Accordingly, they
are involved in important financing transactions, for instance
the financing of the Sigma-Aldrich acquisition.
Strong investment grade rating
The rating of our creditworthiness by external rating agencies
is an important indicator of the company’s financial stability.
A strong investment grade rating is an important cornerstone
of Merck’s financial policy, as it safeguards access to capital
markets at attractive financial conditions. Merck currently has
a Baa1 rating from Moody’s and an A rating from Standard &
Poor’s (S&P), both with a negative outlook following the acqui-
sition of Sigma-Aldrich. Within the next two to three years, it
is of utmost importance to us to sharply reduce our debt and to
regain the ratings we had prior to the Sigma-Aldrich acquisi-
tion.
Dividend policy
We are pursuing a sustainable dividend policy. Provided that
the economic environment develops in a stable manner, the
current dividend represents the minimum level for future
dividend proposals. The dividend policy follows the business
development and earnings increase of the coming years. How
ever, dividend growth could deviate, for example within the
scope of restructuring or in the event of significant global
economic developments. We also aim for a target corridor of
20% to 25% of
EPS
pre exceptionals.
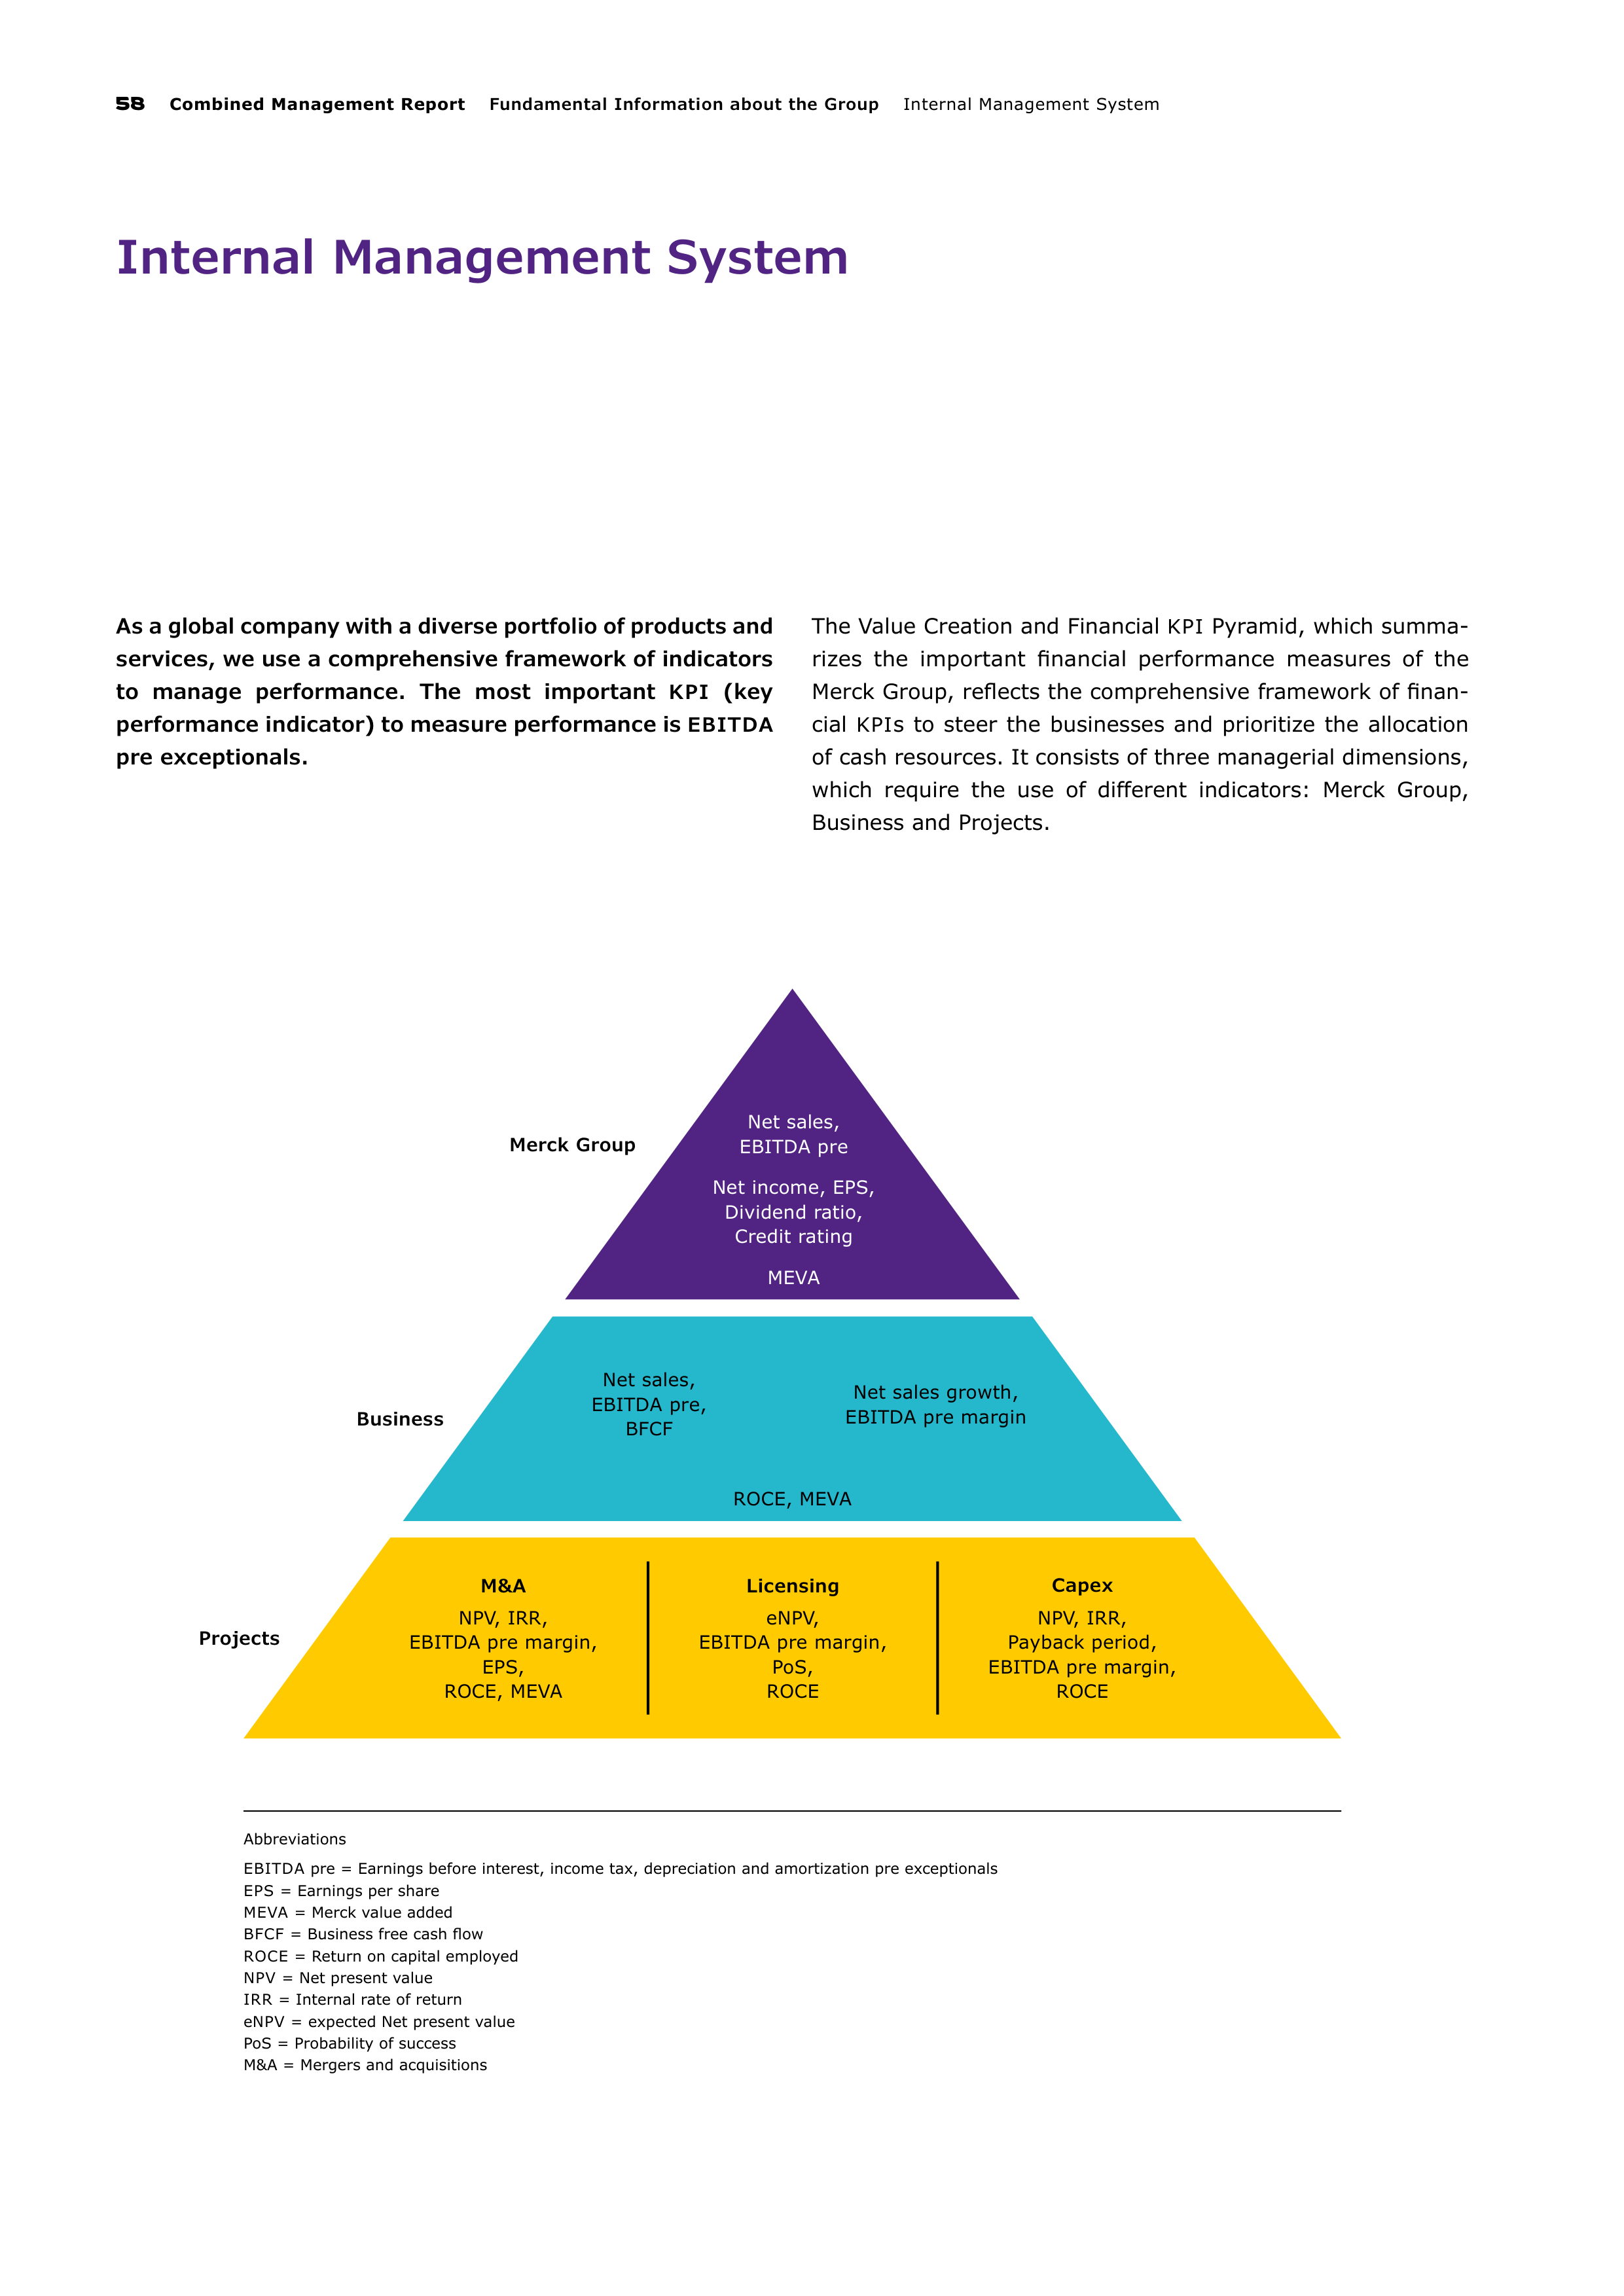
58
Combined Management Report
Fundamental Information about the Group
Internal Management System
Net sales,
EBITDA pre,
BFCF
Net sales growth,
EBITDA pre margin
ROCE, MEVA
M&A
NPV, IRR,
EBITDA pre margin,
EPS,
ROCE, MEVA
Licensing
eNPV,
EBITDA pre margin,
PoS,
ROCE
Capex
NPV, IRR,
Payback period,
EBITDA pre margin,
ROCE
Net sales,
EBITDA pre
Net income, EPS,
Dividend ratio,
Credit rating
MEVA
Merck Group
Business
Projects
Internal Management System
As a global company with a diverse portfolio of products and
services, we use a comprehensive framework of indicators
to manage performance. The most important
KPI
(key
performance indicator) to measure performance is
EBITDA
pre exceptionals.
The Value Creation and Financial
KPI
Pyramid, which summa-
rizes the important financial performance measures of the
Merck Group, reflects the comprehensive framework of finan-
cial
KPI
s to steer the businesses and prioritize the allocation
of cash resources. It consists of three managerial dimensions,
which require the use of different indicators: Merck Group,
Business and Projects.
Abbreviations
EBITDA pre = Earnings before interest, income tax, depreciation and amortization pre exceptionals
EPS = Earnings per share
MEVA = Merck value added
BFCF = Business free cash flow
ROCE = Return on capital employed
NPV = Net present value
IRR = Internal rate of return
eNPV = expected Net present value
PoS = Probability of success
M&A = Mergers and acquisitions
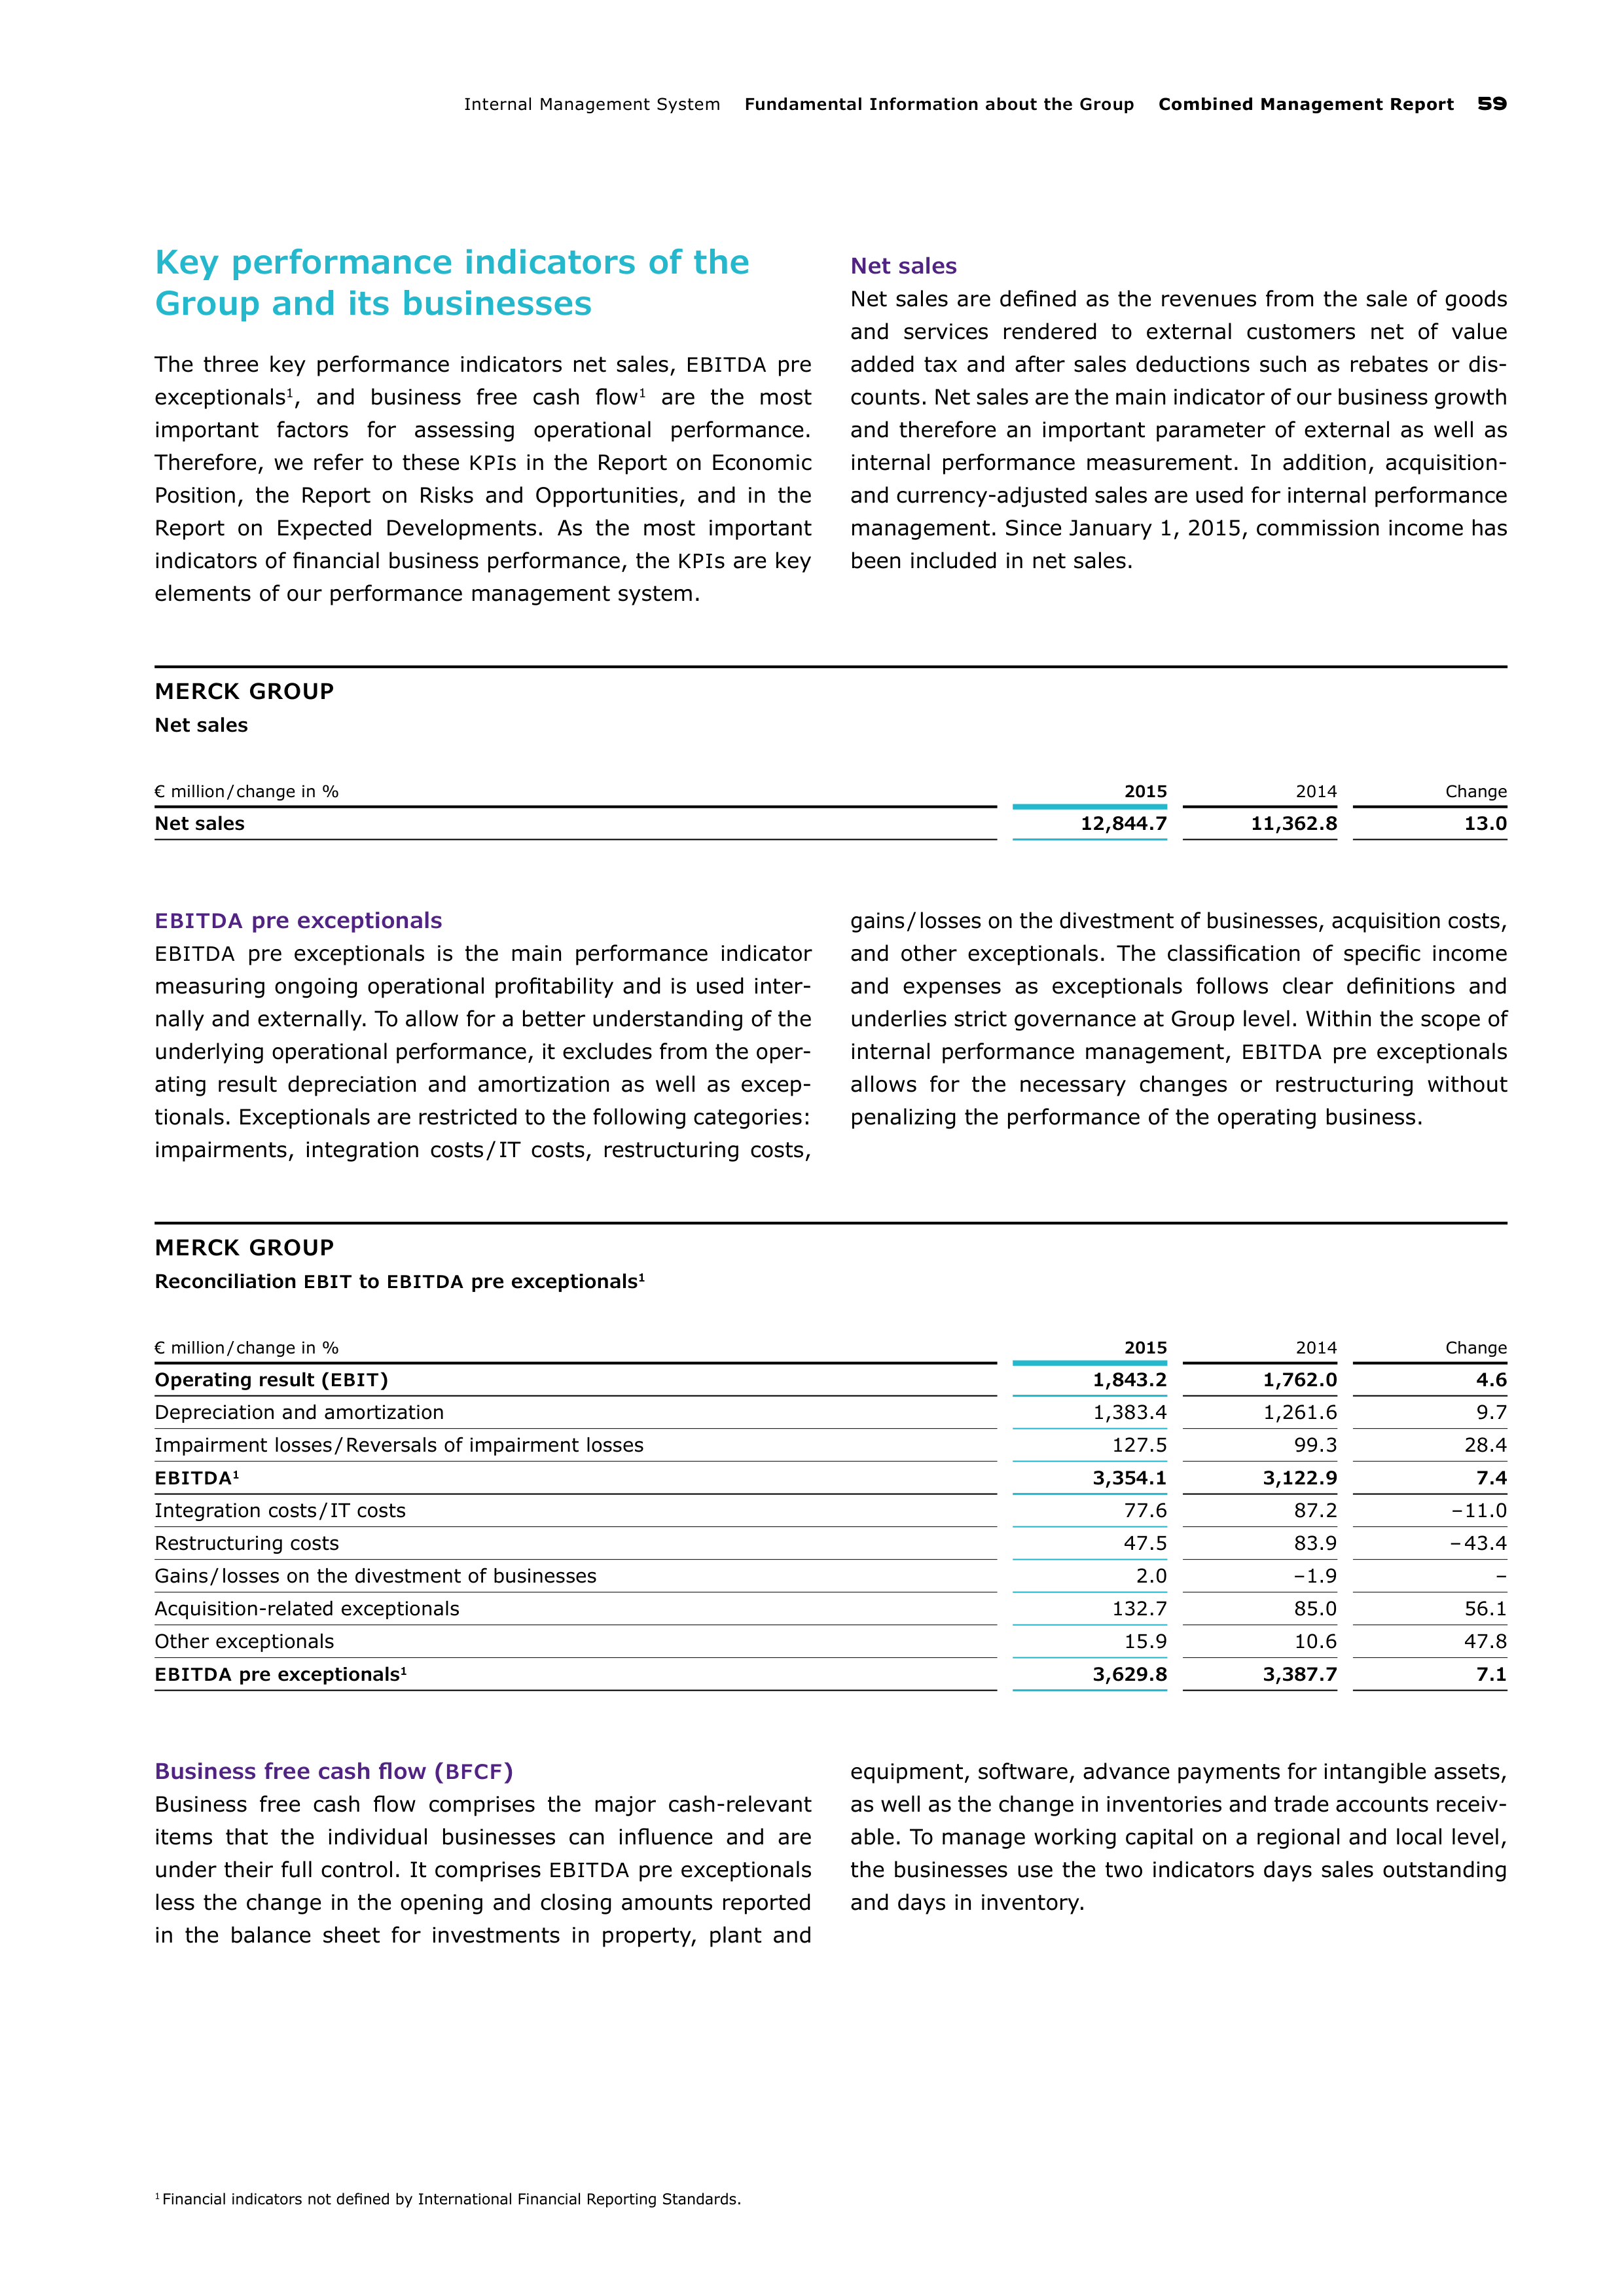
Internal Management System
Fundamental Information about the Group
Combined Management Report
59
Key performance indicators of the
Group and its businesses
The three key performance indicators net sales,
EBITDA
pre
exceptionals
1
, and business free cash flow
1
are the most
important factors for assessing operational performance.
Therefore, we refer to these
KPI
s in the Report on Economic
Position, the Report on Risks and Opportunities, and in the
Report on Expected Developments. As the most important
indicators of financial business performance, the
KPI
s are key
elements of our performance management system.
Net sales
Net sales are defined as the revenues from the sale of goods
and services rendered to external customers net of value
added tax and after sales deductions such as rebates or dis-
counts. Net sales are the main indicator of our business growth
and therefore an important parameter of external as well as
internal performance measurement. In addition, acquisition-
and currency-adjusted sales are used for internal performance
management. Since January 1, 2015, commission income has
been included in net sales.
MERCK GROUP
Net sales
€ million / change in %
2015
2014
Change
Net sales
12,844.7
11,362.8
13.0
EBITDA
pre exceptionals
EBITDA
pre exceptionals is the main performance indicator
measuring ongoing operational profitability and is used inter-
nally and externally. To allow for a better understanding of the
underlying operational performance, it excludes from the oper-
ating
result depreciation and amortization as well as excep-
tionals. Exceptionals are restricted to the following categories:
impairments, integration costs / IT costs, restructuring costs,
gains / losses on the divestment of businesses, acquisition costs,
and other exceptionals. The classification of specific income
and expenses as exceptionals follows clear definitions and
underlies strict governance at Group level. Within the scope of
internal performance management,
EBITDA
pre exceptionals
allows for the necessary changes or restructuring without
penalizing the performance of the operating business.
MERCK GROUP
Reconciliation
EBIT
to
EBITDA
pre exceptionals
1
€ million / change in %
2015
2014
Change
Operating result (
EBIT
)
1,843.2
1,762.0
4.6
Depreciation and amortization
1,383.4
1,261.6
9.7
Impairment losses / Reversals of impairment losses
127.5
99.3
28.4
EBITDA
1
3,354.1
3,122.9
7.4
Integration costs / IT costs
77.6
87.2
– 11.0
Restructuring costs
47.5
83.9
– 43.4
Gains / losses on the divestment of businesses
2.0
– 1.9
–
Acquisition-related exceptionals
132.7
85.0
56.1
Other exceptionals
15.9
10.6
47.8
EBITDA
pre exceptionals
1
3,629.8
3,387.7
7.1
Business free cash flow (
BFCF
)
Business free cash flow comprises the major cash-relevant
items that the individual businesses can influence and are
under their full control. It comprises
EBITDA
pre exceptionals
less the change in the opening and closing amounts reported
in the balance sheet for investments in property, plant and
equipment, software, advance payments for intangible assets,
as well as the change in inventories and trade accounts receiv-
able. To manage working capital on a regional and local level,
the businesses use the two indicators days sales outstanding
and days in inventory.
1
Financial indicators not defined by International Financial Reporting Standards.
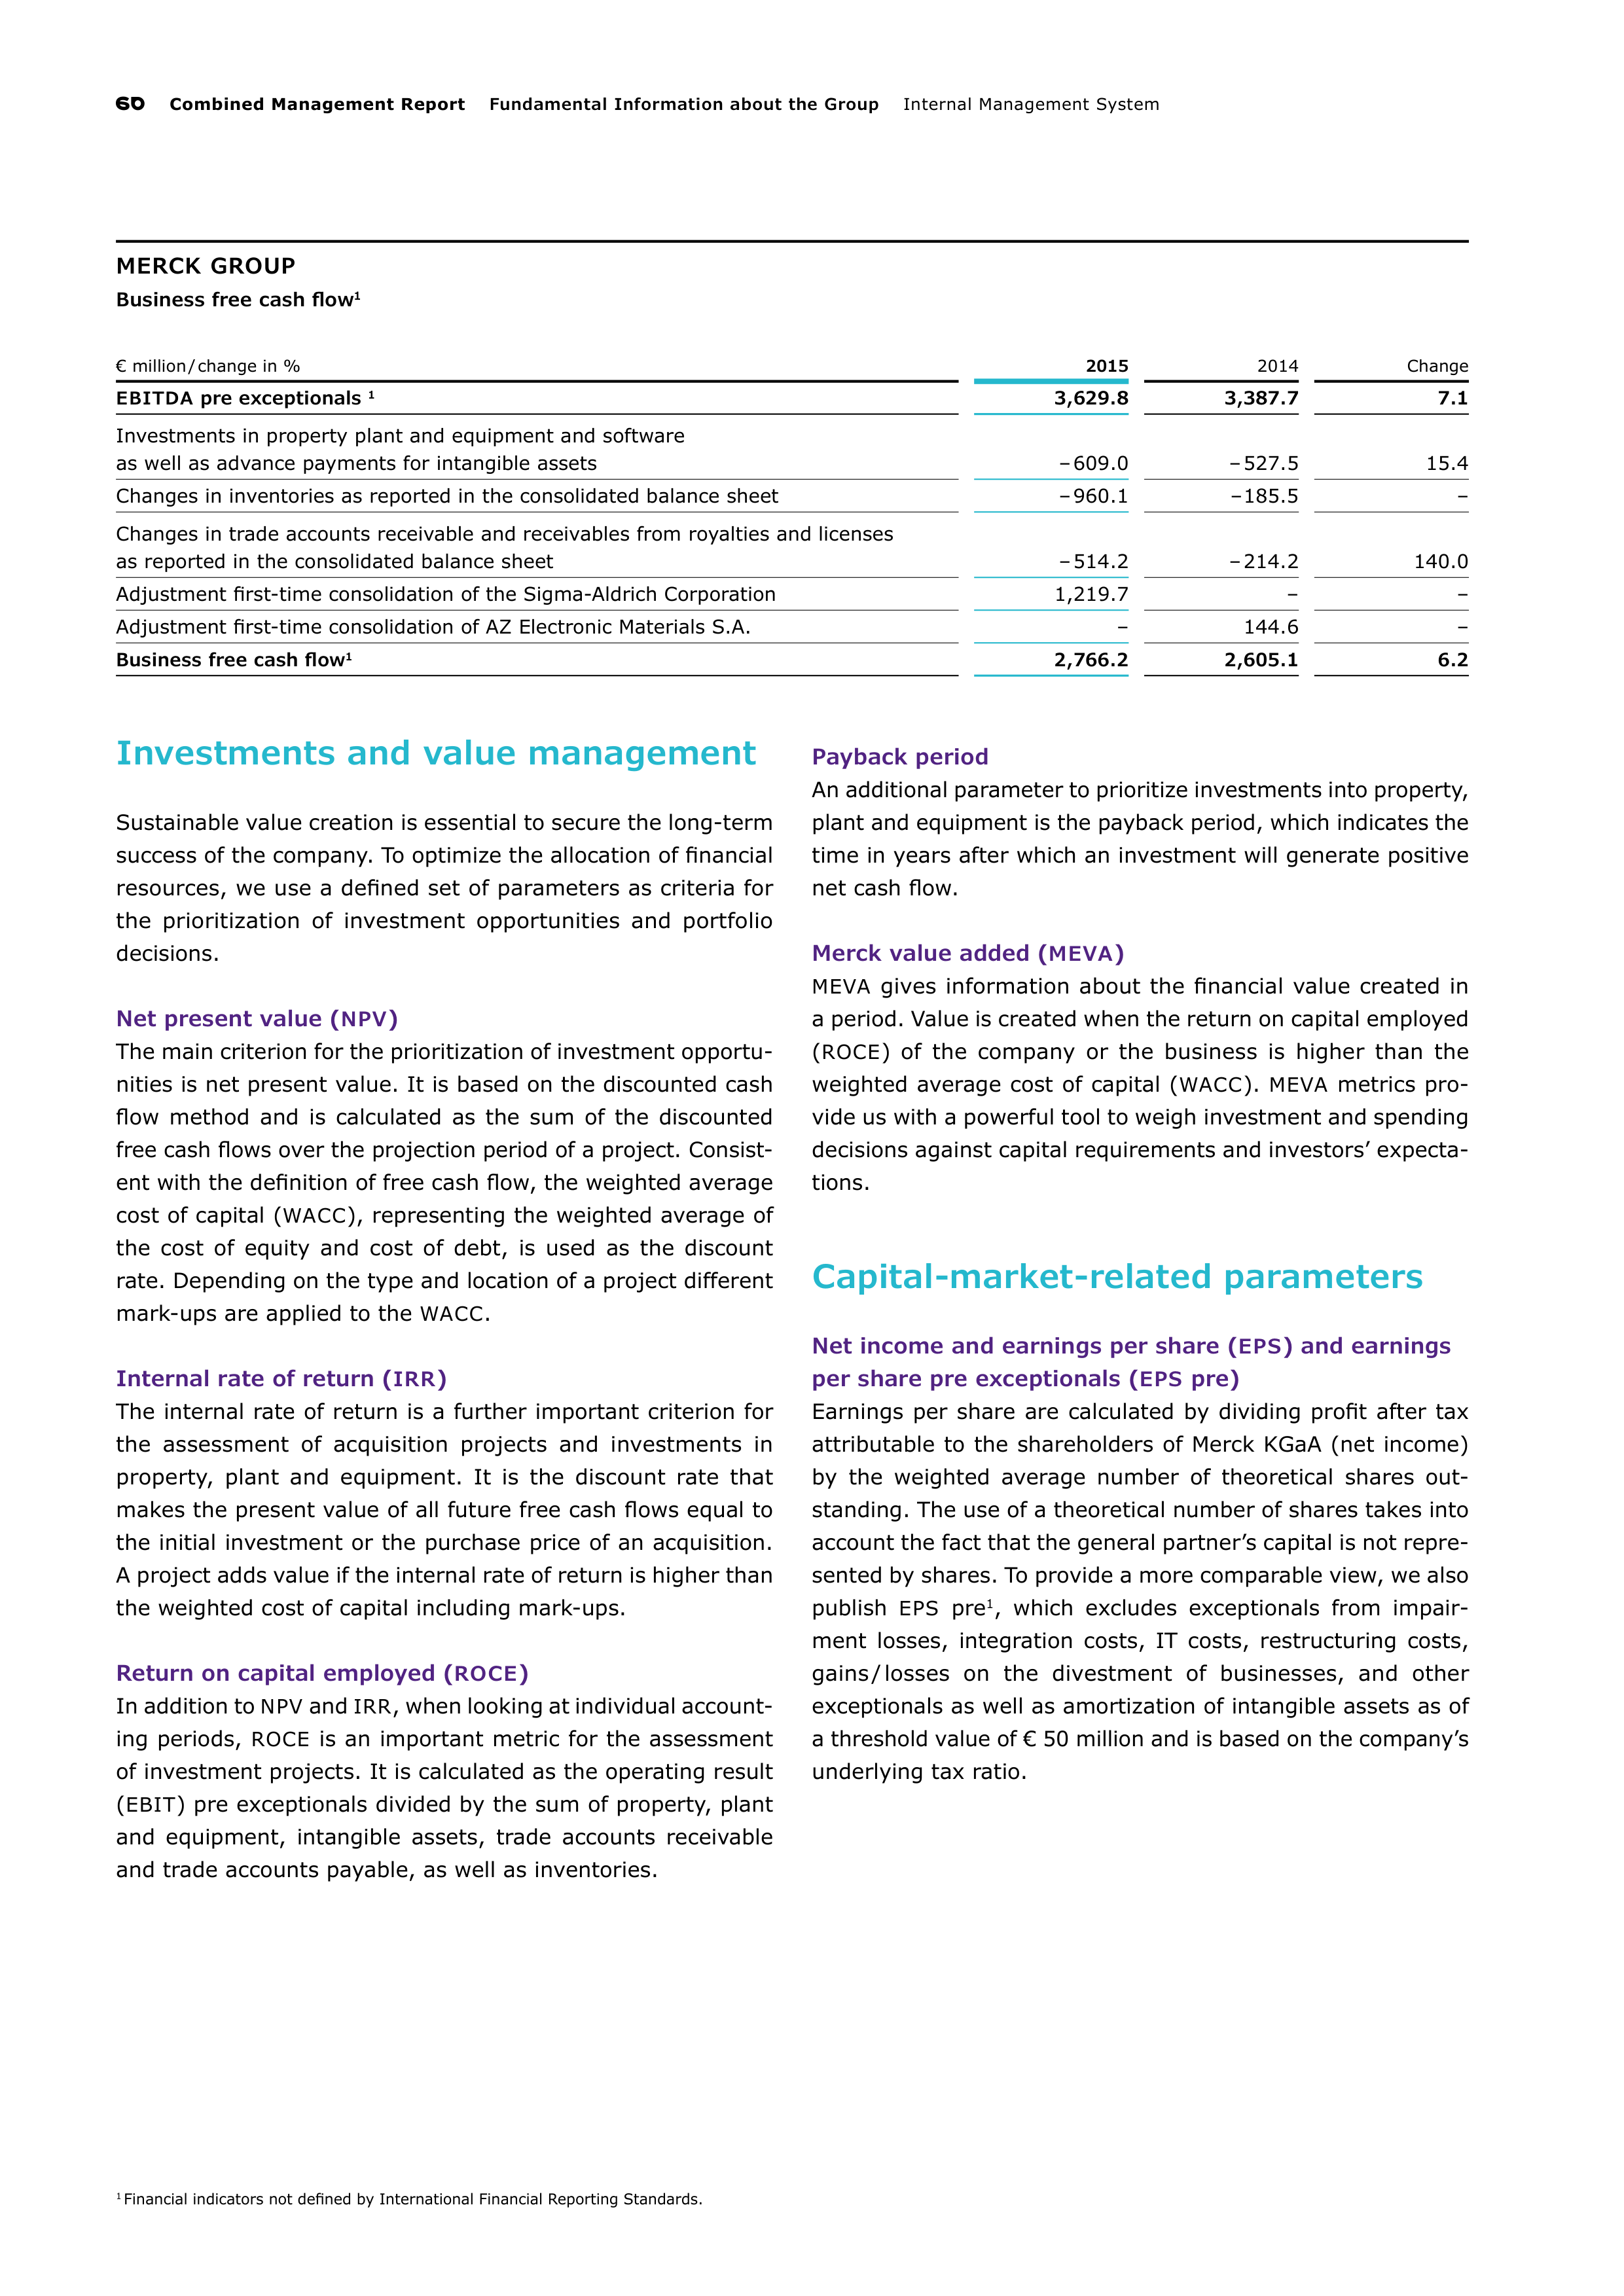
60
Combined Management Report
Fundamental Information about the Group
Internal Management System
MERCK GROUP
Business free cash flow
1
€ million / change in %
2015
2014
Change
EBITDA
pre exceptionals
1
3,629.8
3,387.7
7.1
Investments in property plant and equipment and software
as well as advance payments for intangible assets
– 609.0
– 527.5
15.4
Changes in inventories as reported in the consolidated balance sheet
– 960.1
– 185.5
–
Changes in trade accounts receivable and receivables from royalties and licenses
as reported in the consolidated balance sheet
– 514.2
– 214.2
140.0
Adjustment first-time consolidation of the Sigma-Aldrich Corporation
1,219.7
–
–
Adjustment first-time consolidation of AZ Electronic Materials S.A.
–
144.6
–
Business free cash flow
1
2,766.2
2,605.1
6.2
Investments and value management
Sustainable value creation is essential to secure the long-term
success of the company. To optimize the allocation of financial
resources, we use a defined set of parameters as criteria for
the prioritization of investment opportunities and portfolio
decisions.
Net present value (
NPV
)
The main criterion for the prioritization of investment opportu-
nities is net present value. It is based on the discounted cash
flow method and is calculated as the sum of the discounted
free cash flows over the projection period of a project. Consist-
ent
with the definition of free cash flow, the weighted average
cost of capital (
WACC
), representing the weighted average of
the cost of equity and cost of debt, is used as the discount
rate. Depending on the type and location of a project different
mark-ups are applied to the
WACC
.
Internal rate of return (
IRR
)
The internal rate of return is a further important criterion for
the assessment of acquisition projects and investments in
property, plant and equipment. It is the discount rate that
makes the present value of all future free cash flows equal to
the initial investment or the purchase price of an acquisition.
A project adds value if the internal rate of return is higher than
the weighted cost of capital including mark-ups.
Return on capital employed (
ROCE
)
In addition to
NPV
and
IRR
, when looking at individual account-
ing periods,
ROCE
is an important metric for the assessment
of investment projects. It is calculated as the operating result
(
EBIT
) pre exceptionals divided by the sum of property, plant
and equipment, intangible assets, trade accounts receivable
and trade accounts payable, as well as inventories.
Payback period
An additional parameter to prioritize investments into property,
plant and equipment is the payback period, which indicates the
time in years after which an investment will generate positive
net cash flow.
Merck value added (
MEVA
)
MEVA
gives information about the financial value created in
a period. Value is created when the return on capital employed
(
ROCE
)
of the company or the business is higher than the
weighted average cost of capital (
WACC
).
MEVA
metrics pro-
vide us with a powerful tool to weigh investment and spending
decisions against capital requirements and investors’ expecta-
tions.
Capital-market-related parameters
Net income and earnings per share (
EPS
) and earnings
per share pre exceptionals (
EPS
pre)
Earnings per share are calculated by dividing profit after tax
attributable to the shareholders of Merck KGaA (net income)
by the weighted average number of theoretical shares out-
standing. The use of a theoretical number of shares takes into
account the fact that the general partner’s capital is not repre-
sented by shares. To provide a more comparable view, we also
publish
EPS
pre
1
, which excludes exceptionals from impair-
ment losses, integration costs, IT costs, restructuring costs,
gains / losses on the divestment of businesses, and other
exceptionals as well as amortization of intangible assets as of
a threshold value of € 50 million and is based on the company’s
underlying tax ratio.
1
Financial indicators not defined by International Financial Reporting Standards.
Internal Management System
Fundamental Information about the Group
Combined Management Report
61
Credit rating
The rating of our creditworthiness by external agencies is an
important indicator with respect to our ability to raise debt
capital at attractive market conditions. The capital market
makes use of the assessments published by independent rating
agencies in order to assist debt providers in estimating the
risks associated with a financial instrument. We are currently
assessed by Moody’s and Standard & Poor’s (S&P). The most
important factor for the credit rating is the ability to repay
debt, which is determined in particular by the ratio of operating
cash flow to (net) financial debt.
Dividend ratio
With the aim of ensuring an attractive return to our share-
holders, we are pursuing a reliable dividend policy with a target
payout ratio based on
EPS
pre exceptionals (see definition
above).
Other relevant / non-financial
performance measures
Apart from the indicators of the financial performance of the
businesses, non-financial measures also play an important
role in furthering the success of the company. From a Group
perspective, specifically innovations in the businesses as well
as the attraction and retention of highly qualified employees
are of central importance.
Innovation
Innovations are the foundation of our business and will also be
the prerequisite for future success in changing markets. We
are continuously working to develop new products and service
innovations for patients and customers. Indicators for the
degree of innovation are defined individually depending on the
specifics of the respective businesses.
Talent retention
Employing a highly qualified and motivated workforce is the
basis for achieving our ambitious business goals. Therefore, we
put a strong focus on establishing the processes and the envi-
ronment needed to attract and retain the right talent with the
right capabilities at the right time. To measure the success of
the related measures, we have implemented talent retention
as an important non-financial indicator.
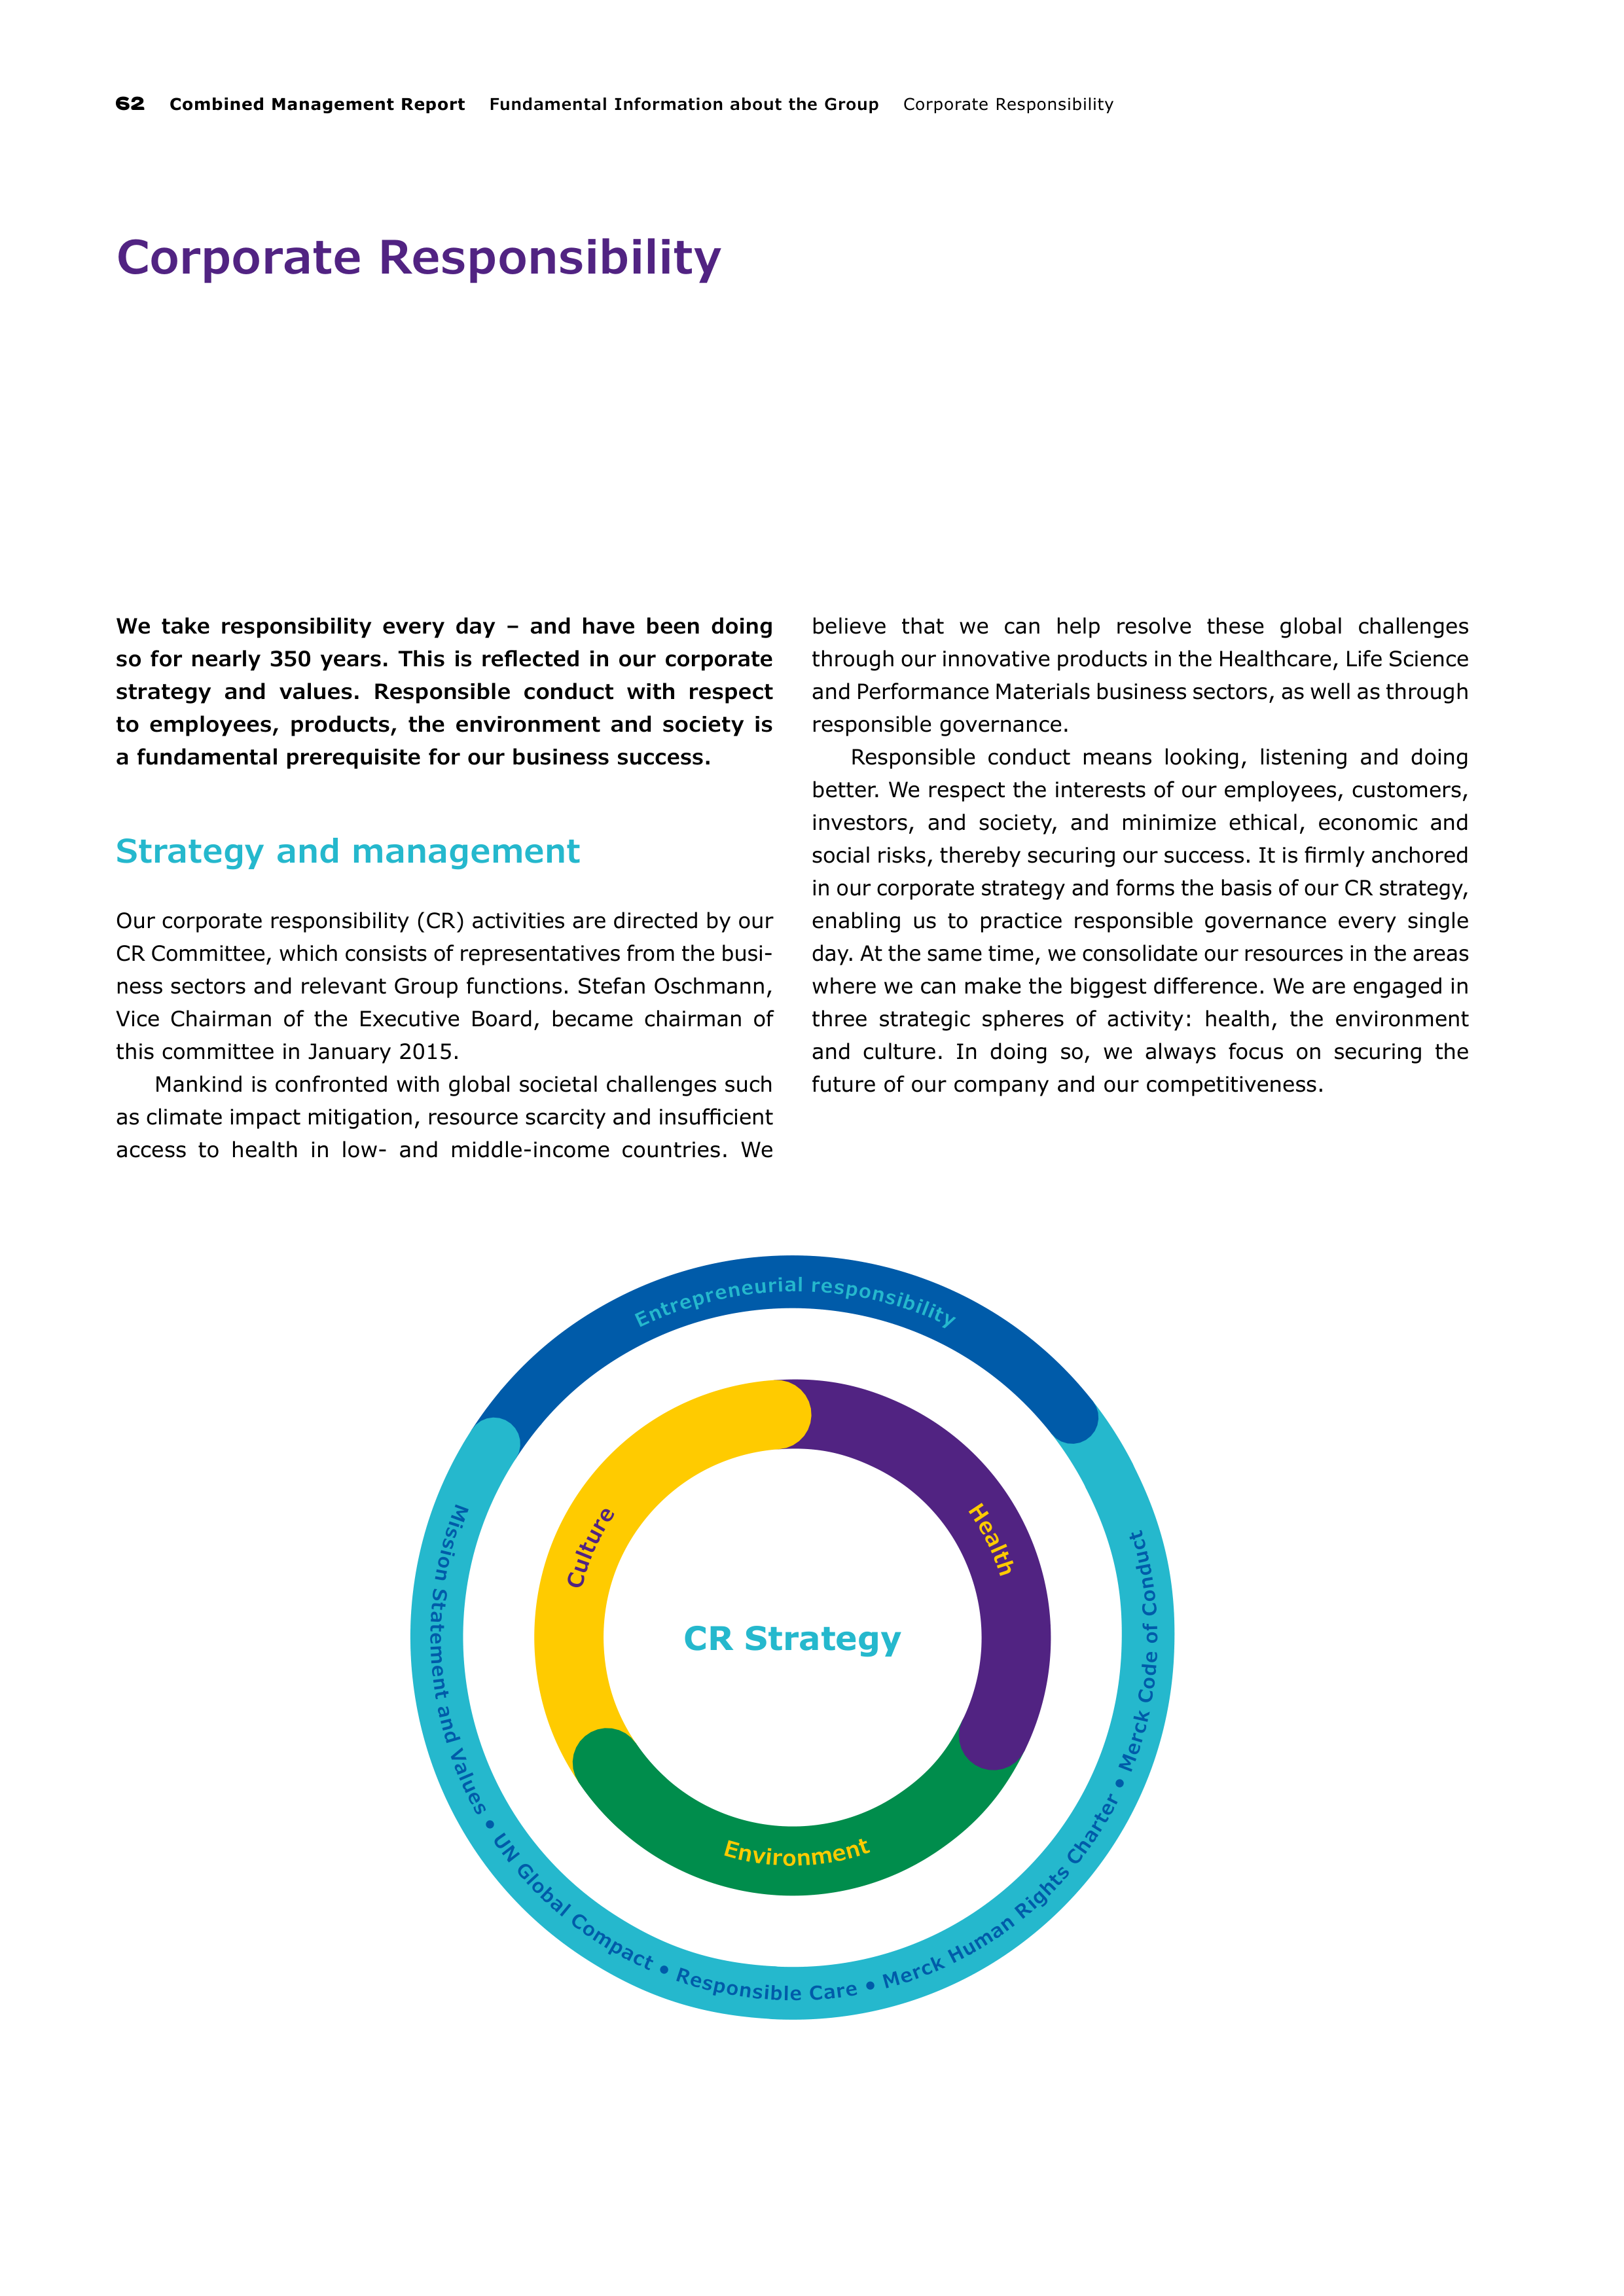
62
Combined Management Report
Fundamental Information about the Group
Corporate Responsibility
M
i
s
s
i
o
n
S
t
a
t
e
m
e
n
t
a
n
d
V
a
l
u
e
s
•
U
N
G
l
o
b
a
l
C
o
m
p
a
c
t
•
R
e
s
p
o
n
s
i
b
l
e
C
a
r
e
•
M
e
r
c
k
H
u
m
a
n
R
i
g
h
t
s
C
h
a
r
t
e
r
•
M
e
r
c
k
C
o
d
e
o
f
C
o
n
d
u
c
t
C
u
l
t
u
r
e
H
e
a
l
t
h
E
n
t
r
e
p
r
e
n
e
u
r
i
a
l
re
s
p
o
n
s
i
b
i
l
i
t
y
CR Strategy
E
n
v
i
r
o
n
m
e
n
t
Corporate Responsibility
We take responsibility every day – and have been doing
so for nearly 350 years. This is reflected in our corporate
strategy and values. Responsible conduct with respect
to employees, products, the environment and society is
a fundamental prerequisite for our business success.
Strategy and management
Our corporate responsibility (CR) activities are directed by our
CR Committee, which consists of representatives from the busi-
ness
sectors and relevant Group functions. Stefan Oschmann,
Vice Chairman of the Executive Board, became chairman of
this committee in January 2015.
Mankind is confronted with global societal challenges such
as climate impact mitigation, resource scarcity and insufficient
access to health in low- and middle-income countries. We
believe that we can help resolve these global challenges
through our innovative products in the Healthcare, Life Science
and Performance Materials business sectors, as well as through
responsible governance.
Responsible conduct means looking, listening and doing
better. We respect the interests of our employees, customers,
investors, and society, and minimize ethical, economic and
social risks, thereby securing our success. It is firmly anchored
in our corporate strategy and forms the basis of our CR strategy,
enabling us to practice responsible governance every single
day. At the same time, we consolidate our resources in the areas
where we can make the biggest difference. We are engaged in
three strategic spheres of activity: health, the environment
and culture. In doing so, we always focus on securing the
future of our company and our competitiveness.
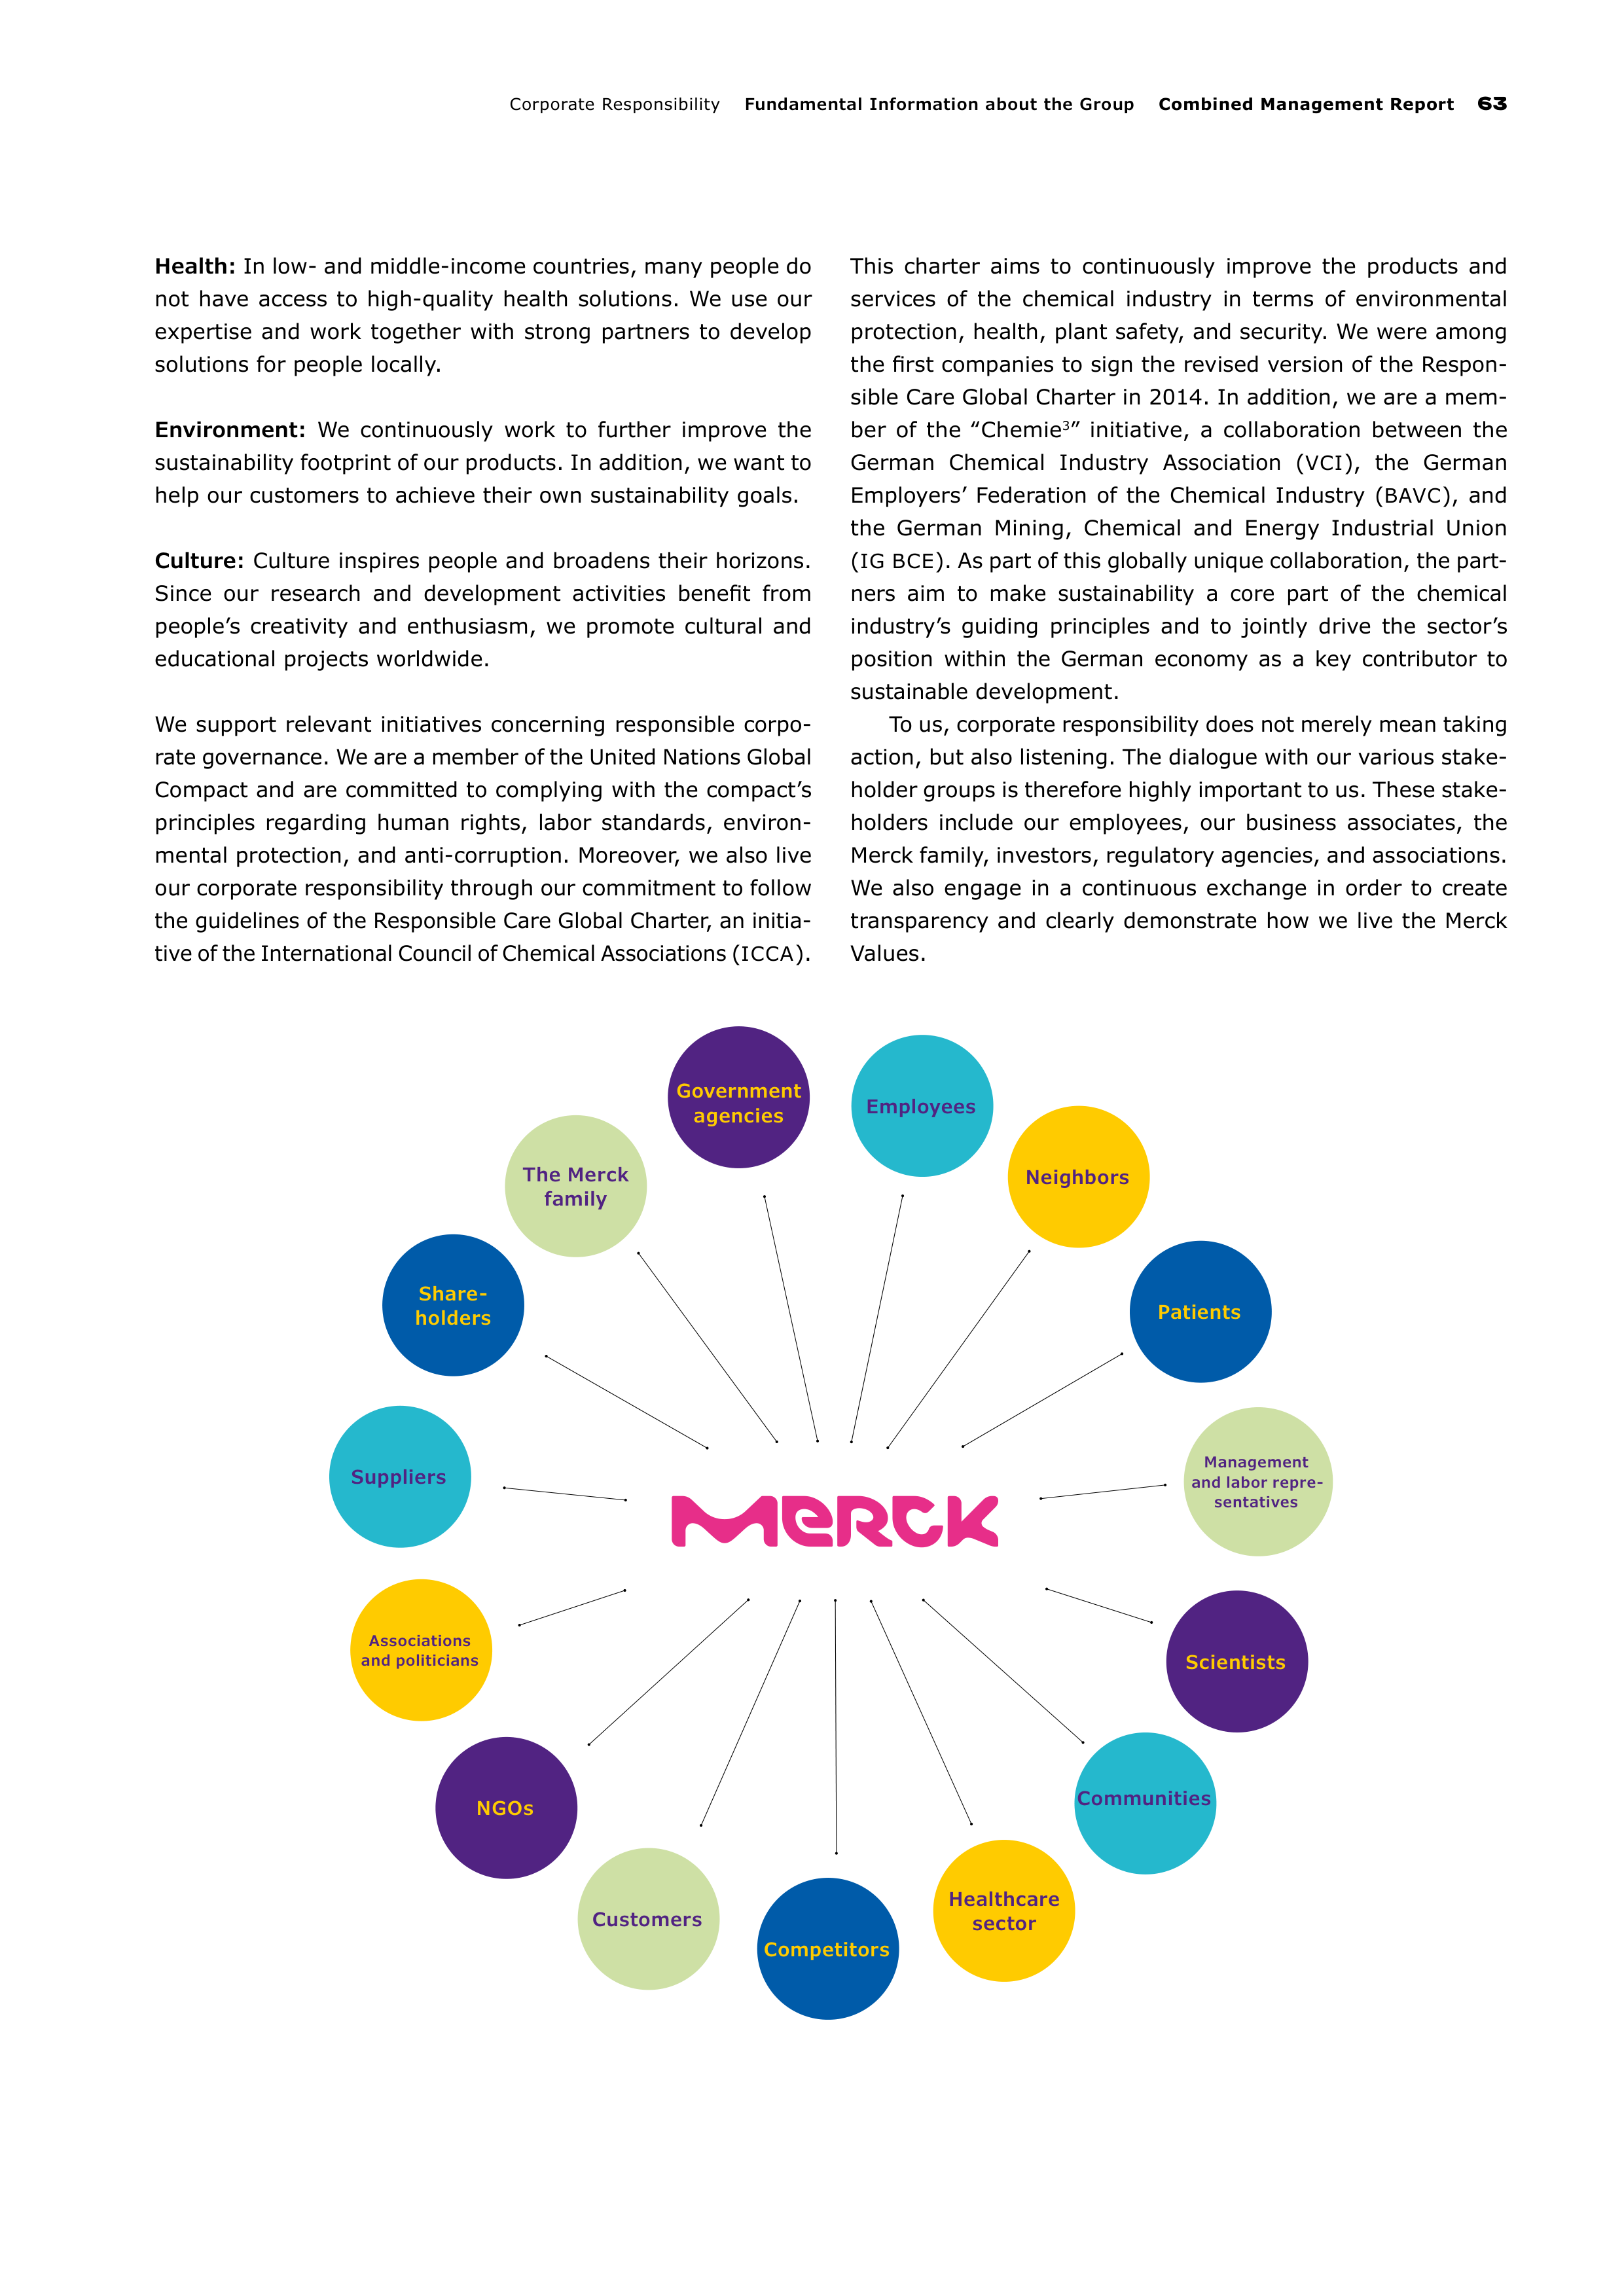
Corporate Responsibility
Fundamental Information about the Group
Combined Management Report
63
The Merck
family
Government
agencies
Employees
Neighbors
Patients
Management
and labor repre-
sentatives
Scientists
Communities
Healthcare
sector
Competitors
Customers
Suppliers
NGOs
Associations
and politicians
Share-
holders
Health:
In low- and middle-income countries, many people do
not have access to high-quality health solutions. We use our
expertise and work together with strong partners to develop
solutions for people locally.
Environment:
We continuously work to further improve the
sustainability footprint of our products. In addition, we want to
help our customers to achieve their own sustainability goals.
Culture:
Culture inspires people and broadens their horizons.
Since our research and development activities benefit from
people’s creativity and enthusiasm, we promote cultural and
educational projects worldwide.
We support relevant initiatives concerning responsible corpo-
rate governance. We are a member of the United Nations Global
Compact and are committed to complying with the compact’s
principles regarding human rights, labor standards, environ-
mental protection, and anti-corruption. Moreover, we also live
our corporate responsibility through our commitment to follow
the guidelines of the Responsible Care Global Charter, an initia-
tive of the International Council of Chemical Associations
(
ICCA
).
This charter aims to continuously improve the products and
services of the chemical industry in terms of environmental
protection, health, plant safety, and security. We were among
the first companies to sign the revised version of the Respon-
sible Care Global Charter in 2014. In addition, we are a mem-
ber of the ‟Chemie
3
” initiative, a collaboration between the
German Chemical Industry Association (
VCI
), the German
Employers’ Federation of the Chemical Industry (
BAVC
), and
the German Mining, Chemical and Energy Industrial Union
(
IG
BCE
). As part of this globally unique collaboration, the part-
ners aim to make sustainability a core part of the chemical
industry’s
guiding principles and to jointly drive the sector’s
position
within the German economy as a key contributor to
sustainable
development.
To us, corporate responsibility does not merely mean taking
action, but also listening. The dialogue with our various stake-
holder groups is therefore highly important to us. These stake-
holders include our employees, our business associates, the
Merck family, investors, regulatory agencies, and associations.
We also engage in a continuous exchange in order to create
transparency and clearly demonstrate how we live the Merck
Values.
64
Combined Management Report
Fundamental Information about the Group
Corporate Responsibility
Thanks to good performance with respect to responsible, sus-
tainable entrepreneurial conduct, we were again included in
the
FTSE
4Good index in 2015. To be included in this leading
international sustainability index, a company must demonstrate
socially conscientious, ecological and ethical conduct. In 2015,
we maintained our good position in other major sustainability
indices as well. For instance, we were once more included in
the
STOXX
Global
ESG
Leaders index and are also listed on the
Euronext Vigeo Eurozone 120 index.
Strategic sphere of activity: Health
Access to Health (A2H) is one of our strategic priorities. Through
our A2H approach, which spans all our businesses, we aim to
help improve sustainable access to high-quality health solu-
tions for underserved populations and communities in low- and
middle-income countries. Since we realize that access is a com-
plex and multifaceted challenge with no one-size-fits-all
solution, our programs and initiatives are tailored to global,
regional and local needs. We consider partnerships, collabora-
tion and dialogue to be key instruments in delivering sustain-
able access results. Our efforts are supportive of the United
Nations Sustainable Development Goals (
SDG
s).
During his presidency of the International Federation of
Pharmaceutical Manufacturers & Associations (
IFPMA
), Stefan
Oschmann, Vice Chairman of the Executive Board, is focusing
on the core topic of accelerating access to high-quality health
solutions for people in low- and middle-income countries.
Our Access to Health strategy focuses on four areas, the
4As of Availability, Affordability, Awareness, and Accessibility.
Availability
Availability entails the research, development and refinement
of health solutions that address unmet needs and are tailored
to local environments. Together with our partners, we are
working to fight widespread diseases in developing countries.
One example is the Pediatric Praziquantel Consortium. Through
this public-private partnership, we are working on a pediatric
formulation of praziquantel to treat the worm disease schisto-
somiasis in children under the age of six. In 2015, the consor-
tium completed a Phase I trial with healthy subjects in South
Africa as well as a taste study with children in Tanzania. In
June 2015, the consortium was awarded a prestigious research
grant from the Japanese Global Health Innovation Technology
Fund for the second time. Another example is Merck’s partner-
ship with the Medicines for Malaria Venue, a non-profit research
foundation, to develop new antimalarials. In addition, our
Healthcare and Life Science business sectors are currently
developing a malaria diagnosis kit based on the Muse cell
analysis system. The aims are to detect and determine the
malaria pathogen as well as to determine relevant immune
cells in the case of a possibly concurrent
HIV
infection.
Affordability
We seek to address affordability challenges through our efforts
to provide assistance to those who are unable to pay for the
health solutions they need. To tackle these challenges, we
have taken a pro-access approach through our intellectual
property initiatives and are engaging in equitable pricing strat-
egies. We are a member of
WIPO
Re:Search, an open innova-
tion platform, sponsored by the World Intellectual Property
Organization, to accelerate early discovery of active ingredi-
ents to treat infectious diseases through intellectual property
and knowledge sharing. In 2015, we started our first collabo-
ration with the University of Buea in Cameroon, which aims to
repurpose compounds from our library to develop a treatment
for onchocerciasis, also known as river blindness. To this end
we are strengthening the development of local skills and
research expertise. Furthermore, we are working with the
World Health Organization (
WHO
) to combat the worm disease
schistosomiasis in Africa. We donate Cesol
®
600 tablets
containing the active ingredient praziquantel to
WHO
, and in
2015 we donated more than 100 million tablets. Since the
start of the program, around 74 million patients, primarily
school children, have been treated. As of 2016, we will supply
WHO
with up to 250 million praziquantel tablets annually. As
a founding member of the Global Schistosomiasis Alliance, we
are helping to eliminate schistosomiasis worldwide.
Awareness
We help to raise awareness by empowering health workers,
communities and patients with appropriate tools, knowledge
and skills to make informed decisions. With our Access Dialogues
series, we aim to promote information exchange and discus-
sion with numerous public and private stakeholders. In 2015,
the focus was on the topics of intellectual property and supply
chains. In India, we are supporting the Suswastha project
together with various non-governmental organizations and
the Indian Health and Family Ministry. The aim is to provide
underserved rural populations with affordable health solutions
and to engage patients through community-level meetings
as well as educative health programs. In 2015, the project
reached a total of more than 15,000 people through 717 com-
munity meetings and 43 health workshops. The non-profit
organization Global Pharma Health Fund (
GPHF
), which is
funded by Merck, combats counterfeit medicines in developing
and emerging countries. To date, the
GPHF
has supplied more
than 700 Minilabs at cost to detect counterfeit medicines in
more than 90 countries. In addition, through our Capacity
Advancement Program (
CAP
), we want to raise awareness and
further the prevention of non-communicable diseases such as
diabetes and cancer, as well as address the issue of infertility.
(Detailed information can be found in the story entitled
‟Awareness” in the magazine section of this Annual Report,
starting on page 24).
Corporate Responsibility
Fundamental Information about the Group
Combined Management Report
65
Accessibility
We promote initiatives to strengthen supply chains and to
develop localized health solutions in order to deliver and reach
out efficiently at the point of care. Using heat sensors, for
example, we monitor the transportation conditions of our pri-
mary shipments from Europe to the rest of the world. Patients
can therefore be assured that our products are kept and
released under the right conditions according to registration.
Furthermore, we support the expertise and training of the
managers of our partners in Africa, Asia and Latin America to
strengthen local quality manufacturing standards. In India, we
are cooperating with the non-governmental organization River
Narmada Samagra. Our river ambulance transports health
workers and provides healthcare solutions to local populations
living in the remote region along the Narmada River. At the
beginning of 2016, we donated a new boat to River Narmada
Samagra so that even more people can be reached in the
future. Additionally, in the Jharkhand region of northeastern
India, we are financing a health center visited by approxi-
mately 150 patients per month.
Strategic sphere of activity:
Environment
Through our products we are helping to overcome global chal-
lenges such as climate impact mitigation and resource scarcity.
At the same time, we are also helping our customers achieve
their own sustainability goals.
Developing sustainable products
We strive to continuously enhance the sustainability footprint of
our products and are working to offer our customers products
that enable them to reduce the negative impact of their own
activities, as well as to achieve their own sustainability goals.
For instance, we are developing innovative materials for energy-
efficient liquid crystal and
OLED
displays and are thus helping
our customers develop environmentally sustainable processes.
Thanks to our liquid crystal technology PS-VA, displays consume
approximately 20% less energy in comparison to the preceding
VA technology. The new
UB
-
FFS
technology (ultra-brightness
fringe field switching) provides displays with up to 15% more
l
ight transmittance, thus further reducing energy consumption.
We are also developing liquid crystals for new applications. For
instance, we are working with architects, glass makers and
façade manufacturers to create the windows of tomorrow. Our
ambitious goal is to use smart windows to make buildings
more energy-efficient.
We have developed a series of environmentally friendly
specialty chemicals and materials for the semiconductor
industry – including
PFOS
-free antireflective and photoresist
coatings that contain no trace of dangerous chemicals.
Within the scope of our cosmetic products business, we are
working to sustainably procure and produce cosmetic ingredi-
ents as well as optimize the related production processes. In
dialogue with our customers from the cosmetics industry, we
are also developing cosmetic formulations that meet strict
sustainability criteria and address the current trend towards
more natural cosmetics. Several of our products have been
certified by Ecocert, an independent organization that repre-
sents high international standards for environmentally sus-
tainable products.
Within Life Science, the Design for Sustainability (DfS)
program aims to reduce environmental impacts, also through
customers’ own use. Beginning with the concept stage, prod-
uct teams identify potential environmental impacts in various
product life cycle stages as well as opportunities to make
improvements. A scorecard is used to assess product design in
six focus categories: Materials, Energy and Emissions, Waste,
Water, and Packaging, as well as Usability and Innovation. In
2014, we completed the integration of the DfS approach into
the product development process. We set ourselves the goal of
improving sustainability criteria in at least 10% of our Life
Science product ranges, reaching this goal at the end of 2014
for our products in the former Merck Millipore business.
In addition, Life Science works together with customers and
recycling companies to design sustainable recycling programs.
Furthermore, we use our technical and scientific expertise
in the field of water analysis to support clean water supply and
adequate wastewater handling. A prime example of this is our
participation since August 2015 in Semizentral, a Sino-German
infrastructure project developed by the Technical University of
Darmstadt and sponsored by the German Federal Ministry
of Education and Research (
BMBF
). In May 2015, Semizentral
won the GreenTec Award, Europe’s biggest environmental
and business prize, in the Urbanization category; in Novem-
ber 2015, the initiative ranked among the top three in the
Research category of the 2015 German Sustainability Award.
66
Combined Management Report
Fundamental Information about the Group
Corporate Responsibility
Strategic sphere of activity: Culture
Cultural promotion is a core element of our engagement in
society that reflects Merck’s centuries-old tradition of support-
ing art and culture. After all, culture nurtures characteristics
that are indispensable to our business activities as a high-tech
company: creativity, enthusiasm for new discoveries, and the
courage to transcend boundaries. Our cultural engagement
focuses on music, literature and education.
Deutsche Philharmonie Merck
The Deutsche Philharmonie Merck is our musical ambassador.
We consider classical music to be the universal language that
brings people together; as such, it is an important part of our
culture. The concerts of this professional ensemble are highly
popular, with around 26,000 people attending them per year.
They represent an integral part of the cultural life in the vicinity
of our global headquarters in Darmstadt. Special events for
children and adolescents as well as collaborations with schools,
such as the orchestra workshop held once a year since 2010,
aim to make classical music more accessible to young people.
In addition to this, the Deutsche Philharmonie Merck regu-
larly invites international ensembles to play in Darmstadt
while itself also touring the globe. In 2015, the orchestra gave
concerts in the United Kingdom and Israel. Furthermore, the
Deutsche Philharmonie Merck went on a tour of Latin America
to mark the 85th anniversary of our presence in Mexico and
the 40
th
anniversary of the opening of our production facility in
Brazil, performing in Mexico City, Rio de Janeiro and São Paulo.
Fostering literature
Literature can stimulate the imagination; it can alleviate fears
and give courage. Literature can also address scientific topics,
thus furthering a deeper understanding of science and research.
Through our engagement, we aim to help society better accept
science and scientific progress. In addition, as an international
company, we foster writers who further cultural exchange in
our globalized world.
We grant and promote five literary prizes worldwide. Since
1964, we have been sponsoring the renowned Johann Heinrich
Merck Award for Literary Critique and Essay, which is presented
by the German Academy for Language and Poetry at its annual
autumn conference. The award, which comes with a € 20,000
prize, went to publicist Gabriele Goettle in 2015.
For 13 years, we have been sponsoring the Premio Letter-
ario Merck in Italy. This award is worth € 10,000 and recognizes
authors who build bridges between literature and science,
thereby making them accessible to a wide audience. In 2015,
the awards went to French author Maylis de Kerangal and
American author and science writer David Quammen.
In India, we collaborate with the Goethe-Institut Calcutta
to present the Merck Tagore Award; worth 500,000 Indian
rupees (around € 6,800), this literary prize is granted every
two years to authors who have made a distinctive contribution
to the cultural exchange between Germany and India. In Japan,
we also present the Merck Kakehashi Literature Prize together
with the Goethe-Institut Tokyo. Worth a total of € 20,000, this
award is granted every two years to contemporary works by
German authors that are made accessible to a wider reader-
ship in Japan. As of 2016, we will also grant a literature prize
in Russia.
Education
We view education as a key component of culture – and vice
versa. Education can help us understand culture. But culture
can also build a bridge to education; it can stimulate curiosity
and nurture creativity. We therefore support educational
projects at many of our sites, by granting scholarships for
instance, or sponsoring specific classes. In order to promote
young scientists, every year since 1996 Merck has, for exam-
ple, been organizing the renowned annual ‟Jugend forscht”
competition for the German federal state of Hesse.
To mark our 125th anniversary in the United States, we
launched the ‟Smarter, Together in the Classroom” initiative,
committing US$ 125,000 to fund 132 scientific projects at
100 schools in low-income regions in Massachusetts. To date,
nearly 18,000 pupils have benefited from the program. By
2016, we want to have reached more than 36,000 children in
Massachusetts and Missouri with the campaign. In China, we
won the 2015 Corporate Social Responsibility Award presented
by the European Union Chamber of Commerce for our School
Water project. To date, five primary schools in Shanghai and
one primary school in Sichuan Province have received drinking
water purification facilities free of charge. In addition, our
employees educate the pupils on environmental protection on
a regular basis.
Responsibility for our products
The safety of our products is at the core of our corporate
responsibility. When used properly, they should pose no risk to
customers, patients, consumers, or the environment. Our goal
is to ensure a positive benefit / risk profile for our products.
Therefore, we regularly examine safety across the entire life
cycle of our products and continuously take steps to minimize
risks. We provide our patients, consumers and customers with
extensive information material so that they can use our prod-
ucts in a responsible, safe and proper manner.
Through our compliance policies for our Biopharma and
Consumer Health businesses, we set standards for responsible
marketing activities relating to our medicines. These aim to
ensure that patients and healthcare professionals have access
to the relevant information, and that patients receive effective
treatment.
Corporate Responsibility
Fundamental Information about the Group
Combined Management Report
67
Safety of our chemical products
There are numerous regulations intended to ensure that chem-
icals
pose no risk to humans or the environment. Compliance
with these regulatory requirements is an important part of our
work. With our Group-wide Product Safety Chemicals policy,
we have established global processes for defining, steering
and implementing product safety, as well as the corresponding
management structures. We incorporate all relevant national
and international chemical regulations into our policies and
regulations and adhere to them. This includes for instance the
EU chemicals regulation
REACH
(Registration, Evaluation,
Authorisation and Restriction of Chemicals) and
CLP
(Classifi-
cation, Labelling and Packaging of Substances and Mixtures,
EU
GHS
). Furthermore, we are committed to transparency. For
instance, in line with the Global Product Strategy, an interna-
tional initiative of the chemical industry, we provide our custom-
ers
with product safety summaries for hazardous materials.
We have successfully completed the second phase of
REACH
implementation. All substances we produce or import in quan-
tities ranging from 100 to 1,000 metric tons per year – 70 dif-
ferent substances in total – were successfully registered with
the European Chemicals Agency (
ECHA
) by June 1, 2013. We
are currently in phase three, in which we are working to reg-
ister all substances produced or imported in quantities between
one and 100 metric tons per year by mid-2018. We are fully
on schedule with our activities.
Safety of our healthcare products
Patient and consumer safety is our number-one priority in
everything we do. During the entire life cycle of our medicines
and consumer health products, we provide patients, consum-
ers and physicians with up-to-date risk-benefit evaluations. To
this end, our experts process safety-relevant information from
various sources such as clinical trials, adverse reaction reports
and scientific literature. Ultimate responsibility for the safety
of our biopharmaceuticals is borne by our Global Chief Medical
Officer, with support from our Medical Safety and Ethics Board
(
MSEB
). Our Global Drug Safety unit continuously monitors
and evaluates the safety and risk-benefit ratio of our medicines
worldwide (pharmacovigilance). For our Consumer Health
products, this function is performed by the Global Product
Safety unit. Overall responsibility for the safety of our over-
the-counter products falls under the Chief Medical Officer for
the Consumer Health business, supported by the Safety &
Labelling Committee (
SLC
).
For products in our Allergopharma business, we have
developed comprehensive clinical efficacy and safety profiles
that we continuously update. For the safety of our patients, we
have established a global pharmacovigilance system that
we continuously work to enhance.
Quality of our products
Our goal is to provide customers and patients with high-quality
brand-name products at all times. Through our quality vision –
‟Quality is embedded in everything we do!” – we remind our
employees of their responsibility – across all businesses, all
Group functions and all levels of the company.
Supplier management
We source raw materials, packaging materials, technical prod-
ucts, components, and services from suppliers in more than
120 countries. Our basic expectations for suppliers and service
providers include their compliance with fundamental environ-
mental and social standards, which are primarily derived from
the core labor standards of the
ILO
(International Labour
Organisation), from the UN Global Compact, and from the
Code of Conduct of the
BME
(German Federal Association for
Materials Management, Purchasing and Logistics).
Our Group Procurement Policy and Responsible Sourcing
Principles define our procurement practices and are integrated
into our general terms and conditions. They therefore consti-
tute the foundation of every sourcing transaction and proce-
dure.
Due to the growing significance of emerging markets as
sourcing markets for Merck, we reinforced our efforts to
ensure adherence to our supply chain standards.
We joined the Together for Sustainability (TfS) chemical
industry initiative at the end of 2014 and since then have been
able to jointly use the results of supplier assessments and
audits with other member companies and in compliance with
all competition law restrictions. Through TfS, we currently
have access to assessments of more than 300 of our most
important suppliers. Around 100 of these were generated for
the first time in 2015 thanks to our initiative. For 2016, in
addition to further assessments, we also plan to extend local
TfS supplier audits.
Responsibility for our employees
Employees are crucial to the success of a company. They
therefore play a central role in our business endeavors. In
accordance with the Merck Values, we live a culture of mutual
esteem and respect. We want to contribute to entrepreneurial
success by recruiting, developing and motivating the most
suitable employees. We therefore place a strategic focus on
the topics of talent development, compensation and perfor-
mance management. Furthermore, we want to strengthen the
diversity of our employees (Detailed information can be found
in the section entitled ‟People at Merck”).
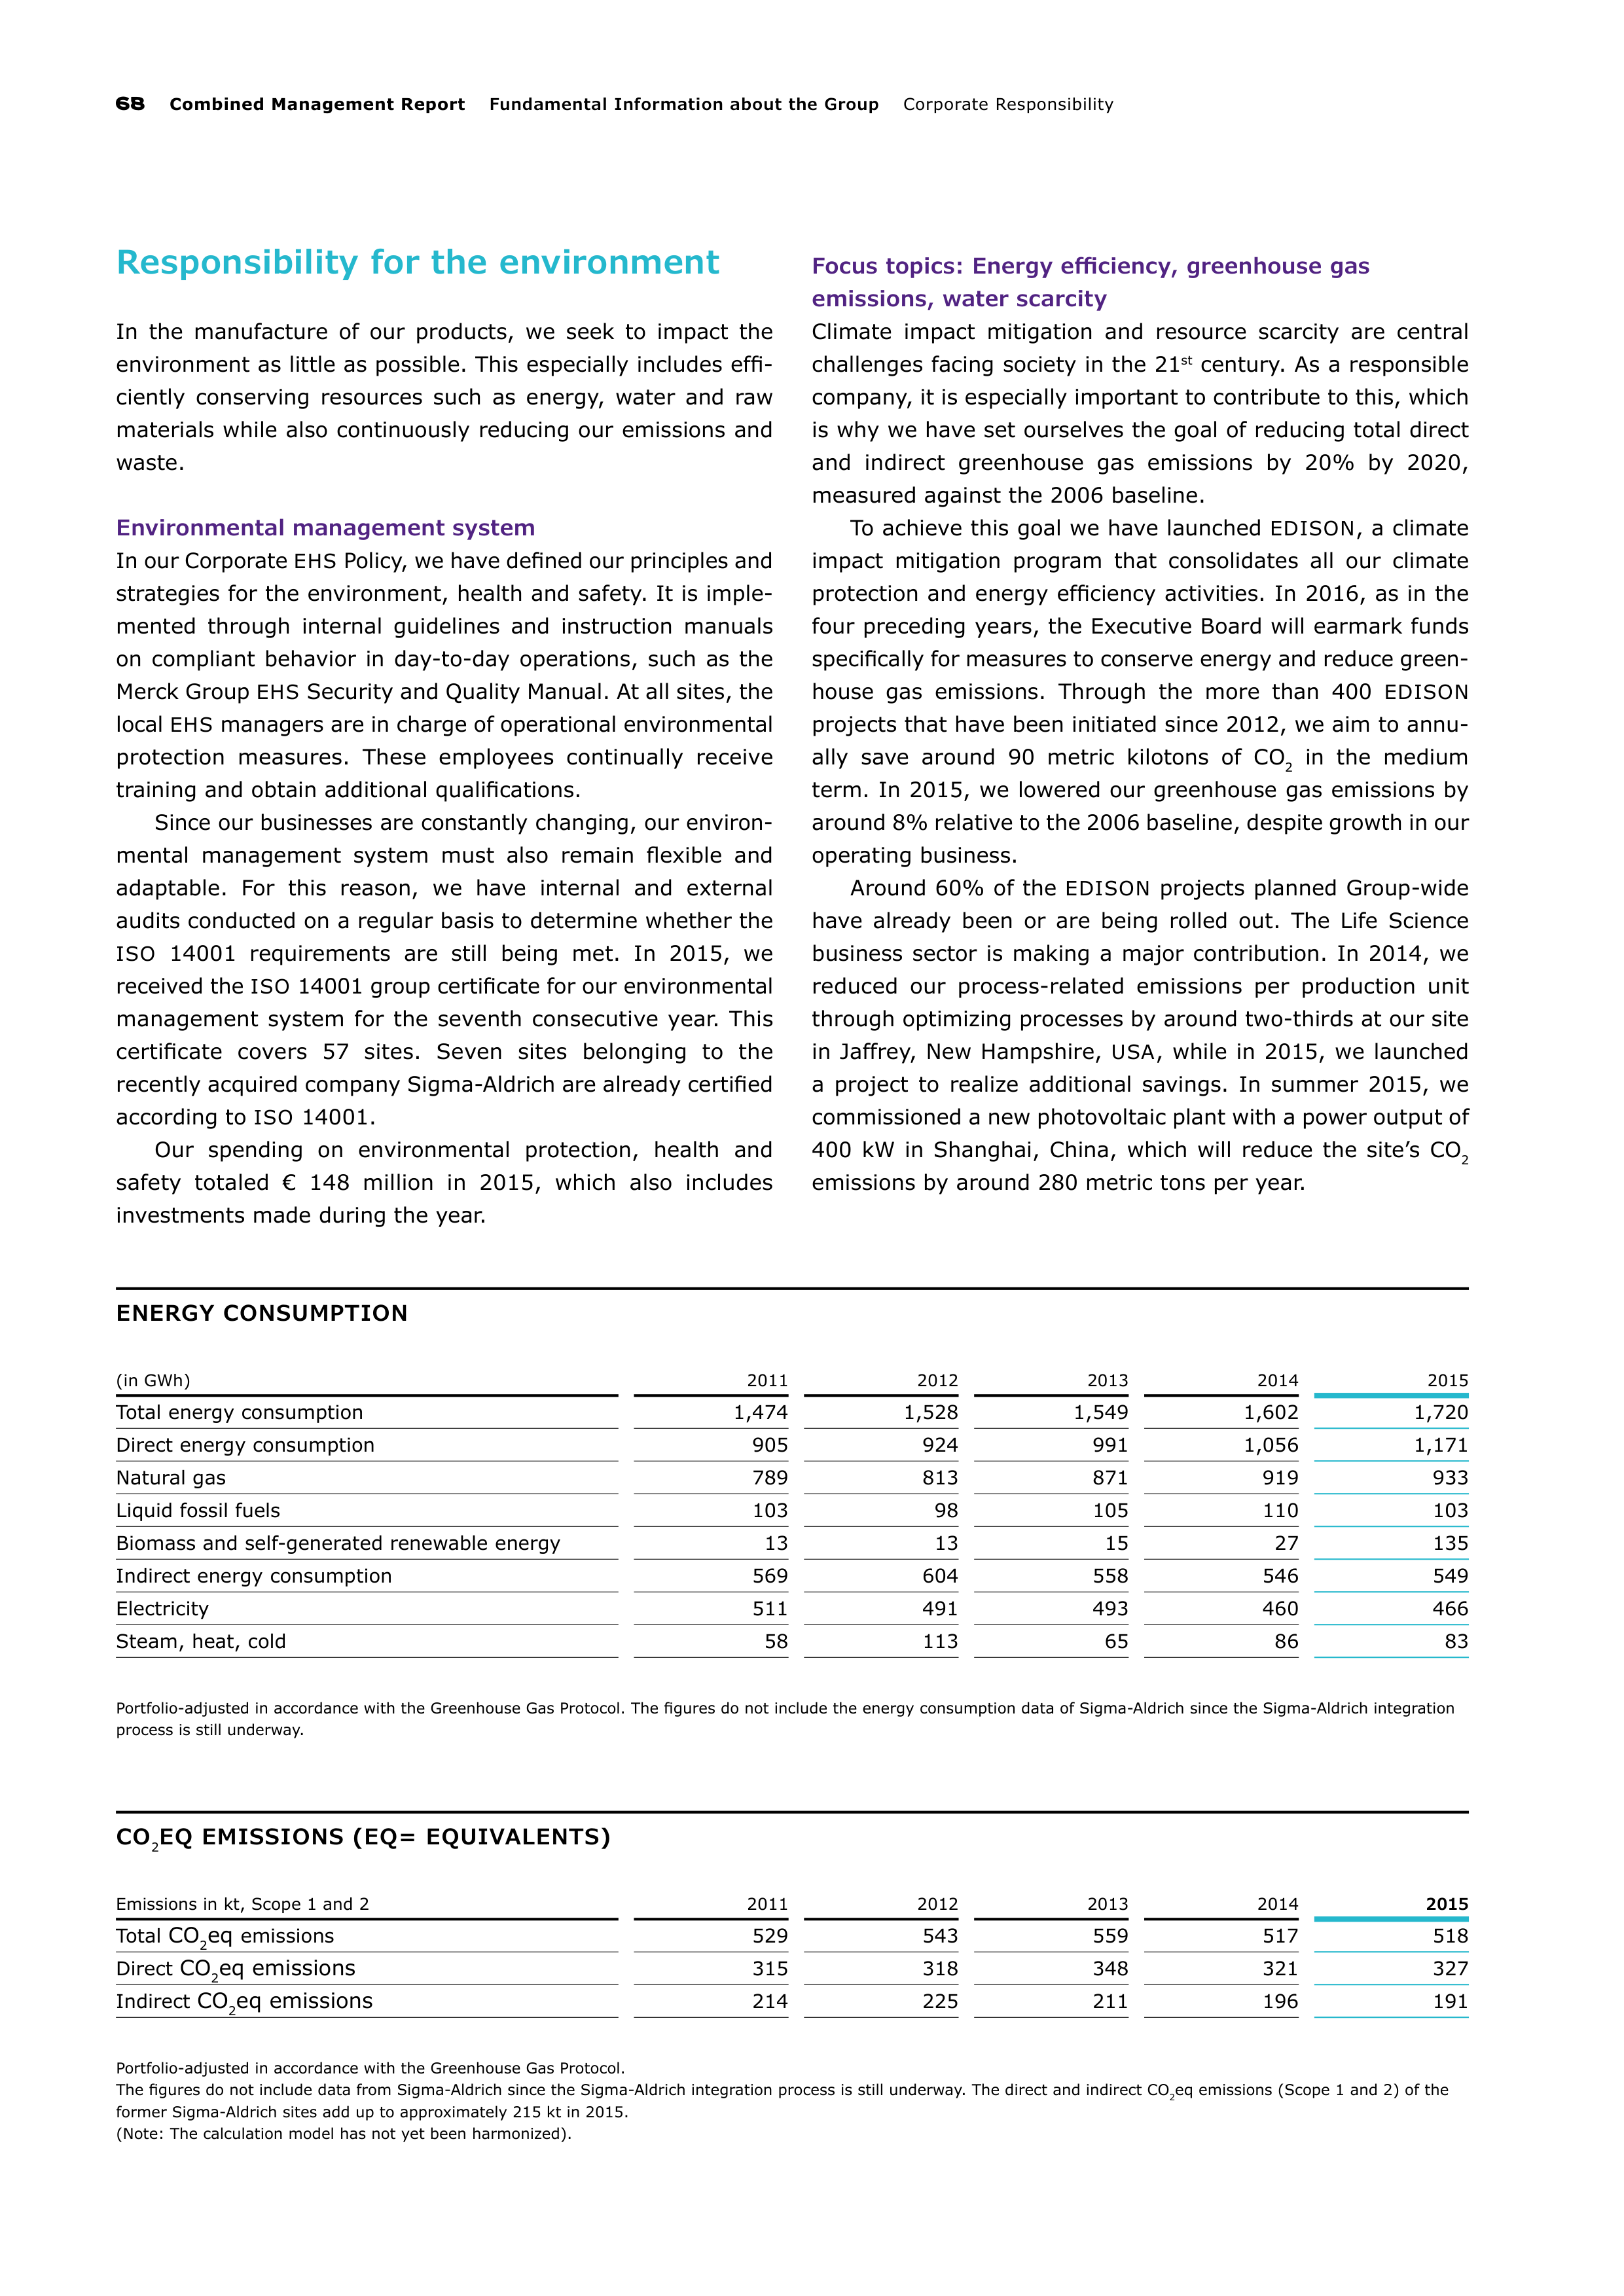
68
Combined Management Report
Fundamental Information about the Group
Corporate Responsibility
Responsibility for the environment
In the manufacture of our products, we seek to impact the
environment as little as possible. This especially includes effi-
ciently conserving resources such as energy, water and raw
materials while also continuously reducing our emissions and
waste.
Environmental management system
In our Corporate
EHS
Policy, we have defined our principles and
strategies for the environment, health and safety. It is imple-
mented through internal guidelines and instruction manuals
on compliant behavior in day-to-day operations, such as the
Merck Group
EHS
Security and Quality Manual. At all sites, the
local
EHS
managers are in charge of operational environmental
protection measures. These employees continually receive
training and obtain additional qualifications.
Since our businesses are constantly changing, our environ-
mental management system must also remain flexible and
adaptable. For this reason, we have internal and external
audits conducted on a regular basis to determine whether the
ISO
14001 requirements are still being met. In 2015, we
received the
ISO
14001 group certificate for our environmental
management system for the seventh consecutive year. This
certificate covers 57 sites. Seven sites belonging to the
recently acquired company Sigma-Aldrich are already certified
according to
ISO
14001.
Our spending on environmental protection, health and
safety totaled € 148 million in 2015, which also includes
investments made during the year.
Focus topics: Energy efficiency, greenhouse gas
emissions, water scarcity
Climate impact mitigation and resource scarcity are central
challenges facing society in the 21
st
century. As a responsible
company, it is especially important to contribute to this, which
is why we have set ourselves the goal of reducing total direct
and indirect greenhouse gas emissions by 20% by 2020,
measured against the 2006 baseline.
To achieve this goal we have launched
EDISON
, a climate
impact mitigation program that consolidates all our climate
protection and energy efficiency activities. In 2016, as in the
four preceding years, the Executive Board will earmark funds
specifically for measures to conserve energy and reduce green-
house
gas emissions. Through the more than 400
EDISON
projects that have been initiated since 2012, we aim to annu-
ally save around 90 metric kilotons of CO
2
in the medium
term. In 2015, we lowered our greenhouse gas emissions by
around 8% relative to the 2006 baseline, despite growth in our
operating business.
Around 60% of the
EDISON
projects planned Group-wide
have already been or are being rolled out. The Life Science
business sector is making a major contribution. In 2014, we
reduced our process-related emissions per production unit
through optimizing processes by around two-thirds at our site
in Jaffrey, New Hampshire,
USA
, while in 2015, we launched
a project to realize additional savings. In summer 2015, we
commissioned a new photovoltaic plant with a power output of
400 kW in Shanghai, China, which will reduce the site’s CO
2
emissions by around 280 metric tons per year.
ENERGY CONSUMPTION
(in GWh)
2011
2012
2013
2014
2015
Total energy consumption
1,474
1,528
1,549
1,602
1,720
Direct energy consumption
905
924
991
1,056
1,171
Natural gas
789
813
871
919
933
Liquid fossil fuels
103
98
105
110
103
Biomass and self-generated renewable energy
13
13
15
27
135
Indirect energy consumption
569
604
558
546
549
Electricity
511
491
493
460
466
Steam, heat, cold
58
113
65
86
83
Portfolio-adjusted in accordance with the Greenhouse Gas Protocol. The figures do not include the energy consumption data of Sigma-Aldrich since the Sigma-Aldrich integration
process is still underway.
CO
2
EQ EMISSIONS (EQ= EQUIVALENTS)
Emissions in kt, Scope 1 and 2
2011
2012
2013
2014
2015
Total
CO
2
eq
emissions
529
543
559
517
518
Direct
CO
2
eq emissions
315
318
348
321
327
Indirect
CO
2
eq emissions
214
225
211
196
191
Portfolio-adjusted in accordance with the Greenhouse Gas Protocol.
The figures do not include data from Sigma-Aldrich since the Sigma-Aldrich integration process is still underway. The direct and indirect CO
2
eq emissions (Scope 1 and 2) of the
former Sigma-Aldrich sites add up to approximately 215 kt in 2015.
(Note: The calculation model has not yet been harmonized).
Corporate Responsibility
Fundamental Information about the Group
Combined Management Report
69
Energy management plays a key role in our efforts for sustain-
able energy efficiency and climate impact mitigation. Our pro-
duction sites in Darmstadt and Gernsheim account for around
40% of our global energy consumption. In 2012, both of these
sites qualified for
ISO
50001 – Energy Management System
certificates, which were reaffirmed in 2015. Currently, nine of
our production sites have a certified energy management
system. The results of the Carbon Disclosure Project likewise
indicate that we are on the right path. In 2015, we achieved
98 out of 100 points in the Climate Disclosure Scoring, which
assesses the level of reporting details as well as transparency,
and were thus clearly in the upper range of all participating
companies in the Germany, Austria and Switzerland category.
In the Climate Performance Scoring, we ranked in performance
band C, putting us above average. The Carbon Disclosure
Project, an independent non-profit organization, assessed the
emissions reduction progress and climate impact mitigation
reporting of companies.
In addition to energy, in 2015 we also focused on the topic
of water. We systematically examined our sites to determine
which ones have a high annual water consumption and are also
located in regions where water is scarce and thus an especially
precious resource. Based on a detailed assessment, we plan to
implement sustainable water management systems stepwise
at these sites in the coming years.
Responsibility for society
We see ourselves as part of society, not only at our individual
locations, but also at a global level. Taking responsibility
towards society is an integral part of our entrepreneurial
approach. We believe that we can make an important contri-
bution to the community through our knowledge, our skills
and our products.
Our social responsibility activities are primarily focused
on those areas in which we have problem-solving expertise
stemming from our core businesses. We are thus engaged in
health and environmental projects and support education,
specifically in the natural sciences. We provide disaster relief
in emergency situations, especially in those regions in which
we operate. In April 2015, we signed a three-year agreement
with the German Red Cross (
DRK
). According to the terms of
the agreement, in the event of a catastrophe we will primarily
support the activities and projects of the German Red Cross by
donating money and supplies. In December 2015, we donated
€ 50,000 to the German Red Cross to support health projects
for refugees in Lebanon.
Our subsidiaries are engaged in a wide variety of local
projects. We have defined overarching criteria for selecting
projects, and the decisions concerning specific local projects
are made by our subsidiaries. In 2015, we spent a total of
around € 100 million on community engagement activities.
70
Combined Management Report
Fundamental Information about the Group
Research and Development
Research and Development
We discover and develop new products and solutions
worldwide to improve the quality of life for patients and
to meet customer needs. We consistently aim to further
optimize the relevance and efficiency of our research
and development activities, whether in-house or through
external collaborations.
Around 5,000 employees work for Merck researching innova-
tions to serve long-term health and technology trends in both
established and growth markets.
We spent around € 1.7 billion on research and development
in 2015. Here we focus on both in-house research and external
collaborations, which enable us to increase the productivity of
our research while simultaneously reducing financial outlay.
The organizational set-up of our research and development
activities reflects the structure of Merck with three business
sectors.
Healthcare
Biopharma
The R&D organization of our Biopharma business advanced
several key programs in 2015, both in the early and late stages
of development – many of which are molecules discovered at
Merck. With a clear focus on oncology, immuno-oncology and
immunology, there is significant potential in the near term to
benefit patients and the business.
Under the direction of Luciano Rossetti, MD, Head of Global
R&D, several new senior leaders joined the organization,
including Alise Reicin, MD, Senior Vice President, Head of
Global Clinical Development, and Laszlo Radvanyi, MD, Head
of the Translational Innovation Platform Immuno-Oncology.
In addition, Joern-Peter Halle, PhD was appointed Head of
External Innovation for Biopharma R&D.
In September, our Biopharma business announced the
expansion of its R&D facility in Darmstadt, Germany. We are
investing € 65 million in a new laboratory building that will
span more than 16,000 square meters and accommodate
approximately 200 current employees whose focus will be on
accelerating innovation in R&D. The new building will unite
different functions within R&D Discovery Technologies, includ-
ing Molecular Pharmacology, Medicinal Chemistry, Computa-
tional Chemistry, Molecular Interactions and Biophysics,
Protein Engineering and Antibody Technologies, and Protein
and Cell Sciences. The research building, when completed in
autumn 2017, will be located within the new ‟Pharma Square”
at our global headquarters in Darmstadt. We are thus uniting
a significant part of our R&D activities in a single area, creating
ideal conditions for the advancement of our biopharmaceutical
pipeline.
Oncology
Regarding Erbitux
®
, in April 2015 the safety division of the
Japanese Ministry of Health, Labour and Welfare issued an
official notification to update the product information of
Erbitux
®
for use in unresectable, advanced or recurrent
colorectal cancer (
CRC
) patients with wildtype
RAS
tumors, in
line with the current approval status in Europe.
At the European Society for Medical Oncology (
ESMO
)
World GI (Gastrointestinal) Congress in Barcelona, Spain in
July, results were presented from the Phase II
CAPRI
-
GOIM
tri
al. This was an independent study performed by an academic
group which enrolled 340
KRAS
exon 2 wild-type m
CRC
patients.
Patients received first-line treatment of
FOLFIRI
plus Erbitux
®
and responders were then randomized to receive second-line
treatment of
FOLFOX
plus Erbitux
®
or
FOLFOX
alone. A quad-
ruple wild-type population from this study (no mutation in
KRAS
,
NRAS
,
BRAF
or
PIK
3CA; assessed by next-generation
sequencing) showed significantly prolonged progression-free
survival, improved overall survival, and response rates with
second-line Erbitux
®
/
FOLFOX
after first-line Erbitux
®
/
FOLFIRI
.
This suggests that continuing anti-
EGFR
treatment while
switching the chemotherapy backbone in second line is feasible
following progression, although confirmatory data from other
studies will be needed.
Evofosfamide is an investigational hypoxia-activated
prodrug thought to be activated under severe tumor hypoxic
conditions, a feature of many cancers, which was investigated
in Phase
III
trials in two indications (soft tissue sarcoma
and pancreatic cancer). In May, we announced that the U.S.
Food and Drug Administration (
FDA
) had granted Fast Track
Research and Development
Fundamental Information about the Group
Combined Management Report
71
designation for the development of evofosfamide for the
treatment of previously untreated patients with metastatic or
locally advanced unresectable pancreatic cancer. In December
2015 the outcome of both indications being investigated in
Phase
III
was assessed. Unfortunately studies in neither indi-
cation achieved their primary endpoints. The decision was
subsequently made to discontinue the development program
for evofosfamide and we returned the rights to the program to
Threshold Inc.
Tepotinib, an investigational small molecule inhibitor of the
c-Met receptor tyrosine kinase, progressed into two Phase II
parts of the ongoing Phase I / II trial. In early 2015, it was
moved to the Phase II part of an ongoing Phase I / II trial in
Asian patients with Met-positive (Met+)
EGFR
mutant non-
small cell lung cancer (
NSCLC
). The study plans to randomize
approximately 136 patients with Met+ tumors who have failed
first-line gefitinib, to tepotinib 500 mg/d plus gefitinib or tepo-
tinib plus cisplatin / pemetrexed. The primary endpoint is pro-
gression-free survival (
PFS
). In the second quarter tepotinib
was moved to the Phase II part of an ongoing open-label
Phase I / II trial in Asian patients to evaluate its efficacy, safety,
and pharmacokinetics as first-line treatment versus sorafenib
in subjects with treatment-naive advanced hepatocellular carci-
noma. The study plans to randomize approximately 140 patients
with Met+ tumors to tepotinib 500 mg per day or sorafenib
400 mg twice a day. The primary endpoint is time to progression.
In the field of oncology diagnostics, we signed an agree-
ment with Illumina, Inc. in March 2015. We are working with
Illumina to develop sequencing-based assays that detect and
simultaneously measure multiple genetic variants in a single
tumor sample in clinical trial settings. This will enable us to
perform genome studies at a pace unheard of a few years ago,
and could lead to the development of several diagnostics, thus
strengthening our position as a global leader in precision medi
cine
in oncology. In addition, Merck and its partner Sysmex
Inostics GmbH announced that the first liquid biopsy
RAS
bio-
marker testing center opened in the Vall d’Hebron Institute of
Oncology in Spain. The liquid biopsy method, also known as
blood-based biomarker testing, is a simplified and rapid
approach for determining the
RAS
(
KRAS
and
NRAS
) mutation
status of tumors, as it requires a single blood draw, rather
than a tissue biopsy or surgical procedure. The liquid biopsy
RAS
biomarker test is expected to receive its European
Conformity approval (CE mark) in the coming months.
In November, Merck announced that it had entered into
a three-year collaboration to validate new therapeutic concepts
in the field of oncology with Selvita, headquartered in Krakow,
Poland. The aim of the collaboration is to deliver potential
first-
in-class small molecules as lead candidate drugs for multiple
oncology indications. This collaboration will steer a joint port-
folio of discovery projects in a risk / reward sharing model and
builds on the framework that the two companies have developed
during a two-year partnership in cancer metabolism, which
began in 2013. Under the terms of the new agreement, Merck
will have an exclusive license to the joint intellectual property
and Selvita will receive milestone payments and royalties upon
successful development and commercialization of products by
Merck.
Early in 2015 and following a review of all the data from our
clinical studies, we decided to discontinue the development
program for abituzumab (formerly known as DI17E6) in the
area of oncology. A Phase Ib trial in solid tumors, in collaboration
with Sanofi U.S., investigating pimasertib in combination with
Sanofi U.S.’s hDM2 antagonist (
SAR
405838) was concluded
and the development will not be further pursued. Furthermore,
after reviewing the competitive environment, we decided to
return our rights outside China to the
PARP
inhibitor BeiGene-
290
to BeiGene.
Biopharma provides annual grants for outstanding extra-
mural research in certain fields in oncology. This year’s Grants
for Oncology Innovation were awarded to three groups (two
from Spain and one from Italy) at a ceremony coinciding with
the 2015 European Cancer Congress (
ECC
) in Vienna, Austria.
Immuno-Oncology
At the 2015 American Society of Clinical Oncology (
ASCO
)
Annual Meeting, multiple presentations were made on the
preliminary safety and efficacy of avelumab (formerly known
as
MSB
0010718C), an investigational fully human anti-PD-L1
IgG1 monoclonal antibody that potentially uses the body’s
own immune system to fight cancer. It included an oral presen
tation on ovarian cancer and posters on gastric cancer, non-
small cell lung cancer (
NSCLC
) and several other studies in
a range of patient populations. The
NSCLC
data were from the
international open-label Phase I trial with multiple ascending
doses that is investigating the safety, tolerability, pharmacoki-
netics, as well as biological and clinical activity in patients with
metastatic or locally advanced solid tumors. In this analysis,
the safety and clinical activity in 184 patients with stage
III
b / IV
NSCLC
who had progressed after receiving at least
one platinum-containing doublet were assessed. Objective
response was observed in 25 (13.6%) patients, including one
complete response and 24 partial responses; 19 responses
were ongoing at the time of the analysis, including in two
patients who continued to respond off-treatment.
An oral presentation at
ASCO
2015 showed data from
the Phase I study for a cohort of patients with recurrent or
refractory ovarian cancer, unselected for PD-L1 expression,
with a median of four prior lines of treatment not including
adjuvant treatment. Of the 75 enrolled patients, eight showed
a partial response and 33 patients had stable disease, trans-
lating into a disease control rate (
DCR
) of 54.7%. The objec-
72
Combined Management Report
Fundamental Information about the Group
Research and Development
tive response rate was 10.7%. Further patients with ovarian
cancer have been enrolled in the ongoing Phase Ib study and
Phase
III
studies in platinum-resistant or platinum-refractory
and platinum-sensitive ovarian cancer are planned.
Clinical data of avelumab from a Phase I study in Japanese
patients with advanced gastric cancer were also presented
at
ASCO
. Of the 20 patients treated who had received multiple
prior therapies, partial responses were observed in three
patients. Enrollment of patients into the Japanese study has
continued and further studies in patients with advanced gastric
cancer are planned. Six abstracts were presented at the annual
European Cancer Congress (
ECC
) held in Vienna in September.
New data were presented in urothelial (e.g. bladder), meso-
thelial (e.g. pleura) and gastric / gastroesophageal cancers.
Additional
NSCLC
and ovarian cancer data from Phase Ib trials
were also presented.
Avelumab is currently being evaluated in a Phase II study
in metastatic Merkel cell carcinoma (
MCC
) known as
JAVELIN
Merkel 200.
MCC
is a rare and aggressive form of skin cancer
for which there is currently no specific therapy approved. The
Phase II study is assessing the safety and efficacy of avelumab
in patients with metastatic
MCC
who have progressed after at
least one prior chemotherapy regimen. The primary endpoint
is objective response rate, and secondary endpoints include
duration of response, progression-free survival, overall survival
and safety. A total of 88 patients were enrolled in this study by
the third quarter of 2015 at sites across Asia-Pacific, Australia,
Europe and North America. It is the largest clinical trial ever
performed in this patient population. In the United States, the
FDA
granted avelumab Orphan Drug Designation in
MCC
in
September, followed by Fast Track Designation and Break-
through Therapy Designation in the fourth quarter of 2015. In
December, the European Commission also granted avelumab
Orphan Drug Status in metastatic
MCC
in the European Union
following a positive opinion from the European Medicines
Agency (
EMA
)’s Committee for Orphan Medicinal Products.
Merck and Pfizer initiated two international Phase
III
studies of avelumab in the treatment of
NSCLC
.
The first
study,
JAVELIN
Lung 200, was initiated in April, and aims to
enroll approximately 650 patients. It will evaluate avelumab
in patients whose disease has progressed after receiving
a platinum-containing doublet chemotherapy compared with
docetaxel. The primary endpoint of this study is overall sur-
vival (OS) in patients with programmed death-ligand 1 posi-
tive (PD-L1+)
NSCLC
. The second study,
JAVELIN
Lung 100, is
designed to assess the safety and efficacy of avelumab, com-
pared with platinum-based doublet chemotherapy in patients
with late-stage
NSCLC
who have not previously received any
treatment for their systemic lung cancer. This Phase
III
study
is an open-label, multicenter, randomized clinical trial, in
which patients with recurrent or stage IV PD-L1+
NSCLC
will
receive either avelumab or the investigator’s choice of first-
line platinum-based chemotherapy, depending on the patient’s
histology (either squamous or non-squamous). The study
expects to enroll approximately 420 patients at more than 240
sites around the world. The primary endpoint of the study is
progression-free survival in patients with PD-L1+ tumors.
Secondary endpoints include progression-free survival in
patients with strongly PD-L1 positive (PD-L1++) tumors,
overall survival, objective response rate, quality of life, tolera-
bility and safety in patients treated with avelumab versus
investigator-choice chemotherapy.
In December, Merck and Pfizer announced the initiation
of
four additional Phase
III
studies investigating avelumab in
further indications.
JAVELIN
Gastric 100 is designed to evalu-
ate superiority of avelumab as a maintenance treatment for
advanced or metastatic gastric / gastro-esophageal junction
cancers versus continuation of first-line platinum-based chemo-
therapy. This randomized, open-label study aims to enroll
around 650 patients at more than 220 sites across the globe.
The study
JAVELIN
Gastric 300 will evaluate avelumab as
a third-line
treatment in advanced or metastatic gastric
/
gastro-
esophageal
junction cancers, in approximately 330 patients at
about 170
sites worldwide.
JAVELIN
Ovarian 200 will investigate
avelumab
as a treatment for platinum-resistant / refractory
ovarian cancer. Study investigators intend to enroll approxi-
mately 550 patients across more than 190 sites. In addition,
avelumab will be evaluated as a maintenance treatment, in
the first-line setting, for patients with urothelial cancer in the
JAVELIN
Bladder 100 trial. This study is expected to enroll
around 670 patients across more than 200 sites in 38 countries.
The primary endpoint for all these studies is overall survival.
We started a Phase I trial with a novel investigational agent
known as M7824. This is an open-label, multiple-ascending
dose study, aiming to enroll 106 patients. This potential first-
in-class bifunctional immunotherapy is designed to simulta-
neously block two immuno-inhibitory pathways that are
commonly used by cancer cells to evade the immune system,
thereby potentially controlling tumor growth by restoring and
enhancing anti-tumor immune responses.
To enhance our R&D technology portfolio in immuno-
oncology we entered into an exclusive strategic collaboration
and license agreement with Intrexon Corporation to develop
and commercialize Chimeric Antigen Receptor T-cell (
CAR
-T)
cancer therapies.
CAR
-T cells are genetically engineered T-cells
with synthetic receptors that recognize a specific antigen
expressed on tumor cells. When
CAR
-T cells bind to a target,
an immunological attack against the cancer cells is triggered.
Research and Development
Fundamental Information about the Group
Combined Management Report
73
Utilizing Intrexon’s cell engineering techniques and RheoSwitch
®
platform, the collaboration aims to develop leading-edge
products that empower the immune system to overcome the
current challenges of
CAR
-T therapy. The collaboration will
thus focus on developing a next-generation
CAR
-T platform to
generate drug candidates.
Neurology / Immunology
In the field of multiple sclerosis we announced in September
that we intend to submit data on our investigational treatment,
cladribine tablets, for the treatment of relapsing-remitting
multiple sclerosis (
RRMS
) to the European Medicines Agency
(
EMA
). The decision follows our evaluation of new data and
additional analyses which allow a better characterization of
the
compound’s benefit-risk profile. Submission plans for other
parts of the world are also being developed. We had wound
down our clinical development program for cladribine tablets
in 2011 after some regulatory authorities expressed concerns
over the insufficient characterization of the drug’s benefit-risk
profile. Nevertheless, several large clinical trials were allowed
to continue and additional safety information was also collected
in a long-term registry.
At the European Committee for Treatment and Research in
Multiple Sclerosis (
ECTRIMS
) meeting held in Barcelona in
early October, eight abstracts were presented on Rebif
®
, our
high-dose, high-frequency interferon beta-1a for relapsing
forms of multiple sclerosis (MS). Data presented included
post-hoc assessments of controlled studies in relapsing MS
of predictive scores for disease activity and disability pro-
gres
sion, as well as a cost-effectiveness analysis of Rebif
®
vs.
Avonex
®
(interferon beta-1a) based on the ‟no evidence of
disease activity” (
NEDA
) measure. These new data should
help healthcare professionals and patients to make informed
treatment decisions and to better understand the impact of
Rebif
®
in patients with relapsing forms of MS.
The annual Grants for Multiple Sclerosis Innovation (
GMSI
)
are awarded by Biopharma for outstanding extramural research
projects in certain fields of MS from all over the world. In 2015
the awards were made on the occasion of the 31
st
congress of
the European Committee for Treatment and Research in Multiple
Sclerosis (
ECTRIMS
) to four research groups from Finland,
Italy, the Netherlands, and the United Kingdom.
In 2015, the ‟Journal of Neurology, Neurosurgery and Psychi-
atry” (
JNNP
) published 15-year follow-up data for Rebif
®
from
the
PRISMS
(Prevention of Relapses and Disability by Inter-
feron beta-1a Subcutaneously in Multiple Sclerosis) trial. The
published data analyzed the relationship, over a 15-year period,
between cumulative exposure to Rebif
®
treatment and other
possible prognostic factors with long-term clinical outcomes in
relapsing-remitting multiple sclerosis. In these post hoc
exploratory analyses, higher-dose exposure to
IFN
β-1a and
longer time on treatment were associated with better long-
term outcomes over many years in patients with
RRMS
.
Patient enrollment was completed for the Phase IIa study
of M2736 (also known as
ATX
-MS-1467), an investigational
immune-tolerizing agent. This is an open-label, one-arm, proof-
of-principle trial to evaluate the safety of M2736 and its effect
on immune tolerance in subjects with relapsing multiple sclerosis
which involves frequent neuroimaging using magnetic reso-
nance imaging. The outcome of the study is expected in 2016.
In the field of immunology, our soluble fusion protein
atacicept met an important milestone in fully completing patient
enrollment into the
ADDRESS
II study, a Phase IIb clinical trial
in patients with systemic lupus erythematosus (
SLE
). The target
of 279
SLE
patients was met ahead of schedule, and key
results from the study are expected in 2016. Clinical Phase I
testing of our
BTK
inhibitor (M2951) in patients with
SLE
began in the fourth quarter of 2015.
Fertility
Ovidrel
®
(recombinant-hCG), used to trigger follicle maturation
and ovulation, was assessed in a Phase
III
trial in ovulation
induction (OI) in Japan to bridge to the existing ovulation
i
nduction and advanced reproductive treatment (
ART
) data from
global pivotal trials. We are currently preparing a regulatory
submission in Japan based on the positive outcome of this trial.
Biopharma announced its support of the Grant for Fertility
Innovation (
GFI
) fund with grants totaling up to € 1.2 million
for the years 2015 / 2016. The announcement was made during
the 31
st
annual meeting of the European Society of Human
Reproductive and Embryology (
ESHRE
) which took place in
Lisbon, Portugal. Launched in 2009, the
GFI
is dedicated to
transforming innovative translational fertility research projects
into concrete health solutions to improve the outcomes of
assisted reproductive technologies (
ART
). In the last six years,
approximately 750 applications to
GFI
were received from
over 50 countries around the world.
74
Combined Management Report
Fundamental Information about the Group
Research and Development
Endocrinology
In July 2015, the European Commission (EC) authorized an
update to the European marketing authorization for Kuvan
®
(sapropterin dihydrochloride), to allow its use in children with
phenylketonuria (
PKU
) below four years of age who have been
shown to be responsive to such treatment. This EC decision
was based on a review of data from a Phase
III
b clinical study
known as
SPARK
. On October 1, we announced that we had
reached an agreement with BioMarin Pharmaceutical Inc.,
San
Rafael, California,
USA
, to return the rights to Kuvan to
allow us to focus on core areas within our Healthcare business
sector. We also agreed to return our option to develop and
commercialize Peg-Pal, an investigational drug that is also
designed for the treatment of
PKU
.
The annual Grant for Growth Innovation (
GGI
) is awarded
by Biopharma for outstanding extramural research projects in
the field of growth disorders. In 2015 the
GGI
was awarded to
two research groups from the United Kingdom and the United
States at a ceremony which coincided with the 54
th
European
Society for Paediatric Endocrinology (
ESPE
) conference in
Barcelona, Spain.
General Medicine
We announced on November 3, 2015, that the United Kingdom
regulatory authority had approved an updated labeling for
Glucophage
®
XR (extended release metformin) for the treat-
ment of patients with type 2 diabetes. The label change removes
from the list of contraindications moderate renal impairment
stage 3a in the absence of other conditions that may increase
the risk of lactic acidosis and chronic heart failure. This means
that in patients with stable chronic heart failure Glucophage
®
XR may now also be used with a regular monitoring of cardiac
and renal function. Earlier in the year, the French regulatory
authority had already approved an update of the labeling for
Glucophage
®
IR (immediate release metformin), removing the
same contraindications. The label changes apply to all countries
in the European Union. The decisions were based on analyses
of Merck’s extensive efficacy and safety data collected over
many years as well as new clinical studies available for
Glucophage
®
.
Recently we received approval of metformin for the treat-
ment of prediabetes in Hungary. This approval follows that
in a number of other countries including Mexico, Poland, the
Philippines, and Turkey where Glucophage
®
can already be
prescribed for patients with prediabetes.
Neglected diseases
Merck promotes a Group-wide Access to Health initiative to
address key unmet medical needs of neglected tropical dis-
eases especially in children from developing countries. This
includes an R&D platform with a focus on tropical and priority
communicable diseases. In this connection, we obtained the
rights to the investigational antimalarial compound known as
DDD
107498, from Medicines for Malaria Venture (
MMV
). The
objective of the future clinical program is to demonstrate
whether this investigational compound exerts activity on a num-
ber of malaria parasite life-cycle stages, and remains active
in
the body long enough to offer potential as a single-dose
treatment against the most severe strains of malaria.
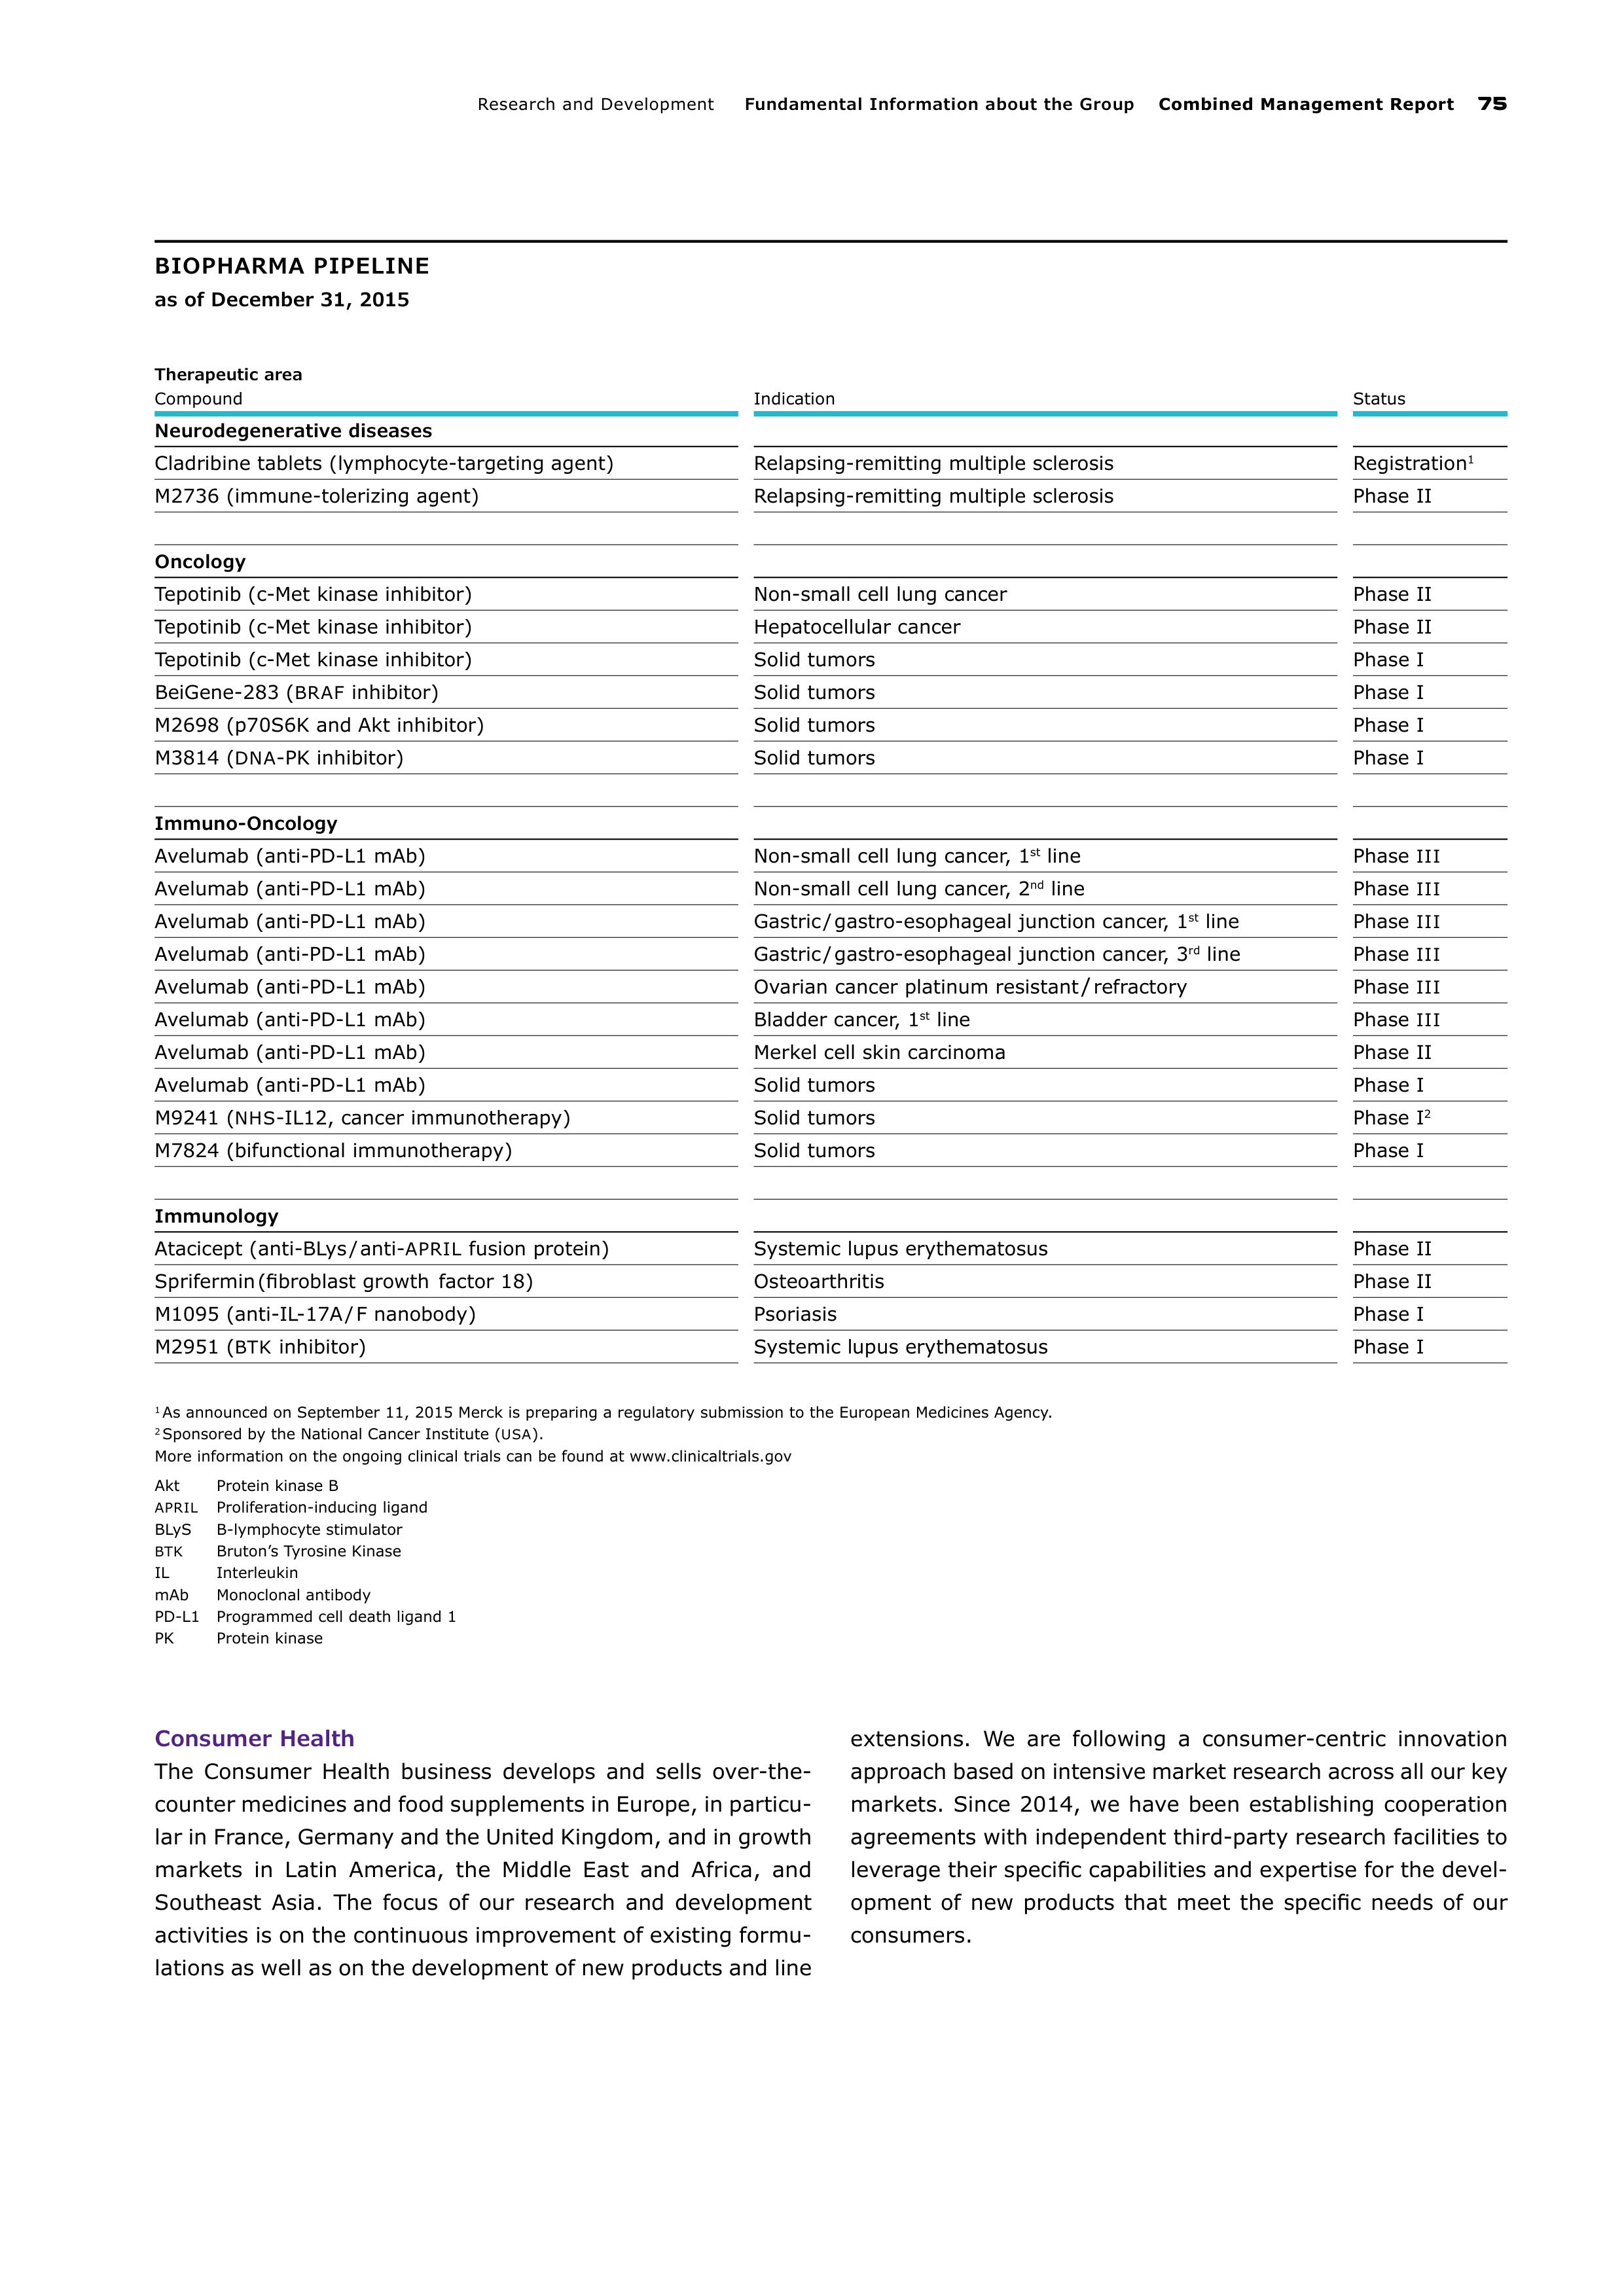
Research and Development
Fundamental Information about the Group
Combined Management Report
75
Consumer Health
The Consumer Health business develops and sells over-the-
counter medicines and food supplements in Europe, in particu-
lar in France, Germany and the United Kingdom, and in growth
markets in Latin America, the Middle East and Africa, and
Southeast Asia. The focus of our research and development
activities is on the continuous improvement of existing formu-
lations as well as on the development of new products and line
extensions. We are following a consumer-centric innovation
approach based on intensive market research across all our key
markets. Since 2014, we have been establishing cooperation
agreements with independent third-party research facilities to
leverage their specific capabilities and expertise for the devel-
opment of new products that meet the specific needs of our
consumers.
BIOPHARMA PIPELINE
as of December 31, 2015
Therapeutic area
Compound
Indication
Status
Neurodegenerative diseases
Cladribine tablets (lymphocyte-targeting agent)
Relapsing-remitting multiple sclerosis
Registration
1
M2736 (immune-tolerizing agent)
Relapsing-remitting multiple sclerosis
Phase II
Oncology
Tepotinib (c-Met kinase inhibitor)
Non-small cell lung cancer
Phase II
Tepotinib (c-Met kinase inhibitor)
Hepatocellular cancer
Phase II
Tepotinib (c-Met kinase inhibitor)
Solid tumors
Phase I
BeiGene-283 (
BRAF
inhibitor)
Solid tumors
Phase I
M2698 (p70S6K and Akt inhibitor)
Solid tumors
Phase I
M3814 (
DNA
-PK inhibitor)
Solid tumors
Phase I
Immuno-Oncology
Avelumab (anti-PD-L1 mAb)
Non-small cell lung cancer, 1
st
line
Phase
III
Avelumab (anti-PD-L1 mAb)
Non-small cell lung cancer, 2
nd
line
Phase
III
Avelumab (anti-PD-L1 mAb)
Gastric / gastro-esophageal junction cancer, 1
st
line
Phase
III
Avelumab (anti-PD-L1 mAb)
Gastric / gastro-esophageal junction cancer, 3
rd
line
Phase
III
Avelumab (anti-PD-L1 mAb)
Ovarian cancer platinum resistant
/
refractory
Phase
III
Avelumab (anti-PD-L1 mAb)
Bladder cancer, 1
st
line
Phase
III
Avelumab (anti-PD-L1 mAb)
Merkel cell skin carcinoma
Phase II
Avelumab (anti-PD-L1 mAb)
Solid tumors
Phase I
M9241 (
NHS
-IL12, cancer immunotherapy)
Solid tumors
Phase I
2
M7824 (bifunctional immunotherapy)
Solid tumors
Phase I
Immunology
Atacicept (anti-BLys / anti-
APRIL
fusion protein)
Systemic lupus erythematosus
Phase II
Sprifermin (fibroblast growth factor 18)
Osteoarthritis
Phase II
M1095 (anti-IL-17A / F nanobody)
Psoriasis
Phase I
M2951 (
BTK
inhibitor)
Systemic lupus erythematosus
Phase I
1
As announced on September 11, 2015 Merck is preparing a regulatory submission to the European Medicines Agency.
2
Sponsored by the National Cancer Institute (
USA
).
More information on the ongoing clinical trials can be found at www.clinicaltrials.gov
Akt
Protein kinase B
APRIL
Proliferation-inducing ligand
BLyS
B-lymphocyte stimulator
BTK
Bruton’s Tyrosine Kinase
IL
Interleukin
mAb
Monoclonal antibody
PD-L1
Programmed cell death ligand 1
PK
Protein kinase
76
Combined Management Report
Fundamental Information about the Group
Research and Development
Biosimilars
In 2015, Merck proceeded successfully with the clinical devel-
opment of biosimilars. One Phase I study was finalized and
the biosimilar was moved to Phase
III
in the first quarter of
2016. Further biologics were added to the pipeline to secure
an attractive biosimilars portfolio and a sustainable biosimilars
business for Merck.
Allergopharma
Allergopharma, our allergy business, is one of the leading man-
ufacturers of diagnostics and prescription drugs for allergen
immunotherapy. With its own research department and in
cooperation with research institutes and other partners, we are
helping develop a better understanding of the immunological
mechanism that underlies the development of allergies and
are actively working on the next generation of drugs for allergen
immunotherapy.
Life Science
Innovation is core to value delivery to our customers. Our
Life
Science business sector has more than 650 employees
working in various R&D functions around the world. These
employ
ees cooperate closely with our customers to address
their needs and pain points. Our ultimate objective is to solve
the toughest problems in life science by translating ideas into
product innovations. Once again, we invested significantly in
R&D in 2015.
The year 2015 was marked by successful innovations. Our
innovation activities are diverse and can be assigned to four
categories. We want to:
•
Improve and expand our portfolio
•
Invest in new and disruptive technologies for the long term
•
Partner with our customers and
•
Drive dialogues on unmet needs in the scientific community
and solve the relevant problems
Portfolio expansion
We made important product launches to expand our portfolio
across all segments in 2015. In Biomonitoring, we made three
additions to our
MAS
-100
®
product family of air samplers,
expanding our Biomonitoring portfolio to food and beverage
customers. The family of products, developed for use in isola-
tors, allows sampling at critical control points. The compact
and easy-to-handle design makes these products well-suited
for use in controlled environments.
In
RNA
detection, we introduced a number of important new
products. For example, our Magna Ch
IRP
™
RNA
Interactome
Kits allow researchers to more easily identify, recover and
analyze regions of chromatin. The kits provide reliable detec-
tion and discovery of
RNA
-associated genomic
DNA
sequences,
RNA
sequences and proteins.
In Process Solutions, we expanded our Provantage
®
Bio
development Services to include a Clone Generation Service.
With this addition, we provide a full range of services to optimize
yield, productivity, consistency and efficiency of clinical-trial
drug products. Our services help accelerate time-to-clinic by
delivering high-quality, high-expressing cell lines. Our flexible
production platform offers a choice of cell lines and the fully
documented clones meet traceability requirements for clinical
production,
IND
submission and commercial manufacturing.
With the launch of our new Mobius
®
2000 liter single-use
bioreactor, we influence key standards such as microbiological
film selection and single-use technologies, in both upstream
and downstream production and we can provide a scalable
solution to customers looking to perform single-use in upstream
processing. This new bioreactor enables us to help customers
in the biosimilars market implement manufacturing strategies
in a short time frame to increase speed to market.
New and disruptive technologies
Our innovation efforts also focus on new technologies that
have long-term impact. We received a United States patent for
developing a selective membrane layering method that signifi
cantly improves the consistency of virus filtration performance.
The method is used to manufacture our Viresolve
®
Pro device,
a virus filtration technology that offers highly productive
parvovirus clearance for monoclonal antibodies and therapeutic
proteins. As a result of selective layering, the Viresolve
®
Pro
device provides an industry-leading performance consistency
superior to other virus filtration devices on the market.
To solidify our leadership in tangential flow filtration (
TFF
),
we introduced single-pass
TFF
with Pellicon
®
cassettes, an
enhanced application of our existing technology that allows
concentration of process streams without the recirculation
required in traditional
TFF
. This alternative application elimi-
nates typical process constraints caused by higher volumes or
concentration factors, resulting in increased capacity. It also
enables continuous processing by coupling the
TFF
step in line
with other process steps.
To further accelerate growth in cell analysis, we introduced
the new Cellvento™
CHO
platform of cell culture media and
companion feed formulations for batch, fed-batch and perfusion
applications. The chemically defined, non-animal-origin media
deliver superior cell growth and productivity for various
CHO
cell types used in biopharmaceutical development and manu-
facturing. The range of products gives customers the flexibility
to choose the most suitable product to achieve the best possible
performance results for their specific cell line.
We also introduced a new technology that compacts dry
powder cell culture media into granules and therefore improves
solubility, facilitating the handling of cell culture media used in
biopharmaceutical production. The compacted media are more
convenient to use, allowing biopharmaceutical manufacturers
to further optimize their upstream processes.
Research and Development
Fundamental Information about the Group
Combined Management Report
77
Partnerships
In February, we entered into a partnership agreement to
provide upstream process development services for Precision
Biologics, Inc., a Texas-based clinical-stage biotechnology
company, to advance a preclinical monoclonal antibody. The
antibody,
NEO
-201, binds to a tumor-specific antigen found in
several forms of cancer, offering therapeutic potential across
multiple cancer types, including colorectal, lung, ovarian and
pancreatic – an especially deadly cancer with limited treat-
ment options.
In May, we entered into an agreement with Singulex, Inc.,
a developer and leading provider of Single Molecule Counting
technology for clinical diagnostics and scientific discovery,
to manage its life science research business. We now have
exclusive rights to further develop and commercialize the
technology for research applications worldwide.
Driving scientific dialogues
In the field of filtration, we established a new Scientific Advisory
Board, which held its inaugural meeting in 2015. The goal is to
solve the most challenging problems in filtration in collabora-
tion with our customers by bringing together application and
technology experts. Board members include some of the
most knowledgeable external filtration experts and renowned
scientists as well as colleagues of our Life Science business. As
a leader in filtration, we are committed to continuously explor-
ing new and disruptive innovations in the field. The Advisory
Board is focused on identifying and addressing the most critical
unmet needs in the area of filtration.
In the third quarter, the scientific journal ‟Methods of
Molecular Biology” published two chapters on the use of our
Immobilon
PVDF
(polyvinylidene fluoride) membranes for
protein analysis, authored by our experts. We were featured
due to our significant presence in and contribution to Western
Blotting, which is the most commonly used analytical tech-
nique in cell and molecular biology.
We also published an original white paper recognizing
the emerging biotech community’s impact on the future of
healthcare. This paper followed the Emerging Biotech Summit
held in June in Philadelphia, Pennsylvania, hosted by Merck’s
Life Science and ealthcare business sectors and attended by
40 biotech leaders from across the United States. There we
established an open dialogue within the biotech community
and gained insight from executives on the topics of advancing
products faster through clinical development and bringing
lifesaving drugs to market.
We received several major industry awards for our product
innovations in 2015:
We received a Stevie Award for our
AFS
®
Lab Water systems at
the 2015 American Business Awards ceremony in San Francisco,
California in September. The new Large
AFS
-
E
system was
a finalist in the ‟Best Product – Health & Pharmaceuticals”
category. Today’s diagnostic labs need multiple compact water
systems to feed a single analyzer or a few smaller ones. Our
AFS
-
E
systems meet this need.
‟R&D Magazine” presented us with two R&D 100 Awards
in November. These awards are viewed as the ‟Oscars of
Innovation” and recognize technologies in a wide variety of
industries, including telecommunications, high-energy physics,
software, manufacturing, and biotechnology. We won in the
‟Process / Prototyping” category for our
AFS
®
water systems
and in the ‟Analytical / Test” category for our Simplicon™
RNA
Reprogramming Technology. This technology makes it possible
to generate virus-free, human-induced stem cells safely and
efficiently using a single transfection step, giving researchers
an effective reprogramming method when studying diseases.
Performance Materials
We are the undisputed market and technology leader in liquid
crystals (LC), which are primarily used in televisions and
mobile communication applications. We are also one of the
leading suppliers of decorative and functional effect pigments.
Our high-tech materials and solutions are used by customers
in the consumer electronics, lighting, coatings, printing techno
logy, plastics applications, and cosmetics industries.
Display Materials
The latest generation of smartphones and tablets with their
brilliant touchscreens would be unimaginable without the
most recent advances in liquid crystal display technology. For
these mobile devices we developed
UB
-
FFS
technology (ultra-
brightness fringe field switching) with a new switching mode.
This has the potential to increase display light transmittance
by up to 15%. The new technology offers many advantages:
Firstly, it consumes less energy and increases the battery life
of mobile devices. Secondly, it improves mobile display quality
and supports the trend towards higher resolutions. The mar-
ket launch of
UB
-
FFS
is progressing very successfully; the new
switching mode is already used in many smartphones and
tablets. In April 2015, Merck received the German Innovation
Award for this breakthrough technology. And in June, we
received the 2015 Display Component of the Year Award in
Gold for
UB
-
FFS
at the Society for Information Display confer-
ence in San José, California.
78
Combined Management Report
Fundamental Information about the Group
Research and Development
With the Merck LC 2021 strategic initiative, we are combining
our future activities in liquid crystals. Firstly, our focus is on
the further development of conventional display technology.
We want to contribute to the realization of more robust, more
flexible displays and the utilization of holographic 3D technol-
ogy. Secondly, we are focusing on applications beyond displays.
These include new light management systems and smart
antennas for better satellite communication. Liquid crystal
windows (
LCW
s) are another field of our work. They can regu-
late both the light and heat transmittance of windows in
build
ing façades. We are further investing in the development
of materials for such applications. Pilot production of the first
smart windows is in full swing. The first
LCW
panels were
already used in the construction of our new Innovation Center
in Darmstadt. Collaborations with partners in the glass and
façade technology sector are planned for broad-based market-
ing of the windows.
The future and potential of display technology have been the
topic of our annual Displaying Futures symposium for several
years now. This year‘s symposium took place in San Francisco,
where renowned futurologists convened with more than 100 of
our customers and business associates.
In China, Japan, Korea, and Taiwan – four core markets for
Performance Materials
– around 700 customers attended
workshops we held in autumn 2015 under the motto ‟Creating
the perfect pixel – through partnership”. Most of the partici-
pants were researchers and engineers from various display
panel manufacturers. The aim of these very successful events
is to present our core competencies, discuss visions with
our customers, demonstrate our technology leadership, and
strengthen customer proximity.
High-quality pigments and functional materials
The Meoxal
®
brand is the latest development in effect pigments.
These pigments captivate with their brilliant color saturation
and exceptional performance. This is achieved by an innova-
tive layer technology and the use of aluminum flakes as the
substrate. The products are suitable for a multitude of high-
performance applications, especially for automotive and plastic
coatings.
With Xirallic
®
NXT
, Merck is introducing a new patented
product generation of the well-known high-tech effect pigments.
These offer customers an exceptional ‟living-sparkle effect”,
high styling potential and consistent quality. The first product
of the new generation – Xirallic
®
NXT
Panthera Silver – is a
dark-gray, metallic effect pigment.
Besides high-quality effect pigments, we also produce
functional materials for technical applications as well as fillers
and active ingredients for cosmetics. The new cosmetic active
ingredient RonaCare
®
SereneShield was presented in time for
the important in-cosmetics exhibition in Barcelona in 2015.
The active ingredient is intended to help the skin at any age to
reduce susceptibility to acne.
In technical applications, we developed additives for the laser
marking of plastics and conductive coatings. These additives
are also used in heat-reflective glazing for greenhouses. In
high-voltage technology, we are also working on functional
materials, with which we want to tap into new markets in the
area of energy management. Within the scope of the research
project iShield, which in view of its future potential is also
government-funded, we have been collaborating since autumn
2015 with academic and industrial partners to develop novel
materials to shield generators and engines.
Integrated Circuit Materials
In the Integrated Circuit Materials business unit, which supplies
products for integrated circuit manufacture, we have devel-
oped a range of products for Extreme UV Lithography (
EUV
)
applications that have already been qualified by several cus-
tomers in the semiconductor industry for their processes. The
shrink technology makes it possible to reduce lithographically
generated structures after patterning, thus circumventing
resolution limitations of existing exposure equipment in a cost-
effective manner. New products are on the verge of production
implementation. We are a leader in Directed Self Assembly
(
DSA
), a revolutionary technology that is crucial to all advanced
semiconductor manufacturers. In
DSA
, the information for the
smallest structures is already contained in the chemical
makeup of the coating material. We are collaborating with our
customers to introduce
DSA
as a standard integrated circuit
(IC) manufacturing method in the coming years. Additionally, we
are intensively engaged in developing thick perhydropolysila-
zane products for 3D chip technology as well as novel insulator
materials.
The further development of flat panel display technology
towards larger formats and higher operating frequencies
requires the use of transistors with feature sizes that are at
the limit of the resolution capability of the exposure tools.
We have successfully transferred from the IC sector so-called
tandem resin technology with a specific molecular weight
distribution, thus achieving a photoresist resolution near the
theoretical resolution limit. In silicon technology, new siloxane
materials are in an advanced stage of qualification as planari-
zation materials for high-resolution displays and as a thin film
barrier for organic light-emitting diode (
OLED
) lighting.
Ormet, a company that we acquired in September, has
developed conductive pastes based on a unique environmental
friendly technology which can solve technical challenges in
semiconductor packaging. This is particularly interesting due
to the growing demand for highly integrated devices such as
mobile phones or wearables.
Research and Development
Fundamental Information about the Group
Combined Management Report
79
Advanced Technologies
An outstanding example of our activities in the Advanced
Technologies business unit are
OLED
s, which are used in new
lighting techniques and display technologies.
OLED
s provide
brilliant colors and sharp images from any viewing angle; they
have a long lifespan and are highly energy-efficient. In addi-
tion,
OLED
s enable round or flexible displays, making them
perfect for use in the latest technical applications. One such
example is the smart watch, a wristwatch that provides Internet
access along with additional computer functionality.
The name of our product line for these types of applica-
tions is livilux
®
. We have developed a strong portfolio of world-
wide patents, based on more than ten years of experience.
Development partnerships with customers are a way of testing
new technologies and making them market-ready. For instance,
together with printer manufacturer Seiko Epson, we have
established a technology that can be used to print
OLED
dis-
plays. While we contributed our expertise in
OLED
material
and ink development to the collaboration, Seiko Epson pro-
vided its know-how in print heads featuring Micro Piezo inkjet
technology as well as process expertise. The jointly developed
technology offers the advantage of lower costs and higher
material efficiency. In contrast to evaporated
OLED
displays,
the materials are applied at room temperature under normal
pressure in the case of printed
OLED
displays. In addition, this
technique only deposits material in the areas where diodes are
actually located, thereby helping to conserve resources.
With the acquisition of Qlight Nanotech, we want to further
expand our leading position and deepen our expertise in the
research and development of display materials. Operating as
a research hub in Jerusalem, Qlight develops materials and
applications based on semiconducting nanocrystals. It has
a leading technology team with significant experience and
innovations in nanoscience and nanotechnology used in light-
ing applications and for displays and screens, among other
things.
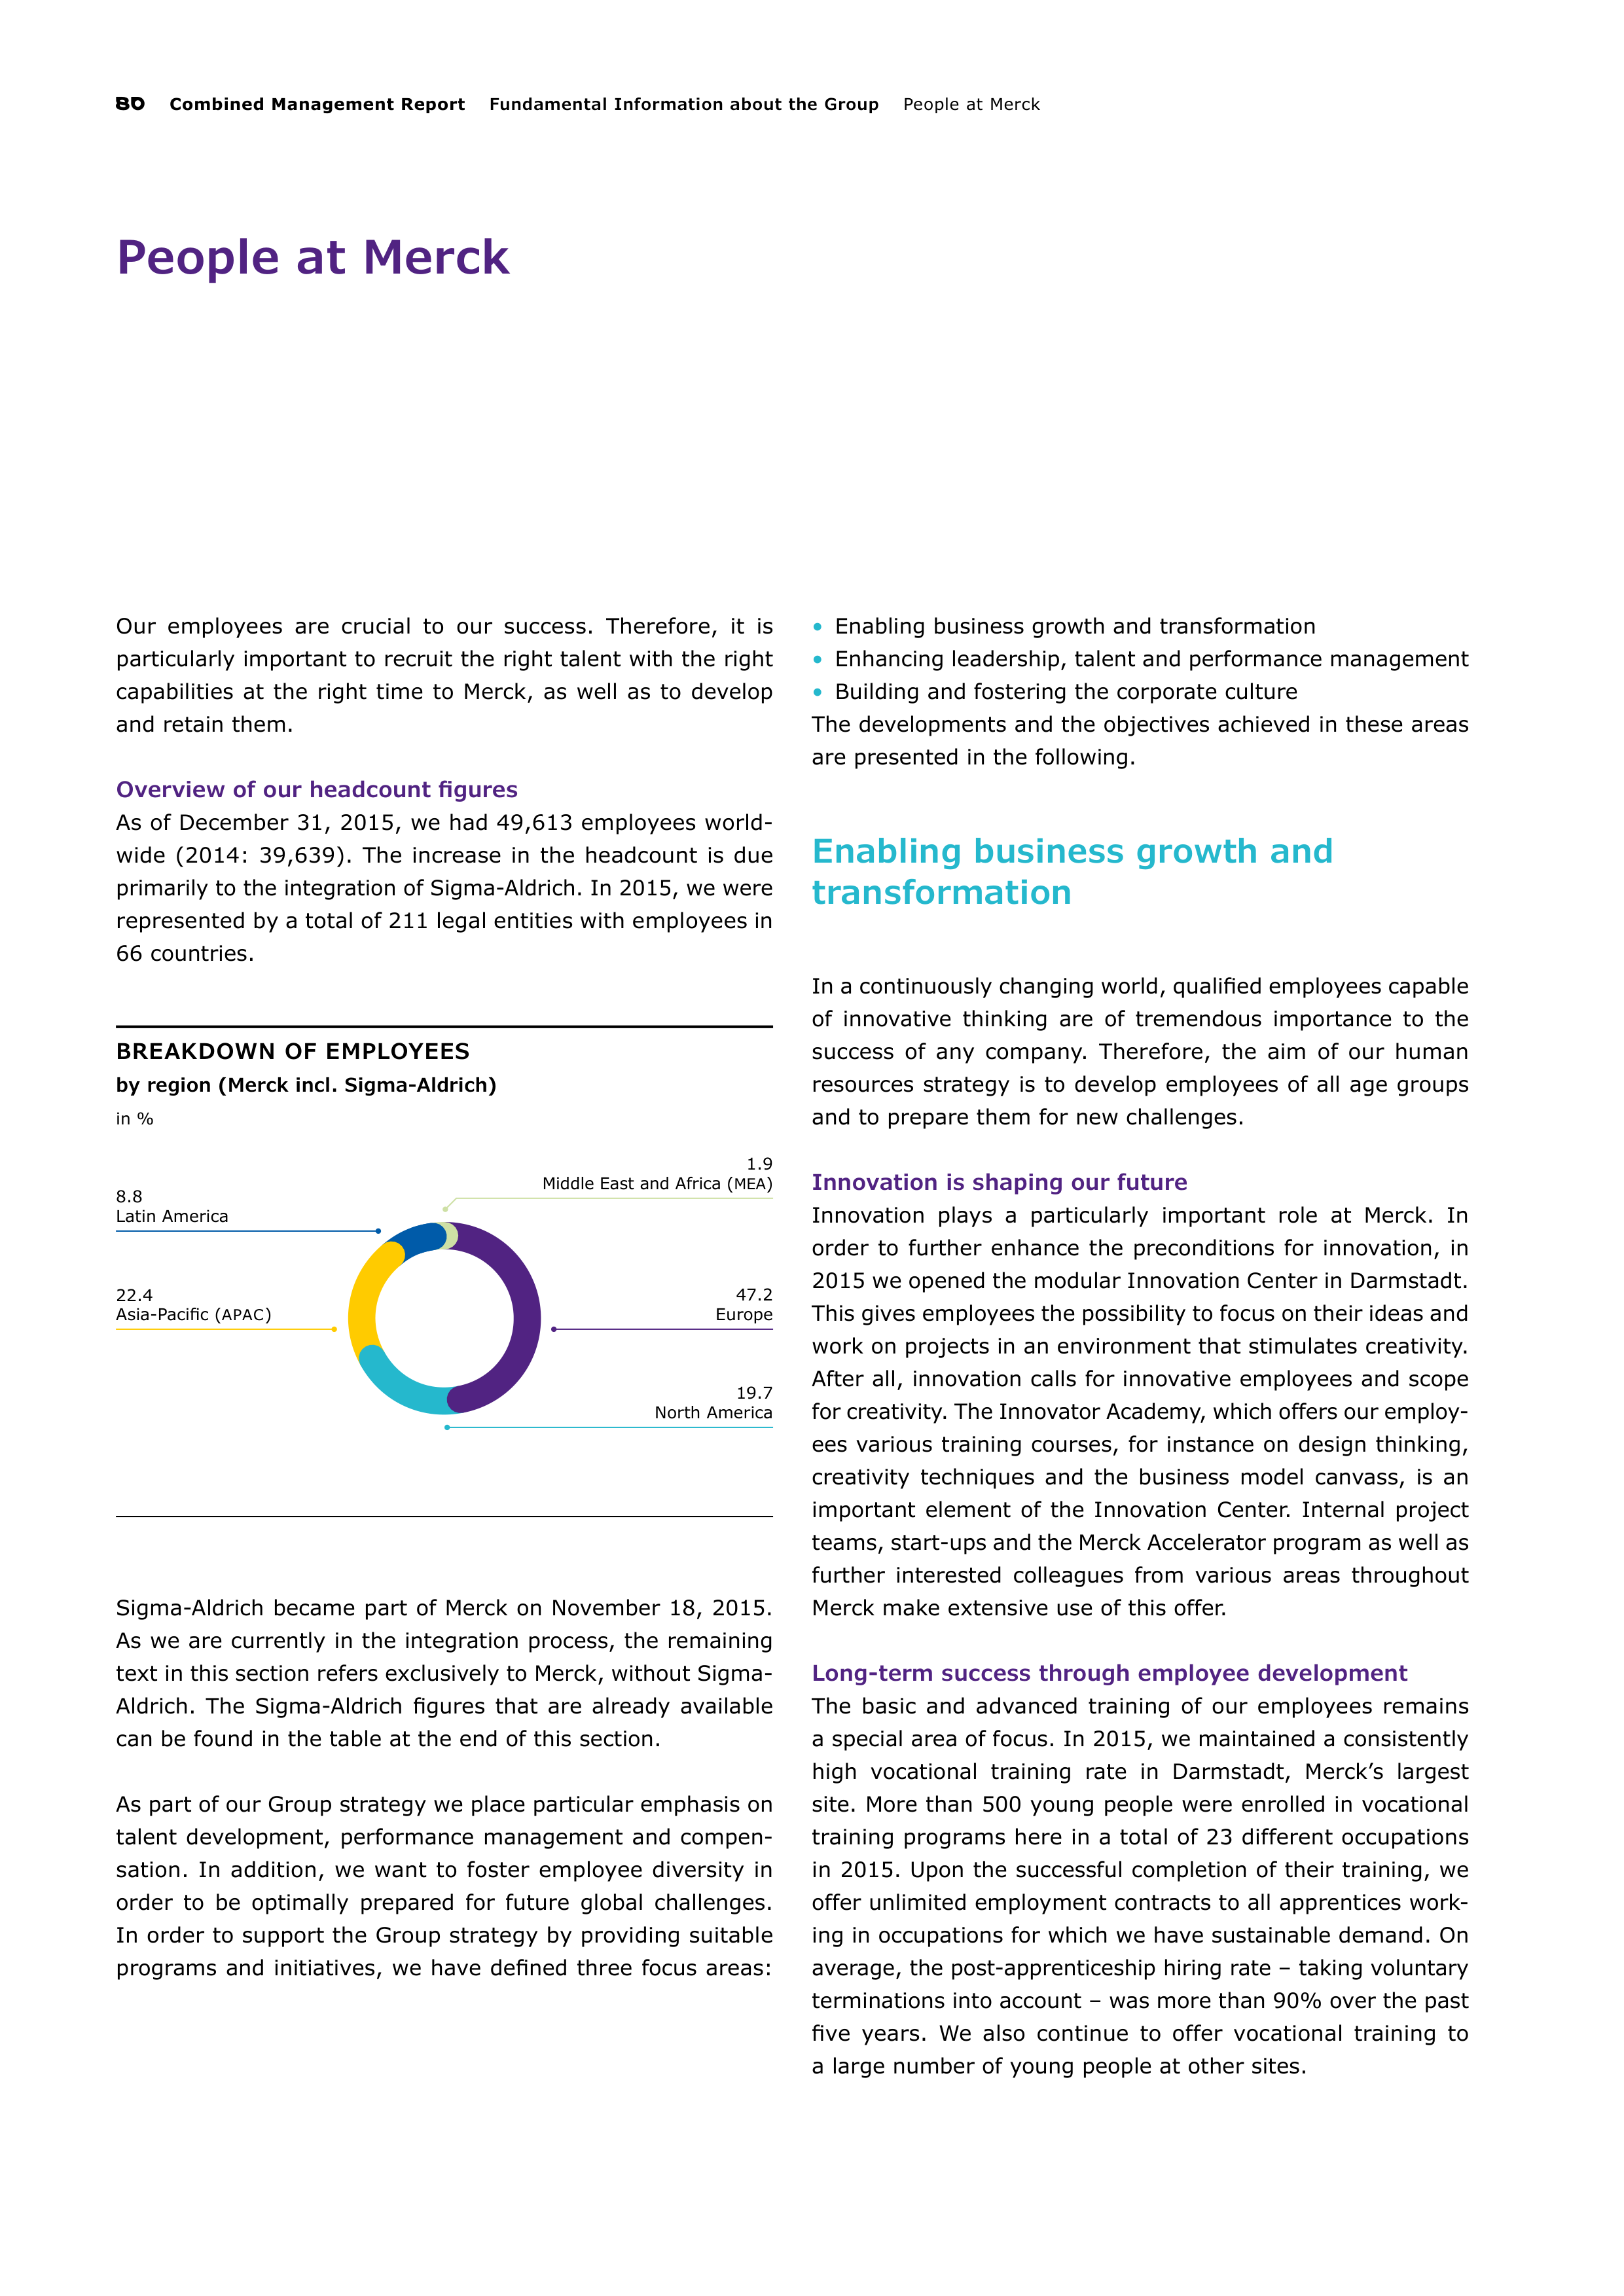
80
Combined Management Report
Fundamental Information about the Group
People at Merck
BREAKDOWN OF EMPLOYEES
by region (Merck incl. Sigma-Aldrich)
in %
47.2
Europe
22.4
Asia-Pacific (
APAC
)
19.7
North America
8.8
Latin America
1.9
Middle East and Africa (
MEA
)
People at Merck
Our employees are crucial to our success. Therefore, it is
particularly important to recruit the right talent with the right
capabilities at the right time to Merck, as well as to develop
and retain them.
Overview of our headcount figures
As of December 31, 2015, we had 49,613 employees world-
wide (2014: 39,639). The increase in the headcount is due
primarily to the integration of Sigma-Aldrich. In 2015, we were
represented by a total of 211 legal entities with employees
in
66 countries.
Sigma-Aldrich became part of Merck on November 18, 2015.
As we are currently in the integration process, the remaining
text in this section refers exclusively to Merck, without Sigma-
Aldrich. The Sigma-Aldrich figures that are already available
can be found in the table at the end of this section.
As part of our Group strategy we place particular emphasis on
talent development, performance management and compen-
sation. In addition, we want to foster employee diversity in
order to be optimally prepared for future global challenges.
In order to support the Group strategy by providing suitable
programs and initiatives, we have defined three focus areas:
•
Enabling business growth and transformation
•
Enhancing leadership, talent and performance management
•
Building and fostering the corporate culture
The developments and the objectives achieved in these areas
are presented in the following.
Enabling business growth and
transformation
In a continuously changing world, qualified employees capable
of innovative thinking are of tremendous importance to the
success of any company. Therefore, the aim of our human
resources strategy is to develop employees of all age groups
and to prepare them for new challenges.
Innovation is shaping our future
Innovation plays a particularly important role at Merck. In
order to further enhance the preconditions for innovation, in
2015 we opened the modular Innovation Center in Darmstadt.
This gives employees the possibility to focus on their ideas and
work on projects in an environment that stimulates creativity.
After all, innovation calls for innovative employees and scope
for creativity. The Innovator Academy, which offers our employ-
ees
various training courses, for instance on design thinking,
creativity techniques and the business model canvass, is an
important element of the Innovation Center. Internal project
teams, start-ups and the Merck Accelerator program as well as
further interested colleagues from various areas throughout
Merck make extensive use of this offer.
Long-term success through employee development
The basic and advanced training of our employees remains
a special area of focus. In 2015, we maintained a consistently
high vocational training rate in Darmstadt, Merck’s largest
site. More than 500 young people were enrolled in vocational
training programs here in a total of 23 different occupations
in
2015. Upon the successful completion of their training, we
offer unlimited employment contracts to all apprentices work-
ing in occupations for which we have sustainable demand. On
average, the post-apprenticeship hiring rate – taking voluntary
t
erminations into account – was more than 90% over the past
five years. We also continue to offer vocational training to
a large number of young people at other sites.
People at Merck
Fundamental Information about the Group
Combined Management Report
81
‟Start in die Ausbildung”, a German program to prepare young
people for an apprenticeship, was continued with 20 interns,
the same number as in 2014. The program is for young people
between the ages of 16 and 25 who have completed secondary
school without having successfully found an apprenticeship for
at least one year after completing school. We promote the
professional expertise of our apprentices through numerous
regional and global project activities. These include supporting
a center for homeless children in Kenya. We were recognized
for this and other activities to promote the social skills of
apprentices. At the 2015 Hermann Schmidt Award ceremony,
Merck received a special prize for innovative vocational training
from the German Federal Institute for Vocational Training.
Our global advanced training program ensures that all of our
employees and executives around the world develop the skills
that they and we need to implement our company strategy
and to remain successful in the future. For instance, we offer
them a range of globally aligned classroom training courses on
17 selected subjects. In 2015, more than 4,000 employees
participated in these programs. Moreover, we make various
e-learning and language courses as well as book summaries
and development tools available to our employees. In addition,
local, business, and function-related offers exist to ensure the
continuous further development of our employees. Our Team
Performance workshop supports the participants in improving
their effectiveness and cooperation.
We also offer our top talent and senior executives a range
of advanced training programs. One of the aims of the seven-
month International Management Program is to promote
global thinking among young talent and to strengthen their
leadership competencies. Additionally, in cooperation with top
international universities, the Merck University has been offer-
ing a multi-regional, modular one-year program since 1999.
To date, 345 members of top management have taken part in
this program. Furthermore, Merck cooperates globally with
universities in order to support employees who wish to study
for an Executive
MBA
, for instance. In 2015, we launched the
Growth Markets Management program in India and Latin
America for local executives. This program, which encom
passes business and company-specific topics, is also offered in
China and Turkey. The programs had participants from a variety
of countries and regions such as Africa, the Middle East,
Japan,
and Russia. Globally, a total of 98 managers took part
in these programs in 2015. Moreover, in 2015 the Managerial
Foundation Program was conducted in 15 countries with 507
participants and the Advanced Management Program was
attended by 110 participants in four countries.
Through our investments in leadership quality, talent develop-
ment and advanced training, we strengthened the loyalty of
employees in countries with relatively high turnover rates such
as China and India.
Enhancing leadership, talent and
performance management
Furthering the performance culture at Merck is another focal
point of our human resources work. In this context, differenti-
ated compensation and advanced training opportunities are
important incentives. In order to establish this type of culture,
we consider it particularly important for managers to set an
example through their attitude and behavior. Selecting and
positioning the right employees, both internally and externally,
are crucial here.
Enhancing and developing a common understanding of
leadership
Our managers are expected to drive our innovative business
model. They achieve this by recognizing and making use of the
opportunities offered by the diverse cultures and experiences of
employees. At the same time, executives are to set an exam-
ple, for instance by living the company values and nurturing
a feedback culture. As part of an evaluation of our leadership
and business model, not only were roles adapted, but leader-
ship was also singled out as a central topic. Therefore, in Octo-
ber 2015, a new strategic competency model was introduced
to further develop and support our business strategy and thus
the related leadership culture. The strategic competencies
according to which managers and employees are to behave are
purposeful, future-oriented, innovative, results-driven, collab-
orative, and empowering. We will use the new model to build
and expand these central competencies in line with our future
strategic direction.
Promoting talent within the company, attracting talent
from outside
Within the framework of the ‟Fit for 2018” program, we
launched the capability initiative ‟
ONE
Talent Development,
Rewards and Performance Management” as part of our Group
strategy. The aim is to attract highly qualified graduates from
around the world to Merck and to retain them.
82
Combined Management Report
Fundamental Information about the Group
People at Merck
We consider it important to identify employee potential early on
and foster it on an individual basis. We want to offer our
employees interesting career opportunities, continuous personal
and professional development as well as prospects within the
company. We are therefore continuously working to strengthen
the performance and development culture within the com-
pany. Our processes are intended to support this and to ensure
that internal positions are filled in an even more efficient
manner. In order to achieve this, talent and performance man-
agement processes are globally aligned for all employees in
accordance with the same principle and are part of a shared
IT system. We systematically combine talent recognition with
performance management. Regular, individualized performance
evaluations make it easier to identify employees with high
potential and to develop them accordingly. Clear objectives,
differentiated and open feedback and individual development
plans are important prerequisites for personal development,
as well as for the success of the company.
In 2015, we further expanded our workforce pool to inter-
nally fill management positions when they become vacant. The
vast majority of management position vacancies were also
filled by internal candidates in 2015. In addition, we recruited
external executives in order to add new perspectives to our
long-standing in-house expertise.
Merck is using the motto ‟Make great things happen” to
position itself in the global job market, which conveys to
potential applicants a sense of what makes Merck unique: an
inspiring, motivating work environment in which innovations
thrive; an environment in which everyone has the opportunity
to apply their ideas and engagement to benefit customers and
the company, while at the same time developing themselves
as employees. Further increasing Merck’s attractiveness as an
employer was an important reason for the repositioning of the
corporate brand in 2015. In late 2015, we started an analysis
of the impact of the new corporate brand on employer brand-
ing. It is essential to harmonize employer branding and mes-
sages with the new brand in order to position Merck as an
attractive and authentic employer.
In recruitment, we focus our efforts on successfully attract-
ing talent while paying attention to costs. For this, a globally
uniform and binding process was introduced. This starts with
a search in the internal talent pool and an internal job posting
before external channels such as job portals and recruitment
agencies are utilized. On the one hand, the process offers
employees better development opportunities, and on the other
hand it minimizes the costs incurred during external recruitment.
In order to support executives in making hiring decisions
and to establish uniform quality standards, we offer interview
training courses for employees with personnel responsibility.
In the courses, the participants learn proper interview behav-
iors, professional question techniques and how to incorporate
diversity aspects into the hiring decision.
Making performance worthwhile
Competitive and appropriate total compensation is a core
element of our attractiveness as an employer as well as moti-
vating and retaining our employees. For this reason, several
years ago we implemented global and IT-based processes and
programs that help us to implement our philosophy of trans-
parent, consistent and competitive compensation sustainably.
Moreover, it is our objective to offer compensation that is both
performance- and position-based in both internal and external
comparisons. As a family-owned company, total compensation
offered by Merck focuses not only on monetary salary compo-
nents but also includes attractive non-monetary fringe benefits.
Since 2015, it has been possible for individual performance to
have a stronger impact on the variable bonus. In this way we
create greater incentives for employees to achieve top perfor-
mance, while at the same time allowing them to participate to
a greater extent in the success of the company.
Build and foster the corporate culture
An open corporate culture and a diverse workforce contribute
substantially to our business success. Therefore, promoting
diversity and inclusion as well as making employees more will-
ing to embrace cultural change are special areas of emphasis
of our human resources work.
Competitiveness through diversity
To us, diversity means much more than having a certain gender
ratio. Therefore, as part of our strategy, we focus on topics
such as internationality and demography. Diversity is not only
important to us on a managerial level, but also throughout the
entire workforce. Together with a culture of inclusion, diversity
promotes innovation and improves team performance. One
of the strategic goals is to recognize the strengths of such
a
diverse workforce and to appreciate individual differences. It
is important to us to create an integrative work environment
in which all employees have the possibility to realize their full
potential. With respect to three of our six company values,
namely respect, transparency and integrity, multifaceted ideas
are furthered and perspectives strengthened in order to drive
innovation and to add more value. By signing the Equal Oppor-
tunity Charter of the German Mining, Chemical and Energy
Industrial Union (
IG
BCE
) in 2015, we underscored our com-
mitment to fairness and tolerance in the workplace.
In addition to the Chief Diversity Officer, who is responsible
for strategically managing diversity within the company, Merck
also established the Diversity Council in 2013. Its aim is to build
further buy-in for diversity and inclusion within the company.
The council consists of high-ranking managers from all parts
of the company. In 2015, the Diversity Council worked to
introduce our Diversity Framework, which bundles the diversity
and inclusion strategies. It focuses on the following four topics:
recruiting the right people to work for Merck, developing and
retaining them, promoting efficient collaboration, driving inno-
vations and improvements, and serving customers with diverse
needs. In addition, we support specific employee networks in
order to foster exchange among like-minded individuals.
People at Merck
Fundamental Information about the Group
Combined Management Report
83
In September 2015, we celebrated Global Diversity Days with
a campaign entitled ‟It starts with
YOU
– Diversity & Inclusion
at Merck”. The objective of this year’s initiative was to heighten
awareness of diversity and inclusion among our workforce
through global events. Globally, employees on five continents
took part in one of 27 events.
Our goal is to anchor knowledge about our growth markets
within the company. People from a total of 122 different nations
work for Merck. Only 26% of our employees are German citizens,
and 72.2% work outside Germany.
Women currently make up 41.3% of the workforce. Since
the ratio of women to men varies widely across the different
regions, businesses and functions, we have set ourselves the
goal of increasing the percentage of female employees wher-
ever they are underrepresented. Here we take into account
the situation that is typical for the industry as well as regional
differences.
In Germany as well as several other EU countries, Japan
and the United States, we are preparing ourselves for demo-
graphic change. Since the average age of our employees in
these countries is slightly more than 40, the need for urgent
action does not yet exist; however, we assume that this figure
will continue to rise in the coming years. While increasing
automation and digitalization will certainly help to lower the
burden, we are already using various programs to meet the
demographic challenges in Germany. For instance, in 2015 we
not only developed new shift models, but also successfully
introduced preventive health measures for shift workers.
Moreover, we are systematically analyzing positions at the
Darmstadt site in terms of demographic suitability, and deriv-
ing measures from this analysis. The participation in a research
project in 2015 focusing on ‟mindfulness” was a further step
to sensitize the workforce to the limits of their own physical
and mental resources.
Diversity enriches our management team
We are convinced that balanced diversity among management
enhances career advancement opportunities for talented
employees while also helping to provide a broad experience
base within the company. In addition, it allows for differentiated
decision-making, thereby making a significant contribution to
the success of the company.
As a global company, we consider it highly important to
have an international management team. Currently, 61% of
our managers – meaning positions rated Global Grade 14 and
above in our Global Grading System – have a nationality other
than German. Altogether, 64 different nationalities are repre-
sented in such positions.
The percentage of management positions held by women
(Global Grade 14 and up) is currently 26.8% Group-wide.
Certain Group functions such as IT have a lower percentage of
women in management positions. However, the figures are
steadily increasing across Merck as a whole. We have achieved
our strategic goal of raising the percentage of management
positions held by women from 25% to 30% and intend to
further increase this percentage by the end of 2016. The
report
on stipulations to promote the proportion of women in
manage
ment positions at Merck KGaA pursuant to section 76
(4) and section 111 (5) of the German Stock Corporation Act
can be found in the Corporate Governance section of this
report.
Safety in day-to-day work
As a responsible employer, it is especially important to us to do
everything in our power to prevent workplace-related illnesses
and accidents. We apply the lost time injury rate (
LTIR
) as an
indicator to determine the success of measures aimed at acci-
dent prevention as well as occupational health and safety. This
key performance indicator describes the number of workplace
accidents resulting in lost time of more than one day per one
million working hours. In 2010, we had set ourselves the goal
of reducing the lost time injury rate to 2.5 by 2015. Our future
target is even more ambitious. By 2020, we intend to sustain-
ably lower the
LTIR
to 1.5. The aim is to permanently stabilize
or outperform this challenging figure, which we achieved for
the first time in 2015.
The continuous rate of improvement in recent years can
be
particularly attributed to the BeSafe! program, which was
launched in 2010. This is a global initiative with harmonized
standards as well as local modules to meet the specific require-
ments at individual sites. This program focuses on engaging
managers in the safety culture and making safety an intrinsic
value, thus empowering our employees to take responsibility
for their own safety. In 2015, we continued to sensitize our
employees to workplace hazards through numerous activities
and awareness campaigns.
Since 2010, Merck has been presenting the Safety Excel-
lence Award annually in order to underscore the importance
of
safety. It is granted to all production sites with no workplace
accidents on record for the year. In 2015, 41 out of 61 produc-
tion sites were recognized.
Despite our efforts to prevent accidents, there were two
workplace accidents resulting in fatalities in 2015. In the
United States, an employee died in a car accident. In Germany,
an employee was killed in an accident with a fork lift.
Reconciling the demands of a career and family
We want to help our employees achieve a good balance between
their professional and personal objectives. This maintains and
strengthens their motivation and performance potential, ena-
bling them to better schedule their lives to suit their own needs.
We offer our employees in Germany and the United States
various flexible working models. The mywork@Merck working
model initially implemented in 2013 at the Darmstadt, Gerns
heim and Grafing sites in Germany for all exempt employees
aims to strengthen a culture of performance and trust within
the company. Employees can choose their working hours and
work location freely. Since October 2014, non-exempt employ-
ees at these sites whose positions are suitable for this working
model have also been able to make use of it. In addition,
mywork@Merck was also introduced for Merck Accounting
Solutions & Services Europe GmbH, Merck Export GmbH,
Merck Schuchardt
OHG
, and Merck Selbstmedikation GmbH.
At the end of 2015, a total of 4,122 employees made use of
mywork@Merck. Globally, 5.1% of our employees worked part-
time in 2015. 10.9% of our part-time employees are
men.
84
Combined Management Report
Fundamental Information about the Group
People at Merck
In addition, we offer our employees throughout Germany
targeted and independent information, advice and assistance
with regard to finding childcare and nursing care, as well as
home and garden services. At various sites, employees benefit
from childcare options that we subsidize. A daycare center
with capacity for 150 children between the ages of one and
twelve has been operating at the Darmstadt site for 48 years.
Since 2013, the daycare center has had expanded, year-round
opening hours from 6:30 a.m. to 7 p.m., needs-oriented day-
care hour options of 25, 35, or 50 hours per week, as well as an
adjacent new building, which is used exclusively as a nursery
for up to 30 children ranging in age from one to three years.
A
good staff ratio, which offers parents and children reliability
with respect to the number of hours of care, is particularly
important to us. While their children adjust to the new envi-
ronment, our employees can make use of additional offices for
parents at the daycare center premises.
Dedicated employees contribute to success
A dedicated workforce is crucial in order to succeed as a global
company. Honest and balanced feedback from our employees
is thus important to us since it reveals, among other things,
the factors that influence engagement and what the organiza-
tion’s strengths and weaknesses are.
In 2014 and 2015, around 20,000 of our employees from all
business sectors and Group functions took part in the McKinsey
Organizational Health Index (
OHI
) survey. Using nine health
dimensions, the
OHI
shows in a holistic and business-oriented
manner how efficient an organization is. In comparison with
the more than 1,000 companies that conducted the survey,
our
OHI
score for motivation is in the second quartile.
Although opportunities for improvement were identified,
the overall results show that in comparison, our score is
above-average. The consolidated
OHI
results were presented
to our Executive Board in 2015. Work on central topics derived
from the survey has already begun. The topics identified in the
survey are being monitored and further pursued within the
scope of employee surveys.
Additionally, Merck received an important distinction in
2015
for the innovation programs Innospire and the Innovation
Cup. These were awarded the Innovation Prize of German
Industry, the world’s oldest innovation award, in the innova-
tive personnel concepts category. Innospire fosters innovative
employee ideas for new businesses; the Innovation Cup is
aimed at top students from around the world. A further inno-
vation program entitled Outcubation was realized in Heidelberg
to promote young talent and was published in Nature Biotech-
nology, a renowned journal.
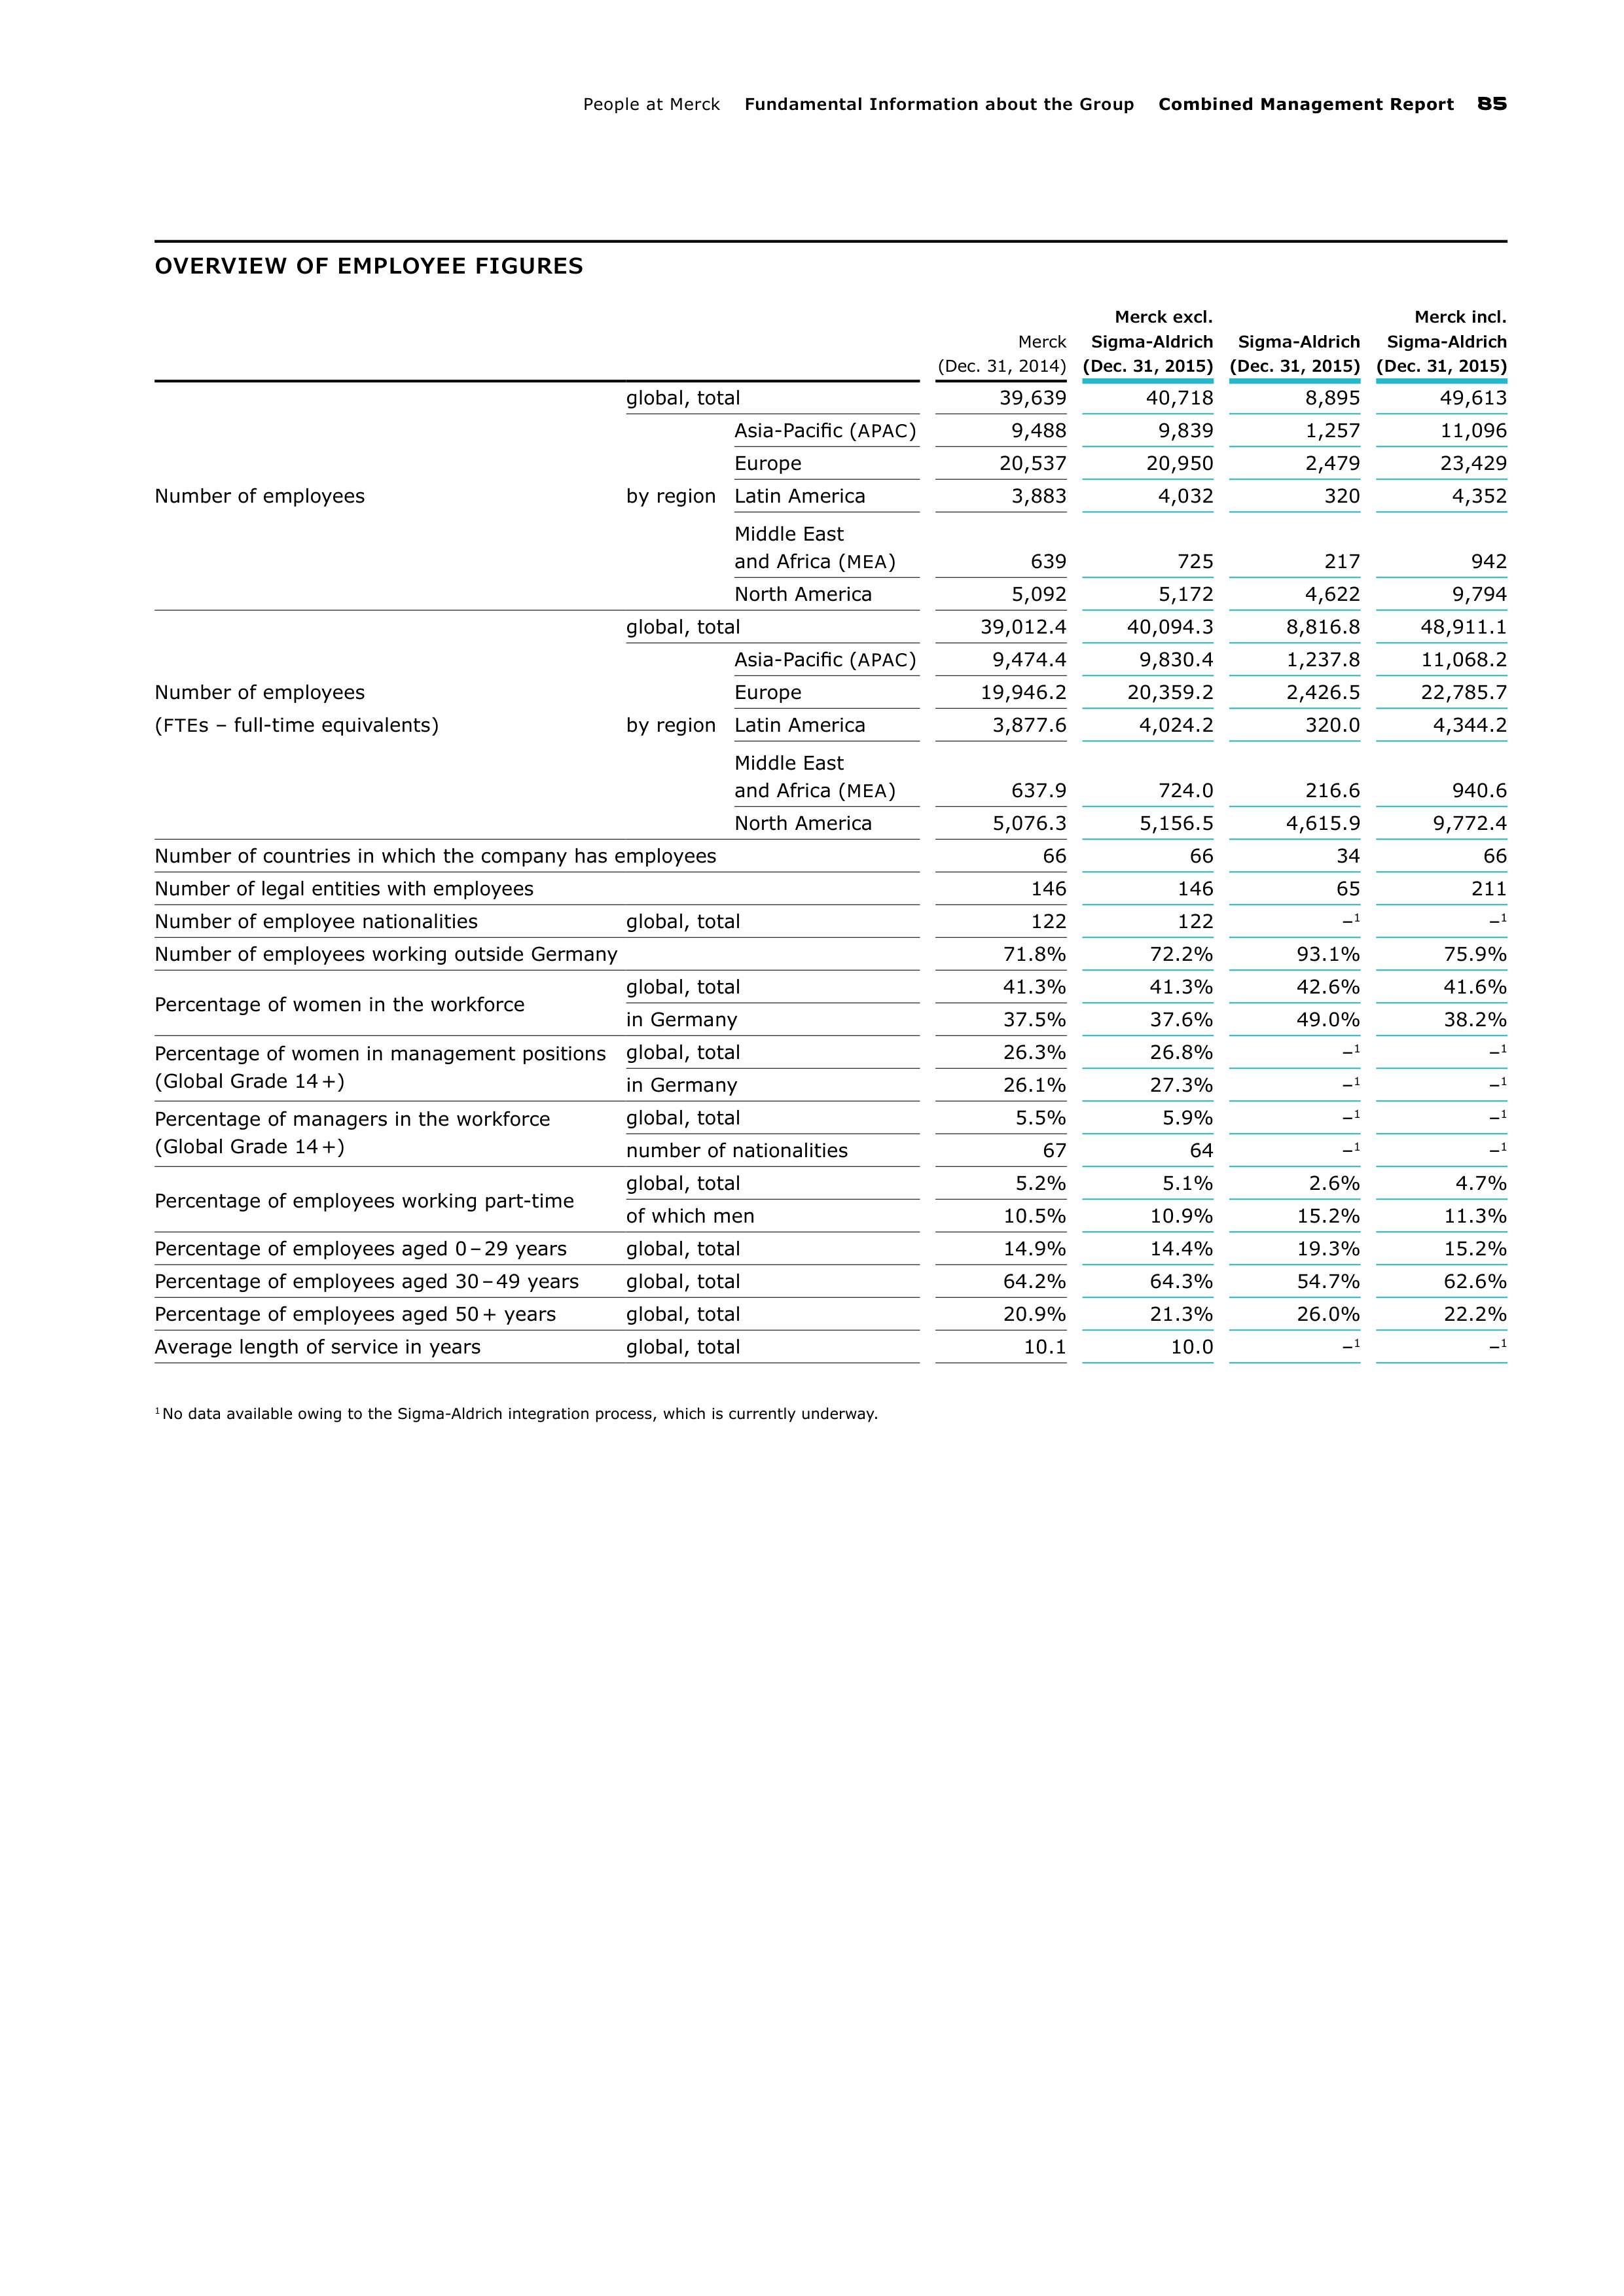
People at Merck
Fundamental Information about the Group
Combined Management Report
85
OVERVIEW OF EMPLOYEE FIGURES
Merck
(Dec. 31, 2014)
Merck excl.
Sigma-Aldrich
(Dec. 31, 2015)
Sigma-Aldrich
(Dec. 31, 2015)
Merck incl.
Sigma-Aldrich
(Dec. 31, 2015)
Number of employees
global, total
39,639
40,718
8,895
49,613
by region
Asia-Pacific (
APAC
)
9,488
9,839
1,257
11,096
Europe
20,537
20,950
2,479
23,429
Latin America
3,883
4,032
320
4,352
Middle East
and Africa (
MEA
)
639
725
217
942
North America
5,092
5,172
4,622
9,794
Number of employees
(
FTE
s – full-time equivalents)
global, total
39,012.4
40,094.3
8,816.8
48,911.1
by region
Asia-Pacific (
APAC
)
9,474.4
9,830.4
1,237.8
11,068.2
Europe
19,946.2
20,359.2
2,426.5
22,785.7
Latin America
3,877.6
4,024.2
320.0
4,344.2
Middle East
and Africa (
MEA
)
637.9
724.0
216.6
940.6
North America
5,076.3
5,156.5
4,615.9
9,772.4
Number of countries in which the company has employees
66
66
34
66
Number of legal entities with employees
146
146
65
211
Number of employee nationalities
global, total
122
122
–
1
–
1
Number of employees working outside Germany
71.8%
72.2%
93.1%
75.9%
Percentage of women in the workforce
global, total
41.3%
41.3%
42.6%
41.6%
in Germany
37.5%
37.6%
49.0%
38.2%
Percentage of women in management positions
(Global Grade 14 +)
global, total
26.3%
26.8%
–
1
–
1
in Germany
26.1%
27.3%
–
1
–
1
Percentage of managers in the workforce
(Global Grade 14 +)
global, total
5.5%
5.9%
–
1
–
1
number of nationalities
67
64
–
1
–
1
Percentage of employees working part-time
global, total
5.2%
5.1%
2.6%
4.7%
of which men
10.5%
10.9%
15.2%
11.3%
Percentage of employees aged 0 – 29 years
global, total
14.9%
14.4%
19.3%
15.2%
Percentage of employees aged 30 – 49 years
global, total
64.2%
64.3%
54.7%
62.6%
Percentage of employees aged 50 + years
global, total
20.9%
21.3%
26.0%
22.2%
Average length of service in years
global, total
10.1
10.0
–
1
–
1
1
No data available owing to the Sigma-Aldrich integration process, which is currently underway.
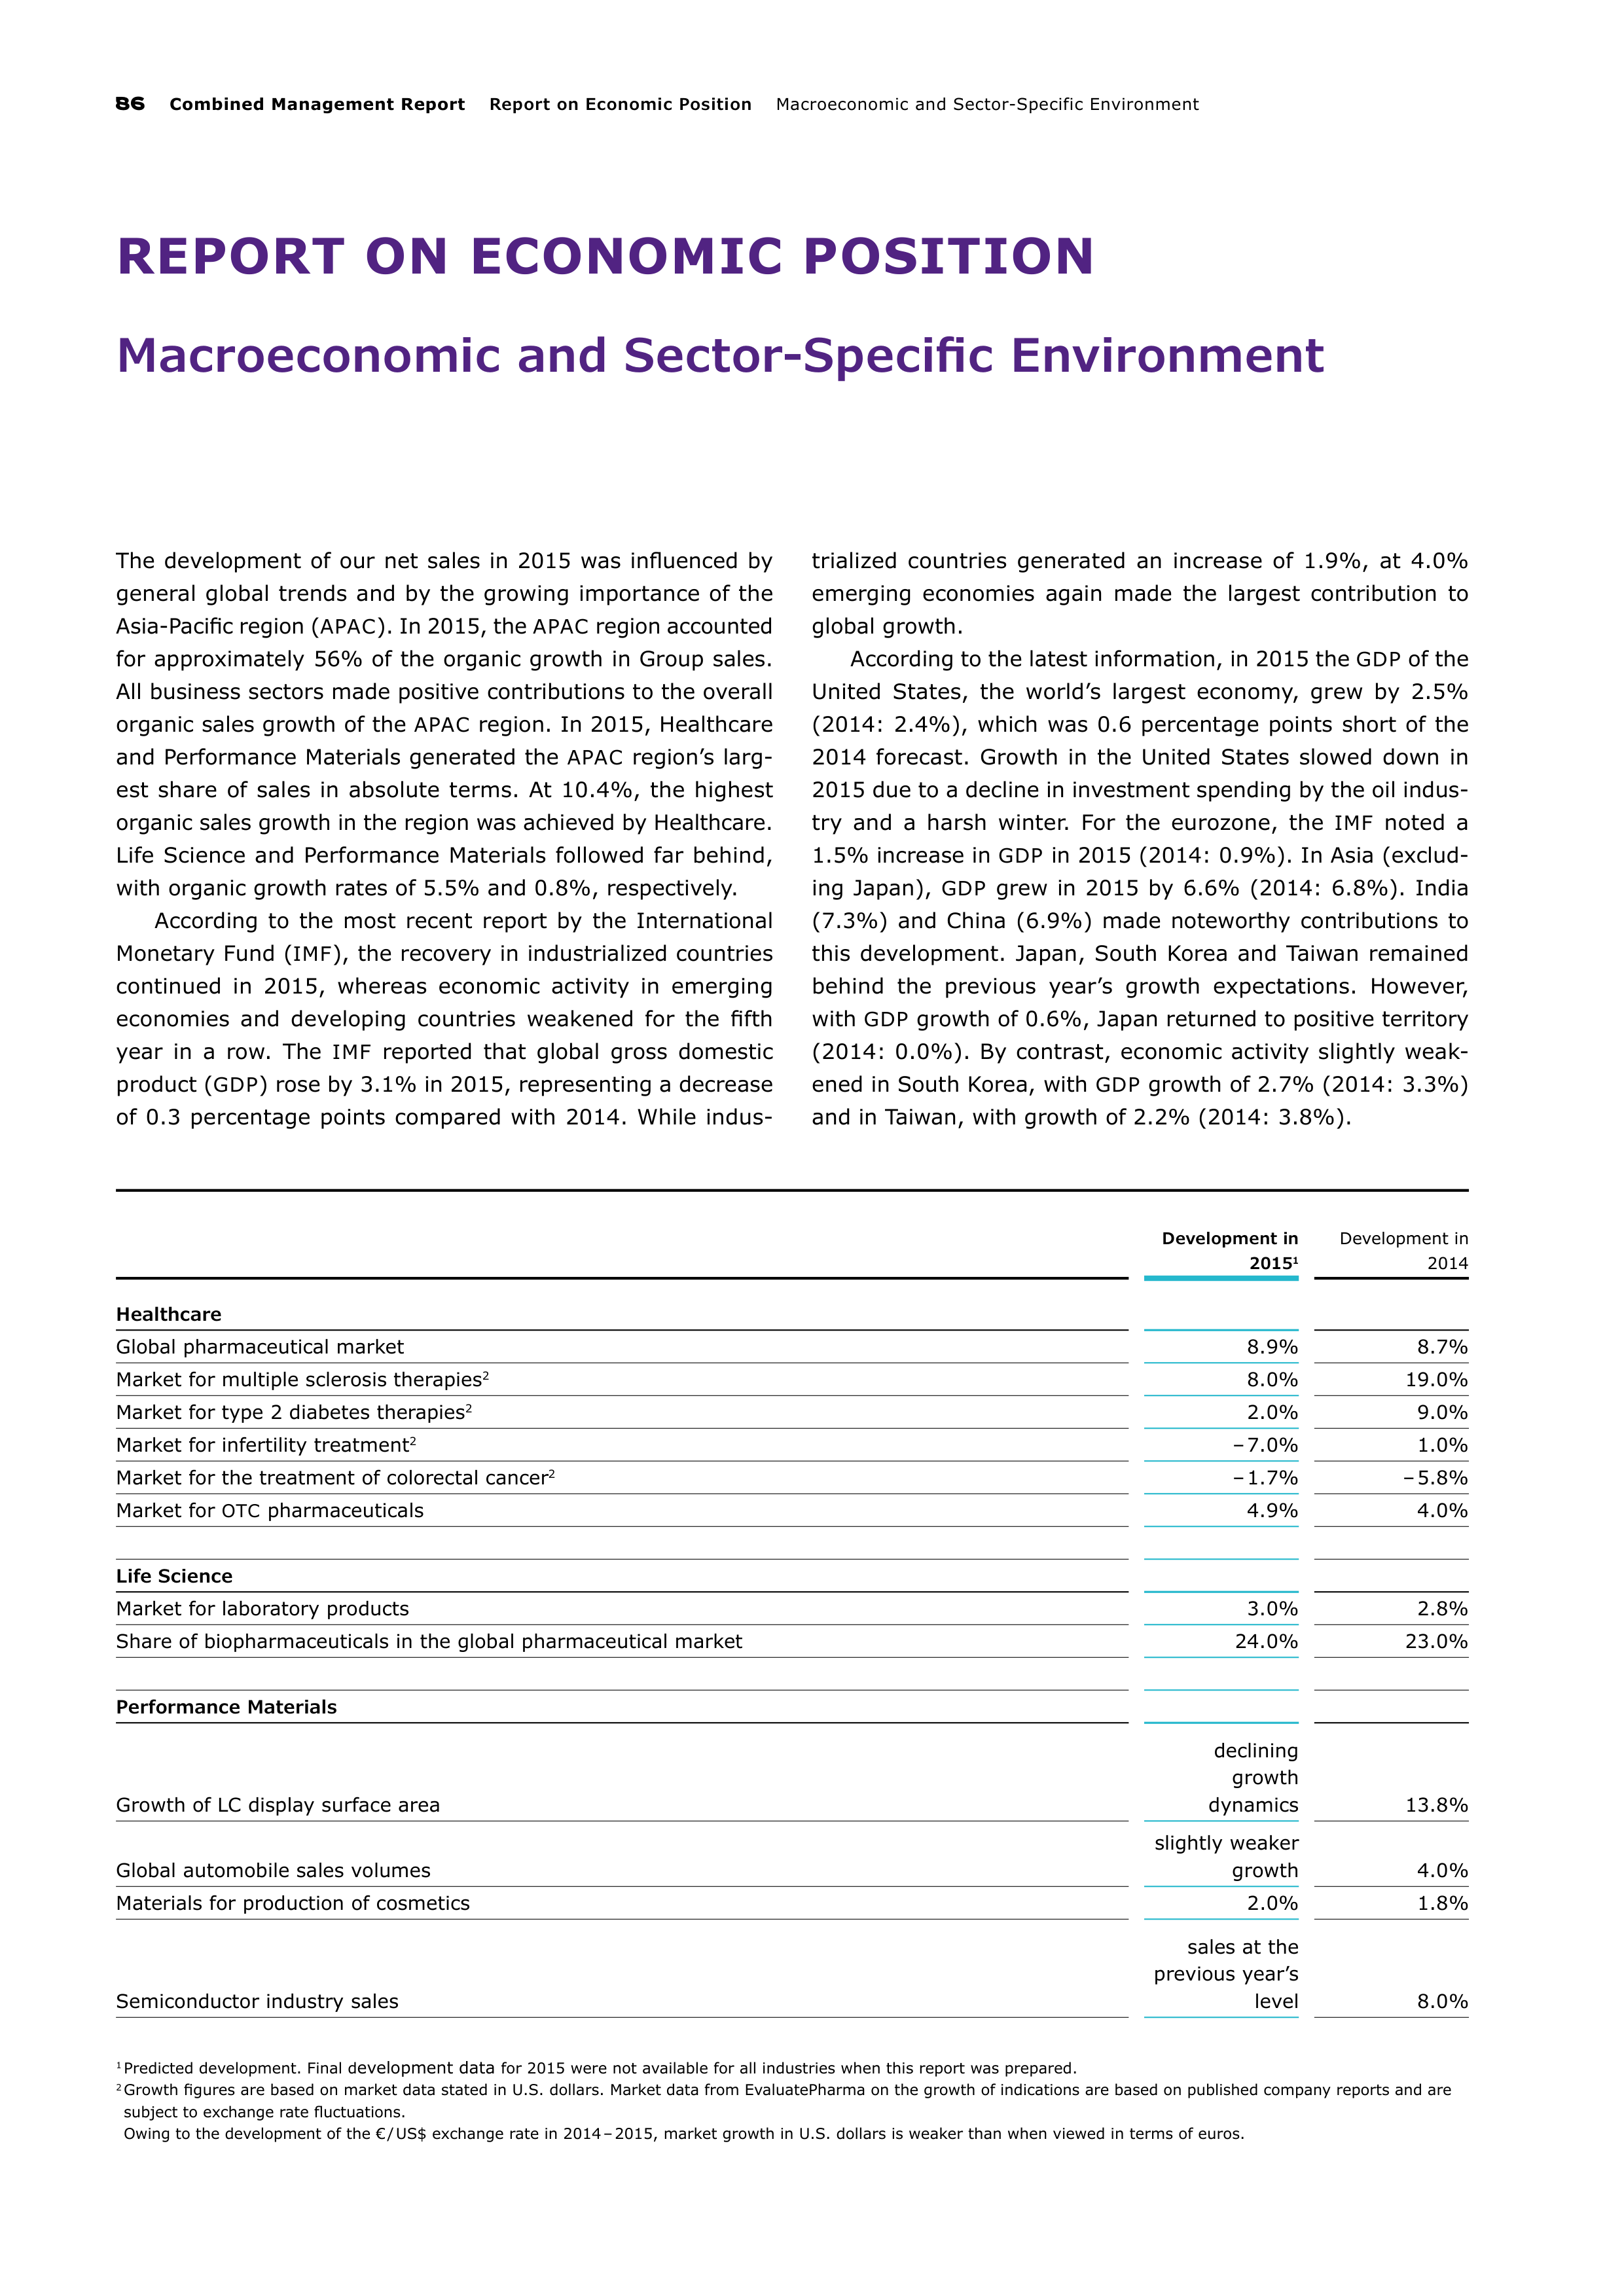
86
Combined Management Report
Report on Economic Position
Macroeconomic and Sector-Specific Environment
REPORT ON ECONOMIC POSITION
Macroeconomic and Sector-Specific Environment
The development of our net sales in 2015 was influenced by
general global trends and by the growing importance of the
Asia-Pacific region
(
APAC
)
. In 2015, the
APAC
region accounted
for approximately 56% of the organic growth in Group sales.
All business sectors made positive contributions to the overall
organic sales growth of the
APAC
region. In 2015, Healthcare
and Performance Materials generated the
APAC
region’s larg-
est share of sales in absolute terms. At 10.4%, the highest
organic sales growth in the region was achieved by Healthcare.
Life Science and Performance Materials followed far behind,
with organic growth rates of 5.5% and 0.8%, respectively.
According to the most recent report by the International
Monetary Fund (
IMF
), the recovery in industrialized countries
continued in 2015, whereas economic activity in emerging
economies and developing countries weakened for the fifth
year in a row. The
IMF
reported that global gross domestic
product (
GDP
) rose by 3.1% in 2015, representing a decrease
of 0.3 percentage points compared with 2014. While indus-
trialized countries generated an increase of 1.9%, at 4.0%
emerging economies again made the largest contribution to
global growth.
According to the latest information, in 2015 the
GDP
of the
United States, the world’s largest economy, grew by 2.5%
(2014: 2.4%), which was 0.6 percentage points short of the
2014 forecast. Growth in the United States slowed down in
2015 due to a decline in investment spending by the oil indus-
try and a harsh winter. For the eurozone, the
IMF
noted a
1.5% increase in
GDP
in 2015 (2014: 0.9%). In Asia (exclud-
ing Japan),
GDP
grew in 2015 by 6.6% (2014: 6.8%). India
(7.3%) and China (6.9%) made noteworthy contributions to
this development. Japan, South Korea and Taiwan remained
behind the previous year’s growth expectations. However,
with
GDP
growth of 0.6%, Japan returned to positive territory
(2014: 0.0%). By contrast, economic activity slightly weak-
ened in South Korea, with
GDP
growth of 2.7% (2014: 3.3%)
and in Taiwan, with growth of 2.2% (2014: 3.8%).
Development in
2015
1
Development in
2014
Healthcare
Global pharmaceutical market
8.9%
8.7%
Market for multiple sclerosis therapies
2
8.0%
19.0%
Market for type 2 diabetes therapies
2
2.0%
9.0%
Market for infertility treatment
2
– 7.0%
1.0%
Market for the treatment of colorectal cancer
2
– 1.7%
– 5.8%
Market for
OTC
pharmaceuticals
4.9%
4.0%
Life Science
Market for laboratory products
3.0%
2.8%
Share of biopharmaceuticals in the global pharmaceutical market
24.0%
23.0%
Performance Materials
Growth of LC display surface area
declining
growth
dynamics
13.8%
Global automobile sales volumes
slightly weaker
growth
4.0%
Materials for production of cosmetics
2.0%
1.8%
Semiconductor industry sales
sales at the
previous year’s
level
8.0%
1
Predicted development. Final d
evelopment data
for 2015 were not available for all industries when this report was prepared.
2
Growth figures are based on market data stated in U.S. dollars.
Market data from EvaluatePharma on the growth of indications are based on published company reports and are
subject to exchange rate fluctuations.
Owing to the development
of the € / US$ exchange rate in 2014 – 2015, market growth in U.S. dollars is weaker than when viewed in terms of euros.
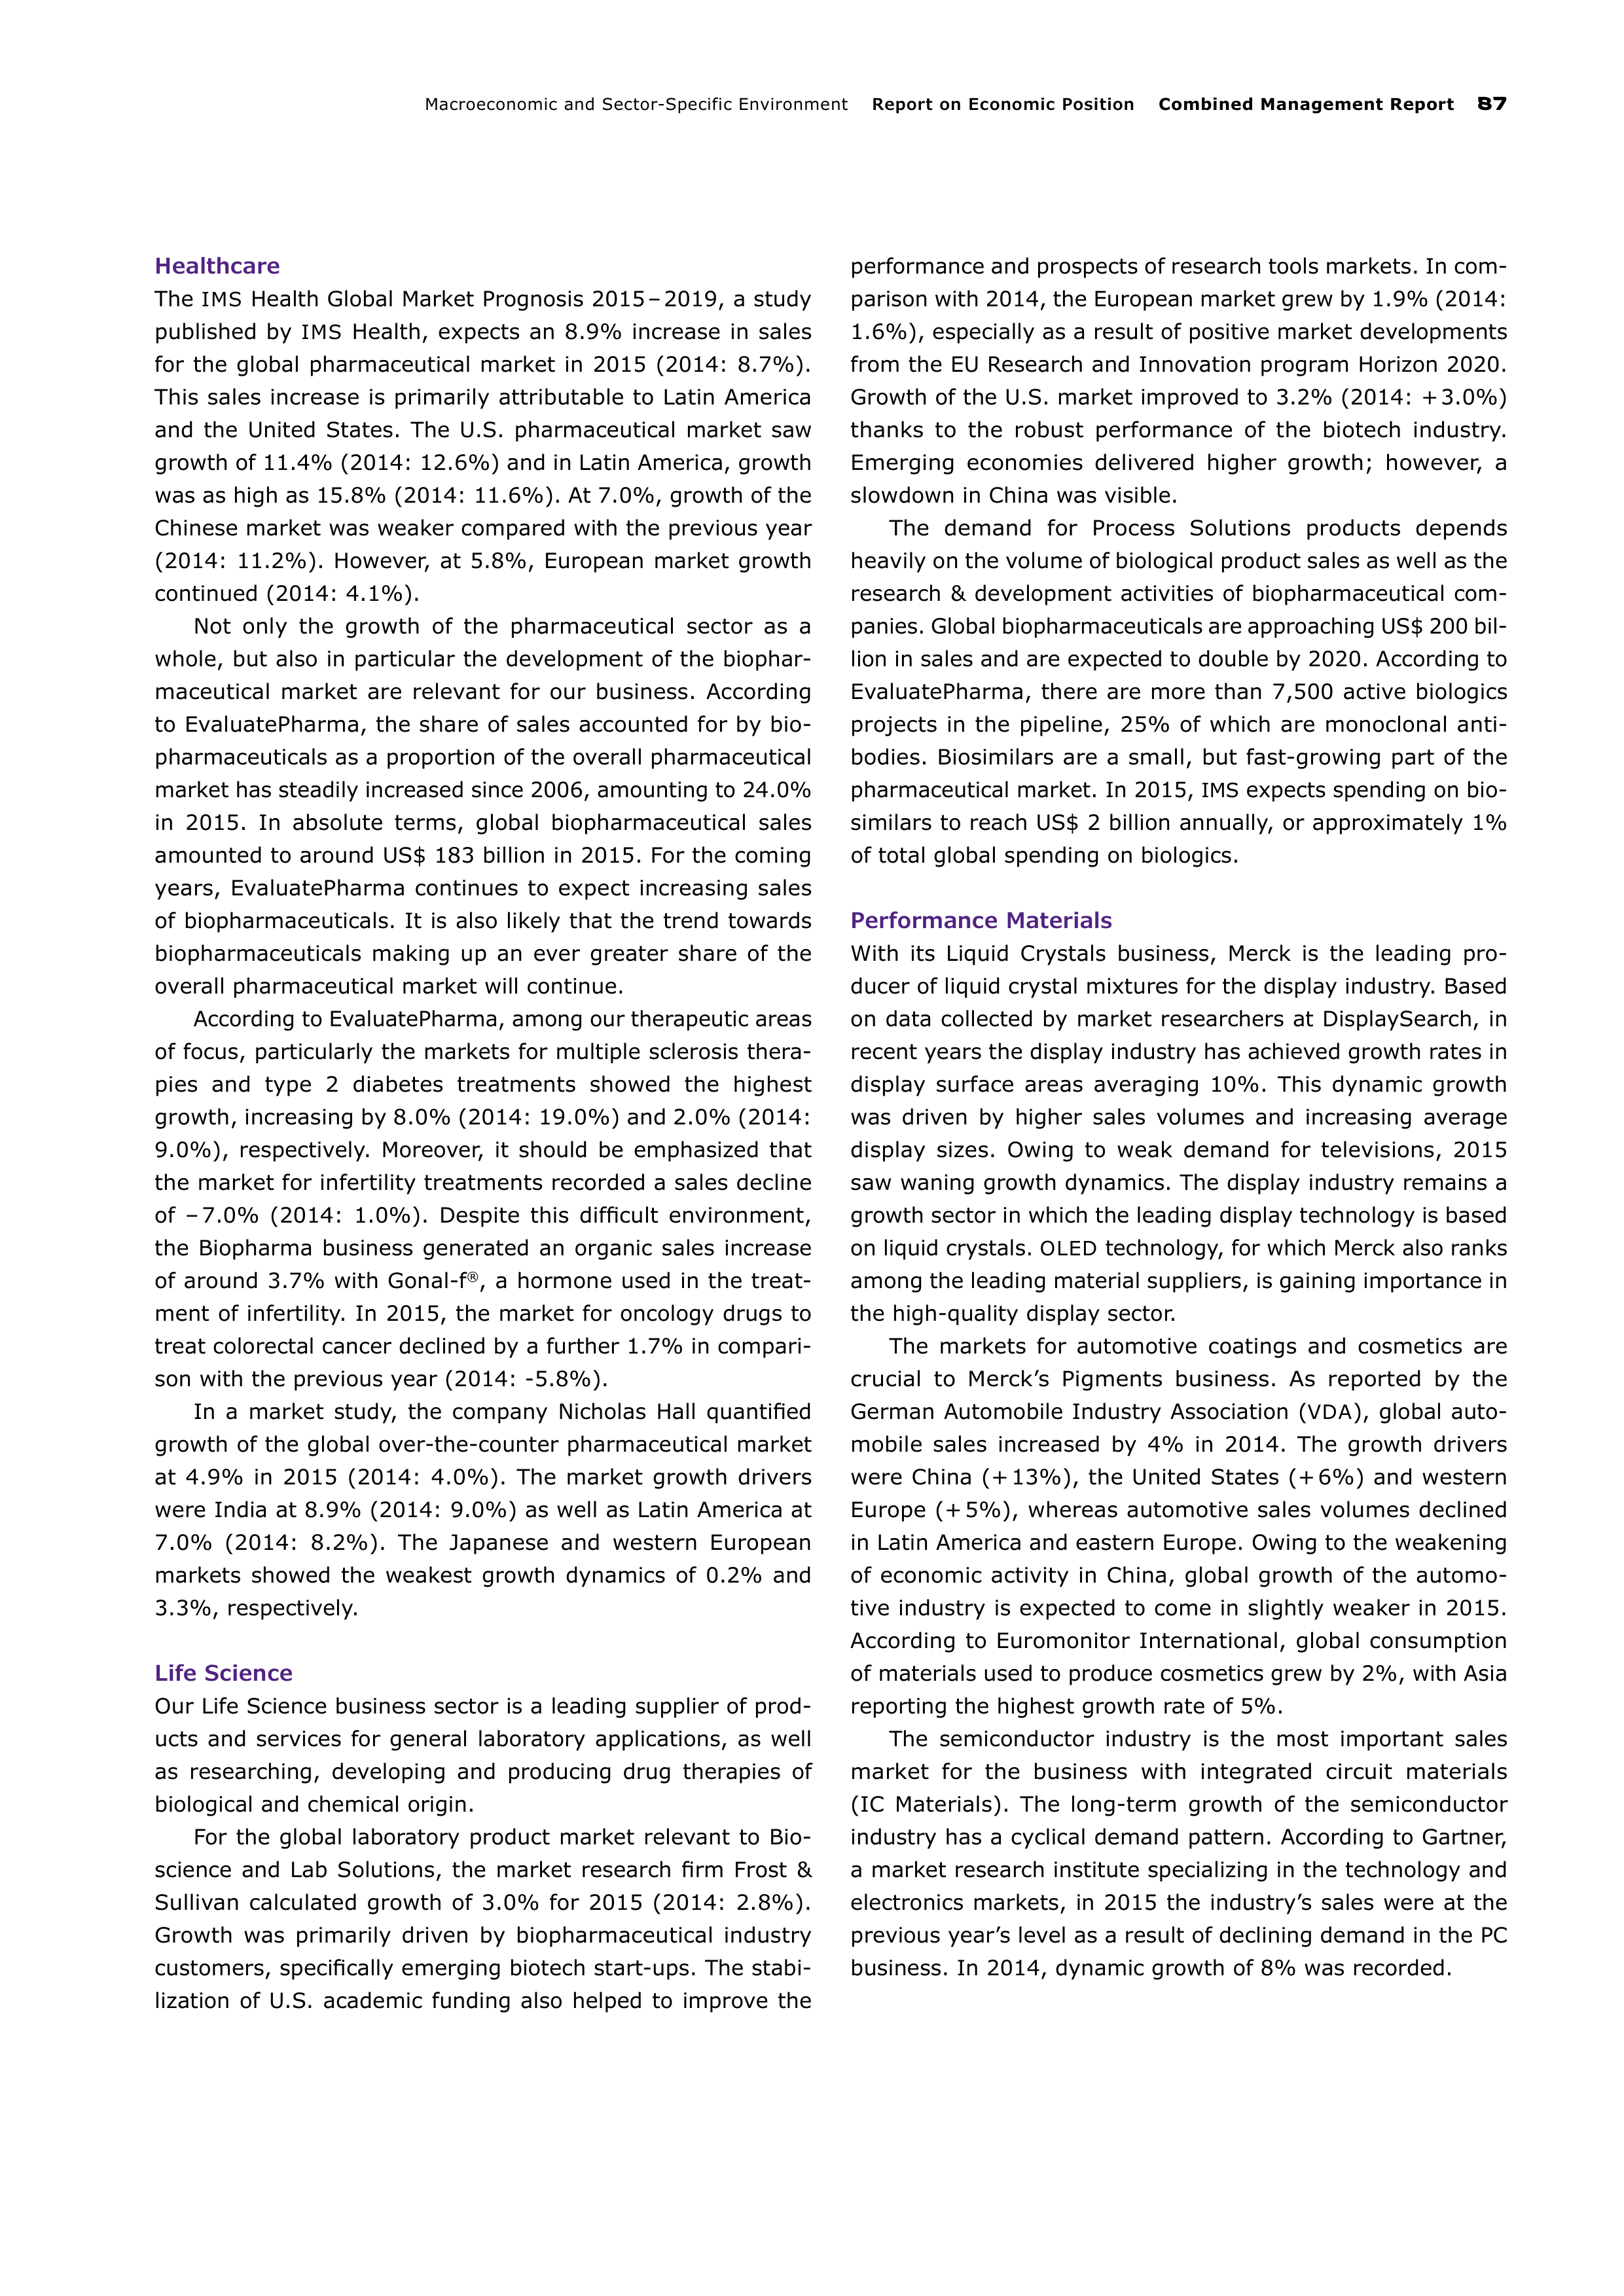
Macroeconomic and Sector-Specific Environment
Report on Economic Position
Combined Management Report
87
Healthcare
The
IMS
Health Global Market Prognosis 2015 – 2019, a study
published by
IMS
Health, expects an 8.9% increase in sales
for the global pharmaceutical market in 2015 (2014: 8.7%).
This sales increase is primarily attributable to Latin America
and the United States. The U.S. pharmaceutical market saw
growth of 11.4% (2014: 12.6%) and in Latin America, growth
was as high as 15.8% (2014: 11.6%). At 7.0%, growth of the
Chinese market was weaker compared with the previous year
(2014: 11.2%). However, at 5.8%, European market growth
continued (2014: 4.1%).
Not only the growth of the pharmaceutical sector as a
whole, but also in particular the development of the biophar-
maceutical market are relevant for our business. According
to EvaluatePharma, the share of sales accounted for by bio
pharmaceuticals as a proportion of the overall pharmaceutical
market has steadily increased since 2006, amounting to 24.0%
in 2015. In absolute terms, global biopharmaceutical sales
amounted to around US$ 183 billion in 2015. For the coming
years, EvaluatePharma continues to expect increasing sales
of
biopharmaceuticals. It is also likely that the trend towards
biopharmaceuticals making up an ever greater share of the
overall pharmaceutical market will continue.
According to EvaluatePharma, among our therapeutic areas
of focus, particularly the markets for multiple sclerosis thera-
pies and type 2 diabetes treatments showed the highest
growth, increasing by 8.0% (2014: 19.0%) and 2.0% (2014:
9.0%), respectively. Moreover, it should be emphasized that
the market for infertility treatments recorded a sales decline
of – 7.0% (2014: 1.0%). Despite this difficult environment,
the Biopharma business generated an organic sales increase
of around 3.7% with Gonal-f
®
, a hormone used in the treat-
ment of infertility. In 2015, the market for oncology drugs to
treat colorectal cancer declined by a further 1.7% in compari-
son with the previous year (2014: -5.8%).
In a market study, the company Nicholas Hall quantified
growth of the global over-the-counter pharmaceutical market
at 4.9% in 2015 (2014: 4.0%). The market growth drivers
were India at 8.9% (2014: 9.0%) as well as Latin America at
7.0% (2014: 8.2%). The Japanese and western European
markets showed the weakest growth dynamics of 0.2% and
3.3%, respectively.
Life Science
Our Life Science business sector is a leading supplier of prod-
ucts and services for general laboratory applications, as well
as researching, developing and producing drug therapies of
biological and chemical origin.
For the global laboratory product market relevant to Bio-
science and Lab Solutions, the market research firm Frost &
Sullivan calculated growth of 3.0% for 2015 (2014: 2.8%).
Growth was primarily driven by biopharmaceutical industry
customers, specifically emerging biotech start-ups. The stabi-
lization of U.S. academic funding also helped to improve the
performance and prospects of research tools markets. In com-
parison with 2014, the European market grew by 1.9% (2014:
1.6%), especially as a result of positive market developments
from the EU Research and Innovation program Horizon 2020.
Growth of the U.S. market improved to 3.2% (2014: + 3.0%)
thanks to the robust performance of the biotech industry.
Emerging economies delivered higher growth; however, a
slow
down in China was visible.
The demand for Process Solutions products depends
heav
ily on the volume of biological product sales as well as the
research & development activities of biopharmaceutical com-
panies. Global biopharmaceuticals are approaching US$ 200 bil-
lion
in sales and are expected to double by 2020. According to
EvaluatePharma, there are more than 7,500 active biologics
projects in the pipeline, 25% of which are monoclonal anti
bodies. Biosimilars are a small, but fast-growing part of the
pharmaceutical market. In 2015,
IMS
expects spending on
bio-
similars to reach US$ 2 billion annually, or approximately 1%
of total global spending on biologics.
Performance Materials
With its Liquid Crystals business, Merck is the leading pro-
ducer of liquid crystal mixtures for the display industry. Based
on data collected by market researchers at DisplaySearch, in
recent years the display industry has achieved growth rates in
display surface areas averaging 10%. This dynamic growth
was driven by higher sales volumes and increasing average
display sizes. Owing to weak demand for televisions, 2015
saw
waning growth dynamics. The display industry remains a
growth sector in which the leading display technology is based
on liquid crystals.
OLED
technology, for which Merck also ranks
among the leading material suppliers, is gaining importance in
the high-quality display sector.
The markets for automotive coatings and cosmetics are
crucial to Merck’s Pigments business. As reported by the
German Automobile Industry Association (
VDA
), global auto-
mobile sales increased by 4% in 2014. The growth drivers
were China (+ 13%), the United States (+ 6%) and western
Europe (+ 5%), whereas automotive sales volumes declined
in Latin America and eastern Europe. Owing to the weakening
of economic activity in China, global growth of the automo-
tive industry is expected to come in slightly weaker in 2015.
According to Euromonitor International, global consumption
of
materials used to produce cosmetics grew by 2%, with Asia
reporting the highest growth rate of 5%.
The semiconductor industry is the most important sales
market for the business with integrated circuit materials
(IC Materials). The long-term growth of the semiconductor
industry has a cyclical demand pattern. According to Gartner,
a market research institute specializing in the technology and
electronics markets, in 2015 the industry’s sales were at the
previous year’s level as a result of declining demand in the PC
business. In 2014, dynamic growth of 8% was recorded.
88
Combined Management Report
Report on Economic Position
Review of Forecast against Actual Business Developments
REVIEW OF FORECAST AGAINST ACTUAL
BUSINESS DEVELOPMENTS
In the Annual Report for 2014, we gave forecasts of the key
financial performance indicators for the Merck Group and our
business sectors for 2015. At the time of the forecast, the
acquisition of Sigma-Aldrich was still pending due to outstand-
ing antitrust clearances. We therefore provided a separate
forecast in the event of the successful acquisition of Sigma-
Aldrich, in which we expected the first-time consolidation of
Sigma-Aldrich in mid-2015. The following report reviews the
forecast against the actual business developments, including
the first-time consolidation of Sigma-Aldrich on November 18,
2015.
Net sales
We predicted slight organic sales growth for the Merck Group
in 2015, supplemented by a slight portfolio effect and a mod-
erately positive exchange rate effect. All business sectors
contributed significantly to the moderate 2.6% organic increase
in the net sales of the Merck Group, thus exceeding the fore-
cast. In addition, despite the delay in the acquisition of Sigma-
Aldrich owing to antitrust reviews, we recorded a solid port
folio effect of 4.3%, in part due to the good performance of
AZ Electronic Materials, a company we acquired in 2014. The
strengthening of the U.S. dollar and major Asian currencies
against the euro in 2015 contributed significantly to the strong
positive currency effect of 6.2% on net sales.
Our Healthcare business sector generated slight organic
sales growth of 1.6% in 2015, thus slightly exceeding the
guidance provided in the Annual Report for 2014. In addition
to the performance of Rebif
®
in North America, which exceeded
our expectations, this was due to the organic increase in sales
of our products to treat diabetes (Glucophage
®
), cardiovascu-
lar diseases (Concor
®
), infertility (Gonal-f
®
), and thyroid dis-
orders (Euthyrox
®
), as well as Neurobion
®
, a brand marketed
by the Consumer Health business.
For the Life Science business sector, we forecast a moderate
organic increase in sales in the Annual Report for 2014. Posting
strong organic sales growth of 6.5% in 2015, the Life Science
business sector exceeded this forecast. Process Solutions
made a significant contribution to this development with
organic sales growth of 11.6%. In addition, the Life Science
business sector saw a portfolio effect of 10.2% due to the
acquisition of Sigma-Aldrich.
For the Performance Materials business sector, we pre-
dicted slight organic sales growth, supplemented by a strong
portfolio effect. At 0.6%, the actual organic growth was only
slightly below this forecast. Special mention should be made
of the dynamic development of the
OLED
materials business,
as well as the energy-saving
UB
-
FFS
technology from the Display
Materials business unit. However, the mature LC technology
TN
-
TFT
suffered from an accelerated decline in volumes. The
portfolio effect of the revenues from acquired businesses was
10.4%.
EBITDA
pre exceptionals
In 2015, excluding the acquisition of Sigma-Aldrich,
EBITDA
pre exceptionals of the Merck Group saw a solid increase over
the previous year, thus exceeding the forecast we gave in the
Annual Report for 2014. In addition, apart from operating per-
formance, positive foreign exchange effects of the U.S. dollar
and major Asian currencies contributed to this development.
Including Sigma-Aldrich, we generated a strong
EBITDA
pre
exceptionals increase of 7.1% to € 3,630 million for the Merck
Group in 2015.
Review of Forecast against Actual Business Developments
Report on Economic Position
Combined Management Report
89
For the Healthcare business sector, we predicted a slight
decline in
EBITDA
pre exceptionals in the Annual Report for
2014. The good development of organic sales helped us to
exceed this forecast, achieving the year-earlier level with
EBITDA
pre exceptionals of € 2,002 million.
In the Annual Report for 2014, we predicted a moderate
increase for the Life Science business sector. Excluding Sigma-
Aldrich,
EBITDA
pre exceptionals of the Life Science business
sector saw a low double-digit increase, thus exceeding our
guidance provided in the Annual Report for 2014. In addition
to positive exchange rate effects, this development was also
attributable to a favorable product mix.
We forecast a low double-digit increase in
EBITDA
pre
exceptionals for the Performance Materials business sector in
2015. With medium double-digit growth (excluding Sigma-
Aldrich), we significantly exceeded this forecast. Both good
operating business performance and positive exchange rate
effects were responsible for this development.
For
EBITDA
pre exceptionals of Corporate and Other, we
expected a low double-digit percentage decline. Owing to
expenses for currency hedging transactions as a result of the
global exchange rate movements against the euro and the
intensification of future-oriented Group initiatives (e.g. new
branding), the Corporate and Other expense of
EBITDA
pre
exceptionals more than doubled overall. Consequently, we did
not meet our forecast.
Business free cash flow
For 2015, we had forecast a slight improvement in business
free cash flow of the Merck Group. Excluding the contribution
from Sigma-Aldrich, we can confirm this forecast. While busi-
ness free cash flows of the Life Science and Performance
Materials business sectors showed a sharp increase over 2014,
both the Healthcare business sector and Corporate and Other
saw a decline. The decrease in Healthcare is attributable to
higher investments and the high amount of capital tied up in
receivables. In Corporate and Other, expenses for the
ONE
Global Headquarters and strategic Group initiatives in particu-
lar led to a decrease in business free cash flow. Including
Sigma-Aldrich, our Group business free cash flow increased
sharply by 6.2%.
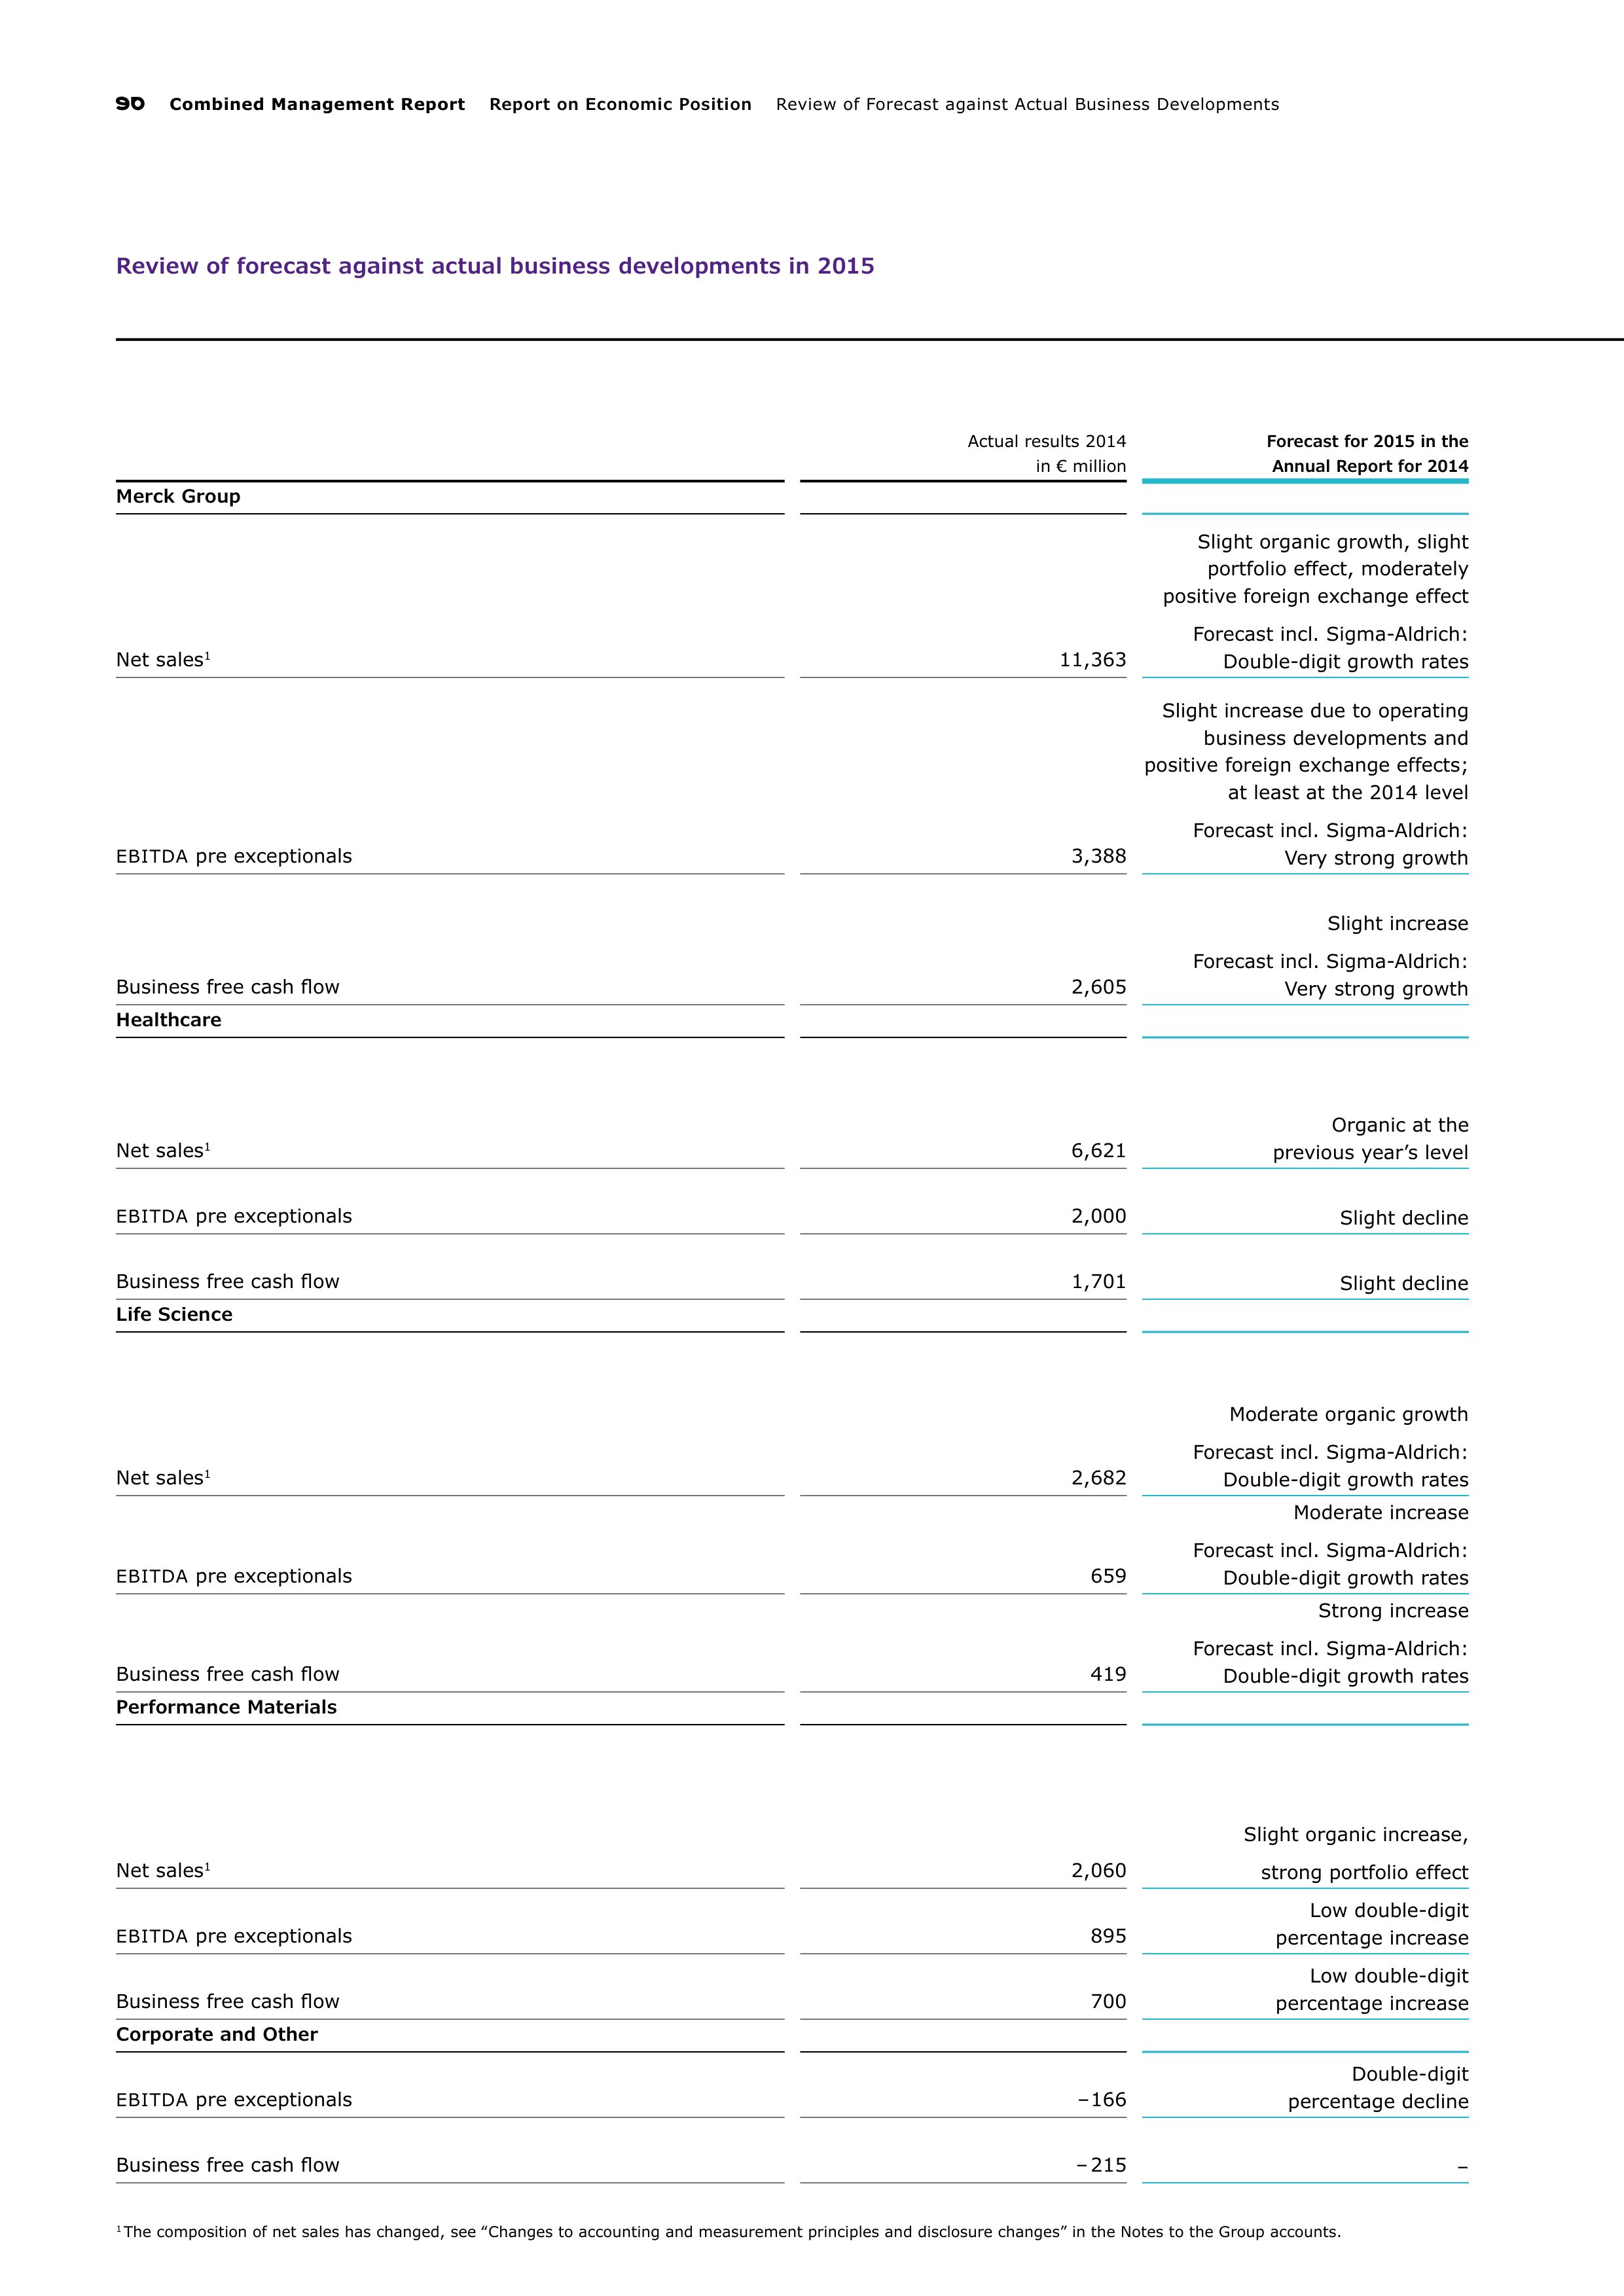
90
Combined Management Report
Report on Economic Position
Review of Forecast against Actual Business Developments
Review of forecast against actual business developments in 2015
Actual results 2014
in € million
Forecast for 2015 in the
Annual Report for 2014
Merck Group
Net sales
1
11,363
Slight organic growth, slight
portfolio effect, moderately
positive foreign exchange effect
Forecast incl. Sigma-Aldrich:
Double-digit growth rates
EBITDA
pre exceptionals
3,388
Slight increase due to operating
business developments and
positive foreign exchange effects;
at least at the 2014 level
Forecast incl. Sigma-Aldrich:
Very strong growth
Business free cash flow
2,605
Slight increase
Forecast incl. Sigma-Aldrich:
Very strong growth
Healthcare
Net sales
1
6,621
Organic at the
previous year’s level
EBITDA
pre exceptionals
2,000
Slight decline
Business free cash flow
1,701
Slight decline
Life Science
Net sales
1
2,682
Moderate organic growth
Forecast incl. Sigma-Aldrich:
Double-digit growth rates
EBITDA
pre exceptionals
659
Moderate increase
Forecast incl. Sigma-Aldrich:
Double-digit growth rates
Business free cash flow
419
Strong increase
Forecast incl. Sigma-Aldrich:
Double-digit growth rates
Performance Materials
Net sales
1
2,060
Slight organic increase,
strong portfolio effect
EBITDA
pre exceptionals
895
Low double-digit
percentage increase
Business free cash flow
700
Low double-digit
percentage increase
Corporate and Other
EBITDA
pre exceptionals
– 166
Double-digit
percentage decline
Business free cash flow
– 215
–
1
The composition of net sales has changed, see ‟Changes to accounting and measurement principles and disclosure changes” in the Notes to the Group accounts.
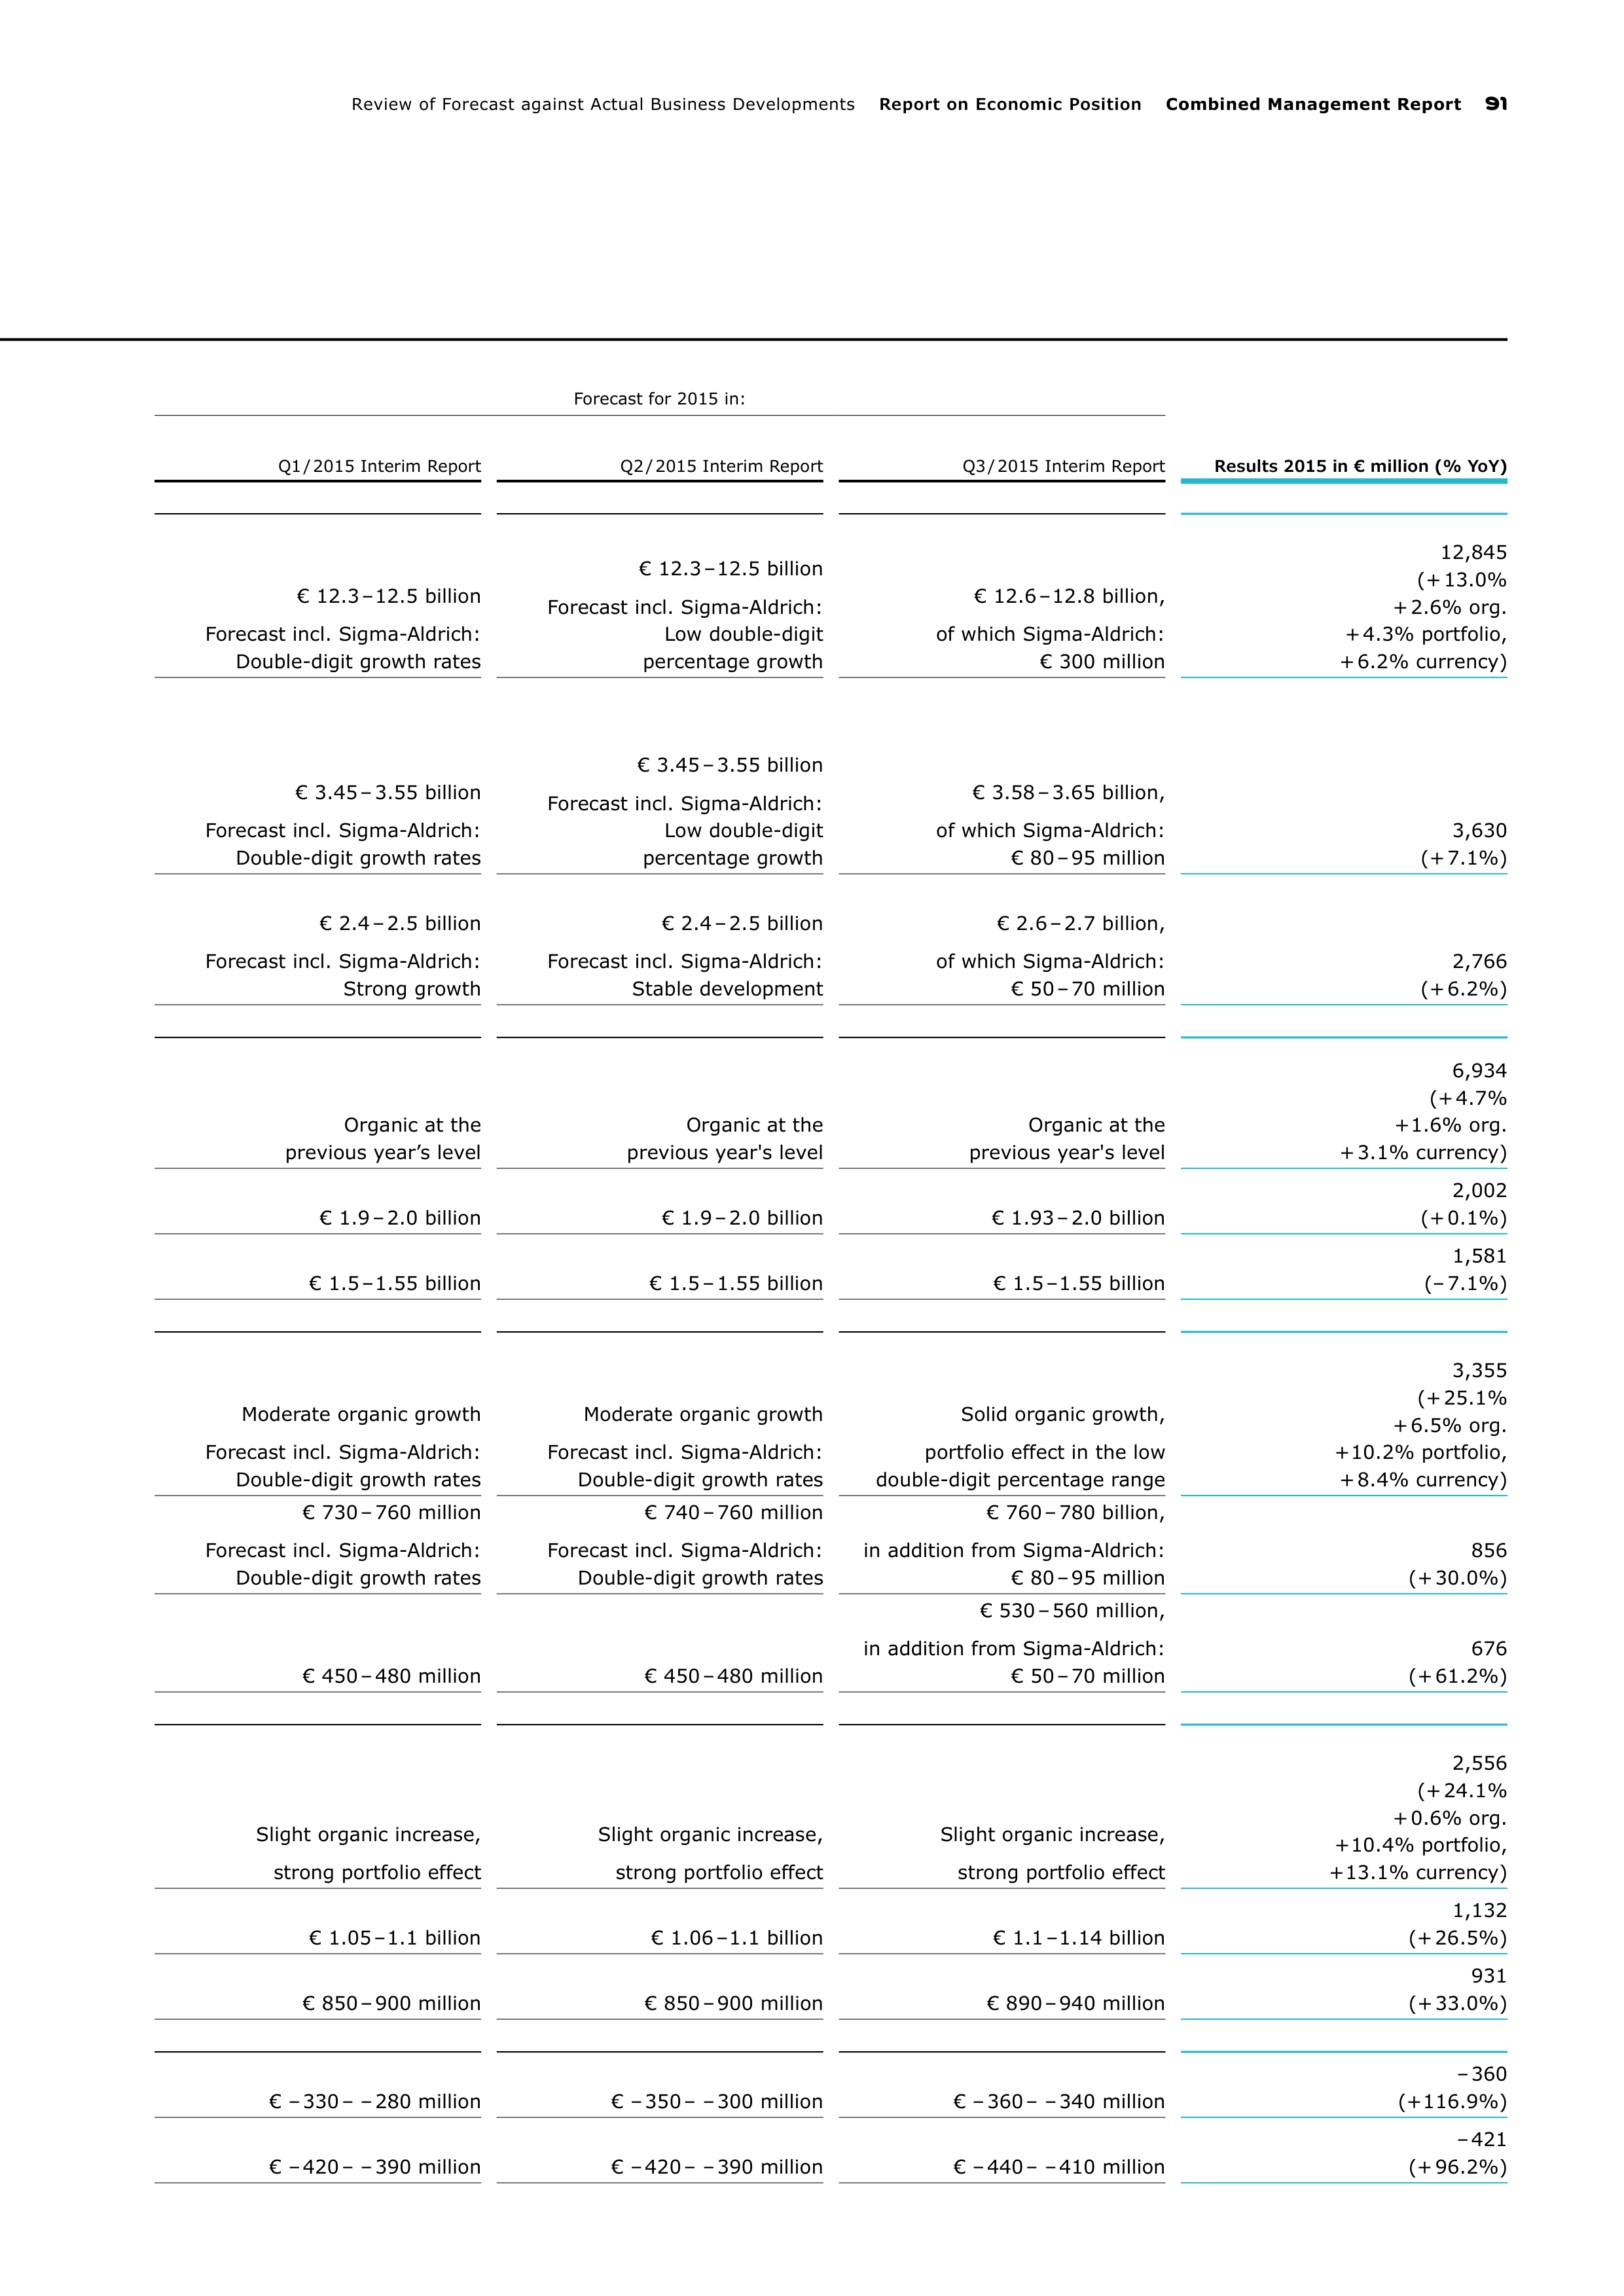
Review of Forecast against Actual Business Developments
Report on Economic Position
Combined Management Report
91
Forecast for 2015 in:
Q1 / 2015 Interim Report
Q2 / 2015 Interim Report
Q3 / 2015 Interim Report
Results 2015 in € million (% YoY)
€ 12.3 – 12.5 billion
Forecast incl. Sigma-Aldrich:
Double-digit growth rates
€ 12.3 – 12.5 billion
Forecast incl. Sigma-Aldrich:
Low double-digit
percentage growth
€ 12.6 – 12.8 billion,
of which Sigma-Aldrich:
€ 300 million
12,845
(+ 13.0%
+ 2.6% org.
+ 4.3% portfolio,
+ 6.2% currency)
€ 3.45 – 3.55 billion
Forecast incl. Sigma-Aldrich:
Double-digit growth rates
€ 3.45 – 3.55 billion
Forecast incl. Sigma-Aldrich:
Low double-digit
percentage growth
€ 3.58 – 3.65 billion,
of which Sigma-Aldrich:
€ 80 – 95 million
3,630
(+ 7.1%)
€ 2.4 – 2.5 billion
Forecast incl. Sigma-Aldrich:
Strong growth
€ 2.4 – 2.5 billion
Forecast incl. Sigma-Aldrich:
Stable development
€ 2.6 – 2.7 billion,
of which Sigma-Aldrich:
€ 50 – 70 million
2,766
(+ 6.2%)
Organic at the
previous year’s level
Organic at the
previous year's level
Organic at the
previous year's level
6,934
(+ 4.7%
+ 1.6% org.
+ 3.1% currency)
€ 1.9 – 2.0 billion
€ 1.9 – 2.0 billion
€ 1.93 – 2.0 billion
2,002
(+ 0.1%)
€ 1.5 – 1.55 billion
€ 1.5 – 1.55 billion
€ 1.5 – 1.55 billion
1,581
(– 7.1%)
Moderate organic growth
Forecast incl. Sigma-Aldrich:
Double-digit growth rates
Moderate organic growth
Forecast incl. Sigma-Aldrich:
Double-digit growth rates
Solid organic growth,
portfolio effect in the low
double-digit percentage range
3,355
(+ 25.1%
+ 6.5% org.
+ 10.2% portfolio,
+ 8.4% currency)
€ 730 – 760 million
Forecast incl. Sigma-Aldrich:
Double-digit growth rates
€ 740 – 760 million
Forecast incl. Sigma-Aldrich:
Double-digit growth rates
€ 760 – 780 billion,
in addition from Sigma-Aldrich:
€ 80 – 95 million
856
(+ 30.0%)
€ 450 – 480 million
€ 450 – 480 million
€ 530 – 560 million,
in addition from Sigma-Aldrich:
€ 50 – 70 million
676
(+ 61.2%)
Slight organic increase,
strong portfolio effect
Slight organic increase,
strong portfolio effect
Slight organic increase,
strong portfolio effect
2,556
(+ 24.1%
+ 0.6% org.
+ 10.4% portfolio,
+ 13.1% currency)
€ 1.05 – 1.1 billion
€ 1.06 – 1.1 billion
€ 1.1 – 1.14 billion
1,132
(+ 26.5%)
€ 850 – 900 million
€ 850 – 900 million
€ 890 – 940 million
931
(+ 33.0%)
€ – 330 – – 280 million
€ – 350 – – 300 million
€ – 360 – – 340 million
– 360
(+ 116.9%)
€ – 420 – – 390 million
€ – 420 – – 390 million
€ – 440 – – 410 million
– 421
(+ 96.2%)
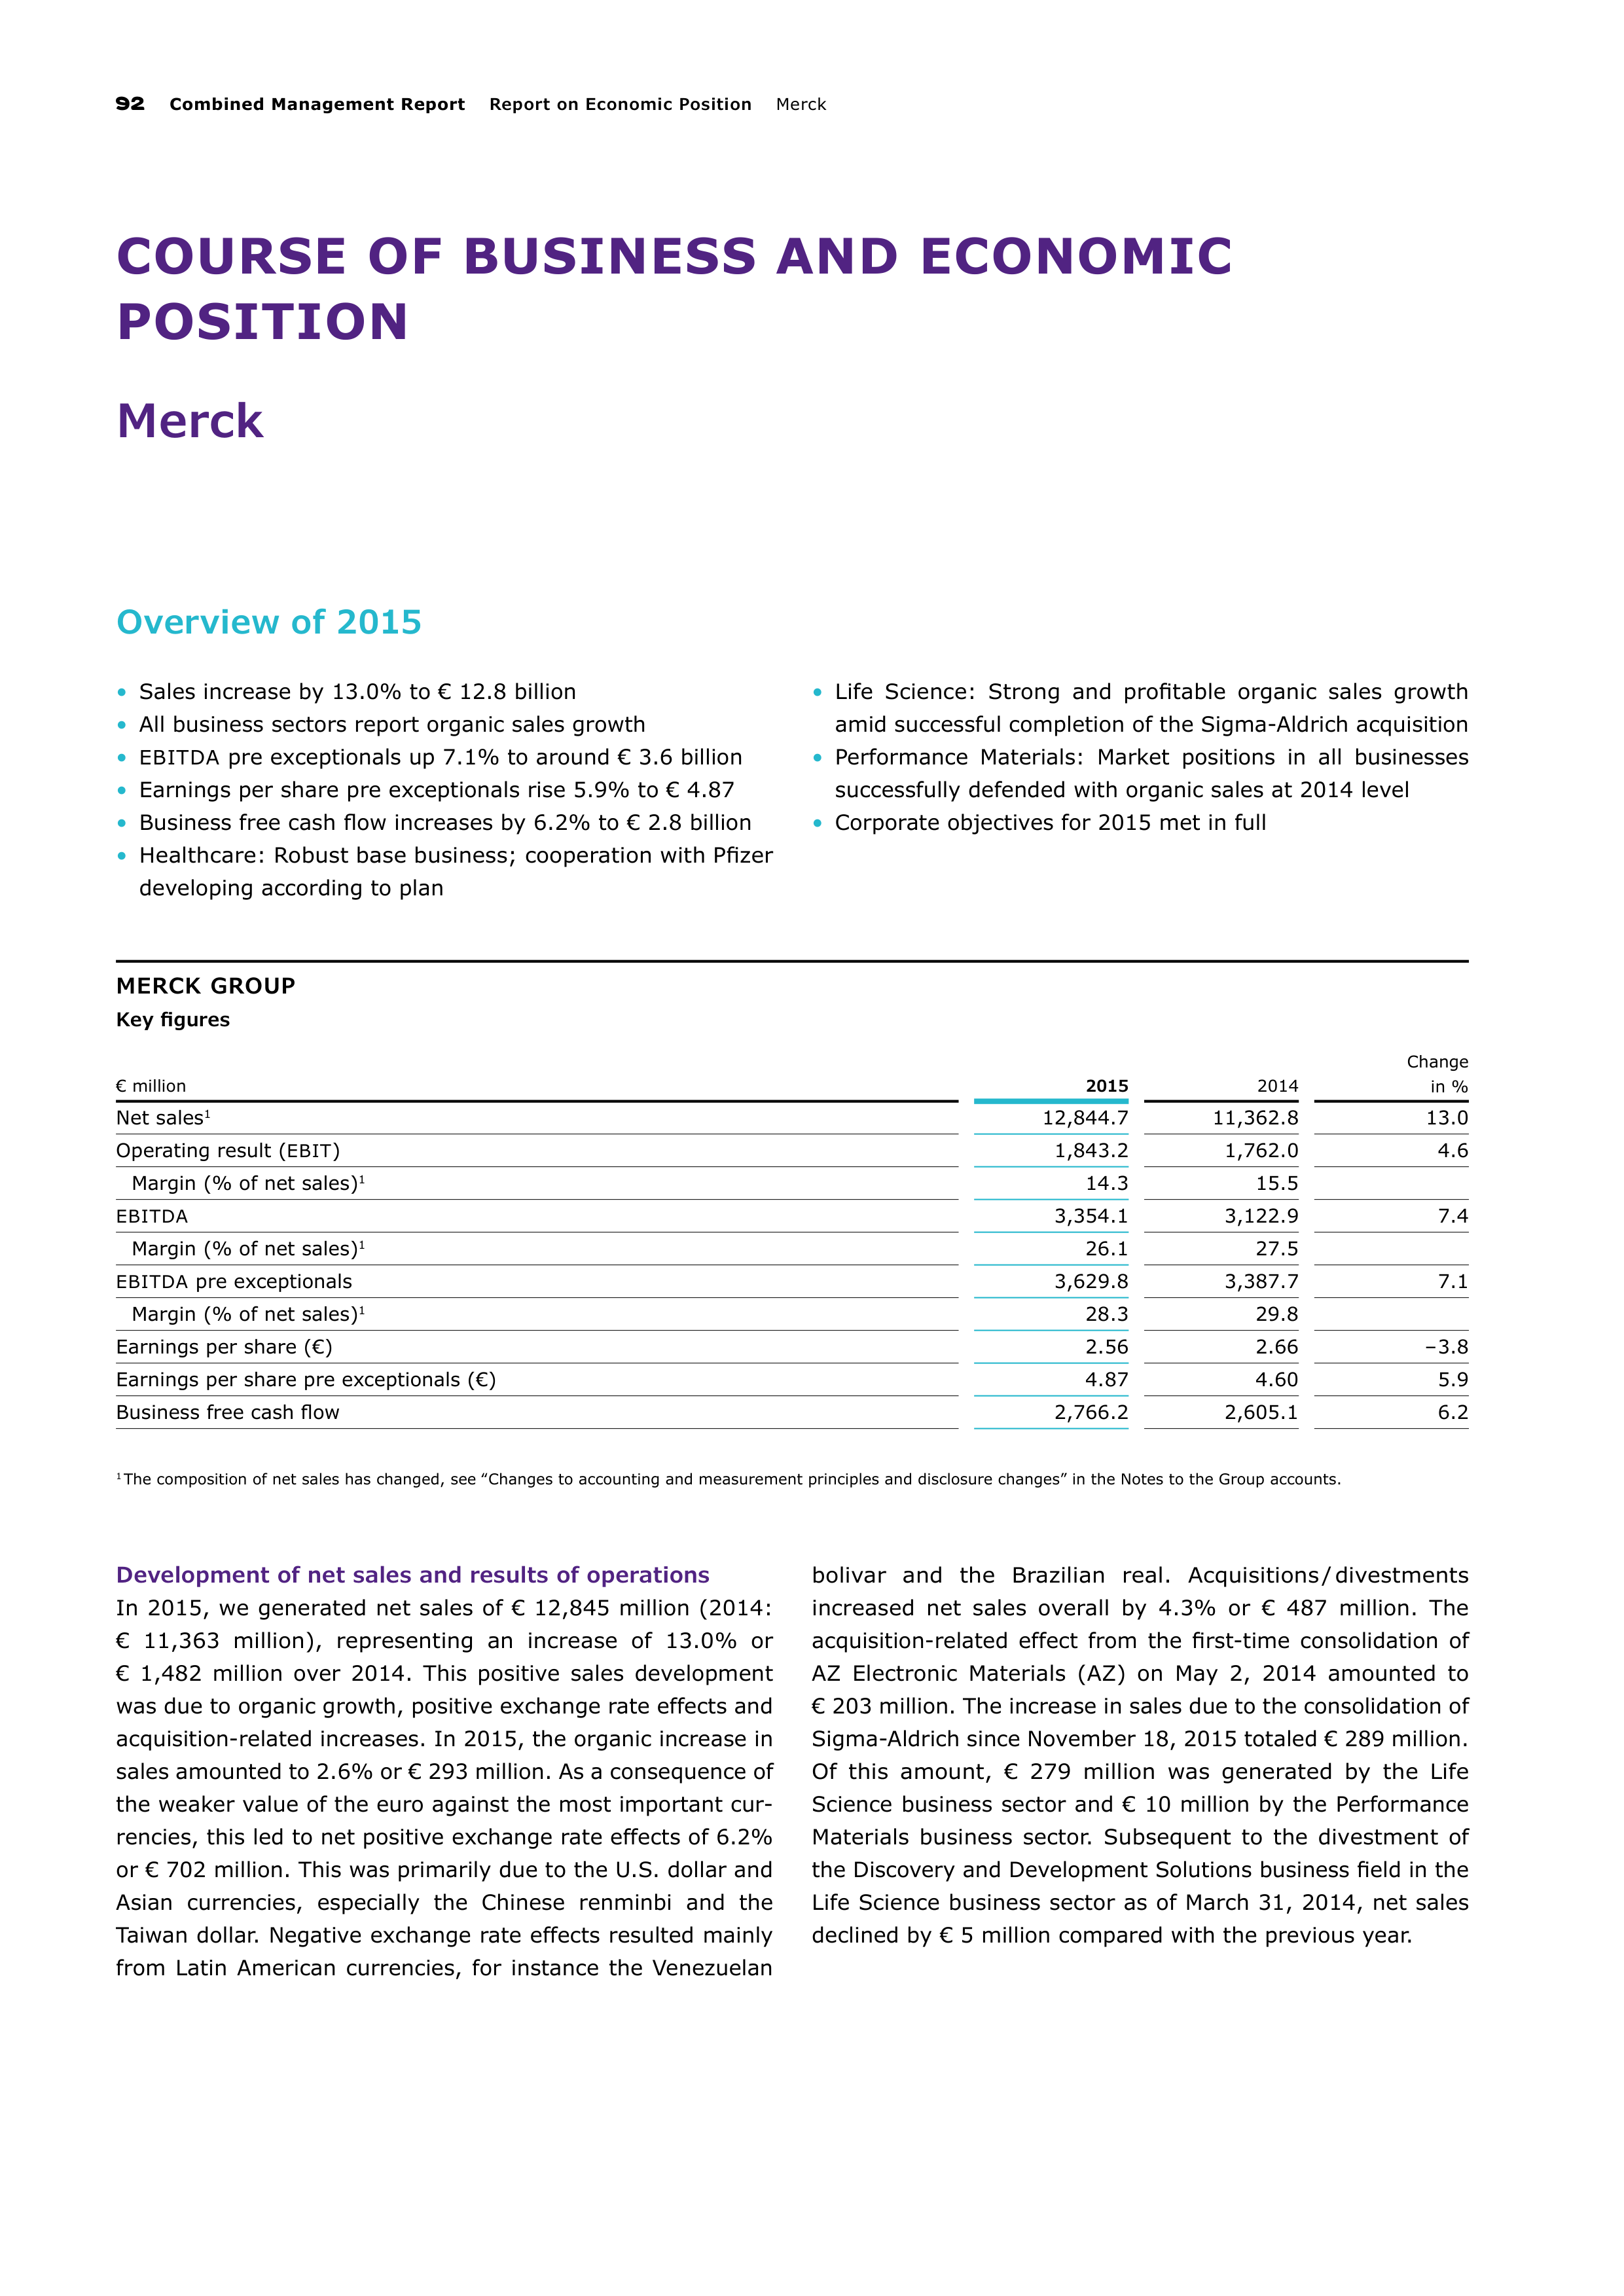
92
Combined Management Report
Report on Economic Position
Merc
COURSE OF BUSINESS AND ECONOMIC
POSITION
Merck
Overview of 2015
•
Sales increase by 13.0% to € 12.8 billion
•
All business sectors report organic sales growth
•
EBITDA
pre exceptionals up 7.1% to around € 3.6 billion
•
Earnings per share pre exceptionals rise 5.9% to € 4.87
•
Business free cash flow increases by 6.2% to € 2.8 billion
•
Healthcare: Robust base business; cooperation with Pfizer
developing according to plan
•
Life Science: Strong and profitable organic sales growth
amid successful completion of the Sigma-Aldrich acquisition
•
Performance Materials: Market positions in all businesses
successfully defended with organic sales at 2014 level
•
Corporate objectives for 2015 met in full
MERCK GROUP
Key figures
€ million
2015
2014
Change
in %
Net sales
1
12,844.7
11,362.8
13.0
Operating result (
EBIT
)
1,843.2
1,762.0
4.6
Margin (% of net sales)
1
14.3
15.5
EBITDA
3,354.1
3,122.9
7.4
Margin (% of net sales)
1
26.1
27.5
EBITDA
pre exceptionals
3,629.8
3,387.7
7.1
Margin (% of net sales)
1
28.3
29.8
Earnings per share (€)
2.56
2.66
– 3.8
Earnings per share pre exceptionals (€)
4.87
4.60
5.9
Business free cash flow
2,766.2
2,605.1
6.2
1
The composition of net sales has changed, see ‟Changes to accounting and measurement principles and disclosure changes” in the Notes to the Group accounts.
Development of net sales and results of operations
In 2015, we generated net sales of € 12,845 million (2014:
€ 11,363 million), representing an increase of 13.0% or
€ 1,482 million over 2014. This positive sales development
was due to organic growth, positive exchange rate effects and
acquisition-related increases. In 2015, the organic increase in
sales amounted to 2.6% or € 293 million. As a consequence of
the weaker value of the euro against the most important cur-
rencies, this led to net positive exchange rate effects of 6.2%
or € 702 million. This was primarily due to the U.S. dollar and
Asian currencies, especially the Chinese renminbi and the
Taiwan dollar. Negative exchange rate effects resulted mainly
from Latin American currencies, for instance the Venezuelan
bolivar and the Brazilian real. Acquisitions / divestments
increased net sales overall by 4.3% or € 487 million. The
acquisition-related effect from the first-time consolidation of
AZ Electronic Materials (AZ) on May 2, 2014 amounted to
€ 203 million. The increase in sales due to the consolidation of
Sigma-Aldrich since November 18, 2015 totaled € 289 million.
Of this amount, € 279 million was generated by the Life
Science business sector and € 10 million by the Performance
Materials business sector. Subsequent to the divestment of
the Discovery and Development Solutions business field in the
Life Science business sector as of March 31, 2014, net sales
declined by € 5 million compared with the previous year.
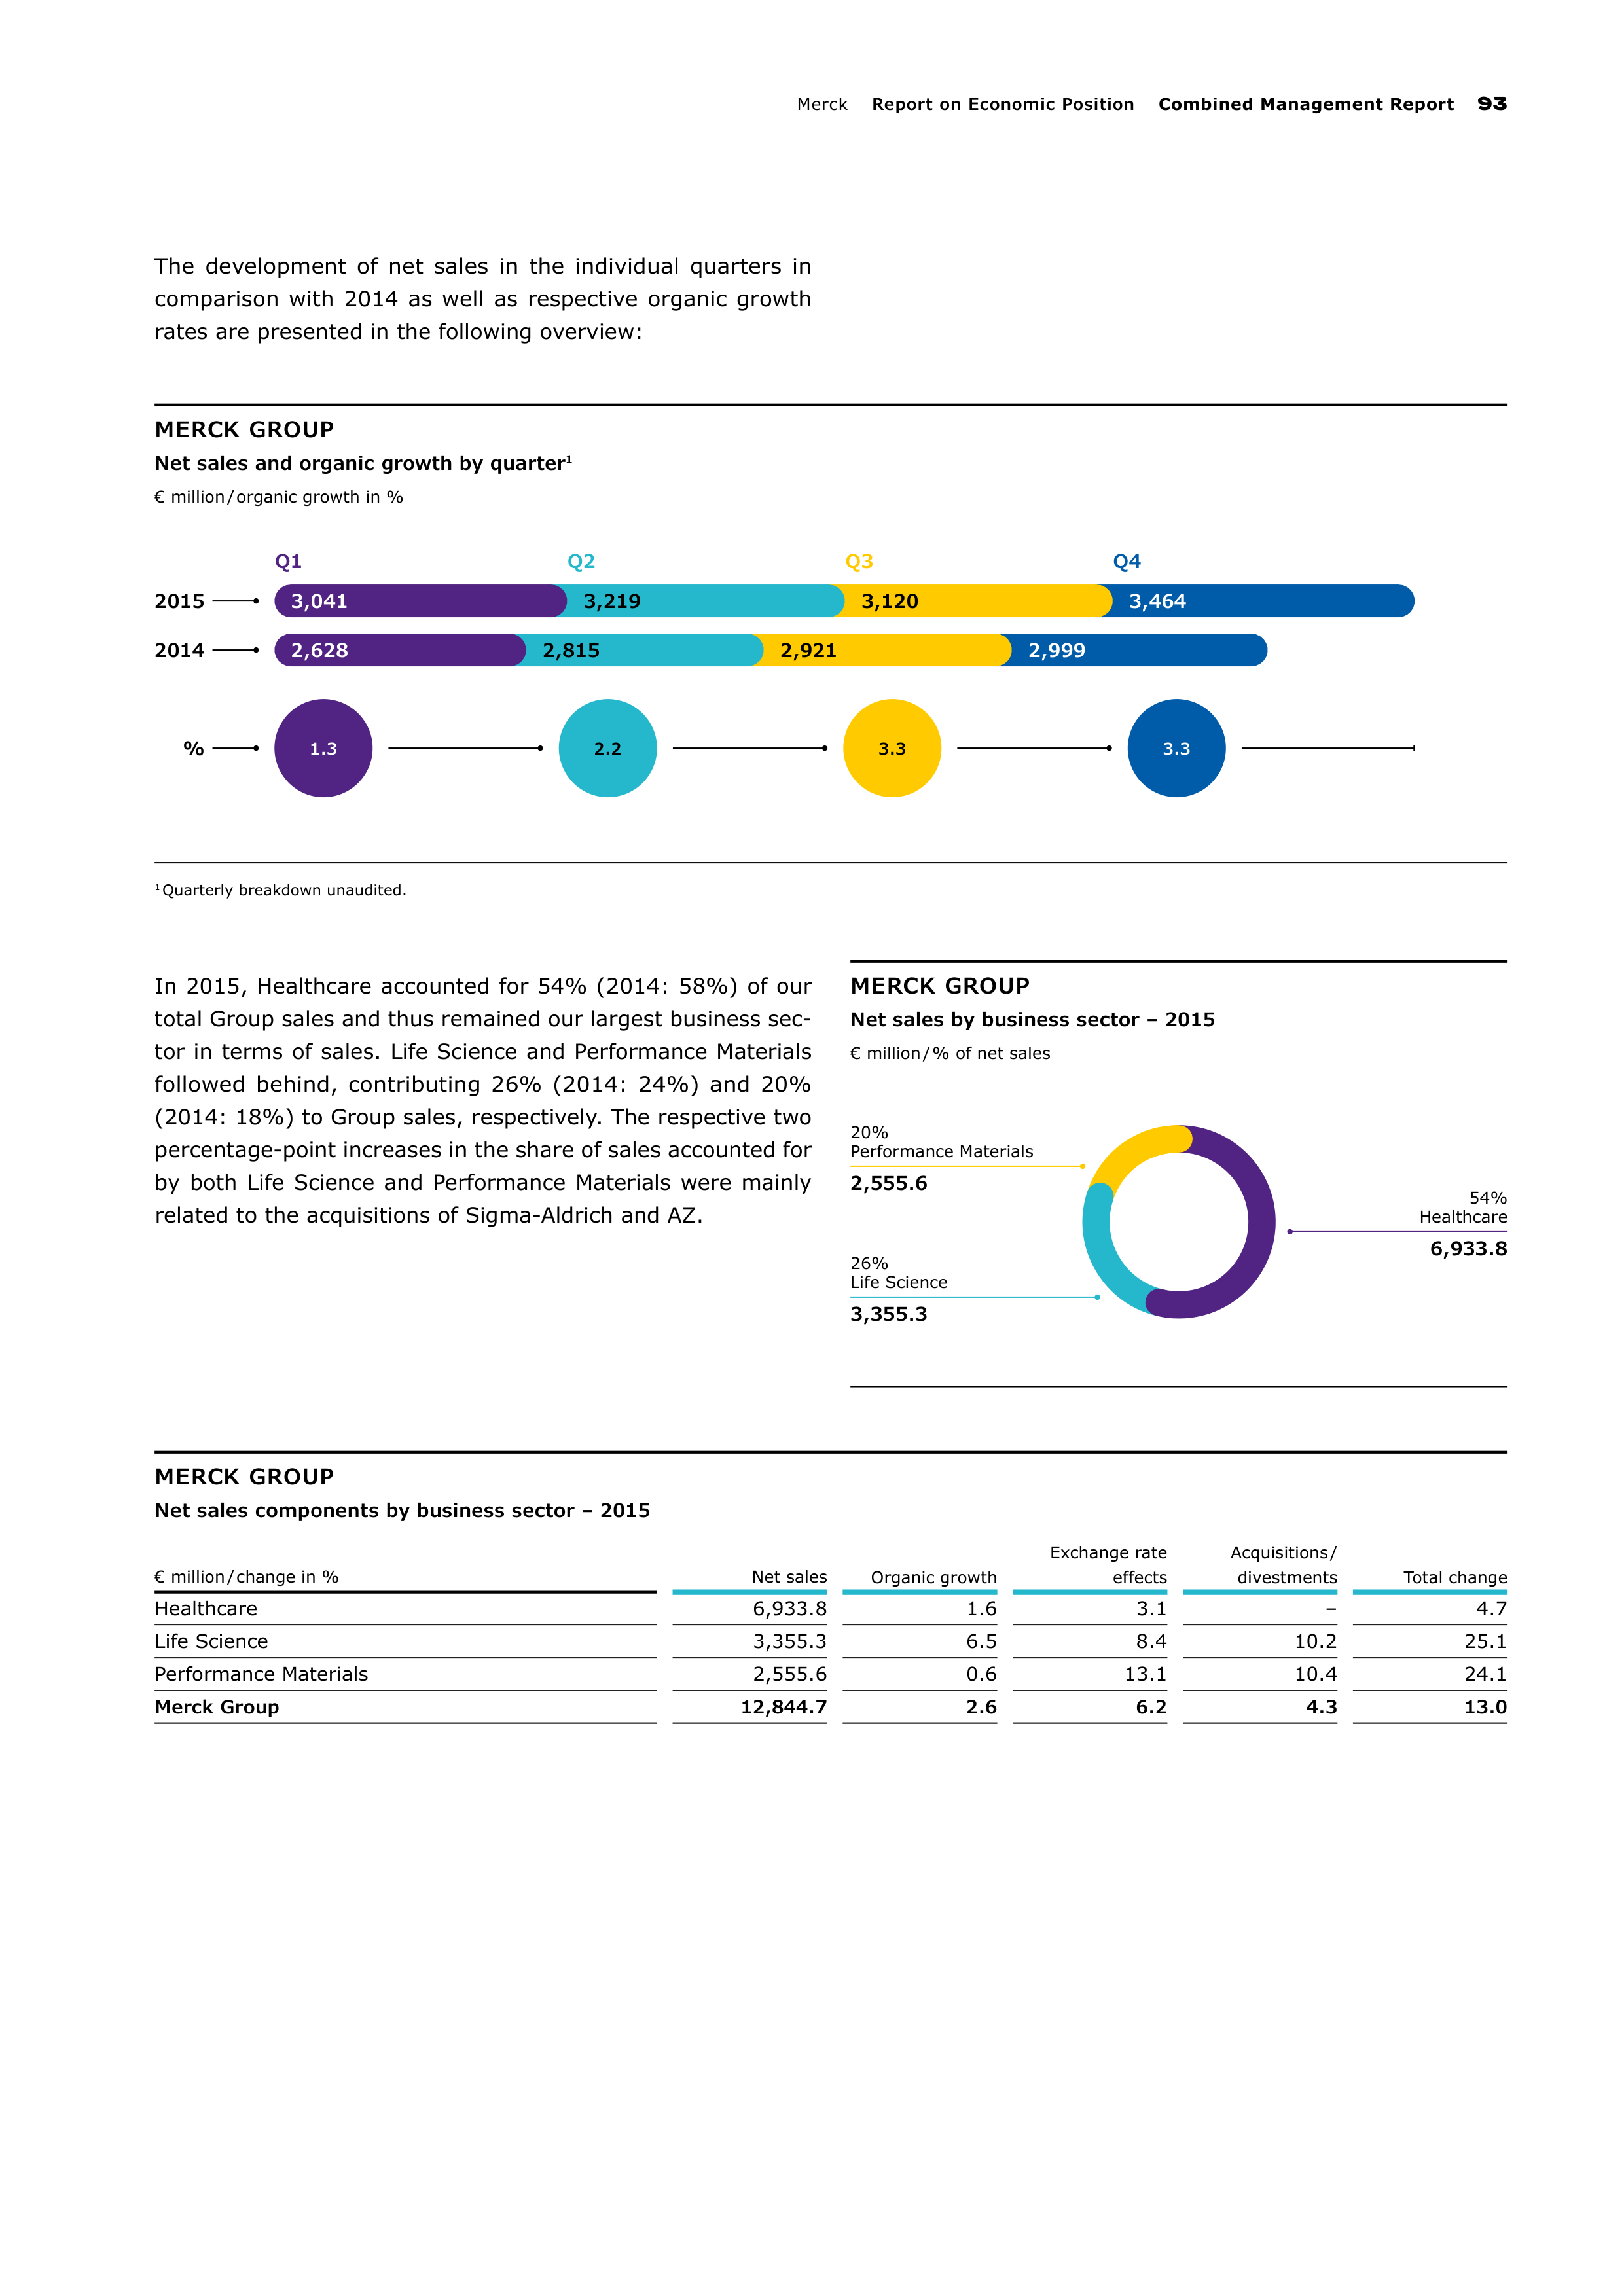
Merc
Report on Economic Position
Combined Management Report
93
MERCK GROUP
Net sales and organic growth by quarter
1
€ million / organic growth in %
1
Quarterly breakdown unaudited.
Q1
2015
2014
3,041
3,219
3,120
3,464
2,628
2,815
2,921
2,999
Q2
Q3
Q4
%
1.3
2.2
3.3
3.3
MERCK GROUP
Net sales by business sector – 2015
€ million / % of net sales
54%
Healthcare
6,933.8
20%
Performance Materials
2,555.6
26%
Life Science
3,355.3
The development of net sales in the individual quarters in
comparison with 2014 as well as respective organic growth
rates are presented in the following overview:
In 2015, Healthcare accounted for 54% (2014: 58%) of our
total Group sales and thus remained our largest business sec-
tor in terms of sales. Life Science and Performance Materials
followed behind, contributing 26% (2014: 24%) and 20%
(2014: 18%) to Group sales, respectively. The respective two
percentage-point increases in the share of sales accounted for
by both Life Science and Performance Materials were mainly
related to the acquisitions of Sigma-Aldrich and AZ.
MERCK GROUP
Net sales components by business sector – 2015
€ million / change in %
Net sales
Organic growth
Exchange rate
effects
Acquisitions /
divestments
Total change
Healthcare
6,933.8
1.6
3.1
–
4.7
Life Science
3,355.3
6.5
8.4
10.2
25.1
Performance Materials
2,555.6
0.6
13.1
10.4
24.1
Merck Group
12,844.7
2.6
6.2
4.3
13.0
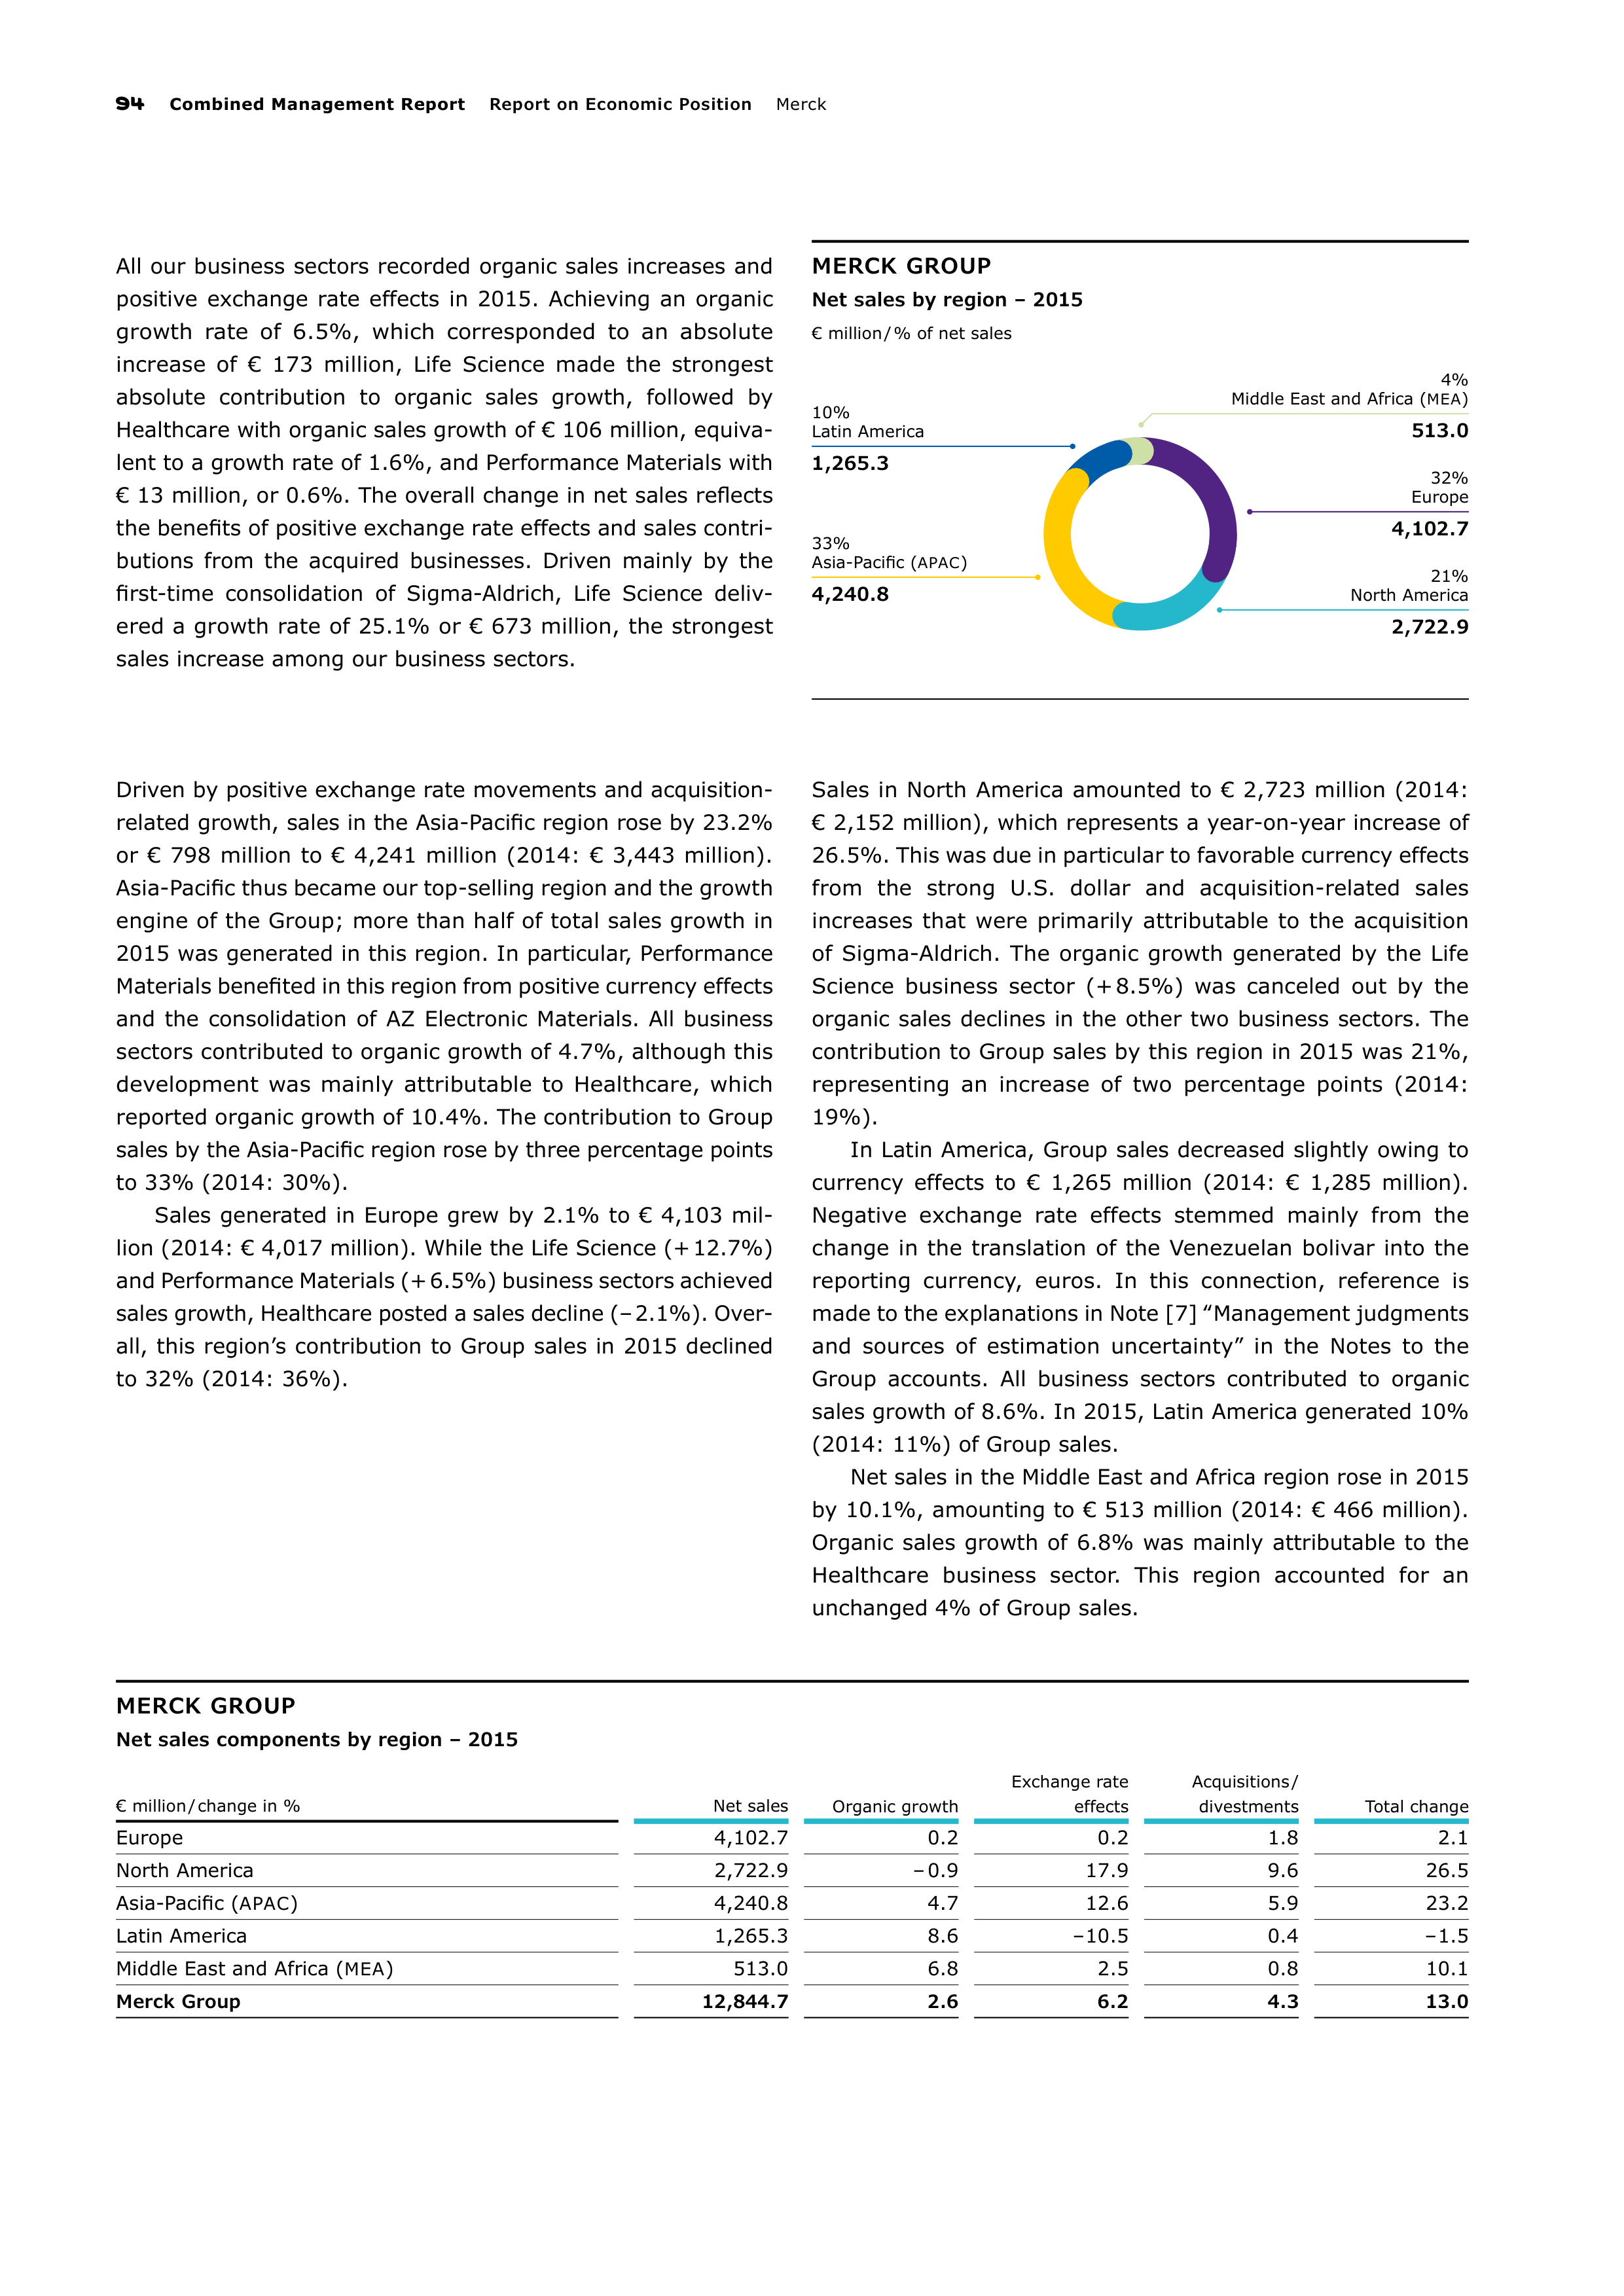
94
Combined Management Report
Report on Economic Position
Merc
MERCK GROUP
Net sales by region – 2015
€ million / % of net sales
32%
Europe
4,102.7
33%
Asia-Pacific (
APAC
)
4,240.8
21%
North America
2,722.9
10%
Latin America
1,265.3
4%
Middle East and Africa (
MEA
)
513.0
All our business sectors recorded organic sales increases and
positive exchange rate effects in 2015. Achieving an organic
growth rate of 6.5%, which corresponded to an absolute
increase of € 173 million, Life Science made the strongest
absolute contribution to organic sales growth, followed by
Healthcare with organic sales growth of € 106 million, equiva-
lent to a growth rate of 1.6%, and Performance Materials with
€ 13 million, or 0.6%. The overall change in net sales reflects
the benefits of positive exchange rate effects and sales contri-
butions from the acquired businesses. Driven mainly by the
first-time consolidation of Sigma-Aldrich, Life Science deliv-
ered a growth rate of 25.1% or € 673 million, the strongest
sales increase among our business sectors.
Driven by positive exchange rate movements and acquisition-
related growth, sales in the Asia-Pacific region rose by 23.2%
or € 798 million to € 4,241 million (2014: € 3,443 million).
Asia-Pacific thus became our top-selling region and the growth
engine of the Group; more than half of total sales growth in
2015 was generated in this region. In particular, Performance
Materials benefited in this region from positive currency effects
and the consolidation of AZ Electronic Materi
als. All business
sectors contributed to organic growth of 4.7%, although this
development was mainly attributable to Healthcare, which
reported organic growth of 10.4%. The contribution to Group
sales by the Asia-Pacific region rose by three percentage points
to 33% (2014: 30%).
Sales generated in Europe grew by 2.1% to € 4,103 mil-
lion (2014: € 4,017 million). While the Life Science (+ 12.7%)
and Performance Materials (+ 6.5%) business sectors achieved
sales growth, Healthcare posted a sales decline (– 2.1%). Over-
all, this region’s contribution to Group sales in 2015 declined
to 32% (2014: 36%).
Sales in North America amounted to € 2,723 million (2014:
€ 2,152 million), which represents a year-on-year increase of
26.5%. This was due in particular to favorable currency effects
from the strong U.S.
dollar and acquisition-related sales
increases that were primarily attributable to the acquisition
of Sigma-Aldrich. The organic growth generated by the Life
Science business sector (+ 8.5%) was canceled out by the
organic sales declines in the other two business sectors. The
contribution to Group sales by this region in 2015 was 21%,
representing an increase of two percentage points (2014:
19%).
In Latin America, Group sales decreased slightly owing to
currency effects to € 1,265 million (2014: € 1,285 million).
Negative exchange rate effects stemmed mainly from the
change in the translation of the Venezuelan bolivar into the
reporting currency, euros. In this connection, reference is
made to the explanations in Note [7] ‟Management judgments
and sources of estimation uncertainty” in the Notes to the
Group accounts. All business sectors contributed to organic
sales growth of 8.6%. In 2015, Latin America generated 10%
(2014: 11%) of Group sales.
Net sales in the Middle East and Africa region rose in 2015
by 10.1%, amounting to € 513 million (2014: € 466 million).
Organic sales growth of 6.8% was mainly attributable to the
Healthcare business sector. This region accounted for an
unchanged 4% of Group sales.
MERCK GROUP
Net sales components by region – 2015
€ million / change in %
Net sales
Organic growth
Exchange rate
effects
Acquisitions /
divestments
Total change
Europe
4,102.7
0.2
0.2
1.8
2.1
North America
2,722.9
– 0.9
17.9
9.6
26.5
Asia-Pacific (
APAC
)
4,240.8
4.7
12.6
5.9
23.2
Latin America
1,265.3
8.6
– 10.5
0.4
– 1.5
Middle East and Africa (
MEA
)
513.0
6.8
2.5
0.8
10.1
Merck Group
12,844.7
2.6
6.2
4.3
13.0
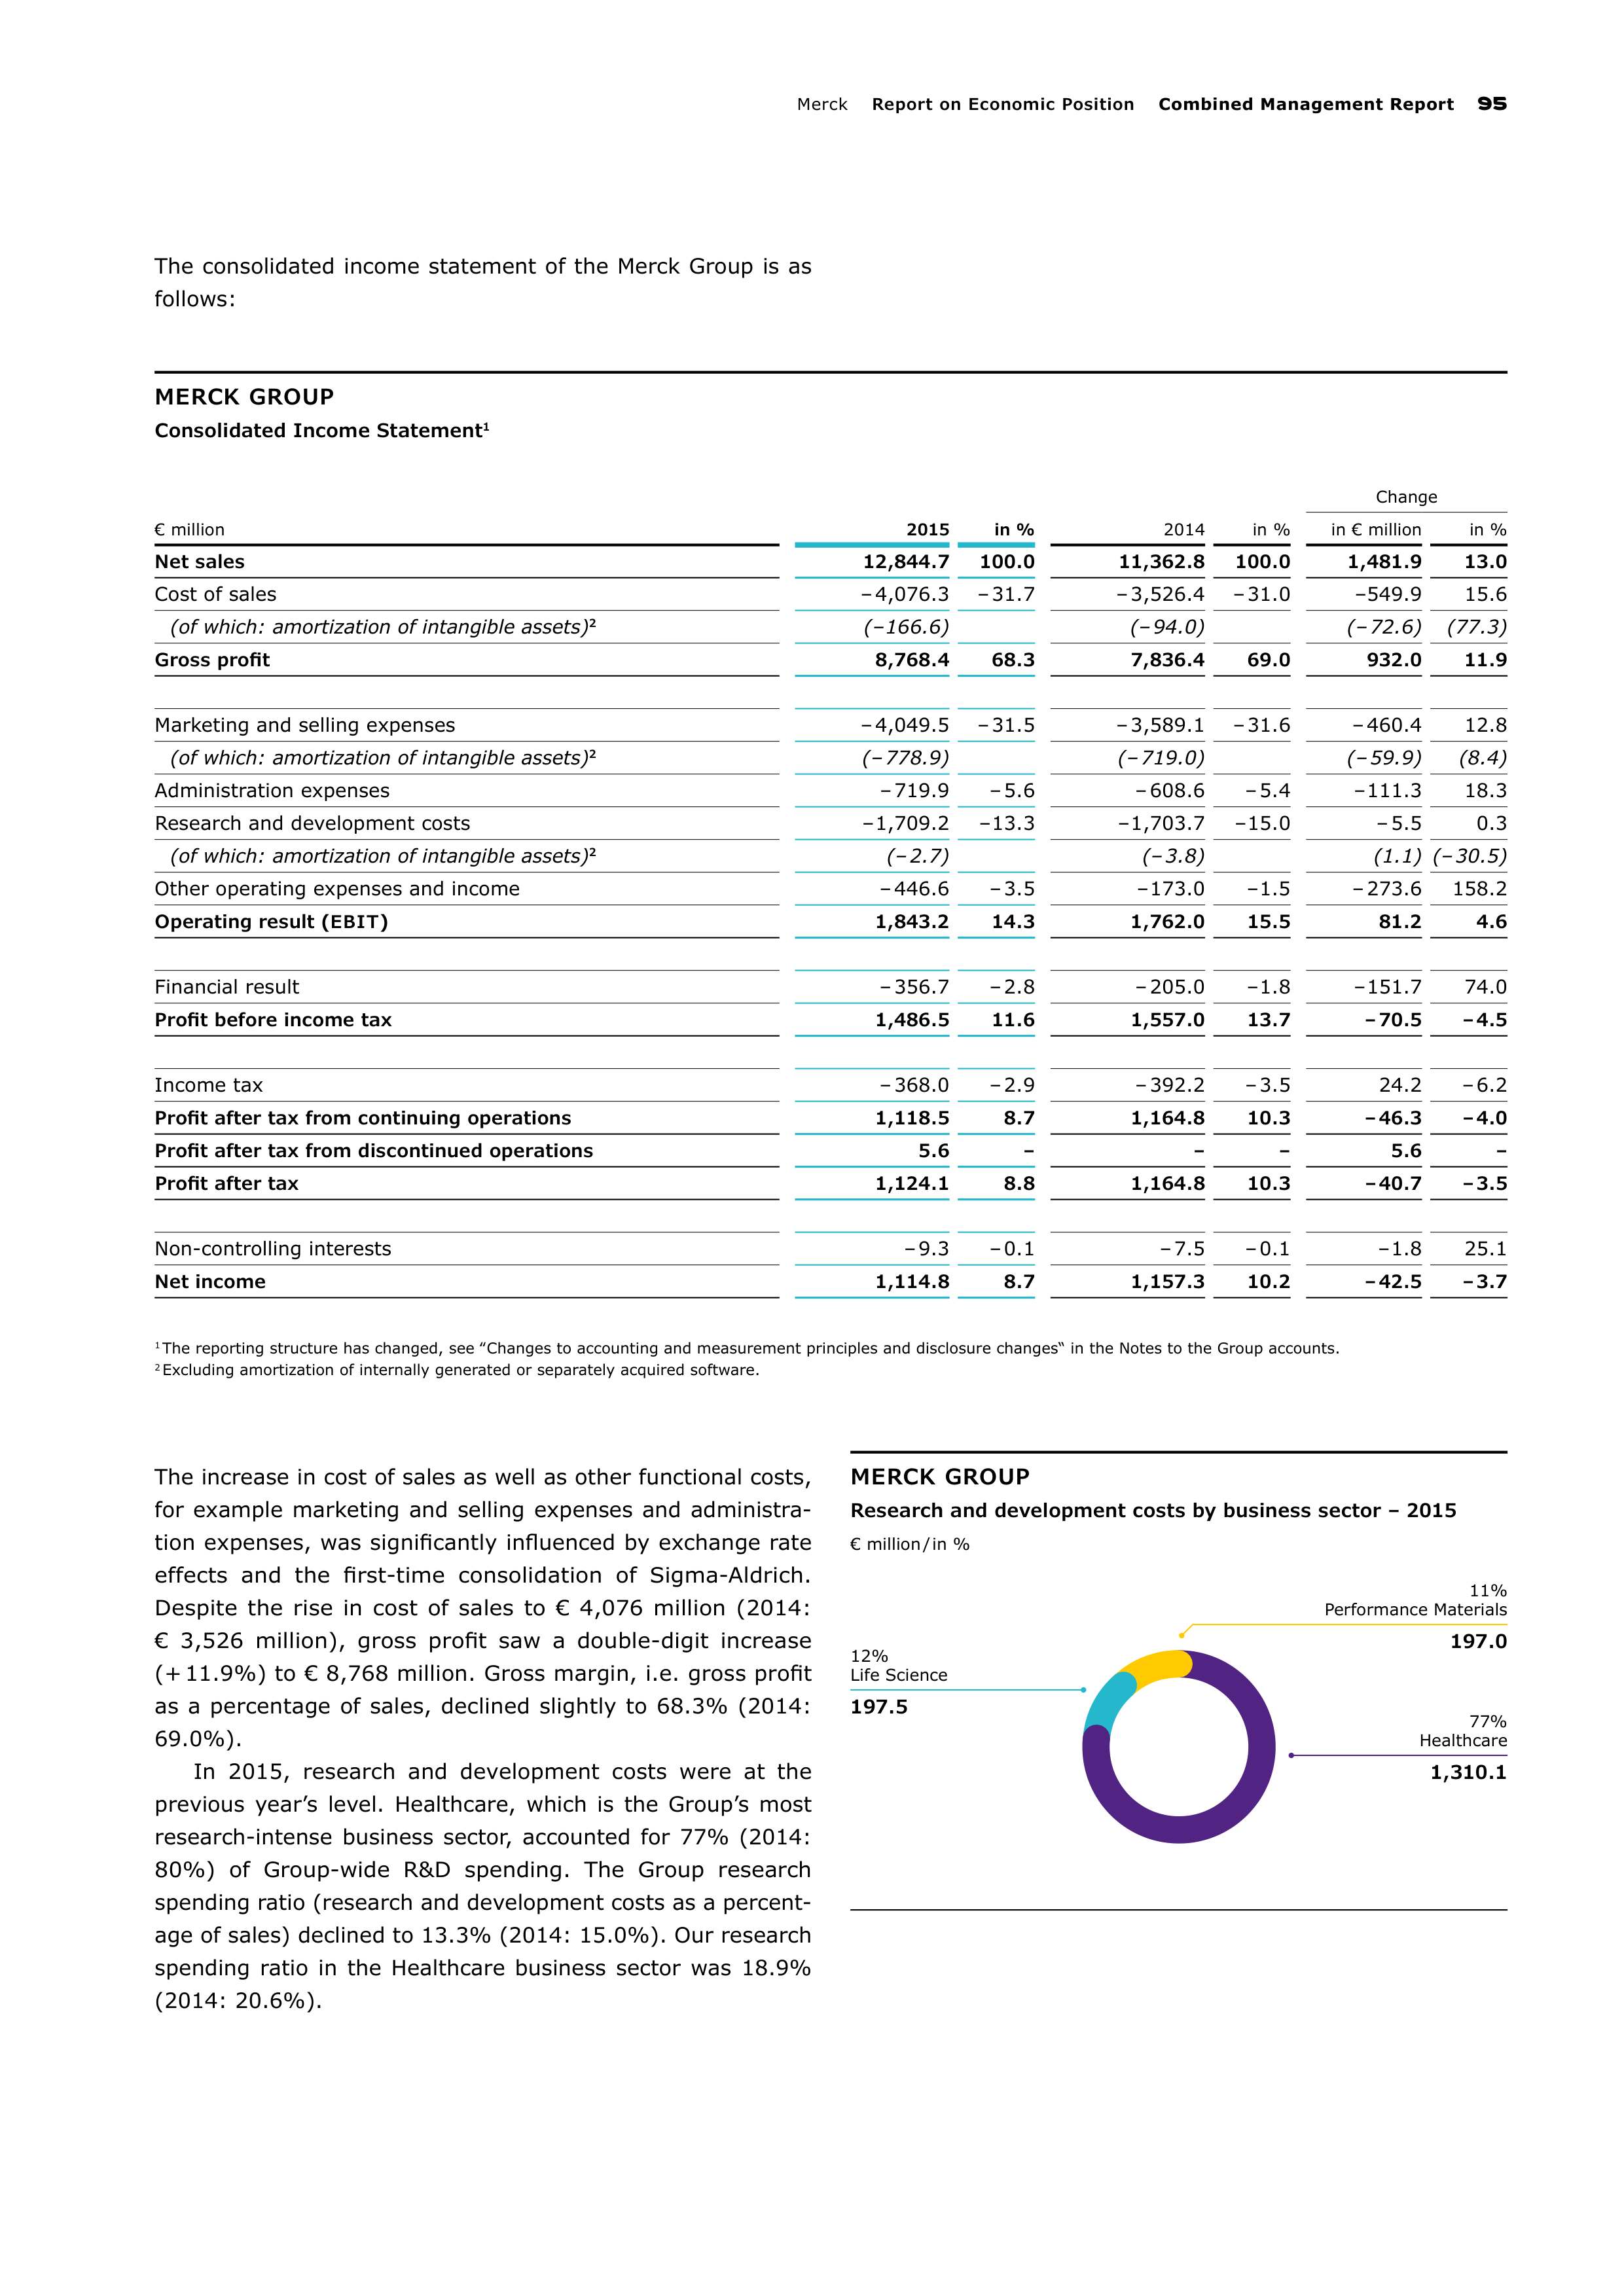
Merc
Report on Economic Position
Combined Management Report
95
MERCK GROUP
Research and development costs by business sector – 2015
€ million / in %
77%
Healthcare
1,310.1
12%
Life Science
197.5
11%
Performance Materials
197.0
The consolidated income statement of the Merck Group is as
follows:
MERCK GROUP
Consolidated Income Statement
1
Change
€ million
2015
in %
2014
in %
in € million
in %
Net sales
12,844.7
100.0
11,362.8
100.0
1,481.9
13.0
Cost of sales
– 4,076.3
– 31.7
– 3,526.4
– 31.0
–549.9
15.6
(of which: amortization of intangible assets)
2
(– 166.6)
(– 94.0)
(– 72.6)
(77.3)
Gross profit
8,768.4
68.3
7,836.4
69.0
932.0
11.9
Marketing and selling expenses
– 4,049.5
– 31.5
– 3,589.1
– 31.6
– 460.4
12.8
(of which: amortization of intangible assets)
2
(– 778.9)
(– 719.0)
(– 59.9)
(8.4)
Administration expenses
– 719.9
– 5.6
– 608.6
– 5.4
– 111.3
18.3
Research and development costs
– 1,709.2
– 13.3
– 1,703.7
– 15.0
– 5.5
0.3
(of which: amortization of intangible assets)
2
(– 2.7)
(– 3.8)
(1.1)
(– 30.5)
Other operating expenses and income
– 446.6
– 3.5
– 173.0
– 1.5
– 273.6
158.2
Operating result (
EBIT
)
1,843.2
14.3
1,762.0
15.5
81.2
4.6
Financial result
– 356.7
– 2.8
– 205.0
– 1.8
– 151.7
74.0
Profit before income tax
1,486.5
11.6
1,557.0
13.7
– 70.5
– 4.5
Income tax
– 368.0
– 2.9
– 392.2
– 3.5
24.2
– 6.2
Profit after tax from continuing operations
1,118.5
8.7
1,164.8
10.3
– 46.3
– 4.0
Profit after tax from discontinued operations
5.6
–
–
–
5.6
–
Profit after tax
1,124.1
8.8
1,164.8
10.3
– 40.7
– 3.5
Non-controlling interests
– 9.3
– 0.1
– 7.5
– 0.1
– 1.8
25.1
Net income
1,114.8
8.7
1,157.3
10.2
– 42.5
– 3.7
1
The reporting structure has changed, see ‟Changes to accounting and measurement principles and disclosure changes“ in the Notes to the Group accounts.
2
Excluding amortization of internally generated or separately acquired software.
The increase in cost of sales as well as other functional costs,
for example marketing and selling expenses and administra-
tion expenses, was significantly influenced by exchange rate
effects and the first-time consolidation of Sigma-Aldrich.
Despite the rise in cost of sales to € 4,076 million (2014:
€ 3,526 million), gross profit saw a double-digit increase
(+ 11.9%) to € 8,768 million. Gross margin, i.e. gross profit
as a percentage of sales, declined slightly to 68.3% (2014:
69.0%).
In 2015, research and development costs were at the
previous year’s level. Healthcare, which is the Group’s most
research-intense business sector, accounted for 77% (2014:
80%) of Group-wide R&D spending. The Group research
spending ratio (research and development costs as a percent-
age of sales) declined to 13.3% (2014: 15.0%). Our research
spending ratio in the Healthcare business sector was 18.9%
(2014: 20.6%).
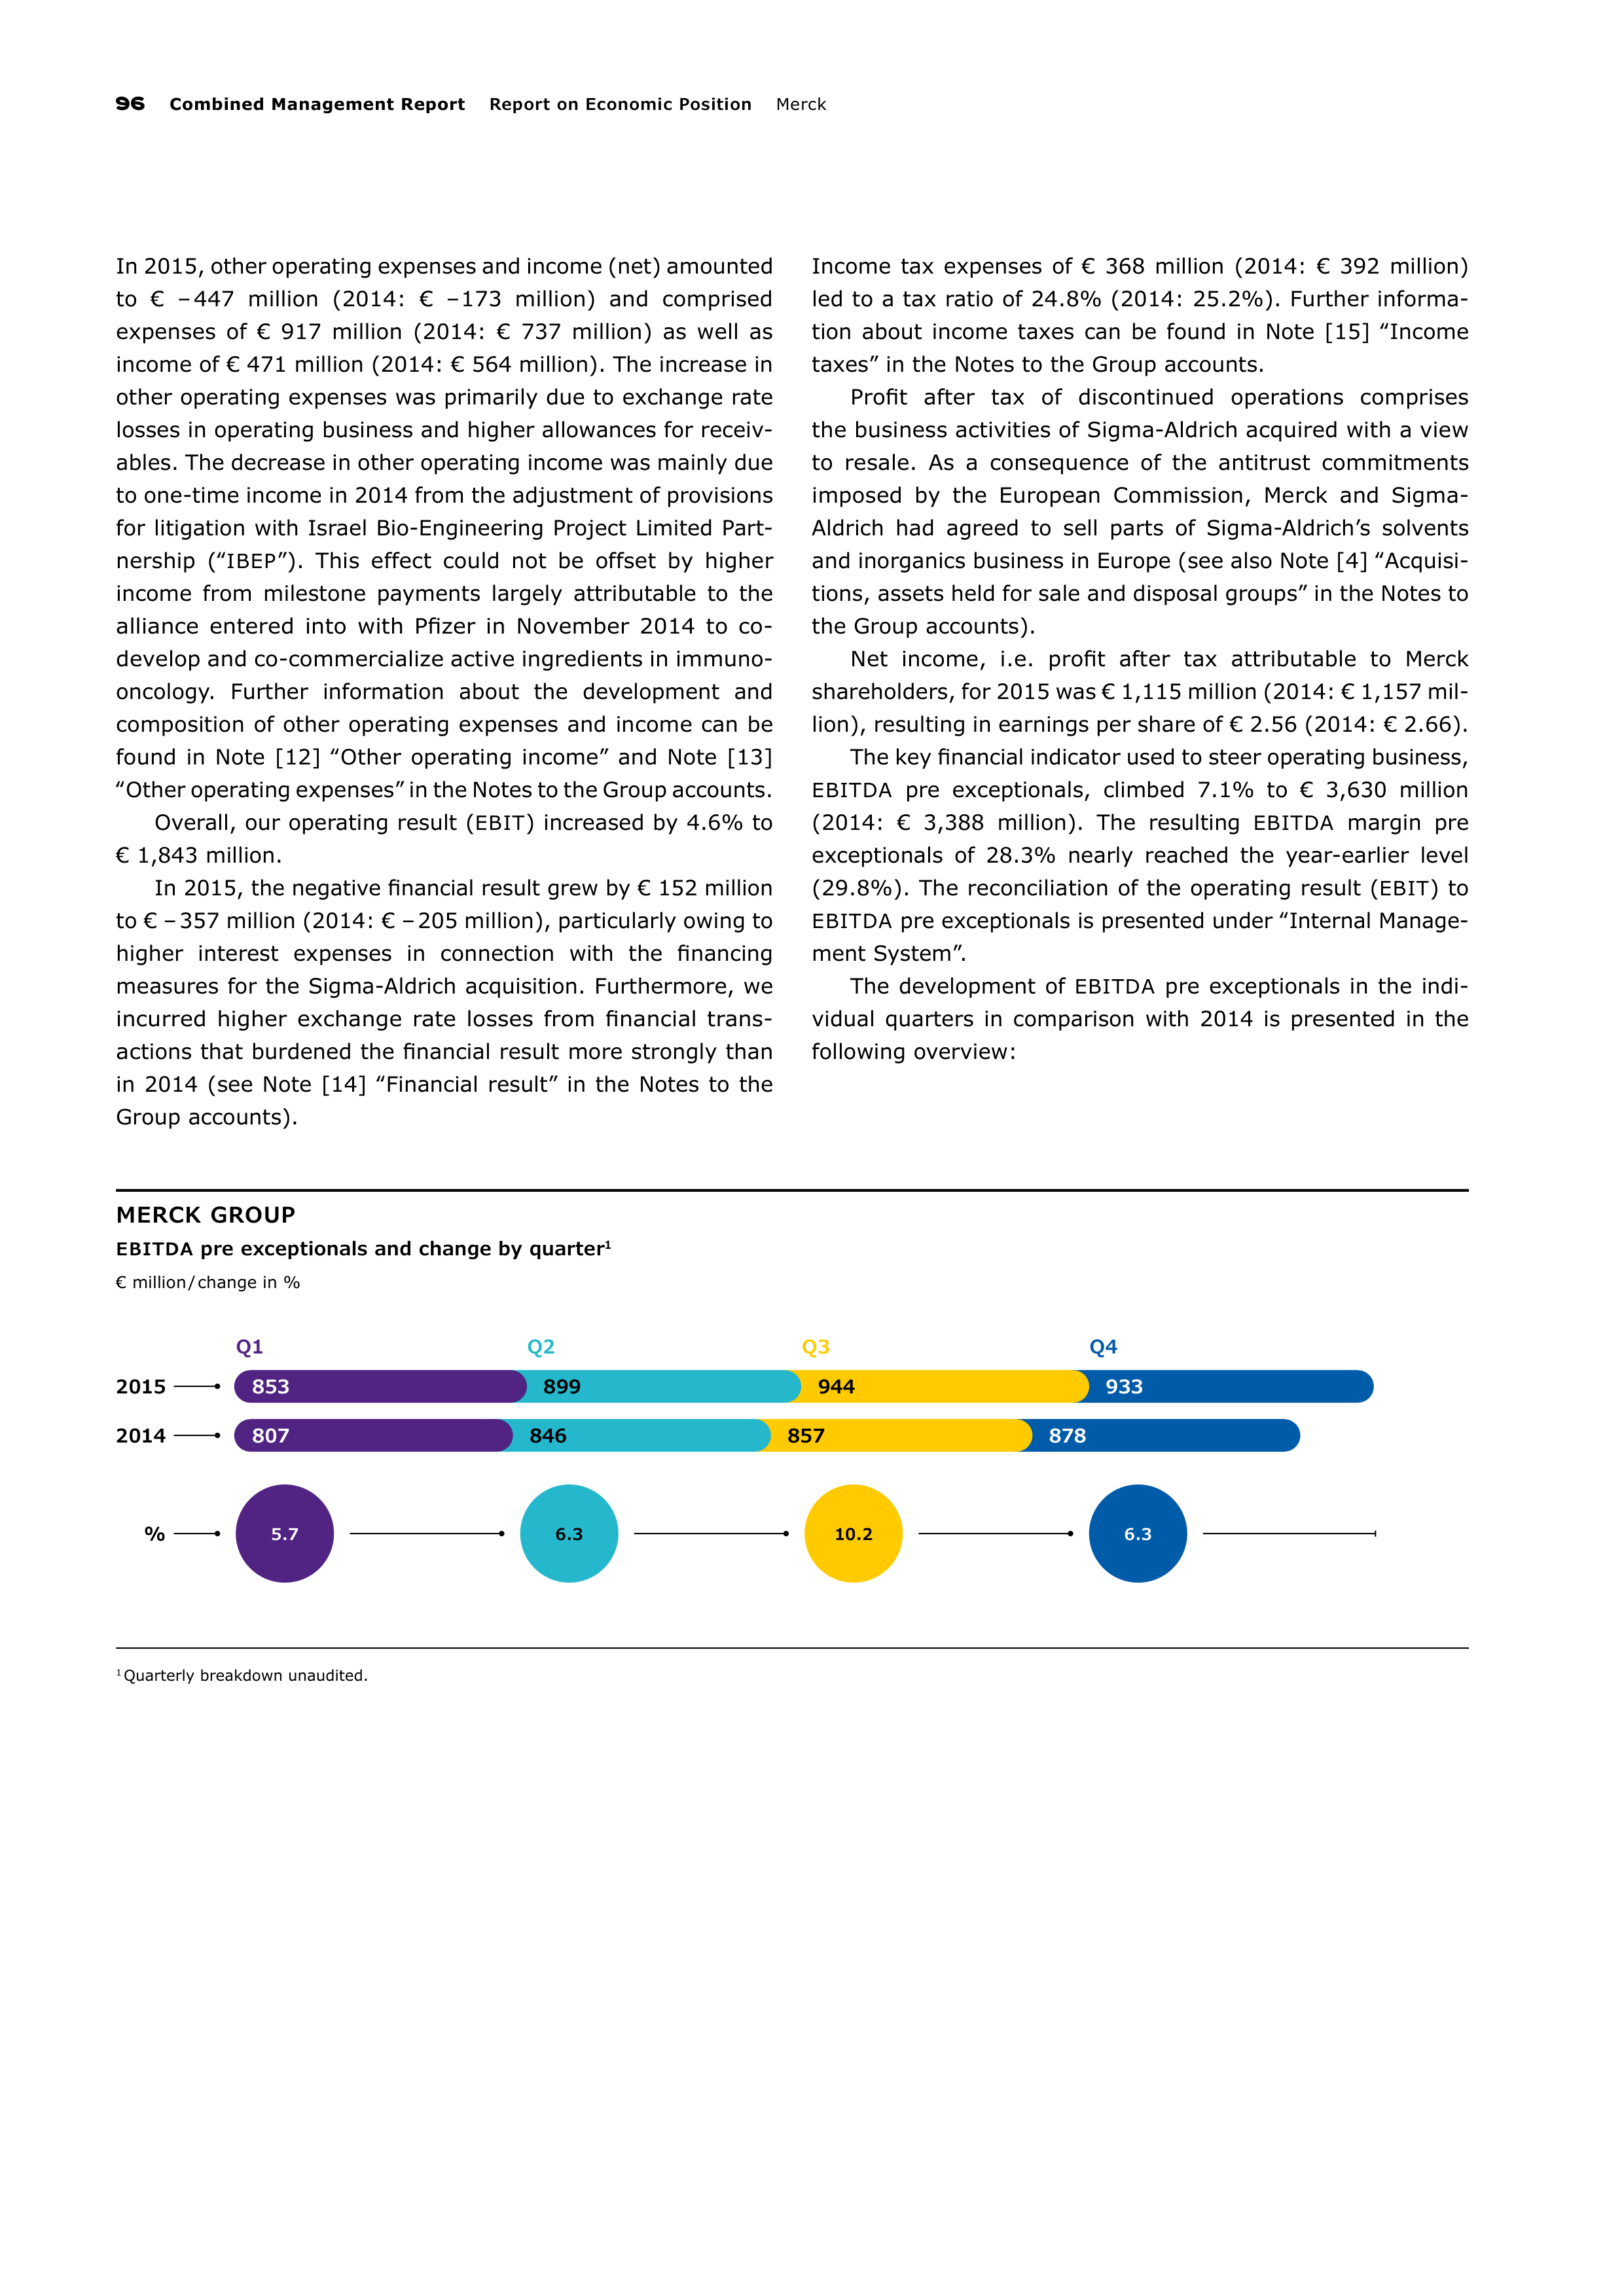
96
Combined Management Report
Report on Economic Position
Merc
MERCK GROUP
EBITDA
pre exceptionals and change by quarter
1
€ million / change in %
1
Quarterly breakdown unaudited.
Q1
Q2
Q3
Q4
2015
2014
%
5.7
6.3
10.2
6.3
853
899
944
933
807
846
857
878
In 2015, other operating expenses and income (net) amounted
to € – 447 million (2014: € – 173 million) and comprised
expenses of € 917 million (2014: € 737 million) as well as
income of € 471 million (2014: € 564 million). The increase in
other operating expenses was primarily due to exchange rate
losses in operating business and higher allowances for receiv-
ables. The decrease in other operating income was mainly due
to one-time income in 2014 from the adjustment of provisions
for litigation with Israel Bio-Engineering Project Limited Part-
nership (
‟
IBEP
”). This effect could not be offset by higher
income from milestone payments largely attributable to the
alliance entered into with Pfizer in November 2014 to co-
develop and co-commercialize active ingredients in immu
no-
oncology. Further information about the development and
composition of other operating expenses and income can be
found in Note [12] ‟Other operating income” and Note [13]
‟Other operating expenses” in the Notes to the Group accounts.
Overall, our operating result (
EBIT
) increased by 4.6% to
€ 1,843 million.
In 2015, the negative financial result grew by € 152 million
to € – 357 million (2014: € – 205 million), particularly owing to
higher interest expenses in connection with the financing
measures for the Sigma-Aldrich acquisition. Furthermore, we
incurred higher exchange rate losses from financial trans
ac
tions that burdened the financial result more strongly than
in 2014 (see Note [14] ‟Financial result” in the Notes to the
Group accounts).
Income tax expenses of € 368 million (2014: € 392 million)
led to a tax ratio of 24.8% (2014: 25.2%). Further informa-
tion about income taxes can be found in Note [15] ‟Income
taxes” in the Notes to the Group accounts.
Profit after tax of discontinued operations comprises
the business activities of Sigma-Aldrich acquired with a view
to resale. As a consequence of the antitrust commitments
imposed by the European Commission, Merck and Sigma-
Aldrich had agreed to sell parts of Sigma-Aldrich’s solvents
and inorganics business in Europe (see also Note [4] ‟Acquisi-
tions, assets held for sale and disposal groups” in the Notes to
the Group accounts).
Net income, i.e. profit after tax attributable to Merck
shareholders, for 2015 was € 1,115 million (2014: € 1,157 mil-
lion), resulting in earnings per share of € 2.56 (2014: € 2.66).
The key financial indicator used to steer operating business,
EBITDA
pre exceptionals, climbed 7.1% to € 3,630 million
(2014: € 3,388 million). The resulting
EBITDA
margin pre
exceptionals of 28.3% nearly reached the year-earlier level
(29.8%). The reconciliation of the operating result
(
EBIT
) to
EBITDA
pre exceptionals is presented under ‟Internal Manage-
ment
System”.
The development of
EBITDA
pre exceptionals in the indi-
vidual quarters in comparison with 2014 is presented in the
following overview:
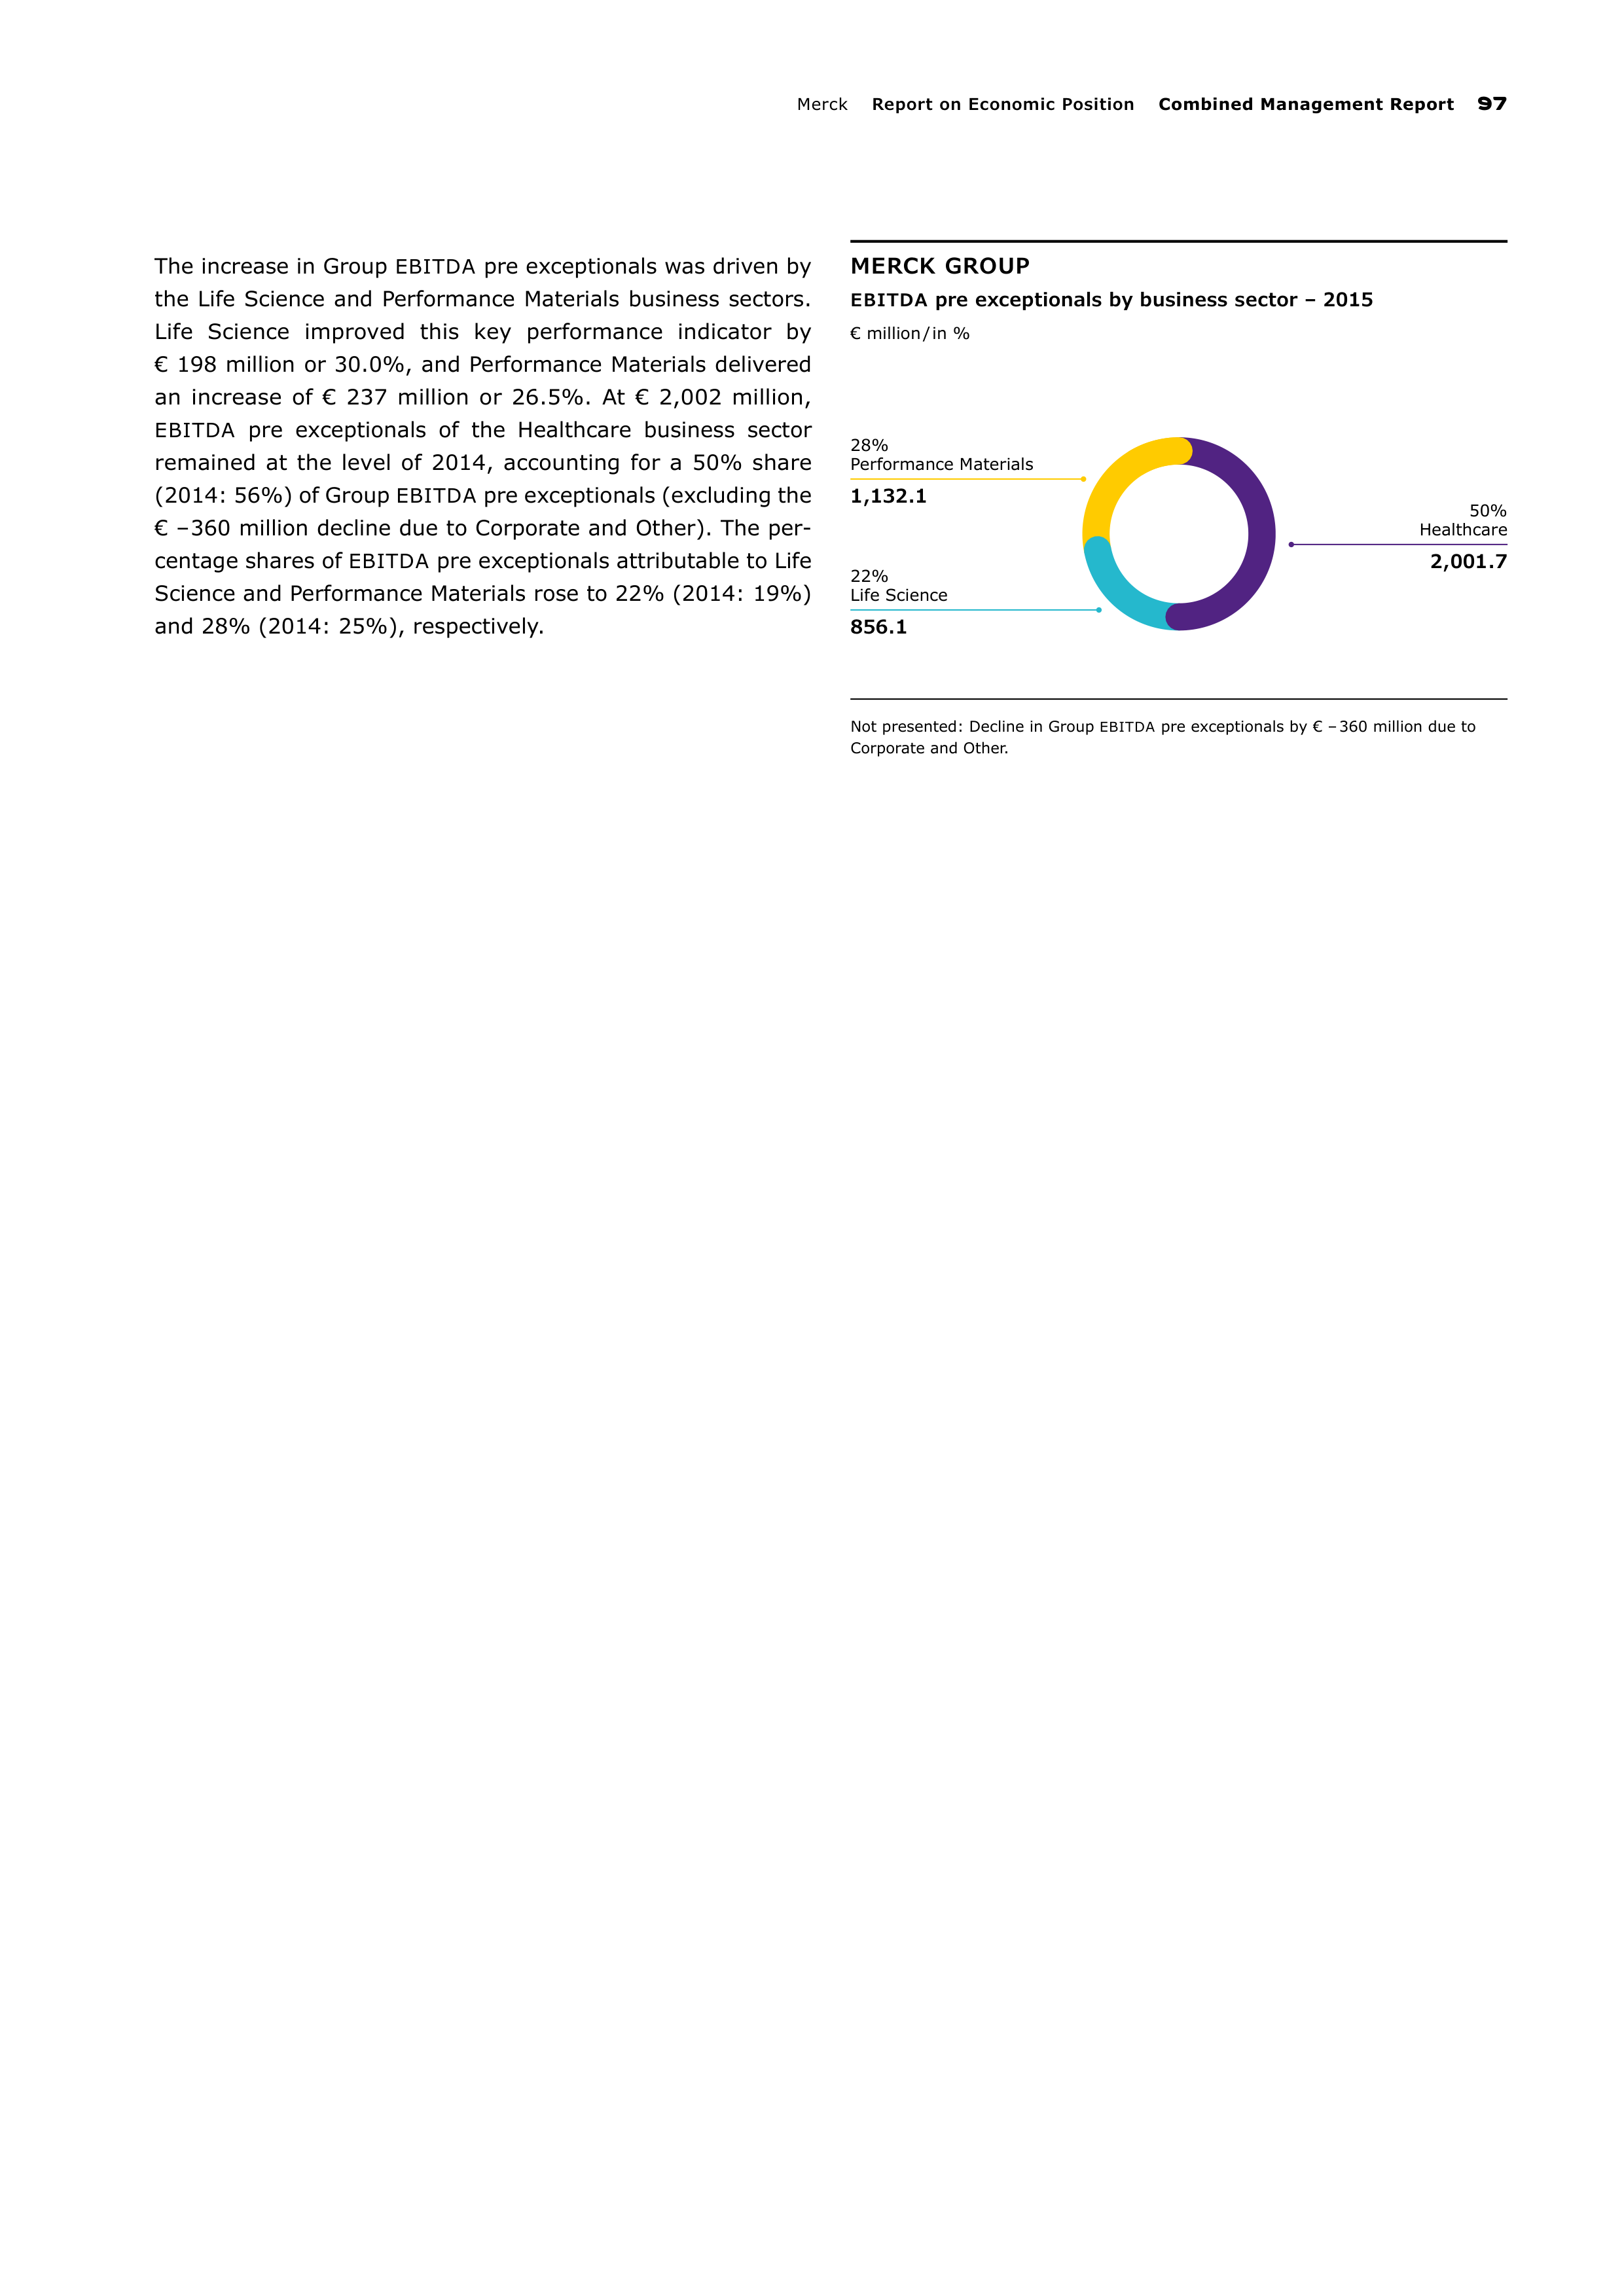
Merc
Report on Economic Position
Combined Management Report
97
Not presented: Decline in Group
EBITDA
pre exceptionals by € – 360 million due to
Corporate and Other.
MERCK GROUP
EBITDA
pre exceptionals by business sector – 2015
€ million / in %
50%
Healthcare
2,001.7
28%
Performance Materials
1,132.1
22%
Life Science
856.1
The increase in Group
EBITDA
pre exceptionals was driven by
the Life Science and Performance Materials business sectors.
Life Science improved this key performance indicator by
€ 198 million or 30.0%, and Performance Materials delivered
an increase of € 237 million or 26.5%. At € 2,002 million,
EBITDA
pre exceptionals of the Healthcare business sector
remained at the level of 2014, accounting for a 50% share
(2014: 56%) of Group
EBITDA
pre exceptionals (excluding the
€ – 360 million decline due to Corporate and Other). The per-
centage shares of
EBITDA
pre exceptionals attributable to Life
Science and Performance Materials rose to 22% (2014: 19%)
and 28% (2014: 25%), respectively.
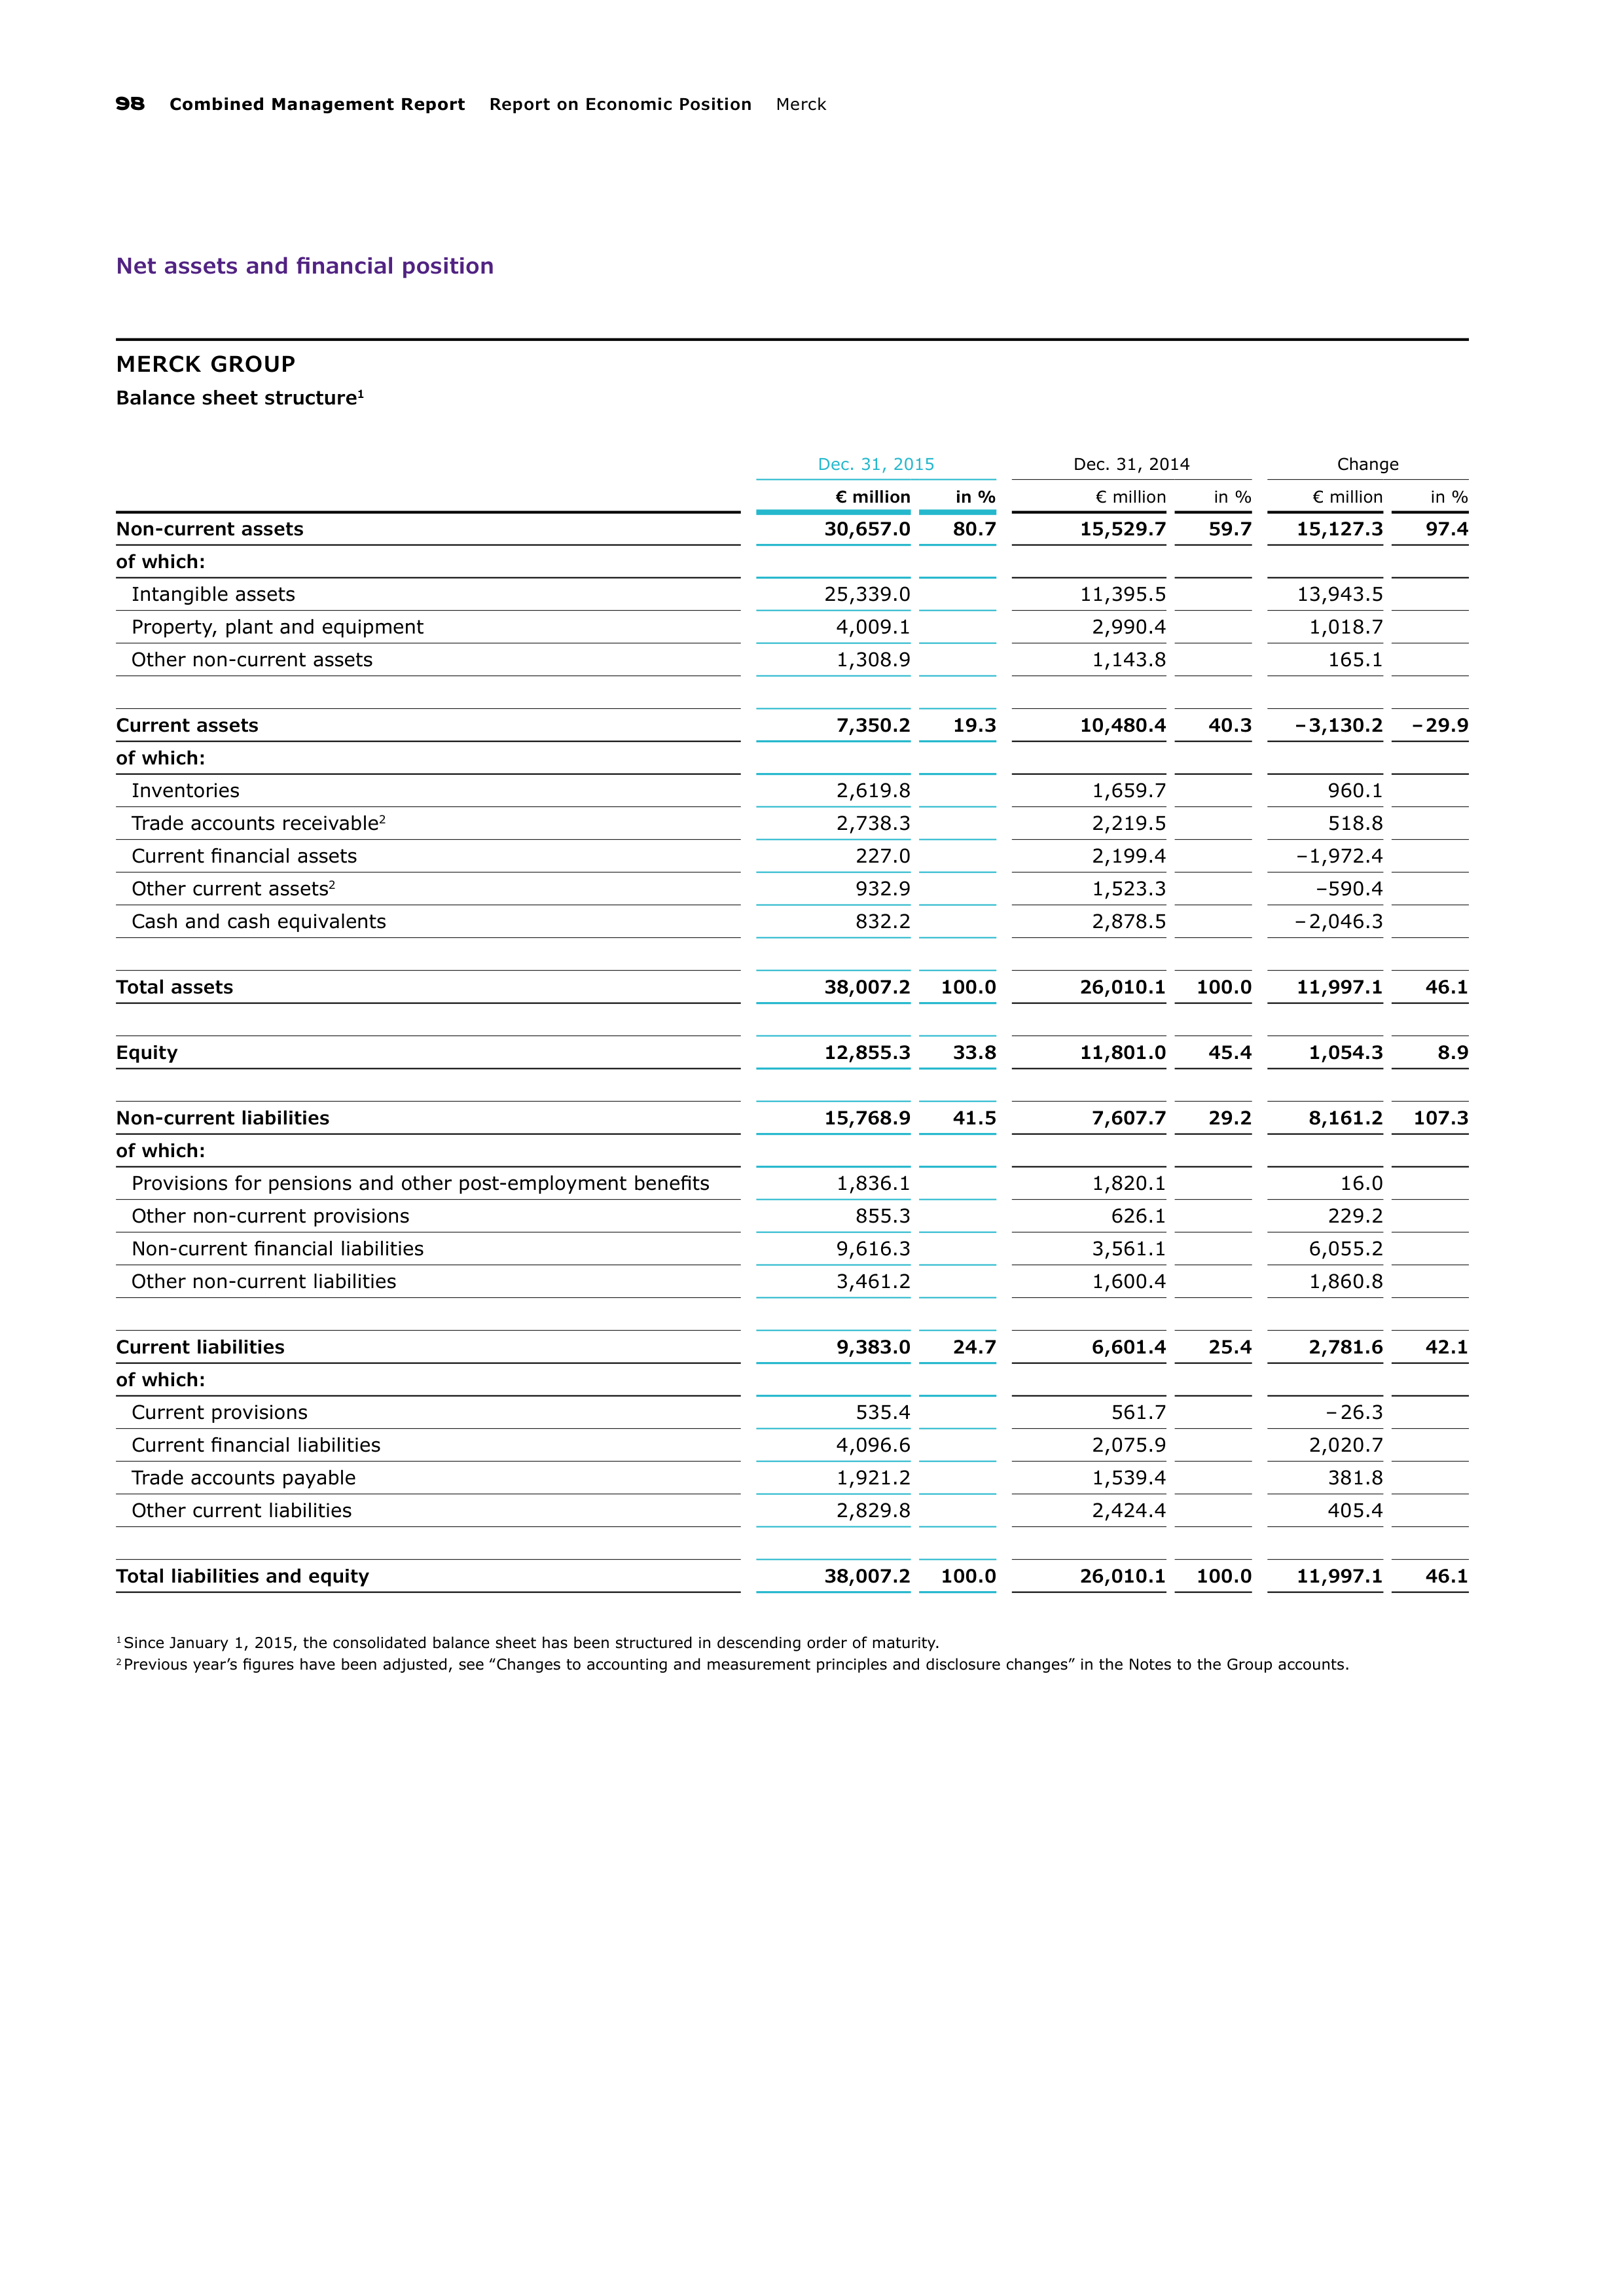
98
Combined Management Report
Report on Economic Position
Merc
Net assets and financial position
MERCK GROUP
Balance sheet structure
1
Dec. 31, 2015
Dec. 31, 2014
Change
€ million
in %
€ million
in %
€ million
in %
Non-current assets
30,657.0
80.7
15,529.7
59.7
15,127.3
97.4
of which:
Intangible assets
25,339.0
11,395.5
13,943.5
Property, plant and equipment
4,009.1
2,990.4
1,018.7
Other non-current assets
1,308.9
1,143.8
165.1
Current assets
7,350.2
19.3
10,480.4
40.3
– 3,130.2
– 29.9
of which:
Inventories
2,619.8
1,659.7
960.1
Trade accounts receivable
2
2,738.3
2,219.5
518.8
Current financial assets
227.0
2,199.4
– 1,972.4
Other current assets
2
932.9
1,523.3
–590.4
Cash and cash equivalents
832.2
2,878.5
– 2,046.3
Total assets
38,007.2
100.0
26,010.1
100.0
11,997.1
46.1
Equity
12,855.3
33.8
11,801.0
45.4
1,054.3
8.9
Non-current liabilities
15,768.9
41.5
7,607.7
29.2
8,161.2
107.3
of which:
Provisions for pensions and other post-employment benefits
1,836.1
1,820.1
16.0
Other non-current provisions
855.3
626.1
229.2
Non-current financial liabilities
9,616.3
3,561.1
6,055.2
Other non-current liabilities
3,461.2
1,600.4
1,860.8
Current liabilities
9,383.0
24.7
6,601.4
25.4
2,781.6
42.1
of which:
Current provisions
535.4
561.7
– 26.3
Current financial liabilities
4,096.6
2,075.9
2,020.7
Trade accounts payable
1,921.2
1,539.4
381.8
Other current liabilities
2,829.8
2,424.4
405.4
Total liabilities and equity
38,007.2
100.0
26,010.1
100.0
11,997.1
46.1
1
Since January 1, 2015, the consolidated balance sheet has been structured in descending order of maturity.
2
Previous year’s figures have been adjusted, see ‟Changes to accounting and measurement principles and disclosure changes” in the Notes to the Group accounts.
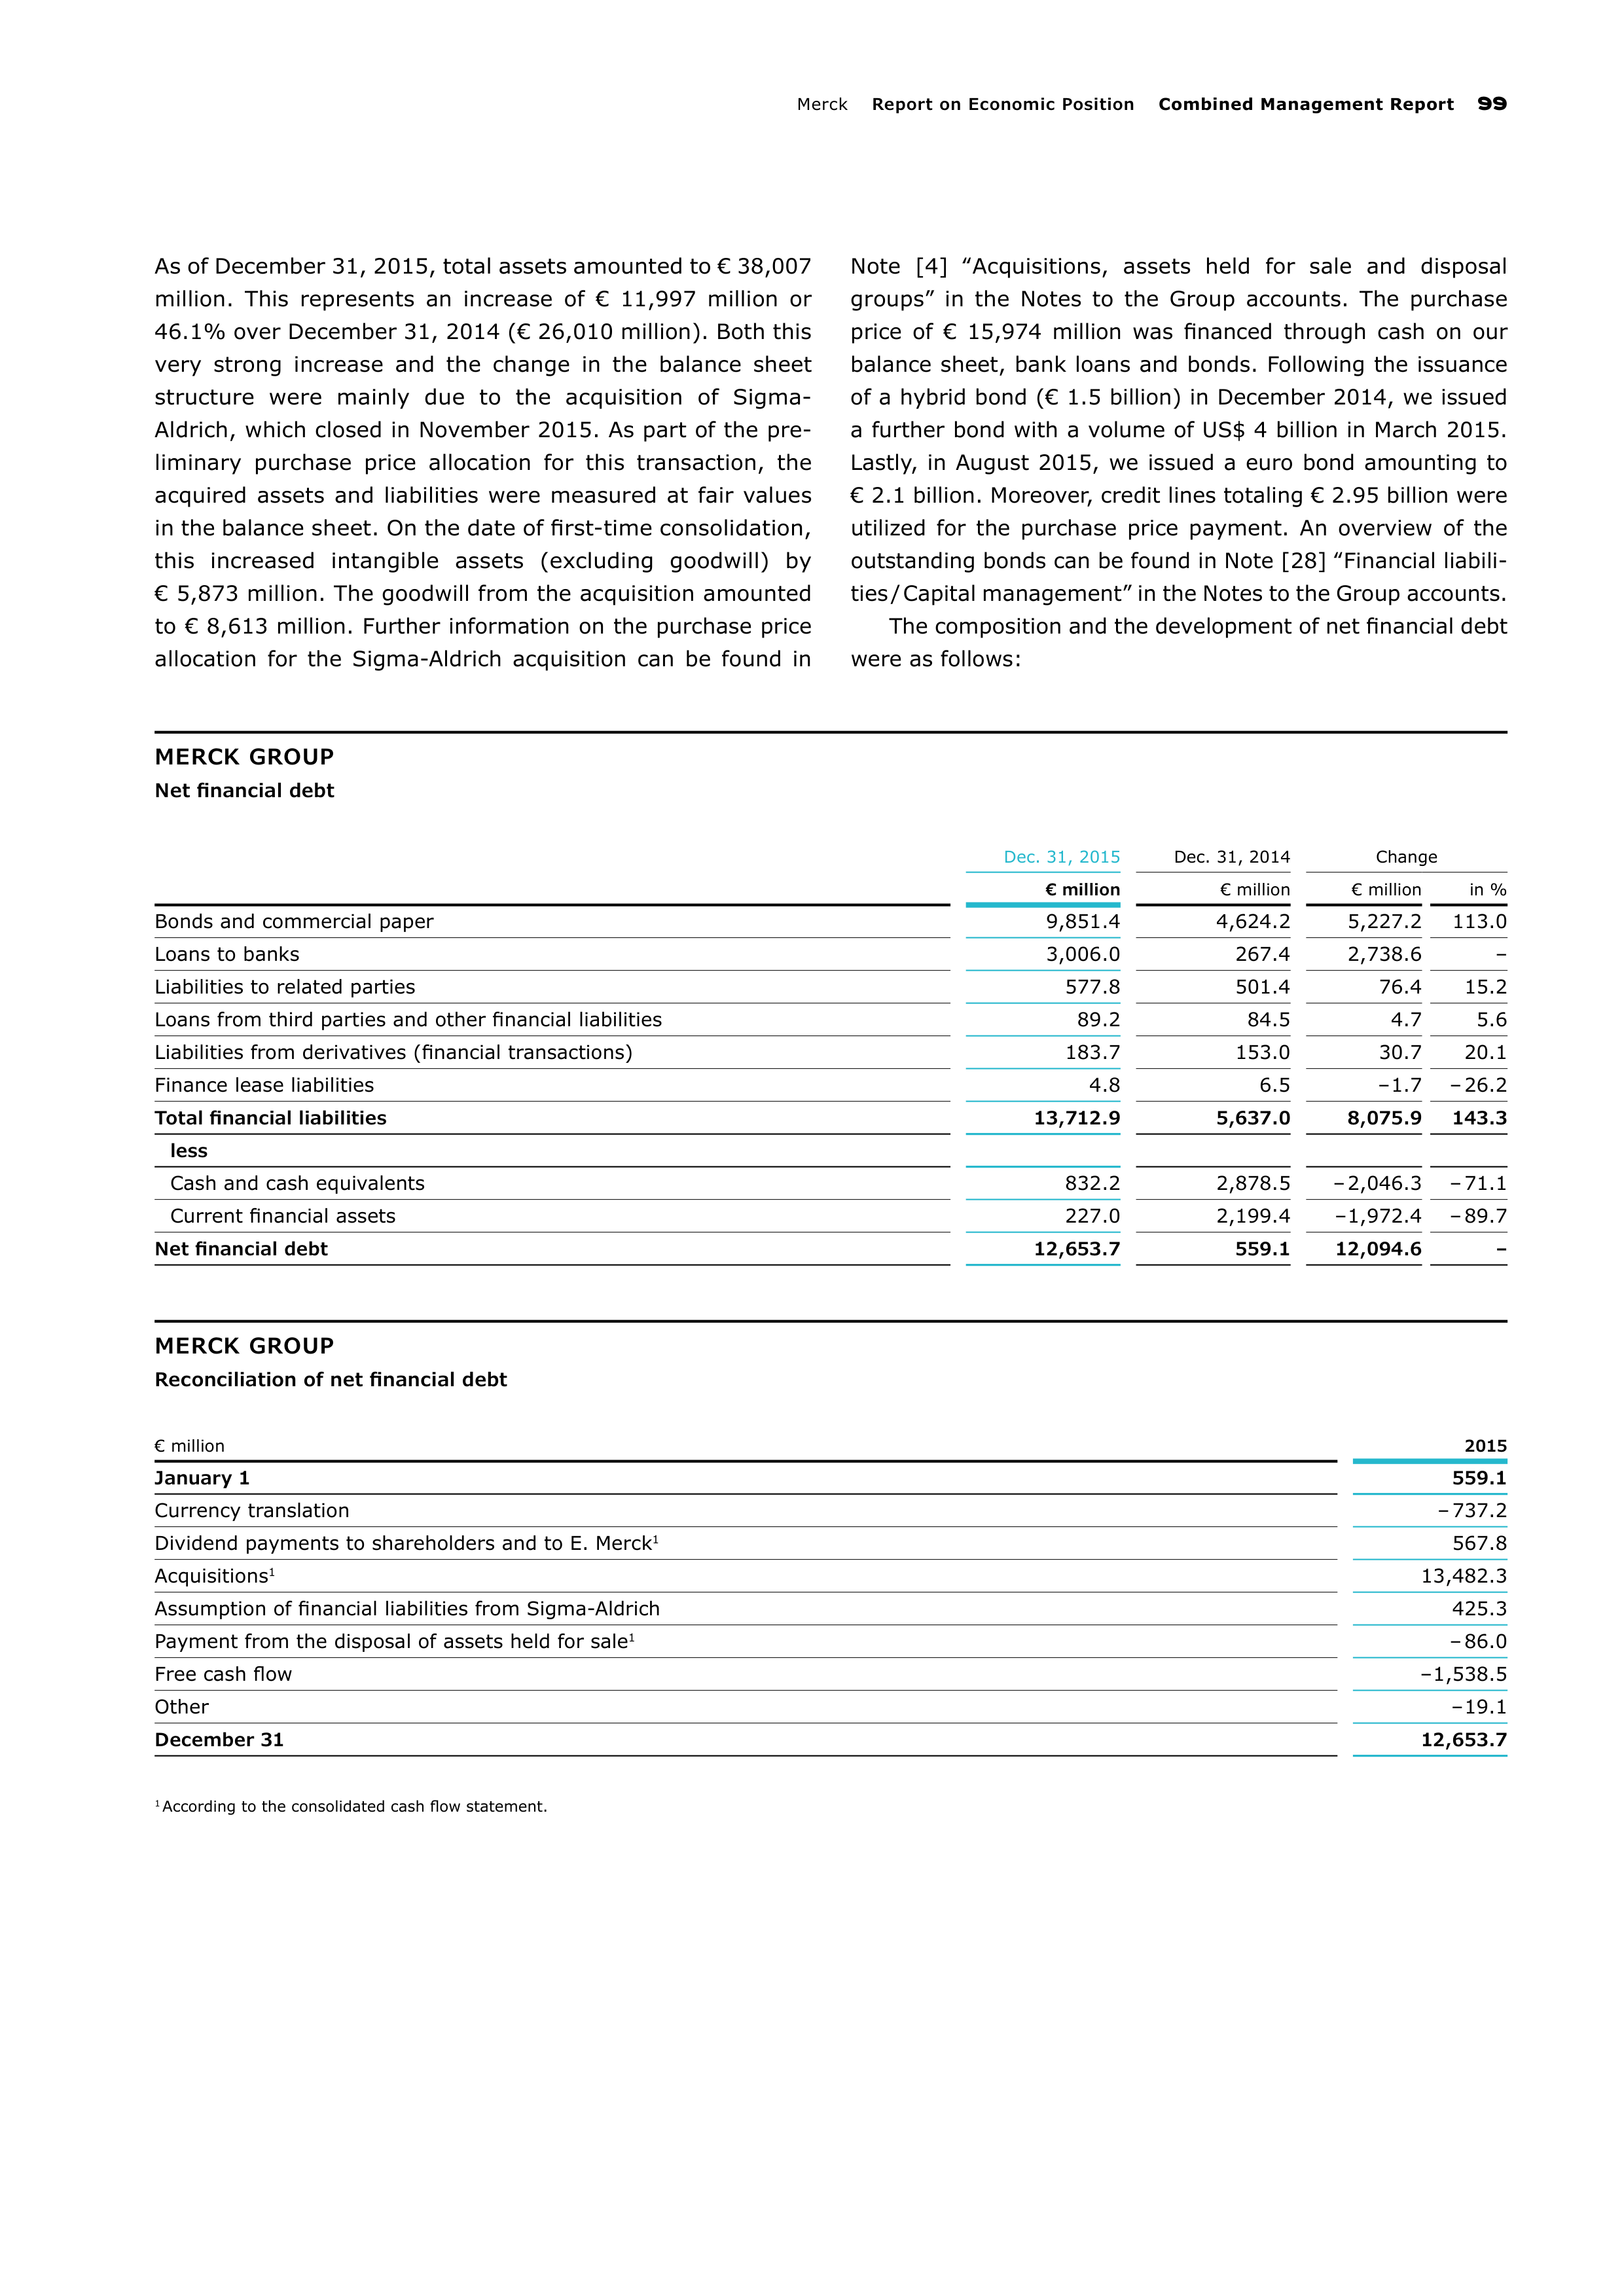
Merc
Report on Economic Position
Combined Management Report
99
As of December 31, 2015, total assets amounted to
€ 38,007
million. This represents an increase of € 11,997 million or
46.1% over December 31, 2014 (€ 26,010 million). Both this
very strong increase and the change in the balance sheet
structure were mainly due to the acquisition of Sigma-
Aldrich, which closed in November 2015. As part of the pre-
liminary purchase price allocation for this transaction, the
acquired assets and liabilities were measured at fair values
in
the bal
ance sheet. On the date of first-time consolidation,
this increased intangible assets (excluding goodwill) by
€ 5,873 million. The goodwill from the acquisition amounted
to
€ 8,613 million. Further information on the purchase price
allocation for the Sigma-Aldrich acquisition can be found in
Note
[4] ‟Acquisitions, assets held for sale and disposal
groups” in the Notes to the Group accounts. The purchase
price of € 15,974 million was financed through cash on our
balance sheet, bank loans and bonds. Following the issuance
of a hybrid bond (€ 1.5 billion) in December 2014, we issued
a further bond with a volume of US$ 4 billion in March 2015.
Lastly, in August 2015, we issued a euro bond amounting to
€ 2.1 billion. Moreover, credit lines totaling € 2.95 billion were
utilized for the purchase price payment. An overview of the
outstanding bonds can be found in Note [28] ‟Financial liabili-
ties / Capital management” in the Notes to the Group accounts.
The composition and the development of net financial debt
were as follows:
MERCK GROUP
Net financial debt
Dec. 31, 2015
Dec. 31, 2014
Change
€ million
€ million
€ million
in %
Bonds and commercial paper
9,851.4
4,624.2
5,227.2
113.0
Loans to banks
3,006.0
267.4
2,738.6
–
Liabilities to related parties
577.8
501.4
76.4
15.2
Loans from third parties and other financial liabilities
89.2
84.5
4.7
5.6
Liabilities from derivatives (financial transactions)
183.7
153.0
30.7
20.1
Finance lease liabilities
4.8
6.5
– 1.7
– 26.2
Total financial liabilities
13,712.9
5,637.0
8,075.9
143.3
less
Cash and cash equivalents
832.2
2,878.5
– 2,046.3
– 71.1
Current financial assets
227.0
2,199.4
– 1,972.4
– 89.7
Net financial debt
12,653.7
559.1
12,094.6
–
MERCK GROUP
Reconciliation of net financial debt
€ million
2015
January 1
559.1
Currency translation
– 737.2
Dividend payments to shareholders and to E. Merck
1
567.8
Acquisitions
1
13,482.3
Assumption of financial liabilities from Sigma-Aldrich
425.3
Payment from the disposal of assets held for sale
1
– 86.0
Free cash flow
– 1,538.5
Other
– 19.1
December 31
12,653.7
1
According to the consolidated cash flow statement.
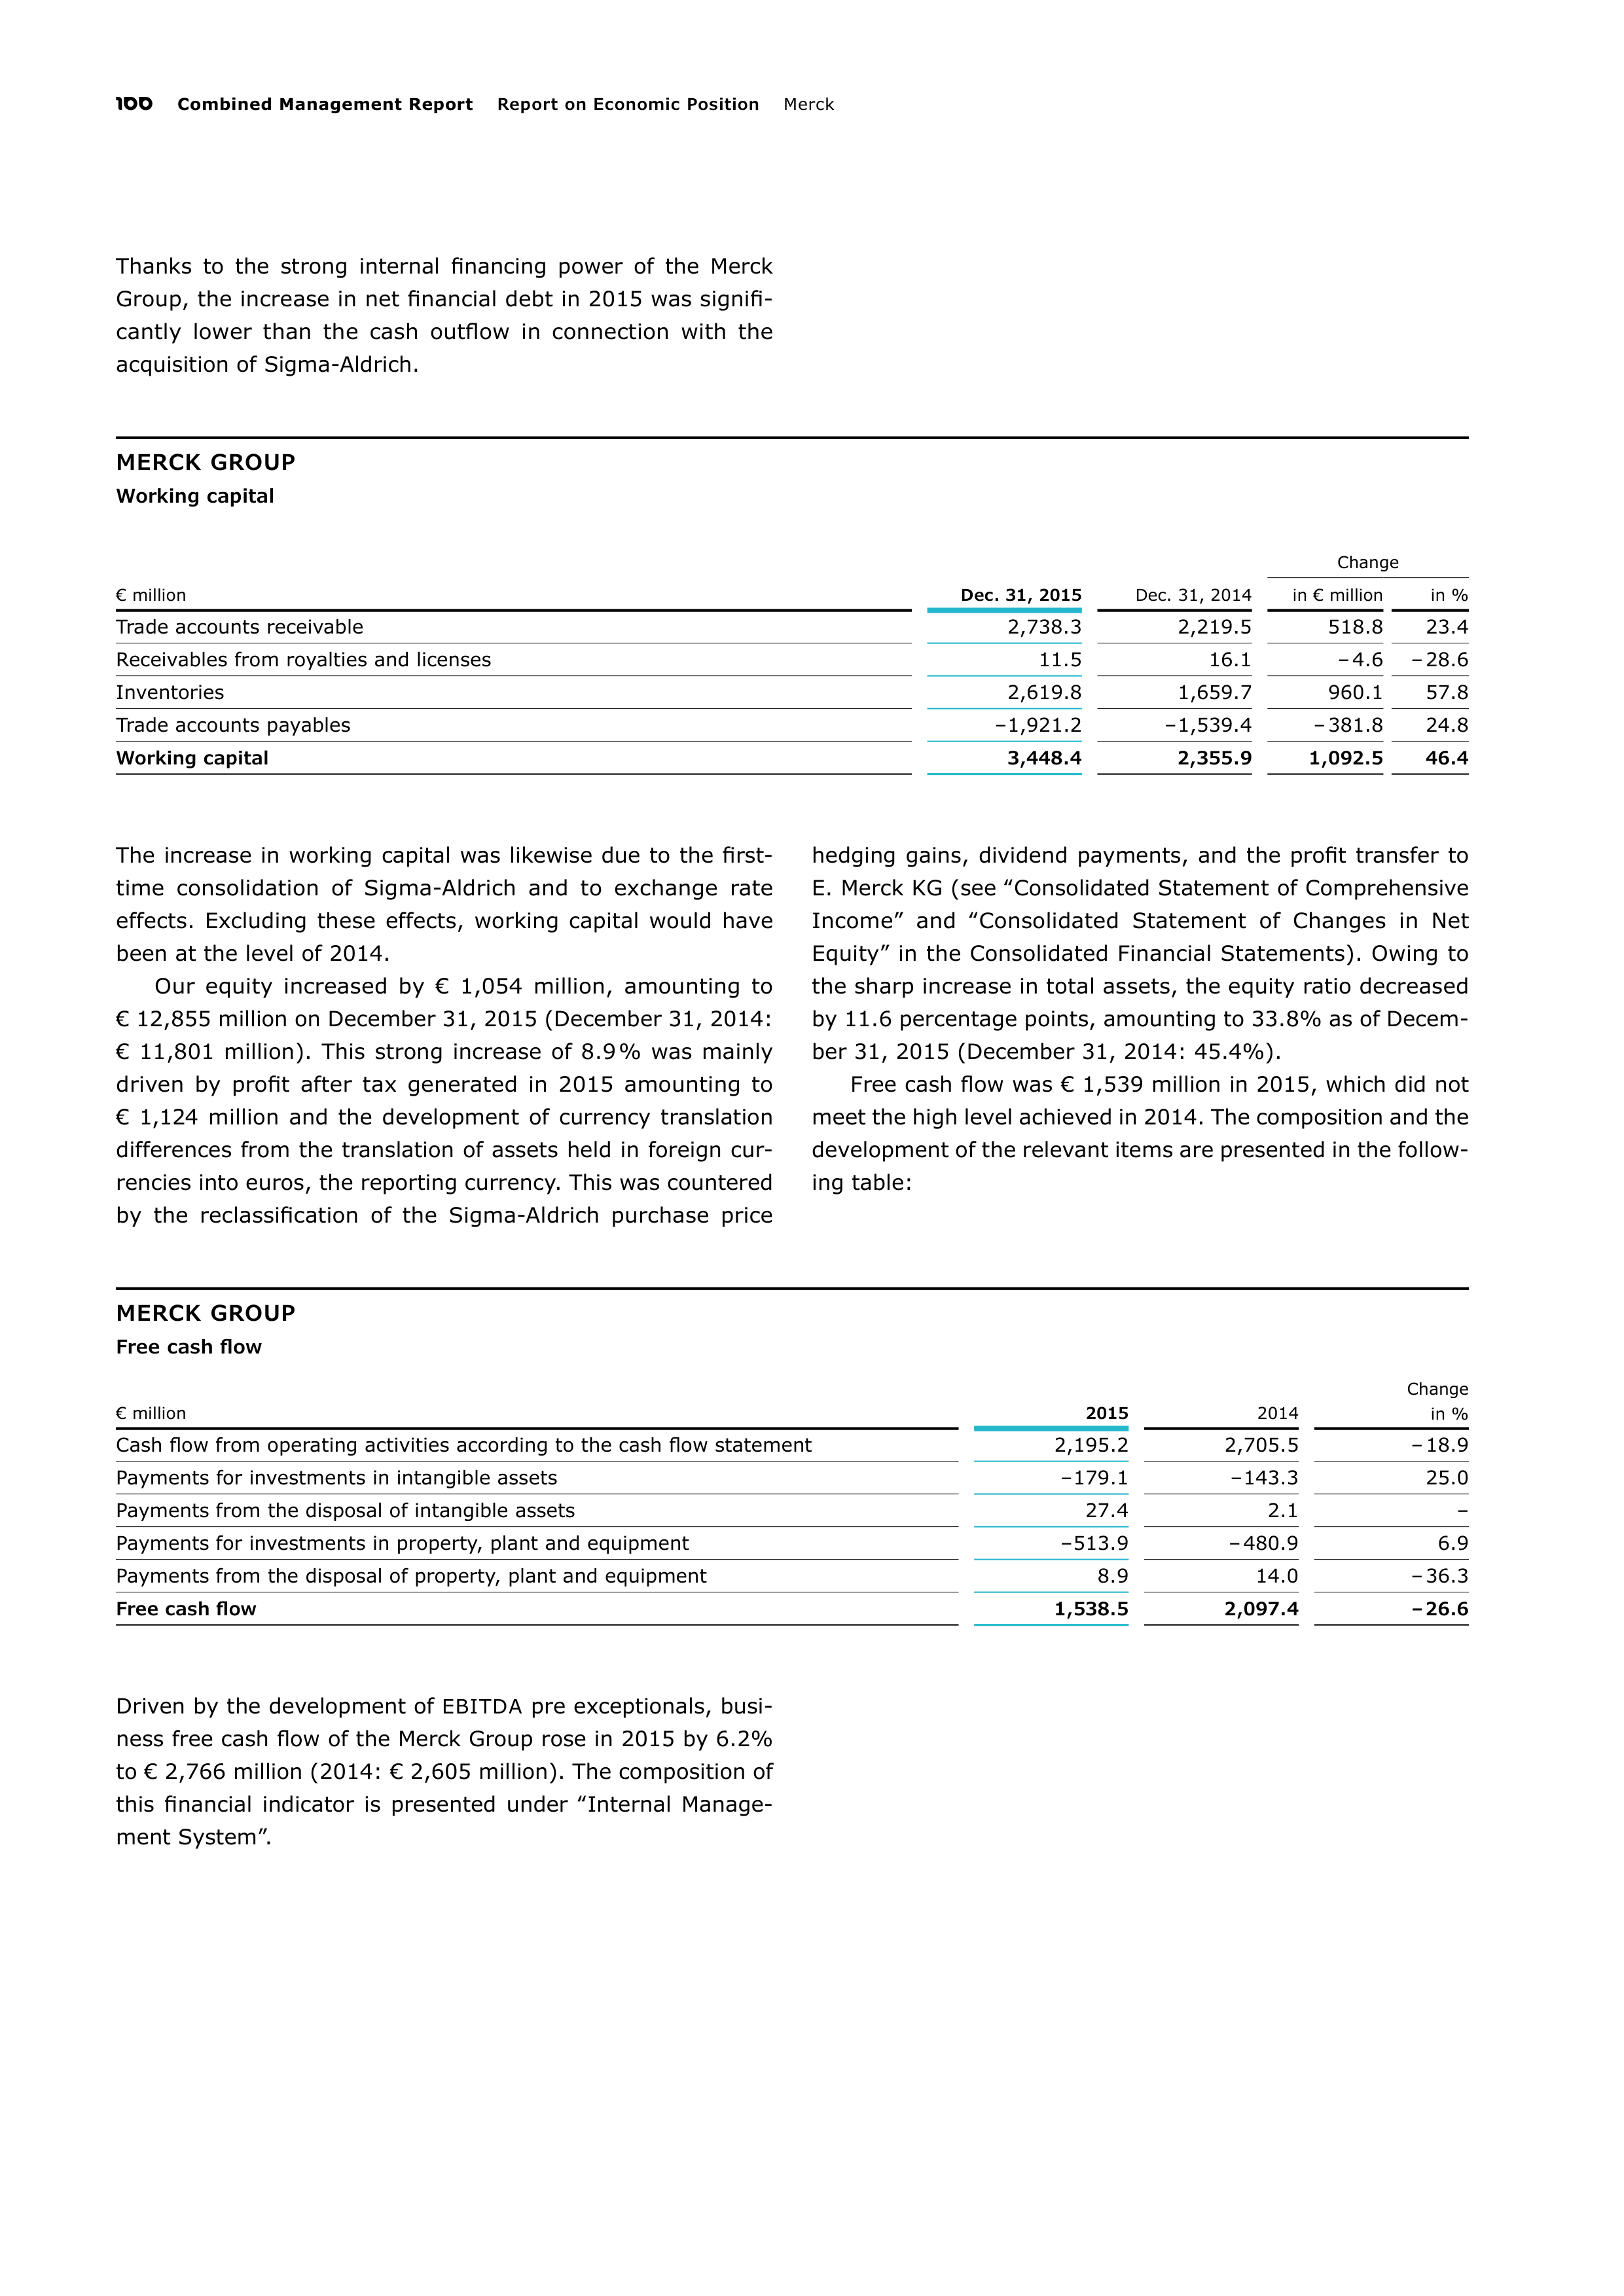
100
Combined Management Report
Report on Economic Position
Merc
Thanks to the strong internal financing power of the Merck
Group, the increase in net financial debt in 2015 was signifi-
cantly lower than the cash outflow in connection with the
acquisition of Sigma-Aldrich.
MERCK GROUP
Working capital
Change
€ million
Dec. 31, 2015
Dec. 31, 2014
in € million
in %
Trade accounts receivable
2,738.3
2,219.5
518.8
23.4
Receivables from royalties and licenses
11.5
16.1
– 4.6
– 28.6
Inventories
2,619.8
1,659.7
960.1
57.8
Trade accounts payables
– 1,921.2
– 1,539.4
– 381.8
24.8
Working capital
3,448.4
2,355.9
1,092.5
46.4
The increase in working capital was likewise due to the first-
time consolidation of Sigma-Aldrich and to exchange rate
effects. Excluding these effects, working capital would have
been at the level of 2014.
Our equity increased by € 1,054 million, amounting to
€ 12,855 million on December 31, 2015 (December 31, 2014:
€ 11,801 million). This strong increase of 8.9 % was mainly
driven by profit after tax generated in 2015 amounting to
€ 1,124 million and the development of currency translation
differences from the translation of assets held in foreign cur-
rencies into euros, the reporting currency. This was countered
by the reclassification of the Sigma-Aldrich purchase price
hedging gains, dividend payments, and the profit transfer to
E. Merck KG (see ‟Consolidated Statement of Comprehensive
Income” and ‟Consolidated Statement of Changes in Net
Equity” in the Consolidated Financial Statements). Owing to
the sharp increase in total assets, the equity ratio decreased
by 11.6 percentage points, amounting to 33.8% as of Decem-
ber 31, 2015 (December 31, 2014: 45.4%).
Free cash flow was € 1,539 million in 2015, which did not
meet the high level achieved in 2014. The composition and the
development of the relevant items are presented in the follow-
ing table:
MERCK GROUP
Free cash flow
€ million
2015
2014
Change
in %
Cash flow from operating activities according to the cash flow statement
2,195.2
2,705.5
– 18.9
Payments for investments in intangible assets
– 179.1
– 143.3
25.0
Payments from the disposal of intangible assets
27.4
2.1
–
Payments for investments in property, plant and equipment
– 513.9
– 480.9
6.9
Payments from the disposal of property, plant and equipment
8.9
14.0
– 36.3
Free cash flow
1,538.5
2,097.4
– 26.6
Driven by the development of
EBITDA
pre exceptionals, busi-
ness free cash flow of the Merck Group rose in 2015 by 6.2%
to € 2,766 million (2014: € 2,605 million). The composition of
this financial indicator is presented under ‟Internal Manage-
ment System”.
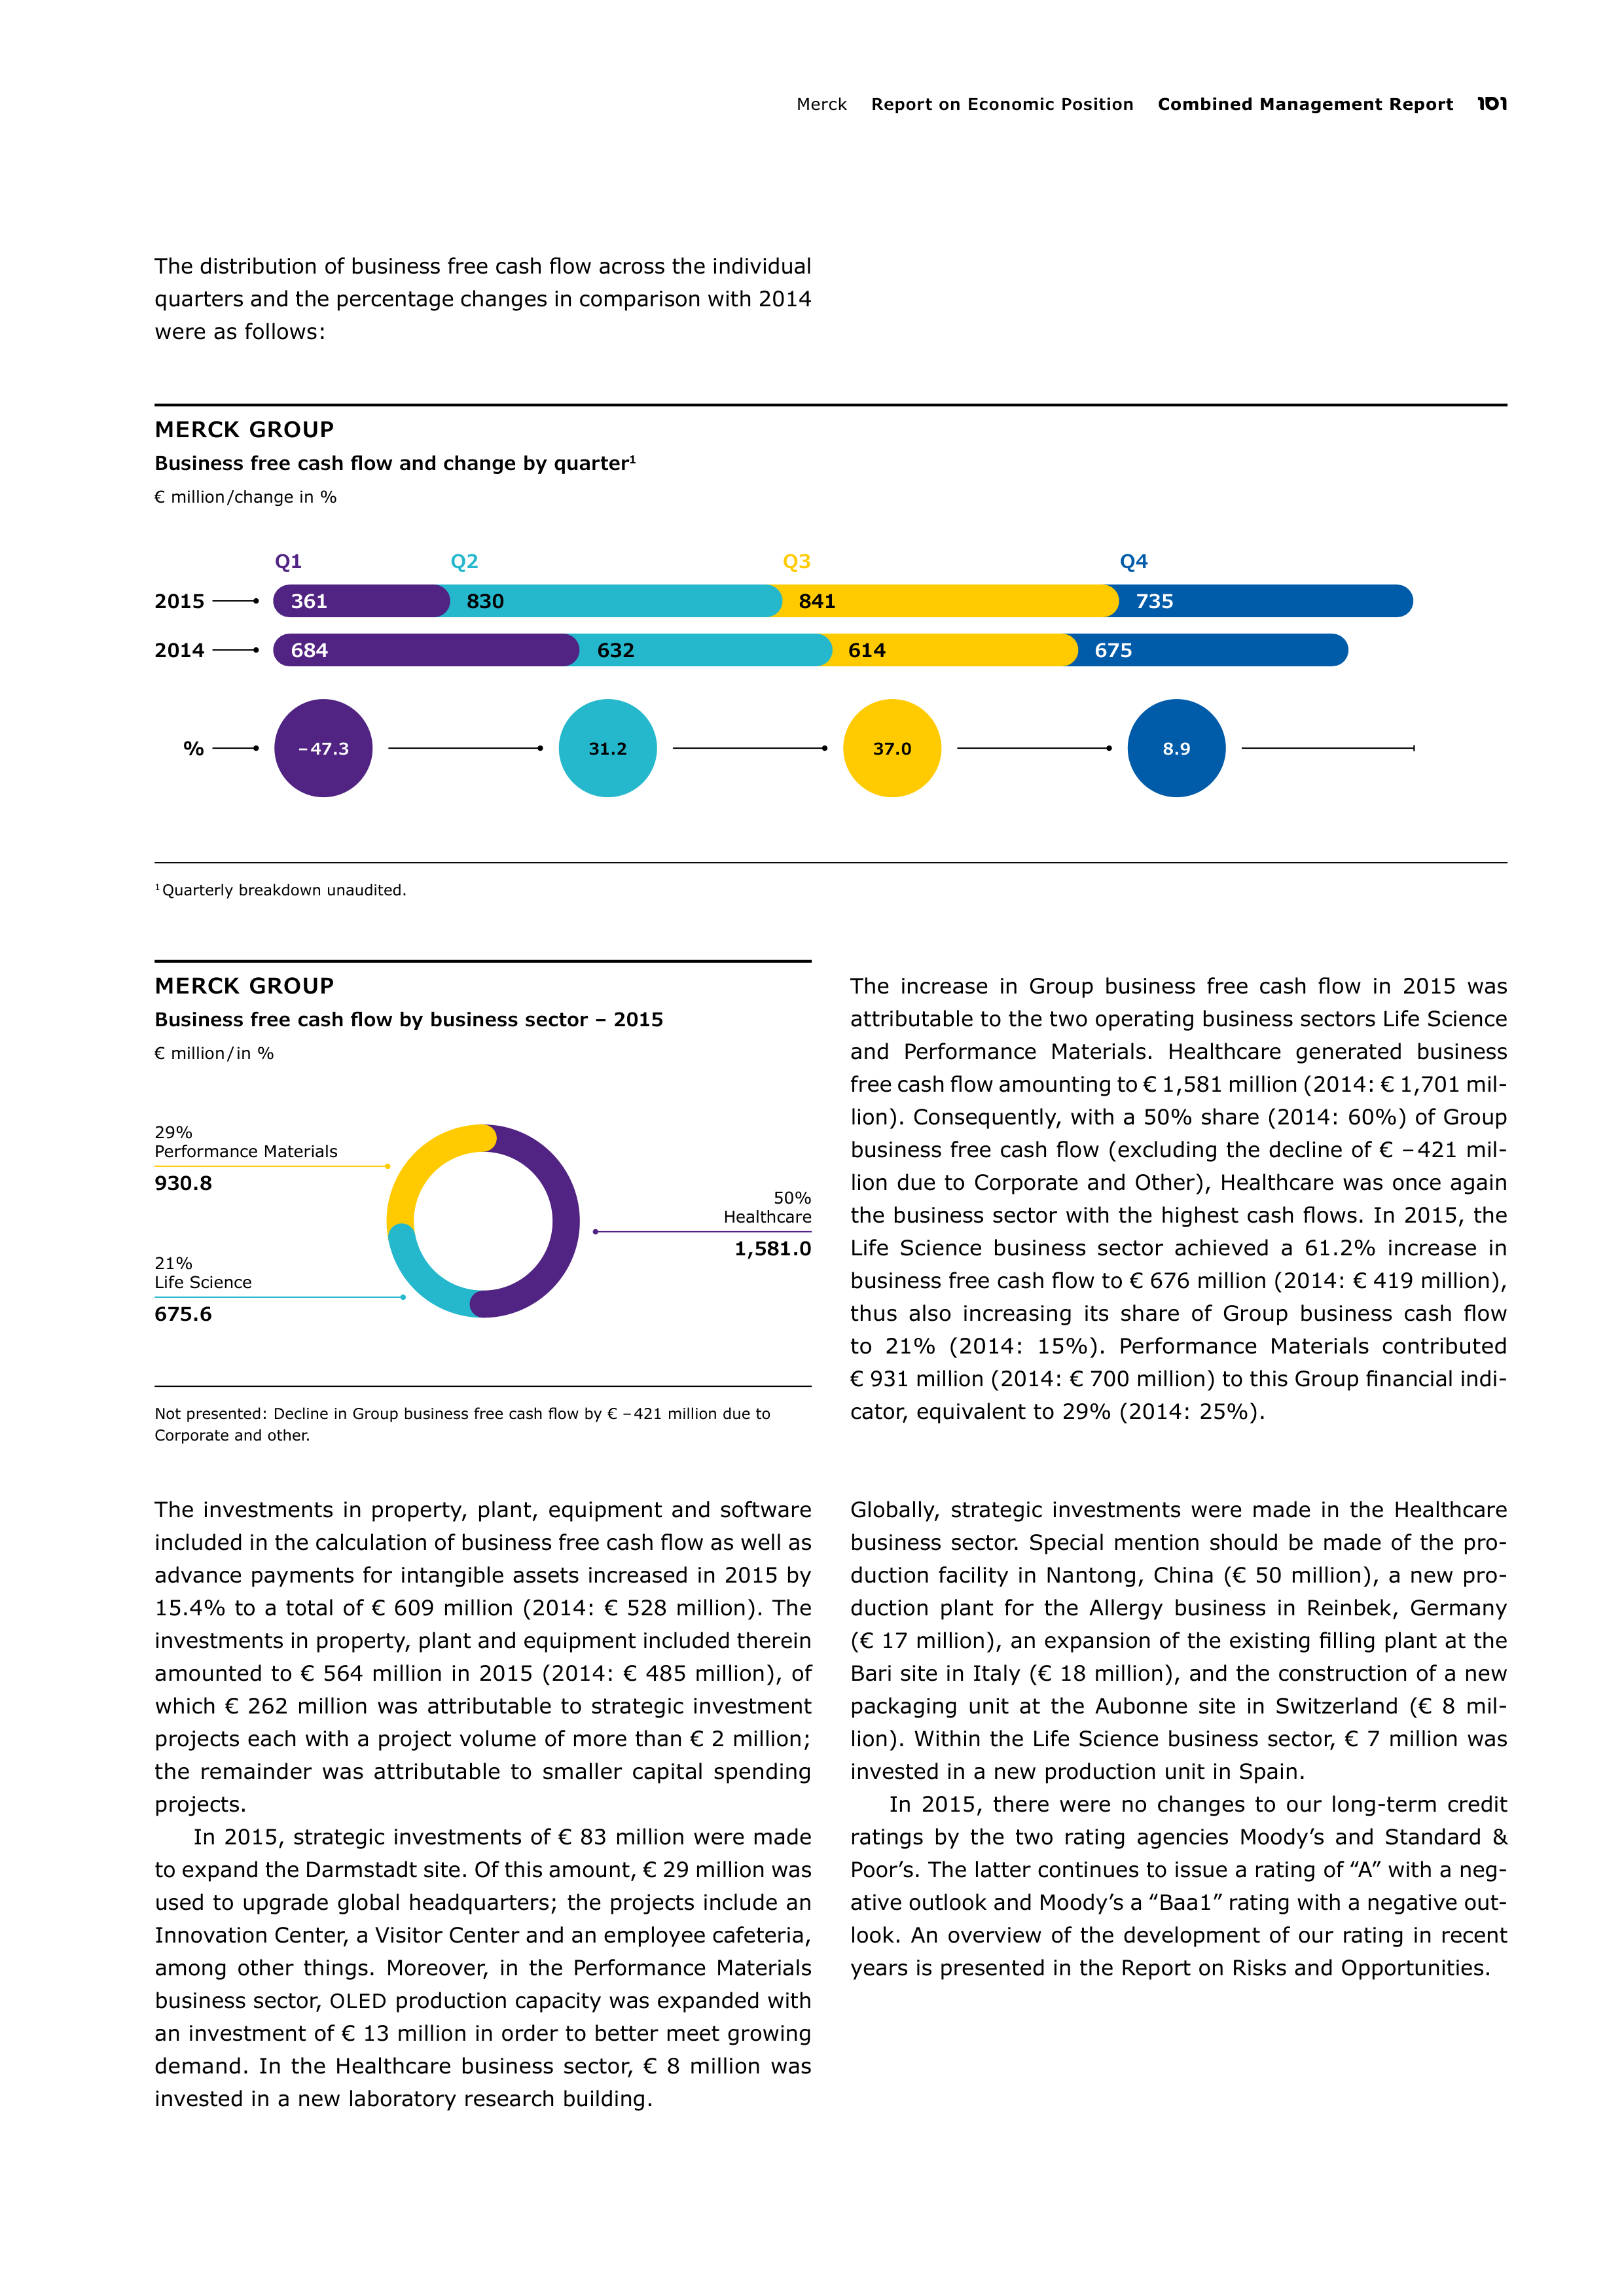
Merc
Report on Economic Position
Combined Management Report
101
MERCK GROUP
Business free cash flow and change by quarter
1
€ million /change in %
1
Quarterly breakdown unaudited.
Q1
Q2
Q3
Q4
2015
2014
%
– 47.3
31.2
37.0
8.9
361
830
841
735
684
632
614
675
Not presented: Decline in Group business free cash flow by € – 421 million due to
Corporate and other.
MERCK GROUP
Business free cash flow by business sector – 2015
€ million / in %
50%
Healthcare
1,581.0
29%
Performance Materials
930.8
21%
Life Science
675.6
The distribution of business free cash flow across the individual
quarters and the percentage changes in comparison with 2014
were as follows:
The increase in Group business free cash flow in 2015 was
attributable to the two operating business sectors Life Science
and Performance Materials. Healthcare generated business
free cash flow amounting to € 1,581 million (2014: € 1,701 mil-
lion). Consequently, with a 50% share (2014: 60%) of Group
business free cash flow (excluding the decline of € – 421 mil-
lion due to Corporate and Other), Healthcare was once again
the business sector with the highest cash flows. In 2015, the
Life Science business sector achieved a 61.2% increase in
business free cash flow to € 676 million (2014: € 419 million),
thus also increasing its share of Group business cash flow
to 21% (2014: 15%). Performance Materials contributed
€ 931 million
(2014: € 700 million) to this Group financial indi-
cator, equivalent to 29% (2014: 25%).
The investments in property, plant, equipment and software
included in the calculation of business free cash flow as well as
advance payments for intangible assets increased in 2015 by
15.4% to a total of € 609 million (2014: € 528 million). The
investments in property, plant and equipment included therein
amounted to € 564 million in 2015 (2014: € 485 million), of
which € 262 million was attributable to strategic investment
projects each with a project volume of more than € 2 million;
the remainder was attributable to smaller capital spending
projects.
In 2015, strategic investments of € 83 million were made
to expand the Darmstadt site. Of this amount, € 29 million was
used to upgrade global headquarters; the projects include an
Innovation Center, a Visitor Center and an employee cafeteria,
among other things. Moreover, in the Performance Materials
business sector,
OLED
production capacity was expanded with
an investment of € 13 million in order to better meet growing
demand. In the Healthcare business sector, € 8 million was
invested in a new laboratory research building.
Globally, strategic investments were made in the Healthcare
business sector. Special mention should be made of the pro-
duction facility in Nantong, China (€ 50 million), a new pro
duction plant for the Allergy business in Reinbek, Germany
(€ 17 million), an expansion of the existing filling plant at the
Bari site in Italy (€ 18 million), and the construction of a new
packaging unit at the Aubonne site in Switzerland (€ 8 mil-
lion). Within the Life Science business sector, € 7 million was
invested in a new production unit in Spain.
In 2015, there were no changes to our long-term credit
ratings by the two rating agencies Moody’s and Standard &
Poor’s. The latter continues to issue a rating of ‟A” with a neg-
ative outlook and Moody’s a ‟Baa1” rating with a negative out-
look. An overview of the development of our rating in recent
years is presented in the Report on Risks and Opportunities.
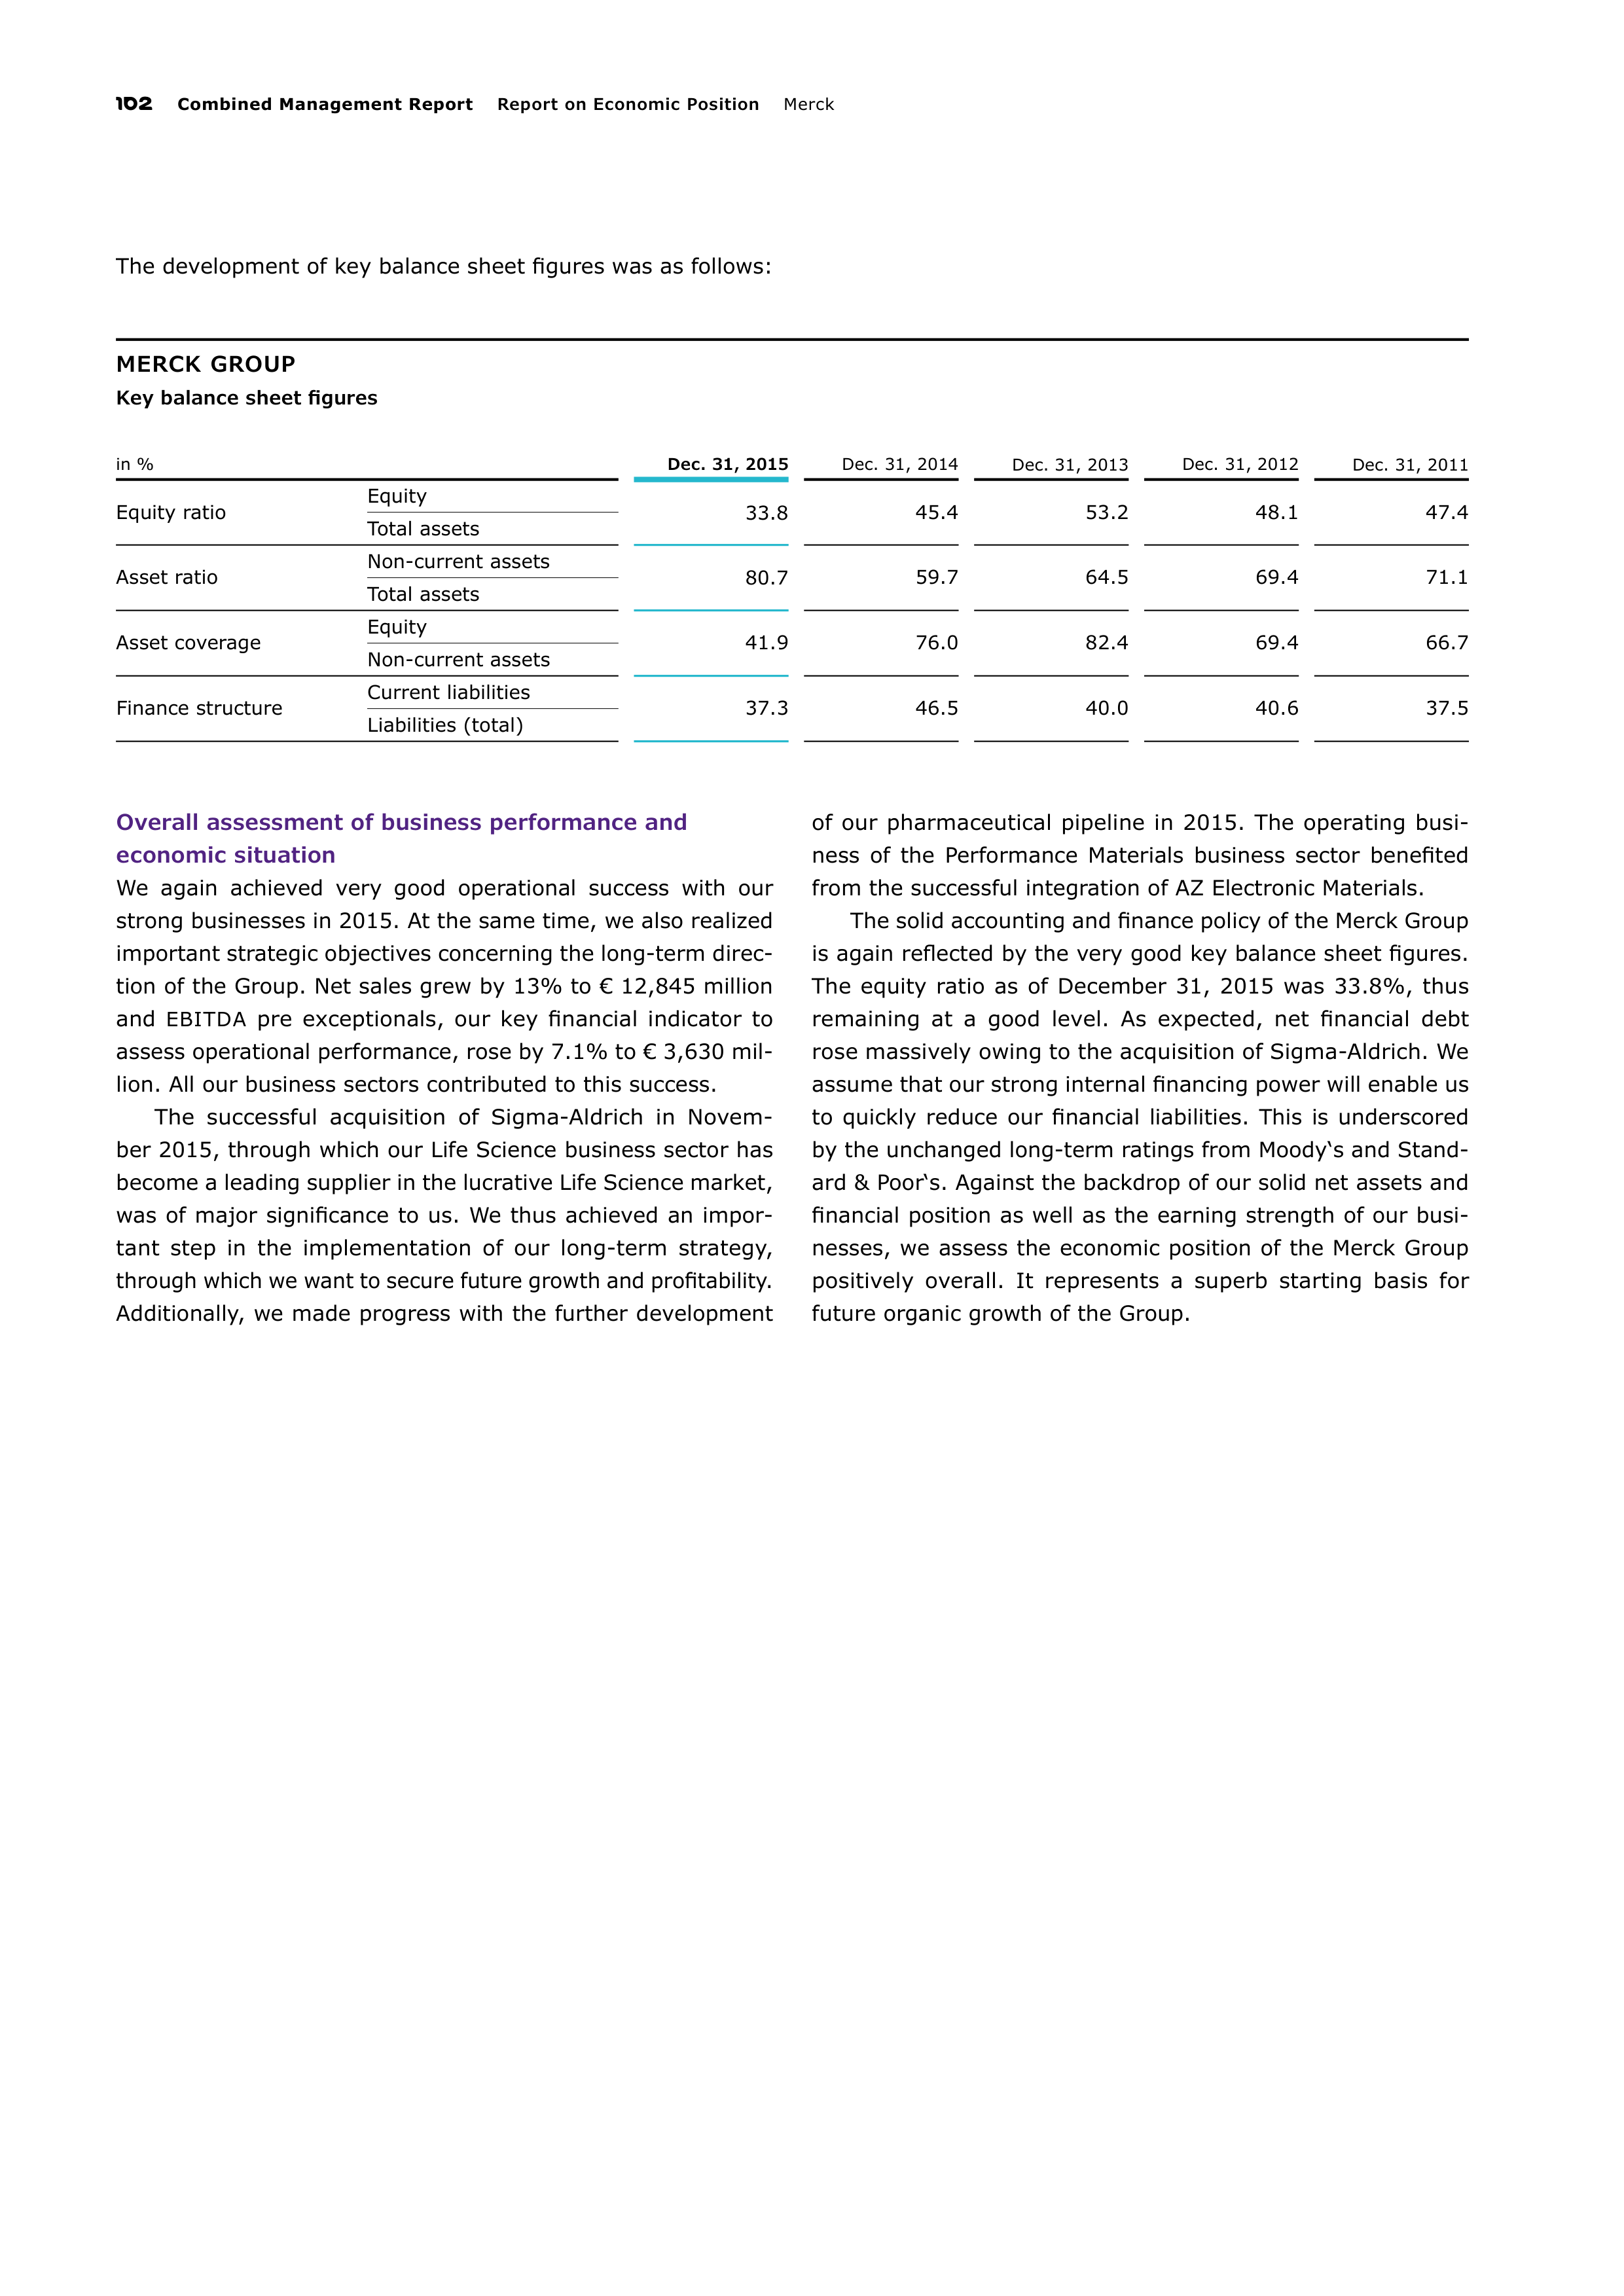
102
Combined Management Report
Report on Economic Position
Merck
The development of key balance sheet figures was as follows:
MERCK GROUP
Key balance sheet figures
in %
Dec. 31, 2015
Dec. 31, 2014
Dec. 31, 2013
Dec. 31, 2012
Dec. 31, 2011
Equity ratio
Equity
33.8
45.4
53.2
48.1
47.4
Total assets
Asset ratio
Non-current assets
80.7
59.7
64.5
69.4
71.1
Total assets
Asset coverage
Equity
41.9
76.0
82.4
69.4
66.7
Non-current assets
Finance structure
Current liabilities
37.3
46.5
40.0
40.6
37.5
Liabilities (total)
Overall assessment of business performance and
economic situation
We again achieved very good operational success with our
strong businesses in 2015. At the same time, we also realized
important strategic objectives concerning the long-term direc-
tion of the Group. Net sales grew by 13% to € 12,845 million
and
EBITDA
pre exceptionals, our key financial indicator to
assess operational performance, rose by 7.1% to € 3,630 mil-
lion. All our business sectors contributed to this success.
The successful acquisition of Sigma-Aldrich in Novem-
ber 2015, through which our Life Science business sector has
become a leading supplier in the lucrative Life Science market,
was of major significance to us. We thus achieved an impor-
tant step in the implementation of our long-term strategy,
through which we want to secure future growth and profitability.
Additionally, we made progress with the further development
of our pharmaceutical pipeline in 2015. The operating busi-
ness of the Performance Materials business sector benefited
from the successful integration of AZ Electronic Materials.
The solid accounting and finance policy of the Merck Group
is again reflected by the very good key balance sheet figures.
The equity ratio as of December 31, 2015 was 33.8%, thus
remaining at a good level. As expected, net financial debt
rose massively owing to the acquisition of Sigma-Aldrich. We
assume that our strong internal financing power will enable us
to quickly reduce our financial liabilities. This is underscored
by the unchanged long-term ratings from Moody‘s and Stand-
ard & Poor‘s. Against the backdrop of our solid net assets and
financial position as well as the earning strength of our busi-
nesses, we assess the economic position of the Merck Group
positively overall. It represents a superb starting basis for
future organic growth of the Group.
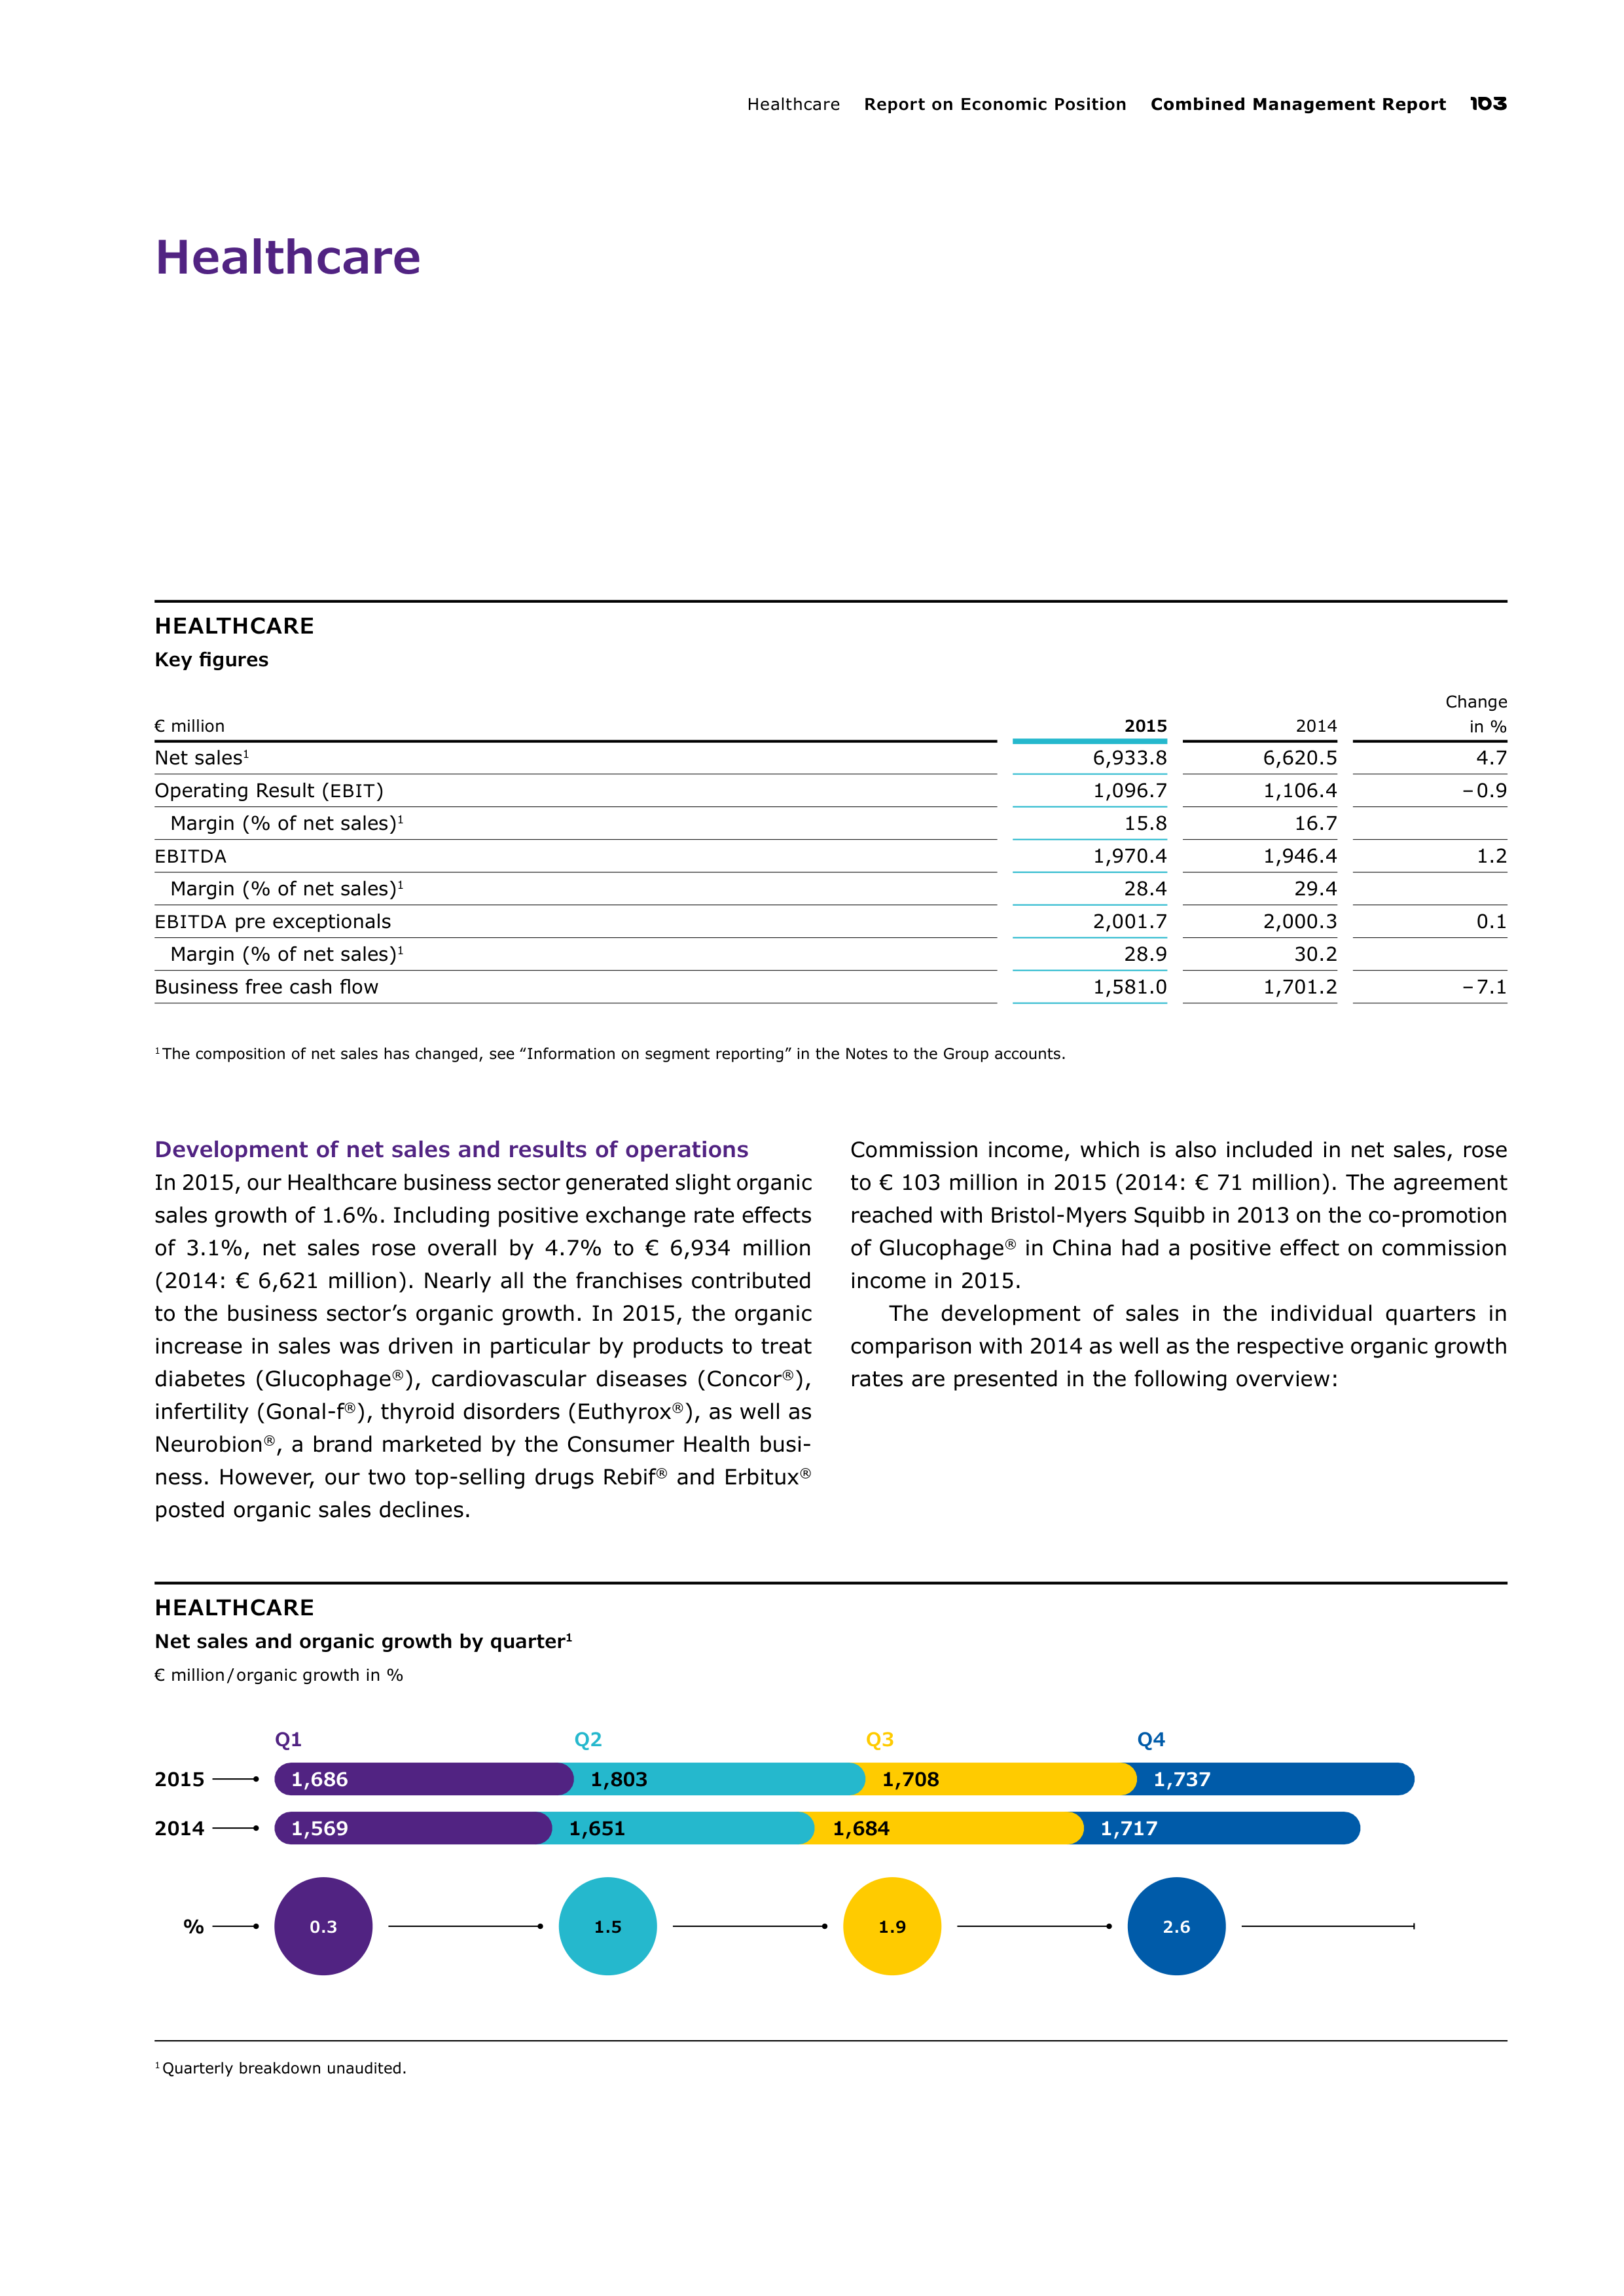
Healthcar
Report on Economic Position
Combined Management Report
103
HEALTHCARE
Net sales and organic growth by quarter
1
€ million / organic growth in %
1
Quarterly breakdown unaudited.
2015
2014
Q1
Q2
Q3
Q4
1,686
1,803
1,708
1,737
1,569
1,651
1,684
1,717
%
0.3
1.5
1.9
2.6
Healthcare
HEALTHCARE
Key figures
€ million
2015
2014
Change
in %
Net sales
1
6,933.8
6,620.5
4.7
Operating Result (
EBIT
)
1,096.7
1,106.4
– 0.9
Margin (% of net sales)
1
15.8
16.7
EBITDA
1,970.4
1,946.4
1.2
Margin (% of net sales)
1
28.4
29.4
EBITDA
pre exceptionals
2,001.7
2,000.3
0.1
Margin (% of net sales)
1
28.9
30.2
Business free cash flow
1,581.0
1,701.2
– 7.1
1
The composition of net sales has changed, see ‟Information on segment reporting” in the Notes to the Group accounts.
Development of net sales and results of operations
In 2015, our Healthcare business sector generated slight organic
sales growth of 1.6%. Including positive exchange rate effects
of 3.1%, net sales rose overall by 4.7% to € 6,934 million
(2014: € 6,621 million). Nearly all the franchises contributed
to the business sector’s organic growth. In 2015, the organic
increase in sales was driven in particular by products to treat
diabetes (Glucophage
®
), cardiovascular diseases (Concor
®
),
infertility (Gonal-f
®
), thyroid disorders (Euthyrox
®
), as well as
Neurobion
®
, a brand marketed by the Consumer Health busi-
ness. However, our two top-selling drugs Rebif
®
and Erbitux
®
posted organic sales declines.
Commission income, which is also included in net sales, rose
to € 103 million in 2015 (2014: € 71 million). The agreement
reached with Bristol-Myers Squibb in 2013 on the co-promotion
of Glucophage
®
in China had a positive effect on commission
income in 2015.
The development of sales in the individual quarters in
comparison with 2014 as well as the respective organic growth
rates are presented in the following overview:
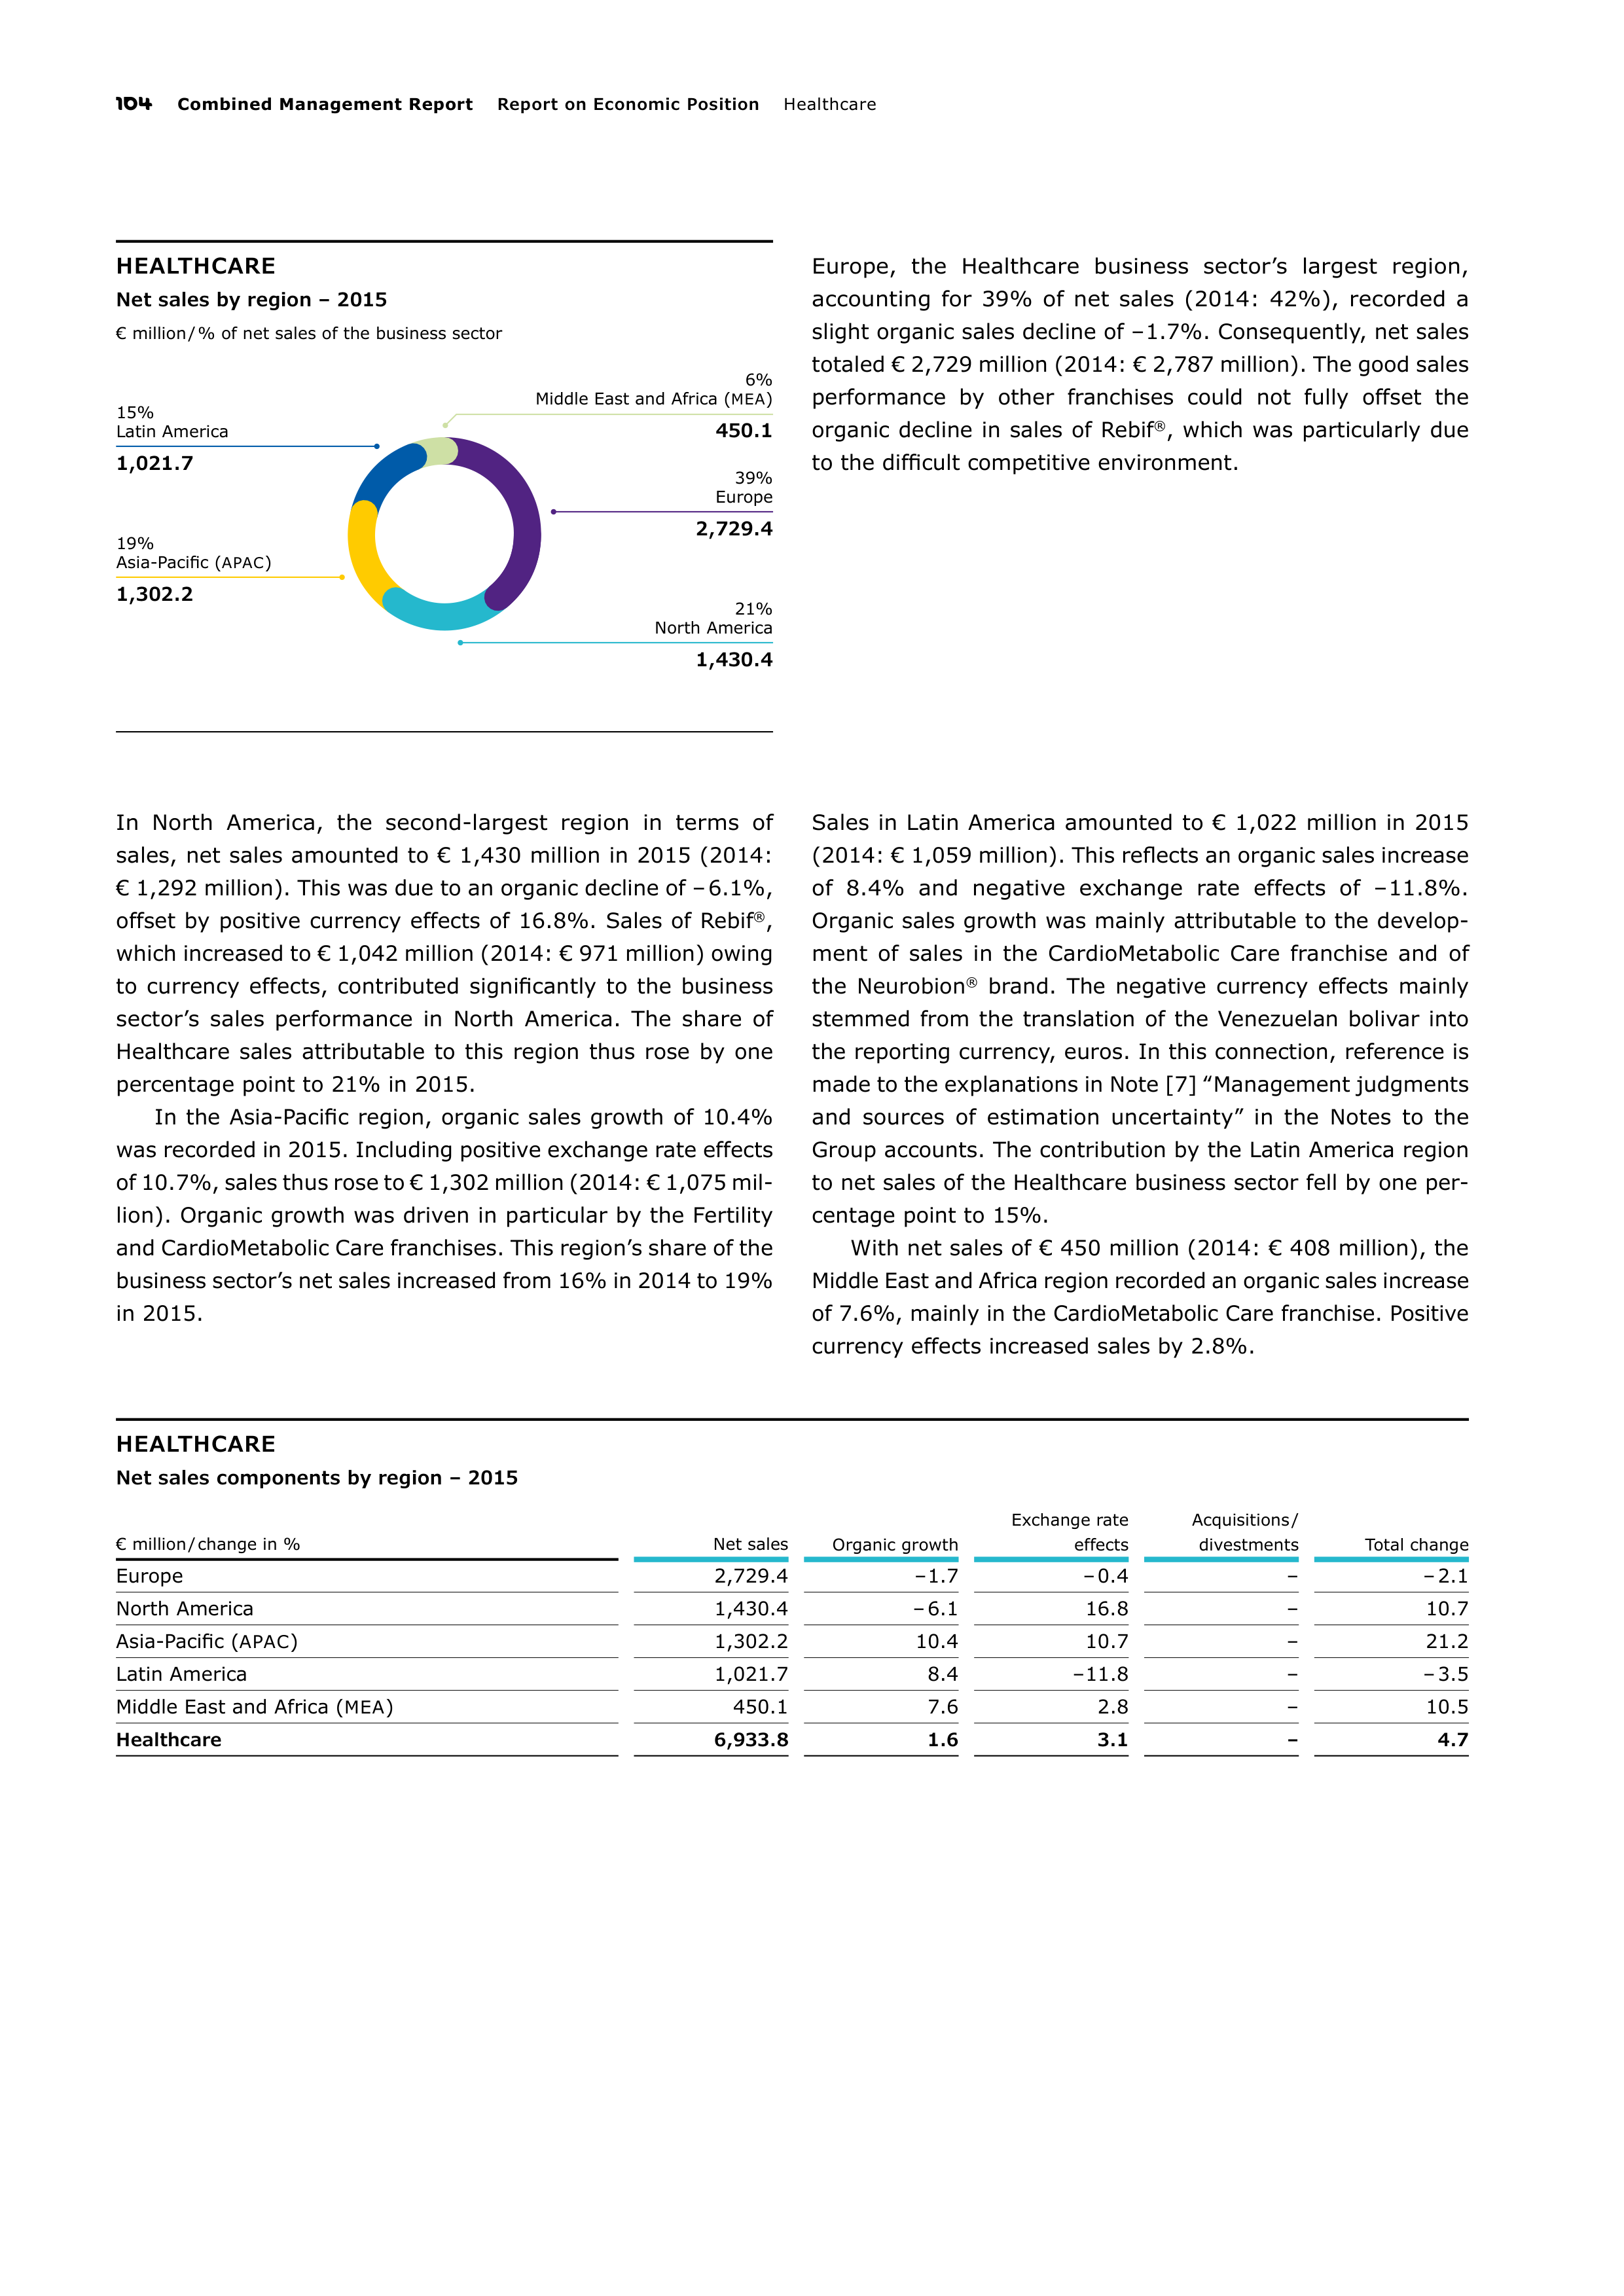
104
Combined Management Report
Report on Economic Position
Healthcar
HEALTHCARE
Net sales by region – 2015
€ million / % of net sales of the business sector
39%
Europe
2,729.4
19%
Asia-Pacific (
APAC
)
1,302.2
21%
North America
1,430.4
15%
Latin America
1,021.7
6%
Middle East and Africa (
MEA
)
450.1
Europe, the Healthcare business sector’s largest region,
accounting for 39% of net sales (2014: 42%), recorded a
slight organic sales decline of – 1.7%. Consequently, net sales
totaled € 2,729 million (2014: € 2,787 million). The good sales
performance by other franchises could not fully offset the
organic decline in sales of Rebif
®
, which was particularly due
to the difficult competitive environment.
In North America, the second-largest region in terms of
sales, net sales amounted to € 1,430 million in 2015 (2014:
€ 1,292 million). This was due to an organic decline of – 6.1%,
offset by positive currency effects of 16.8%. Sales of Rebif
®
,
which increased to € 1,042 million (2014: € 971 million) owing
to currency effects, contributed significantly to the business
sector’s sales performance in North America. The share of
Healthcare sales attributable to this region thus rose by one
percentage point to 21% in 2015.
In the Asia-Pacific region, organic sales growth of 10.4%
was recorded in 2015. Including positive exchange rate effects
of 10.7%, sales thus rose to € 1,302 million (2014: € 1,075 mil-
lion). Organic growth was driven in particular by the Fertility
and CardioMetabolic Care franchises. This region’s share of the
business sector’s net sales increased from 16% in 2014 to
19%
in 2015.
Sales in Latin America amounted to € 1,022 million in 2015
(2014: € 1,059 million). This reflects an organic sales increase
of 8.4% and negative exchange rate effects of – 11.8%.
Organic sales growth was mainly attributable to the develop-
ment of sales in the CardioMetabolic Care franchise and of
the
Neurobion
®
brand. The negative currency effects mainly
stemmed from the translation of the Venezuelan bolivar into
the reporting currency, euros. In this connection, reference is
made to the explanations in Note [7] ‟Management judgments
and sources of estimation uncertainty” in the Notes to the
Group accounts. The contribution by the Latin America region
to net sales of the Healthcare business sector fell by one per-
centage point to 15%.
With net sales of € 450 million (2014: € 408 million), the
Middle East and Africa region recorded an organic sales increase
of 7.6%, mainly in the CardioMetabolic Care franchise. Positive
currency effects increased sales by 2.8%.
HEALTHCARE
Net sales components by region – 2015
€ million / change in %
Net sales
Organic growth
Exchange rate
effects
Acquisitions /
divestments
Total change
Europe
2,729.4
– 1.7
– 0.4
–
– 2.1
North America
1,430.4
– 6.1
16.8
–
10.7
Asia-Pacific (
APAC
)
1,302.2
10.4
10.7
–
21.2
Latin America
1,021.7
8.4
– 11.8
–
– 3.5
Middle East and Africa (
MEA
)
450.1
7.6
2.8
–
10.5
Healthcare
6,933.8
1.6
3.1
–
4.7
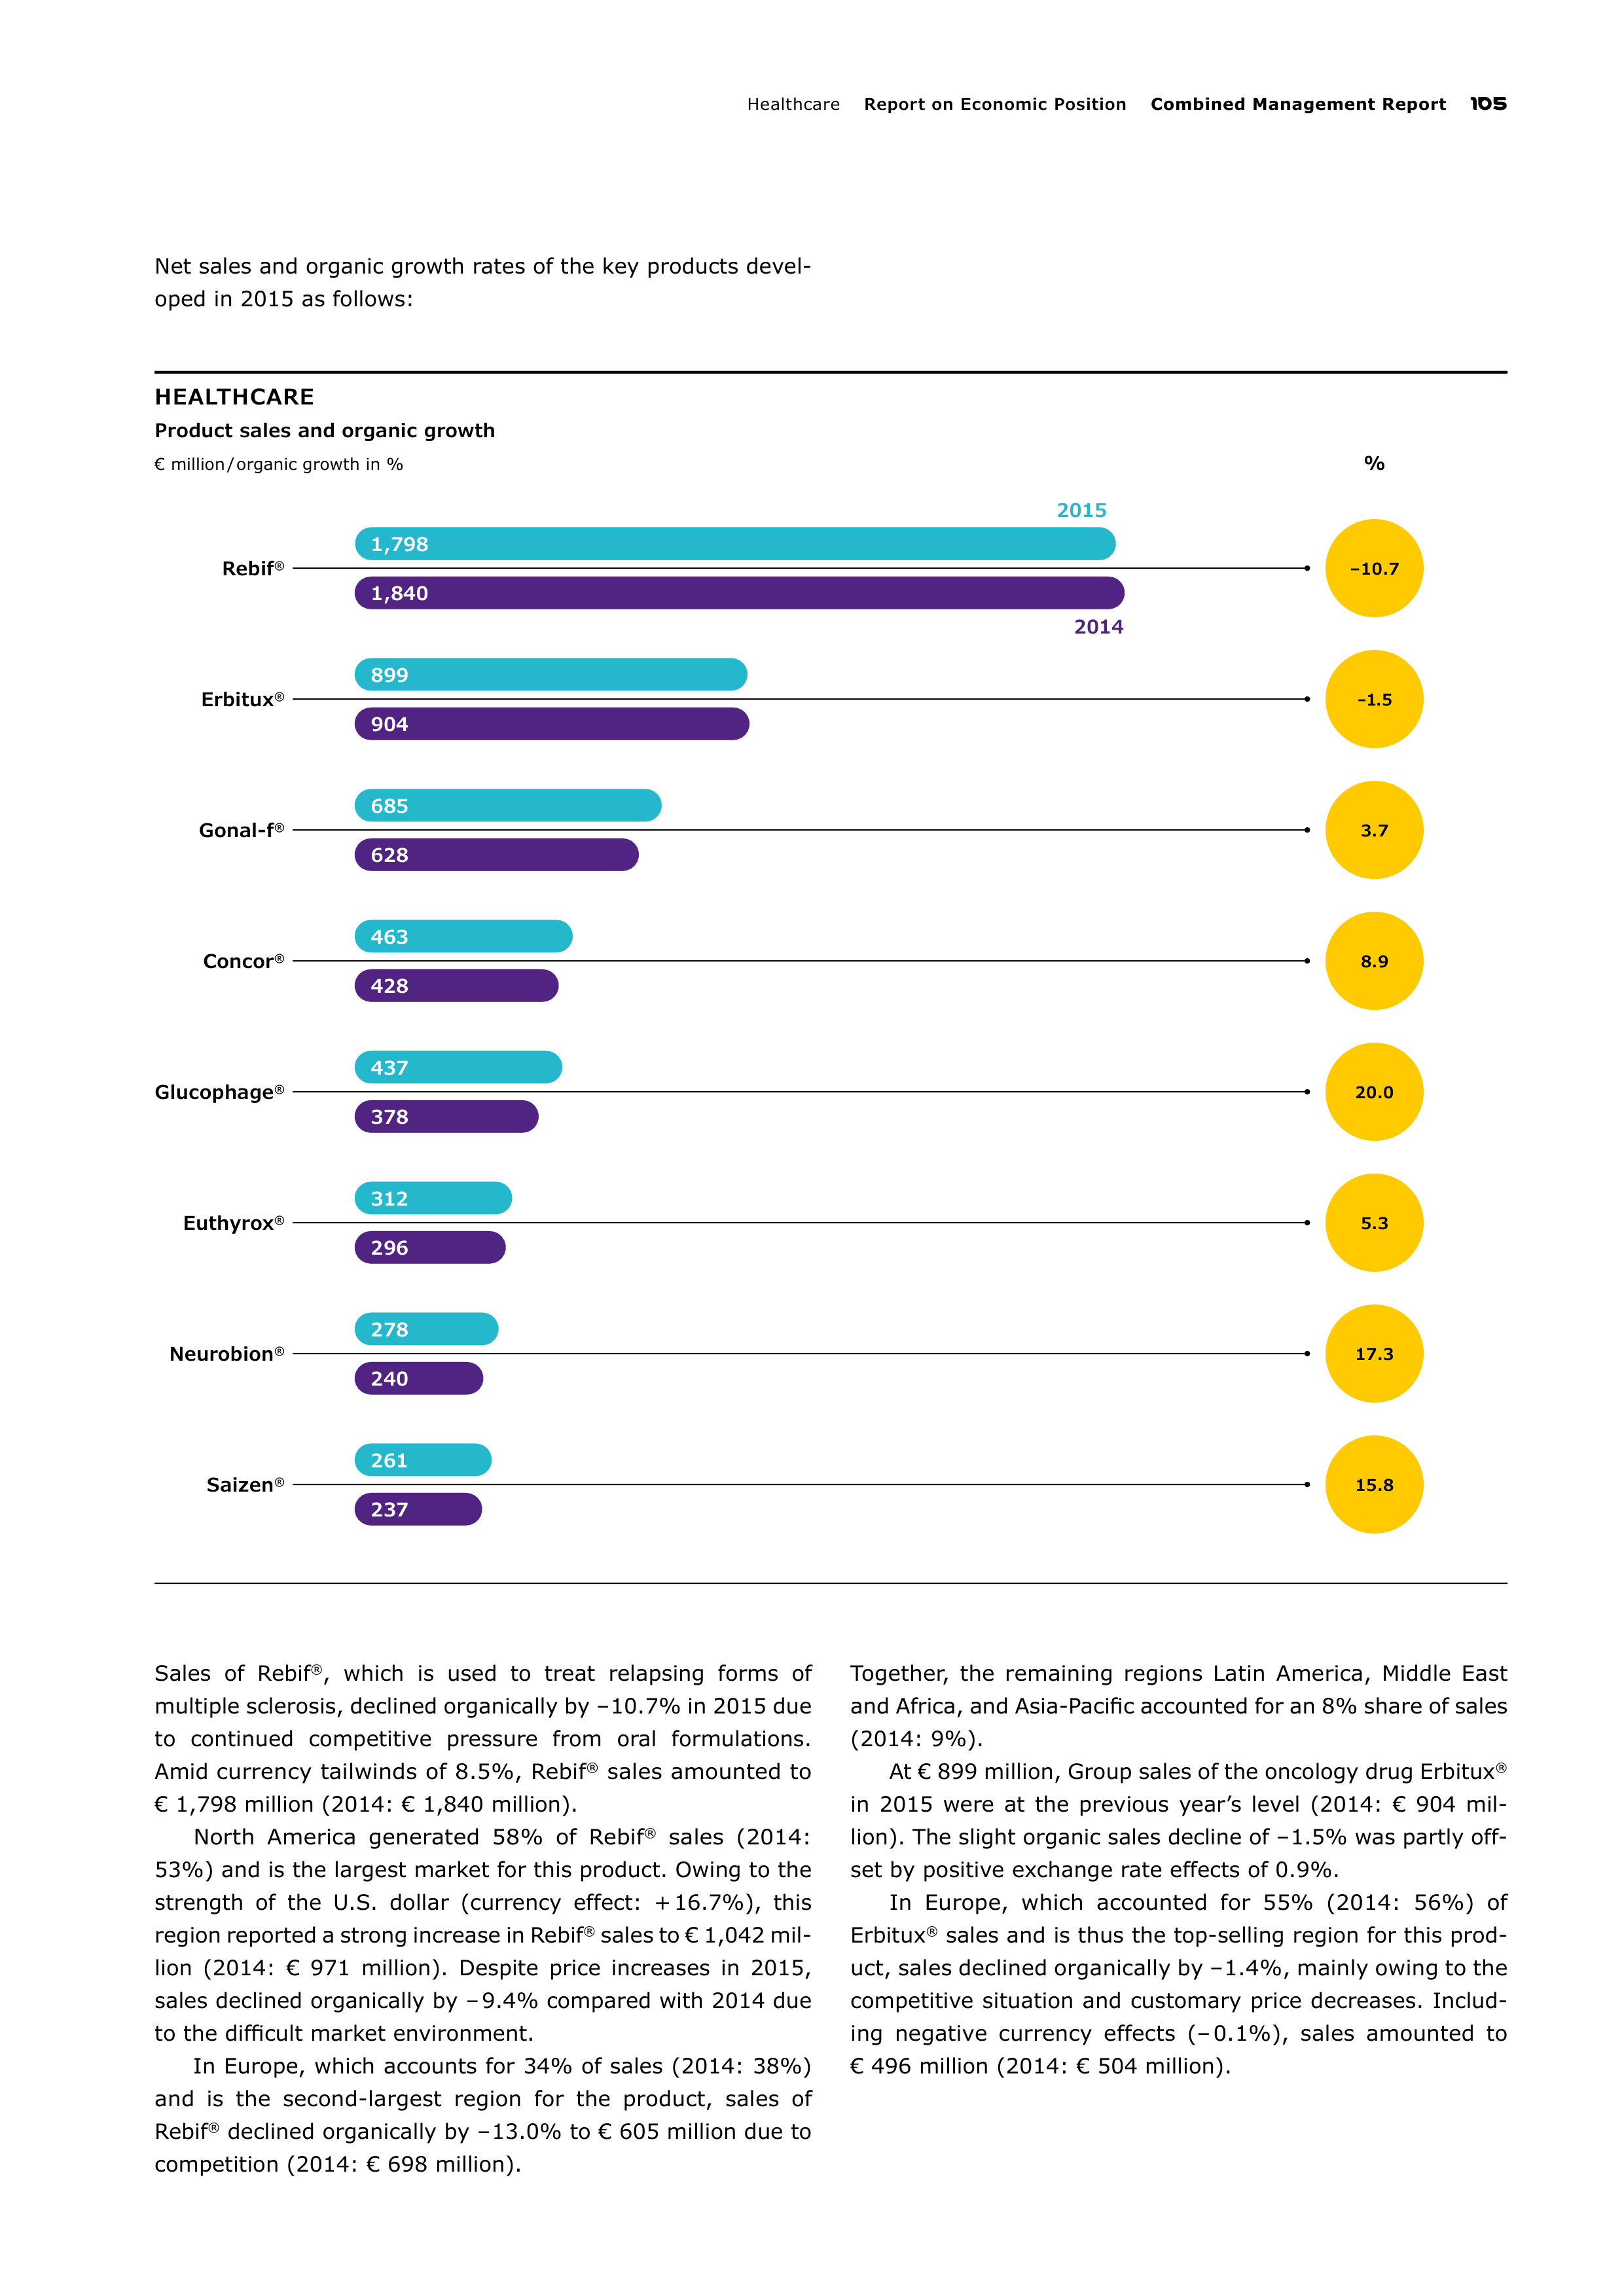
Healthcar
Report on Economic Position
Combined Management Report
105
HEALTHCARE
Product sales and organic growth
€ million / organic growth in %
%
– 10.7
–
1.5
3.7
8.9
20.0
5.3
17.3
Rebif
®
Erbitux
®
1,798
Gonal-f
®
Concor
®
Glucophage
®
Euthyrox
®
Neurobion
®
1,840
899
904
685
628
463
428
437
378
312
296
2014
2015
278
240
15.8
Saizen
®
261
237
Net sales and organic growth rates of the key products devel-
oped in 2015 as follows:
Sales of Rebif
®
, which is used to treat relapsing forms of
multiple sclerosis, declined organically by – 10.7% in 2015 due
to continued competitive pressure from oral formulations.
Amid
currency tailwinds of 8.5%, Rebif
®
sales amounted to
€ 1,798 million (2014: € 1,840 million).
North America generated 58% of Rebif
®
sales (2014:
53%) and is the largest market for this product. Owing to the
strength of the U.S. dollar (currency effect: + 16.7%), this
region reported a strong increase in Rebif
®
sales to € 1,042 mil-
lion (2014: € 971 million). Despite price increases in 2015,
sales declined organically by – 9.4% compared with 2014 due
to the difficult market environment.
In Europe, which accounts for 34% of sales (2014: 38%)
and is the second-largest region for the product, sales of
Rebif
®
declined organically by – 13.0% to € 605 million due to
competition (2014: € 698 million).
Together, the remaining regions Latin America, Middle East
and Africa, and Asia-Pacific accounted for an 8% share of sales
(2014: 9%).
At € 899 million, Group sales of the oncology drug Erbitux
®
in 2015 were at the previous year’s level (2014: € 904 mil-
lion). The slight organic sales decline of – 1.5% was partly off-
set by positive exchange rate effects of 0.9%.
In Europe, which accounted for 55% (2014: 56%) of
Erbitux
®
sales and is thus the top-selling region for this prod-
uct, sales declined organically by – 1.4%, mainly owing to the
competitive situation and customary price decreases. Includ-
ing negative currency effects (– 0.1%), sales amounted to
€ 496 million (2014: € 504 million).
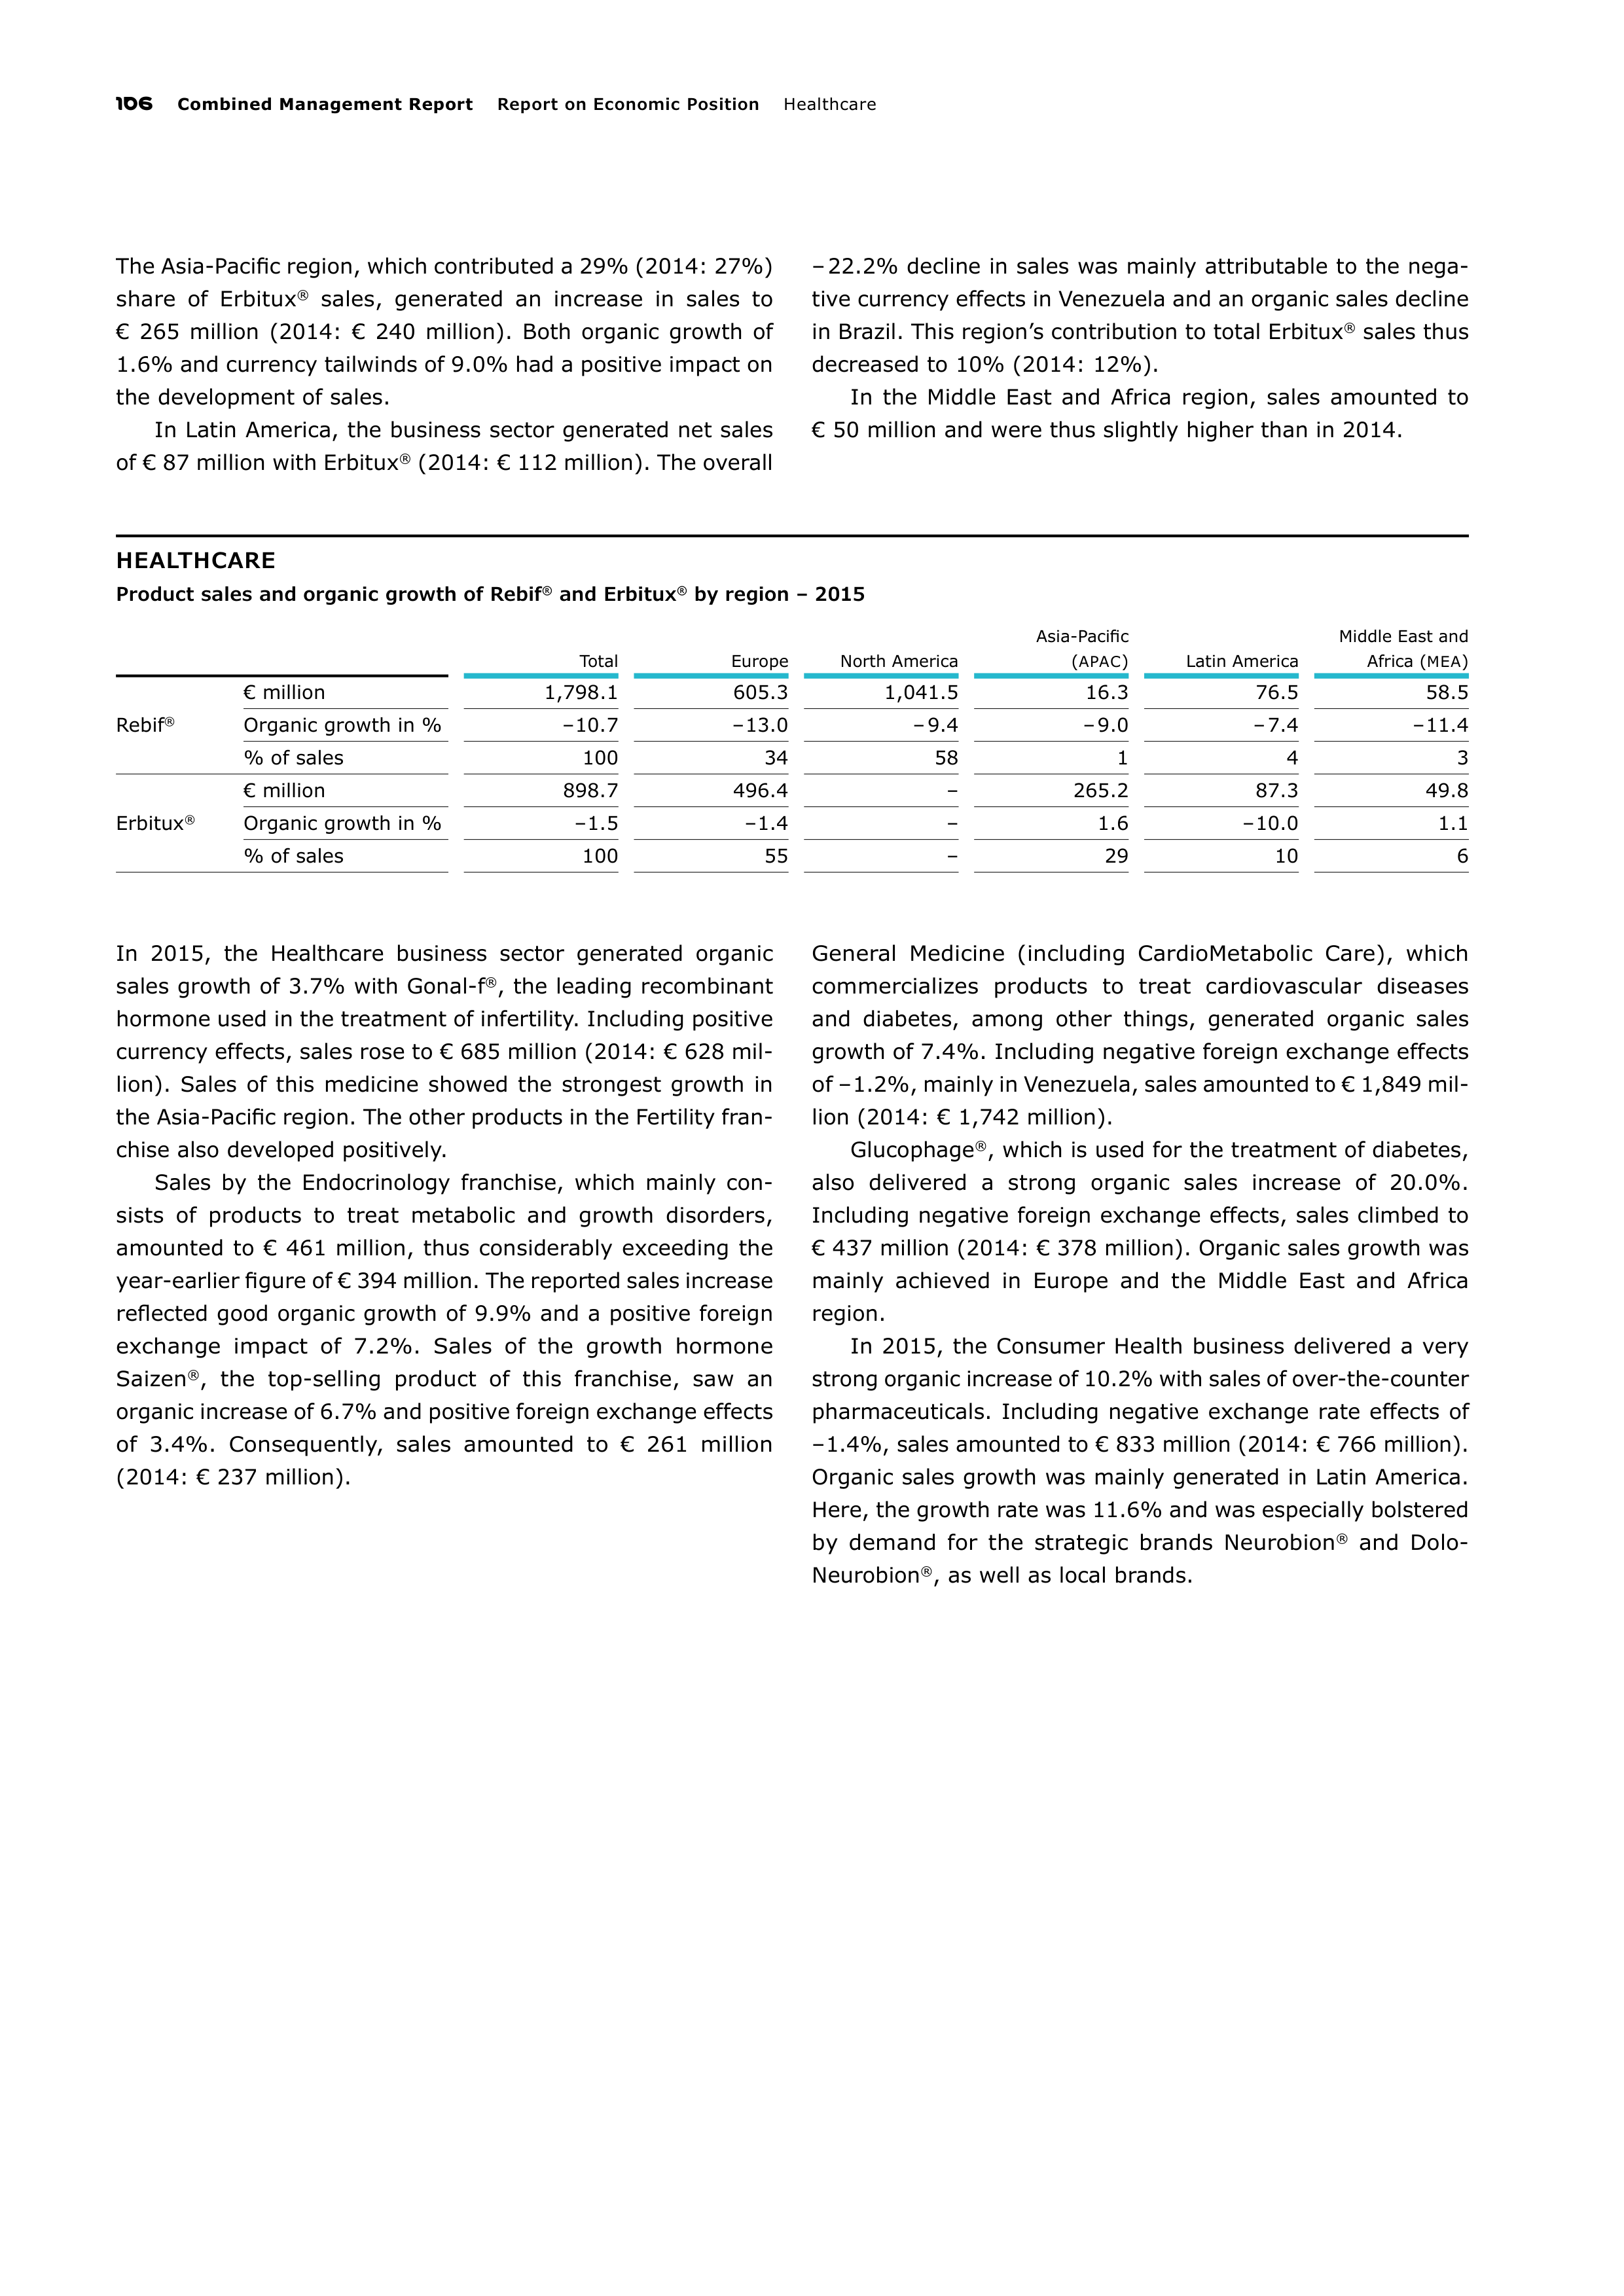
106
Combined Management Report
Report on Economic Position
Healthcar
The Asia-Pacific region, which contributed a 29% (2014: 27%)
share of Erbitux
®
sales, generated an increase in sales to
€ 265 million (2014: € 240 million). Both organic growth of
1.6% and currency tailwinds of 9.0% had a positive impact on
the development of sales.
In Latin America, the business sector generated net sales
of € 87 million with Erbitux
®
(2014: € 112 million). The overall
– 22.2% decline in sales was mainly attributable to the nega-
tive currency effects in Venezuela and an organic sales decline
in Brazil. This region’s contribution to total Erbitux
®
sales thus
decreased to 10% (2014: 12%).
In the Middle East and Africa region, sales amounted to
€ 50 million and were thus slightly higher than in 2014.
HEALTHCARE
Product sales and organic growth of Rebif
®
and Erbitux
®
by region – 2015
Total
Europe
North America
Asia-Pacific
(
APAC
)
Latin America
Middle East and
Africa (
MEA
)
Rebif
®
€ million
1,798.1
605.3
1,041.5
16.3
76.5
58.5
Organic growth in %
– 10.7
– 13.0
– 9.4
– 9.0
– 7.4
– 11.4
% of sales
100
34
58
1
4
3
Erbitux
®
€ million
898.7
496.4
–
265.2
87.3
49.8
Organic growth in %
– 1.5
– 1.4
–
1.6
– 10.0
1.1
% of sales
100
55
–
29
10
6
In 2015, the Healthcare business sector generated organic
sales growth of 3.7% with Gonal-f
®
, the leading recombinant
hormone used in the treatment of infertility. Including positive
currency effects, sales rose to € 685 million (2014: € 628 mil-
lion). Sales of this medicine showed the strongest growth in
the Asia-Pacific region. The other products in the Fertility fran-
chise also developed positively.
Sales by the Endocrinology franchise, which mainly con-
sists of products to treat metabolic and growth disorders,
amounted to € 461 million, thus considerably exceeding the
year-earlier figure of € 394 million. The reported sales increase
reflected good organic growth of 9.9% and a positive foreign
exchange impact of 7.2%. Sales of the growth hormone
Saizen
®
, the top-selling product of this franchise, saw an
organic increase of 6.7% and positive foreign exchange effects
of 3.4%. Consequently, sales amounted to € 261 million
(2014: € 237 million).
General Medicine (including CardioMetabolic Care), which
commercializes products to treat cardiovascular diseases
and diabetes, among other things, generated organic sales
growth
of 7.4%. Including negative foreign exchange effects
of
– 1.2%, mainly in Venezuela, sales amounted to € 1,849 mil-
lion (2014: € 1,742 million).
Glucophage
®
, which is used for the treatment of diabetes,
also delivered a strong organic sales increase of 20.0%.
Including negative foreign exchange effects, sales climbed to
€ 437 million (2014: € 378 million). Organic sales growth was
mainly achieved in Europe and the Middle East and Africa
region.
In 2015, the Consumer Health business delivered a very
strong organic increase of 10.2% with sales of over-the-counter
pharmaceuticals. Including negative exchange rate effects of
– 1.4%, sales amounted to € 833 million (2014: € 766 million).
Organic sales growth was mainly generated in Latin America.
Here, the growth rate was 11.6% and was especially bolstered
by demand for the strategic brands Neurobion
®
and Dolo-
Neurobion
®
, as well as local brands.
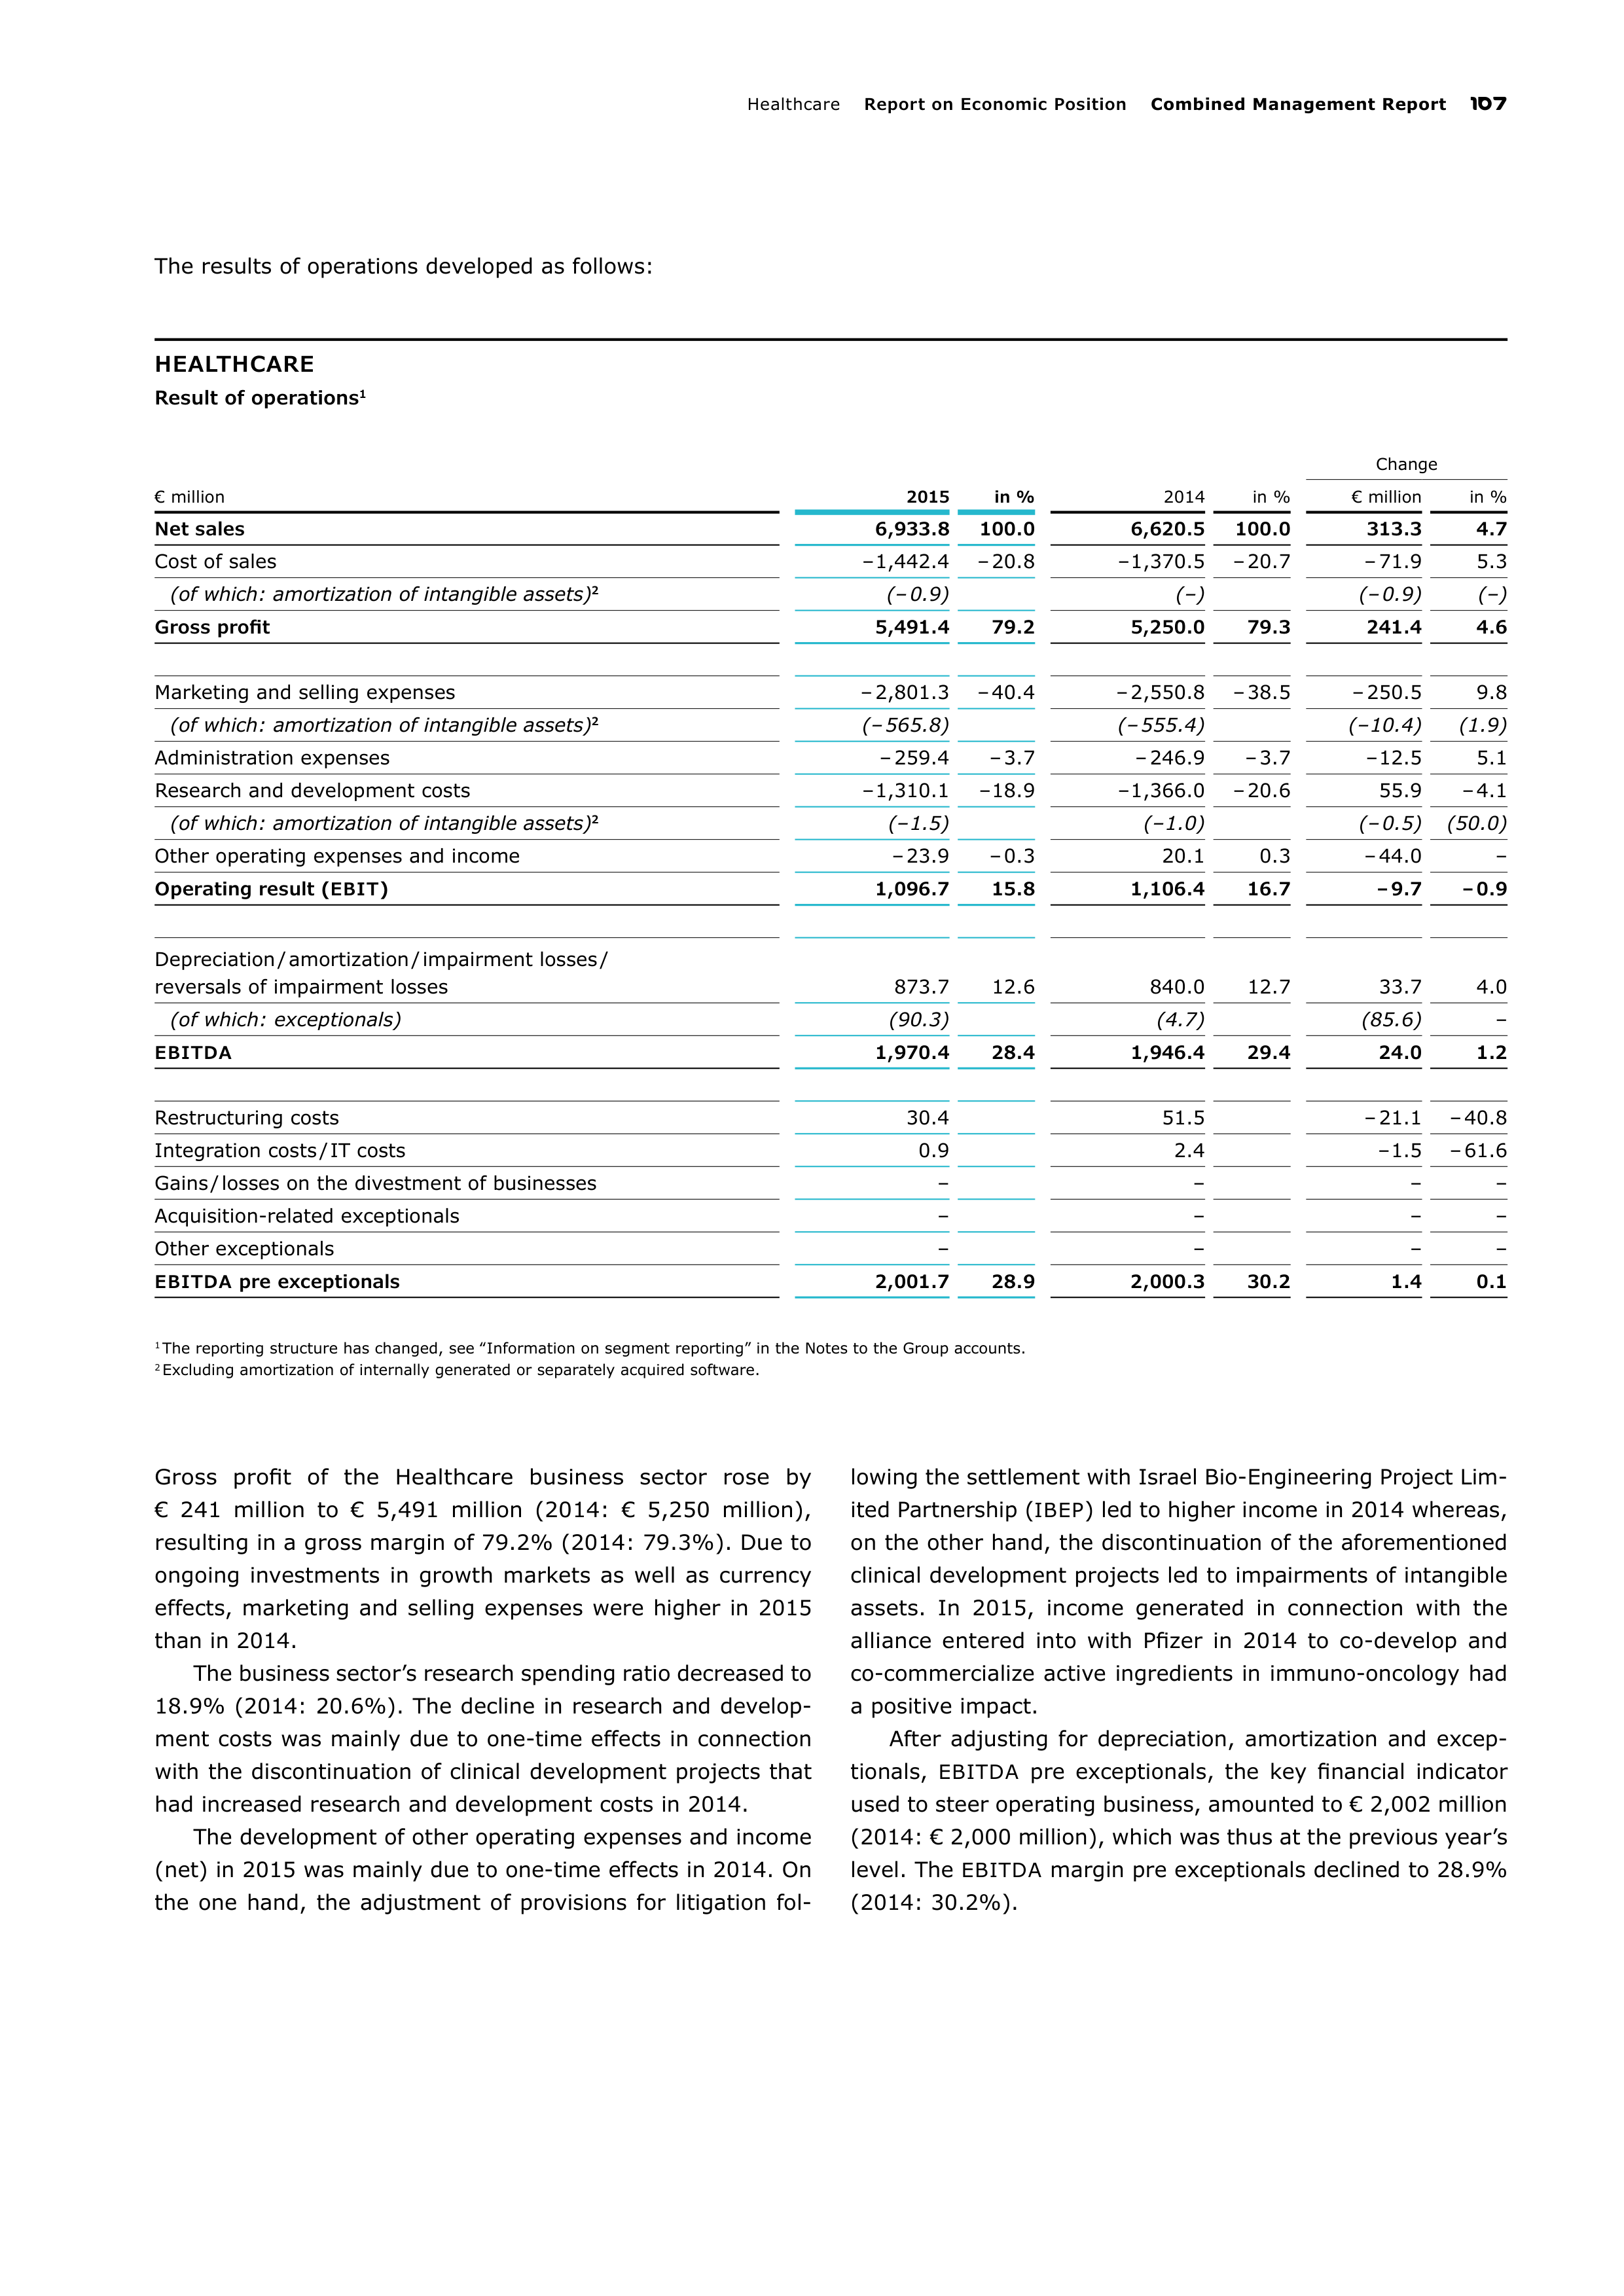
Healthcar
Report on Economic Position
Combined Management Report
107
The results of operations developed as follows:
HEALTHCARE
Result of operations
1
Change
€ million
2015
in %
2014
in %
€ million
in %
Net sales
6,933.8
100.0
6,620.5
100.0
313.3
4.7
Cost of sales
– 1,442.4
– 20.8
– 1,370.5
– 20.7
– 71.9
5.3
(of which: amortization of intangible assets)
2
(– 0.9)
(–)
(– 0.9)
(–)
Gross profit
5,491.4
79.2
5,250.0
79.3
241.4
4.6
Marketing and selling expenses
– 2,801.3
– 40.4
– 2,550.8
– 38.5
– 250.5
9.8
(of which: amortization of intangible assets)
2
(– 565.8)
(– 555.4)
(– 10.4)
(1.9)
Administration expenses
– 259.4
– 3.7
– 246.9
– 3.7
– 12.5
5.1
Research and development costs
– 1,310.1
– 18.9
– 1,366.0
– 20.6
55.9
– 4.1
(of which: amortization of intangible assets)
2
(– 1.5)
(– 1.0)
(– 0.5)
(50.0)
Other operating expenses and income
– 23.9
– 0.3
20.1
0.3
– 44.0
–
Operating result (
EBIT
)
1,096.7
15.8
1,106.4
16.7
– 9.7
– 0.9
Depreciation / amortization / impairment losses /
reversals of impairment losses
873.7
12.6
840.0
12.7
33.7
4.0
(of which: exceptionals)
(90.3)
(4.7)
(85.6)
–
EBITDA
1,970.4
28.4
1,946.4
29.4
24.0
1.2
Restructuring costs
30.4
51.5
– 21.1
– 40.8
Integration costs / IT costs
0.9
2.4
– 1.5
– 61.6
Gains / losses on the divestment of businesses
–
–
–
–
Acquisition-related exceptionals
–
–
–
–
Other exceptionals
–
–
–
–
EBITDA
pre exceptionals
2,001.7
28.9
2,000.3
30.2
1.4
0.1
1
The reporting structure has changed, see ‟Information on segment reporting” in the Notes to the Group accounts.
2
Excluding amortization of internally generated or separately acquired software.
Gross profit of the Healthcare business sector rose by
€ 241 million to € 5,491 million (2014: € 5,250 million),
resulting in a gross margin of 79.2% (2014: 79.3%). Due to
ongoing investments in growth markets as well as currency
effects, marketing and selling expenses were higher in 2015
than in 2014.
The business sector’s research spending ratio decreased to
18.9% (2014: 20.6%). The decline in research and develop-
ment costs was mainly due to one-time effects in connection
with the discontinuation of clinical development projects that
had increased research and development costs in 2014.
The development of other operating expenses and income
(net) in 2015 was mainly due to one-time effects in 2014. On
the one hand, the adjustment of provisions for litigation fol-
lowing the settlement with Israel Bio-Engineering Project Lim-
ited Partnership (
IBEP
) led to higher income in 2014 whereas,
on the other hand, the discontinuation of the aforementioned
clinical development projects led to impairments of intangible
assets. In 2015, income generated in connection with the
alliance entered into with Pfizer in 2014 to co-develop and
co-commercialize active ingredients in immuno-oncology had
a positive impact.
After adjusting for depreciation, amortization and excep-
tionals,
EBITDA
pre exceptionals, the key financial indicator
used to steer operating business, amounted to € 2,002 million
(2014: € 2,000 million), which was thus at the previous year’s
level. The
EBITDA
margin pre exceptionals declined to 28.9%
(2014: 30.2%).
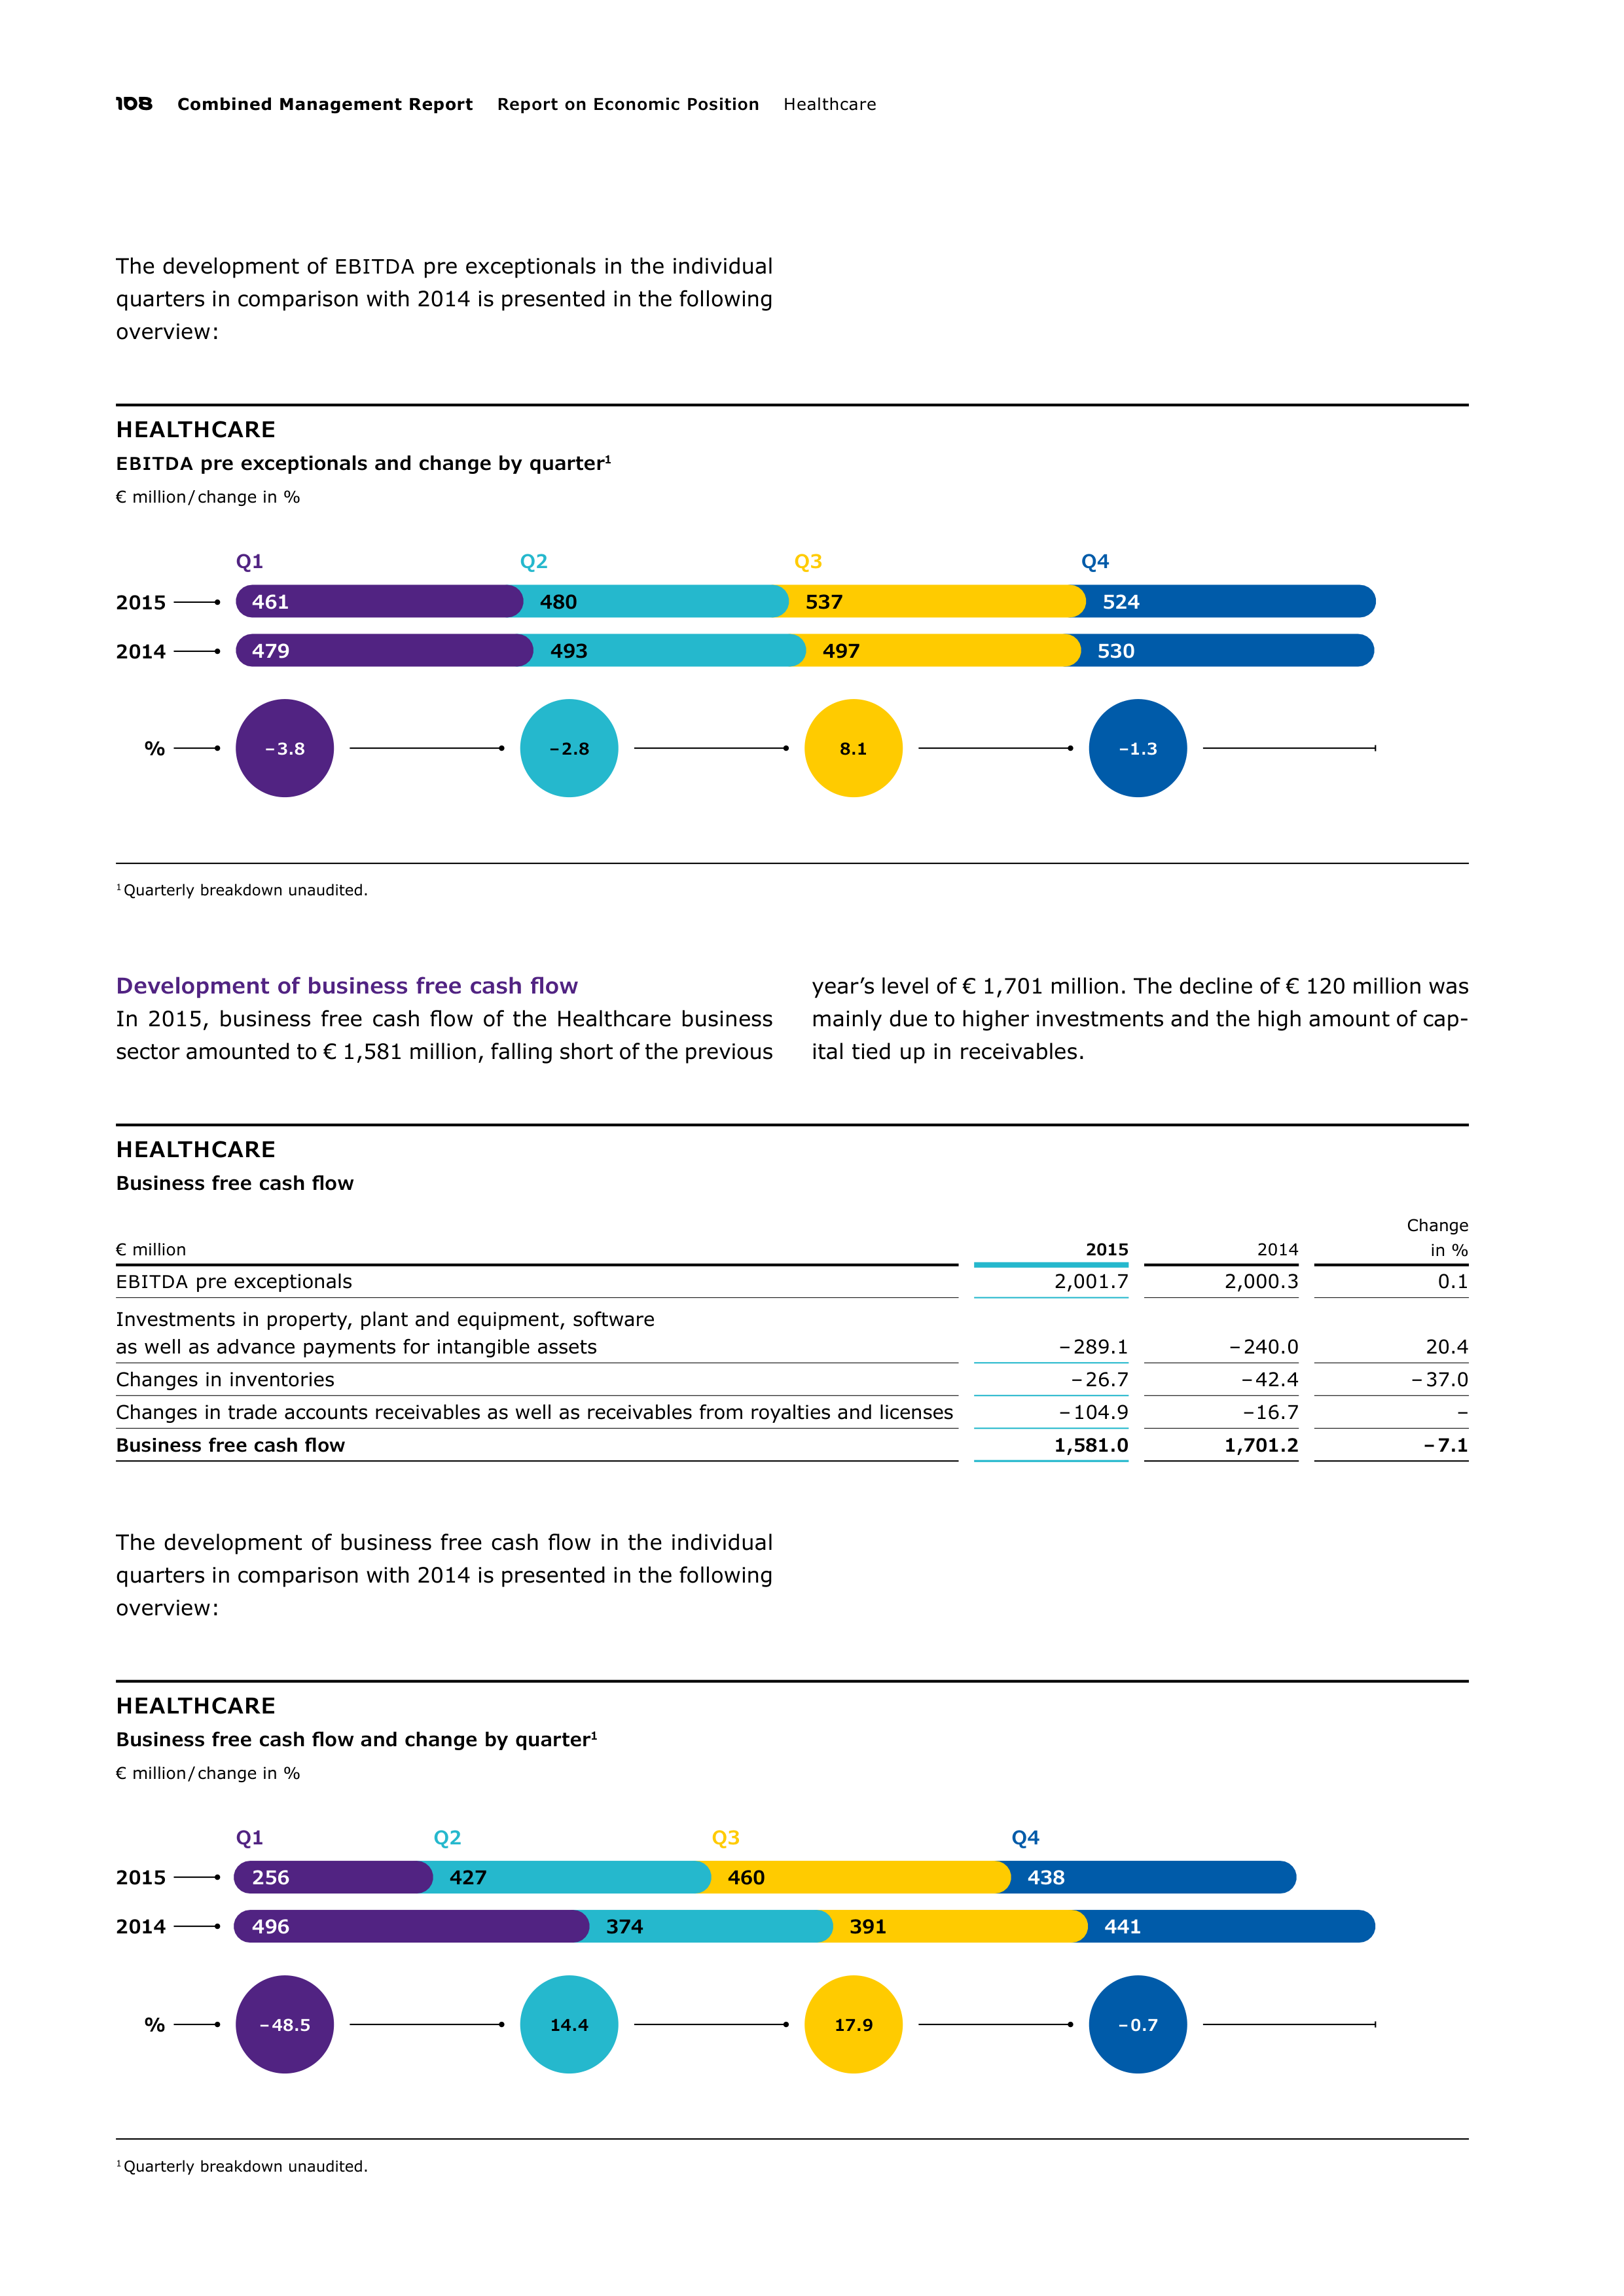
108
Combined Management Report
Report on Economic Position
Healthcar
HEALTHCARE
Business free cash flow and change by quarter
1
€ million / change in %
1
Quarterly breakdown unaudited.
Q1
Q2
Q3
Q4
2015
2014
256
427
460
438
496
374
391
441
%
– 48.5
14.4
17.9
– 0.7
HEALTHCARE
EBITDA
pre exceptionals and change by quarter
1
€ million / change in %
1
Quarterly breakdown unaudited.
Q1
Q2
Q3
Q4
2015
2014
%
– 3.8
– 2.8
8.1
– 1.3
461
480
537
524
479
493
497
530
The development of
EBITDA
pre exceptionals in the individual
quarters in comparison with 2014 is presented in the following
overview:
Development of business free cash flow
In 2015, business free cash flow of the Healthcare business
sector amounted to € 1,581 million, falling short of the previous
year’s level of € 1,701 million. The decline of € 120 million was
mainly due to higher investments and the high amount of cap-
ital tied up in receivables.
HEALTHCARE
Business free cash flow
€ million
2015
2014
Change
in %
EBITDA
pre exceptionals
2,001.7
2,000.3
0.1
Investments in property, plant and equipment, software
as well as advance payments for intangible assets
– 289.1
– 240.0
20.4
Changes in inventories
– 26.7
– 42.4
– 37.0
Changes in trade accounts receivables as well as receivables from royalties and licenses
– 104.9
– 16.7
–
Business free cash flow
1,581.0
1,701.2
– 7.1
The development of business free cash flow in the individual
quarters in comparison with 2014 is presented in the following
overview:
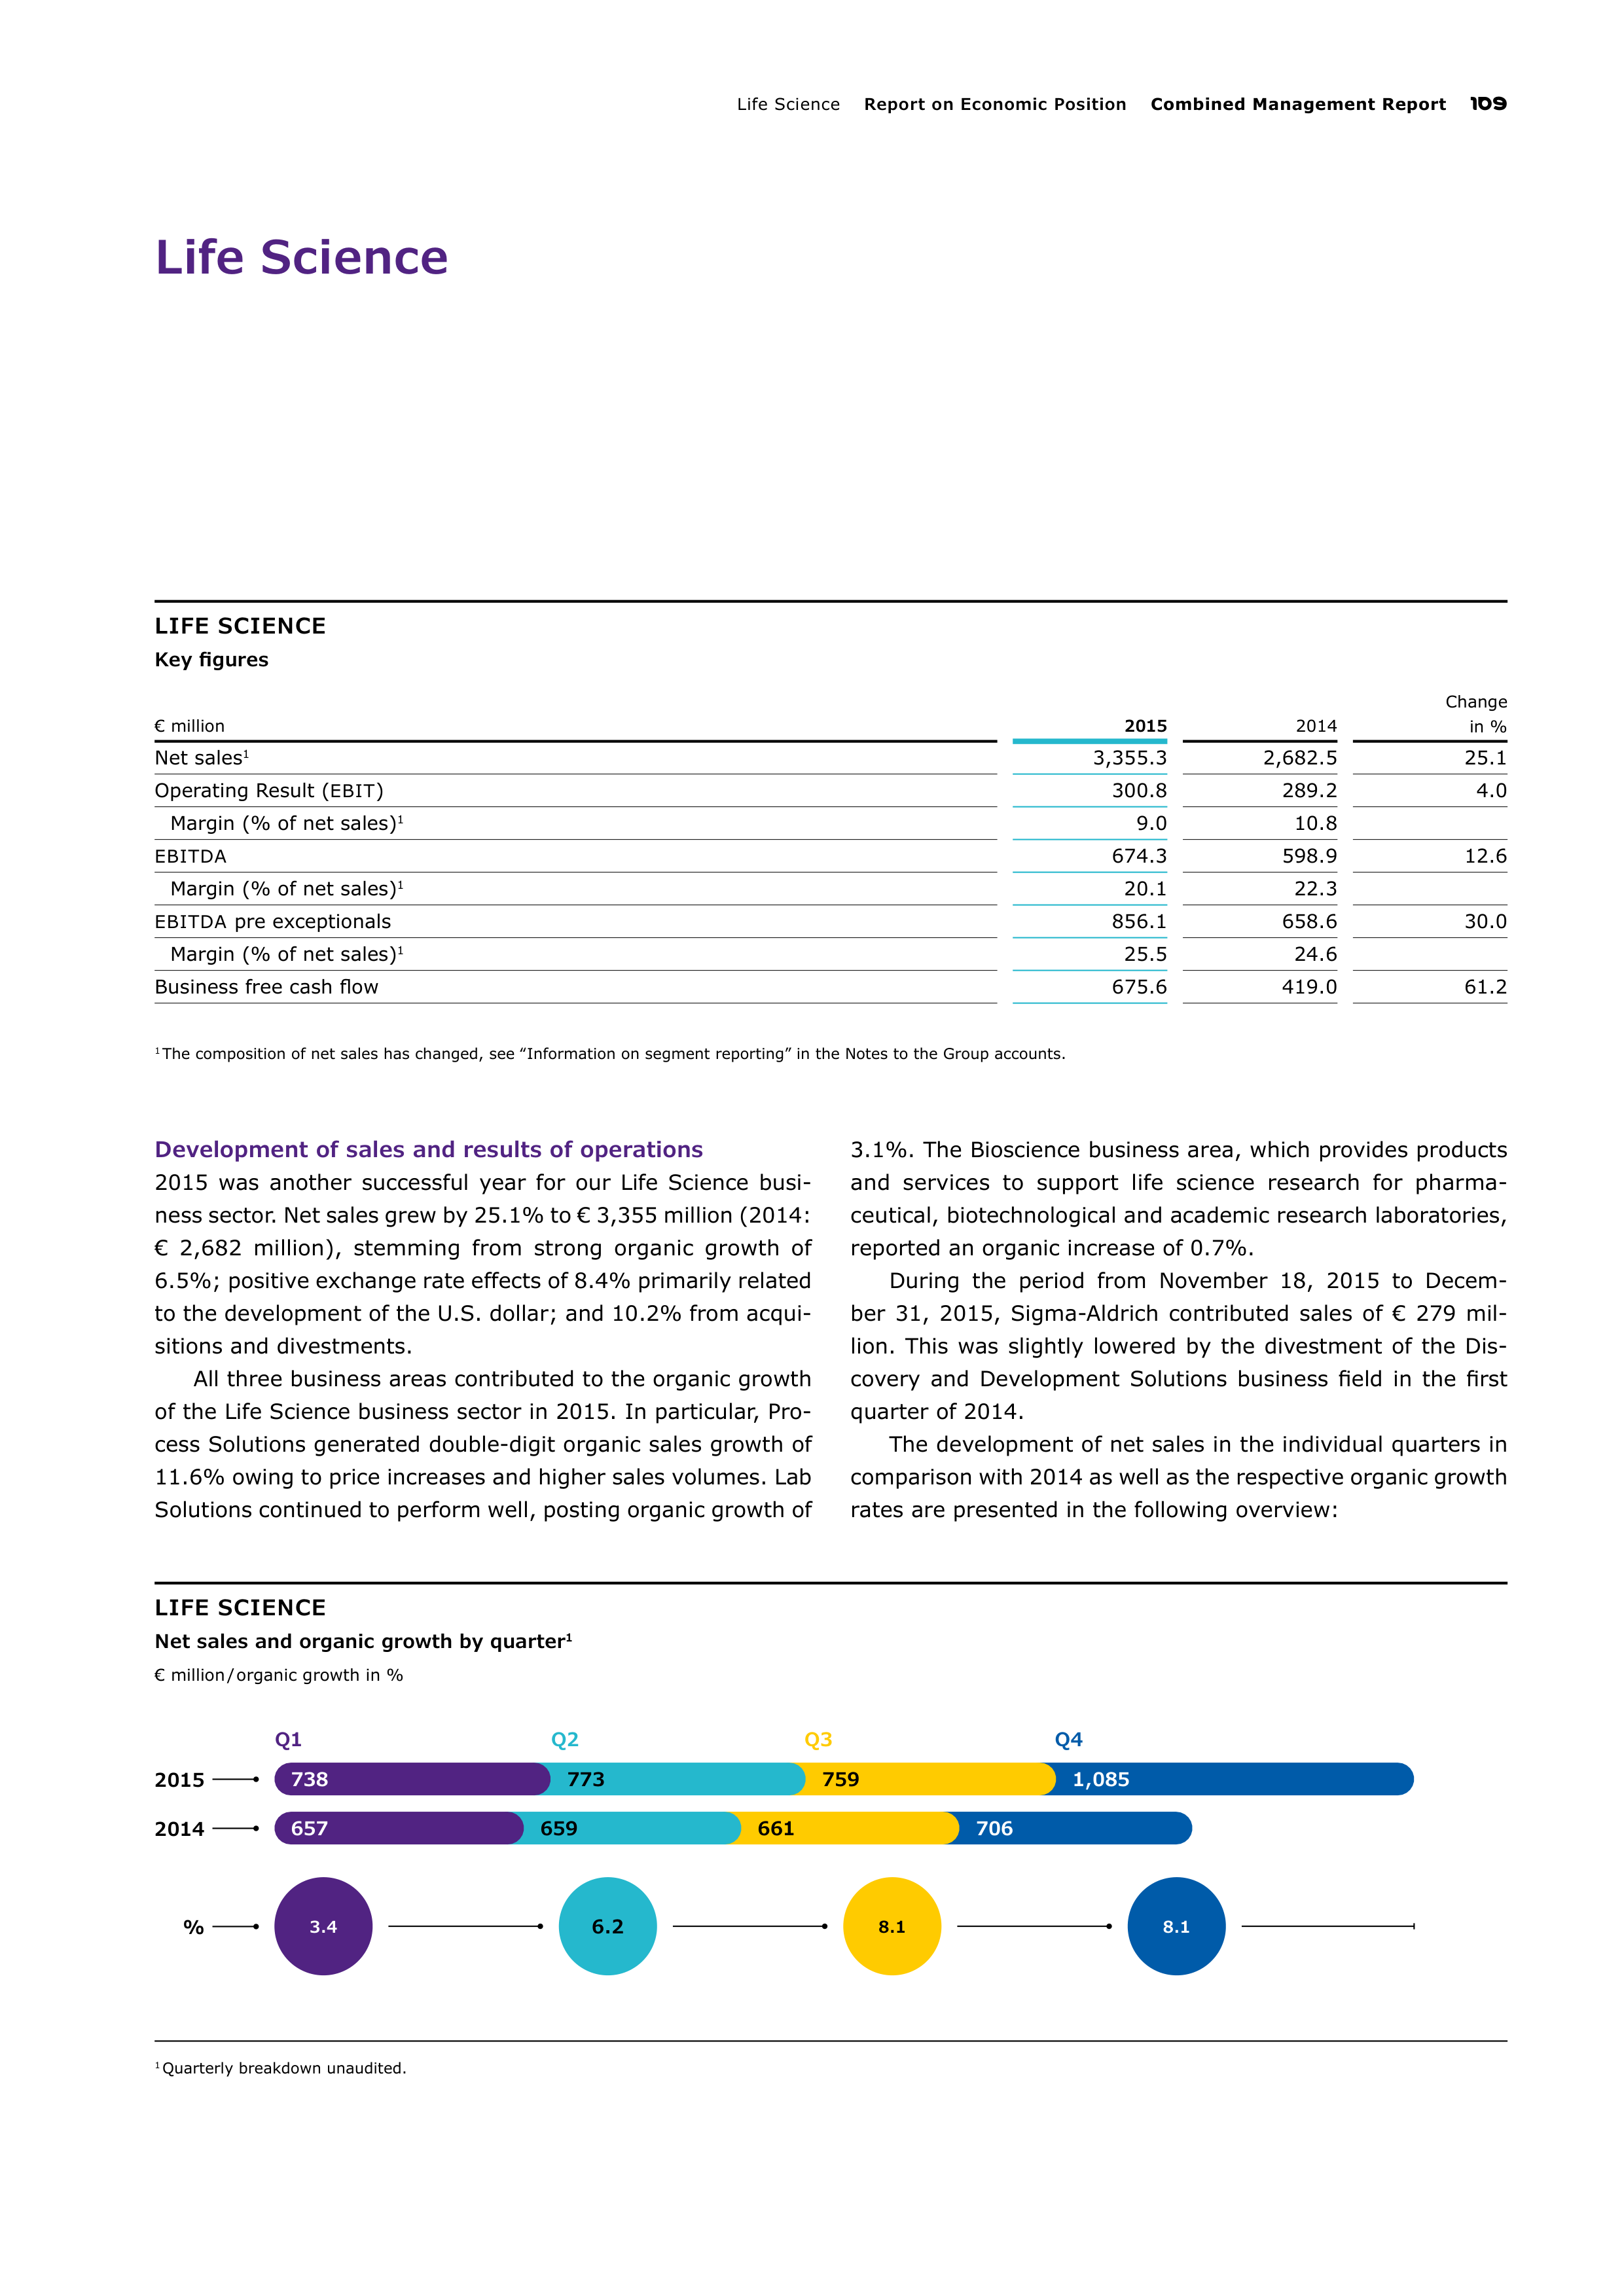
Life Scienc
Report on Economic Position
Combined Management Report
109
LIFE SCIENCE
Net sales and organic growth by quarter
1
€ million / organic growth in %
1
Quarterly breakdown unaudited.
2015
2014
Q1
Q2
Q3
Q4
738
773
759
1,085
657
659
661
706
%
3.4
6.2
8.1
8.1
Life Science
LIFE SCIENCE
Key figures
€ million
2015
2014
Change
in %
Net sales
1
3,355.3
2,682.5
25.1
Operating Result (
EBIT
)
300.8
289.2
4.0
Margin (% of net sales)
1
9.0
10.8
EBITDA
674.3
598.9
12.6
Margin (% of net sales)
1
20.1
22.3
EBITDA
pre exceptionals
856.1
658.6
30.0
Margin (% of net sales)
1
25.5
24.6
Business free cash flow
675.6
419.0
61.2
1
The composition of net sales has changed, see ‟Information on segment reporting” in the Notes to the Group accounts.
Development of sales and results of operations
2015 was another successful year for our Life Science busi-
ness sector. Net sales grew by 25.1% to € 3,355 million (2014:
€ 2,682 million), stemming from strong organic growth of
6.5%; positive exchange rate effects of 8.4% primarily related
to the development of the U.S. dollar; and 10.2% from acqui-
sitions and divestments.
All three business areas contributed to the organic growth
of the Life Science business sector in 2015. In particular, Pro-
cess Solutions generated double-digit organic sales growth of
11.6% owing to price increases and higher sales volumes. Lab
Solutions continued to perform well, posting organic growth of
3.1%. The Bioscience business area, which provides products
and services to support life science research for pharma
ceu
tical, biotechnological and academic research laboratories,
reported an organic increase of 0.7%.
During the period from November 18, 2015 to Decem-
ber 31, 2015, Sigma-Aldrich contributed sales of € 279 mil-
lion. This was slightly lowered by the divestment of the Dis-
covery and Development Solutions business field in the first
quarter of 2014.
The development of net sales in the individual quarters in
comparison with 2014 as well as the respective organic growth
rates are presented in the following overview:
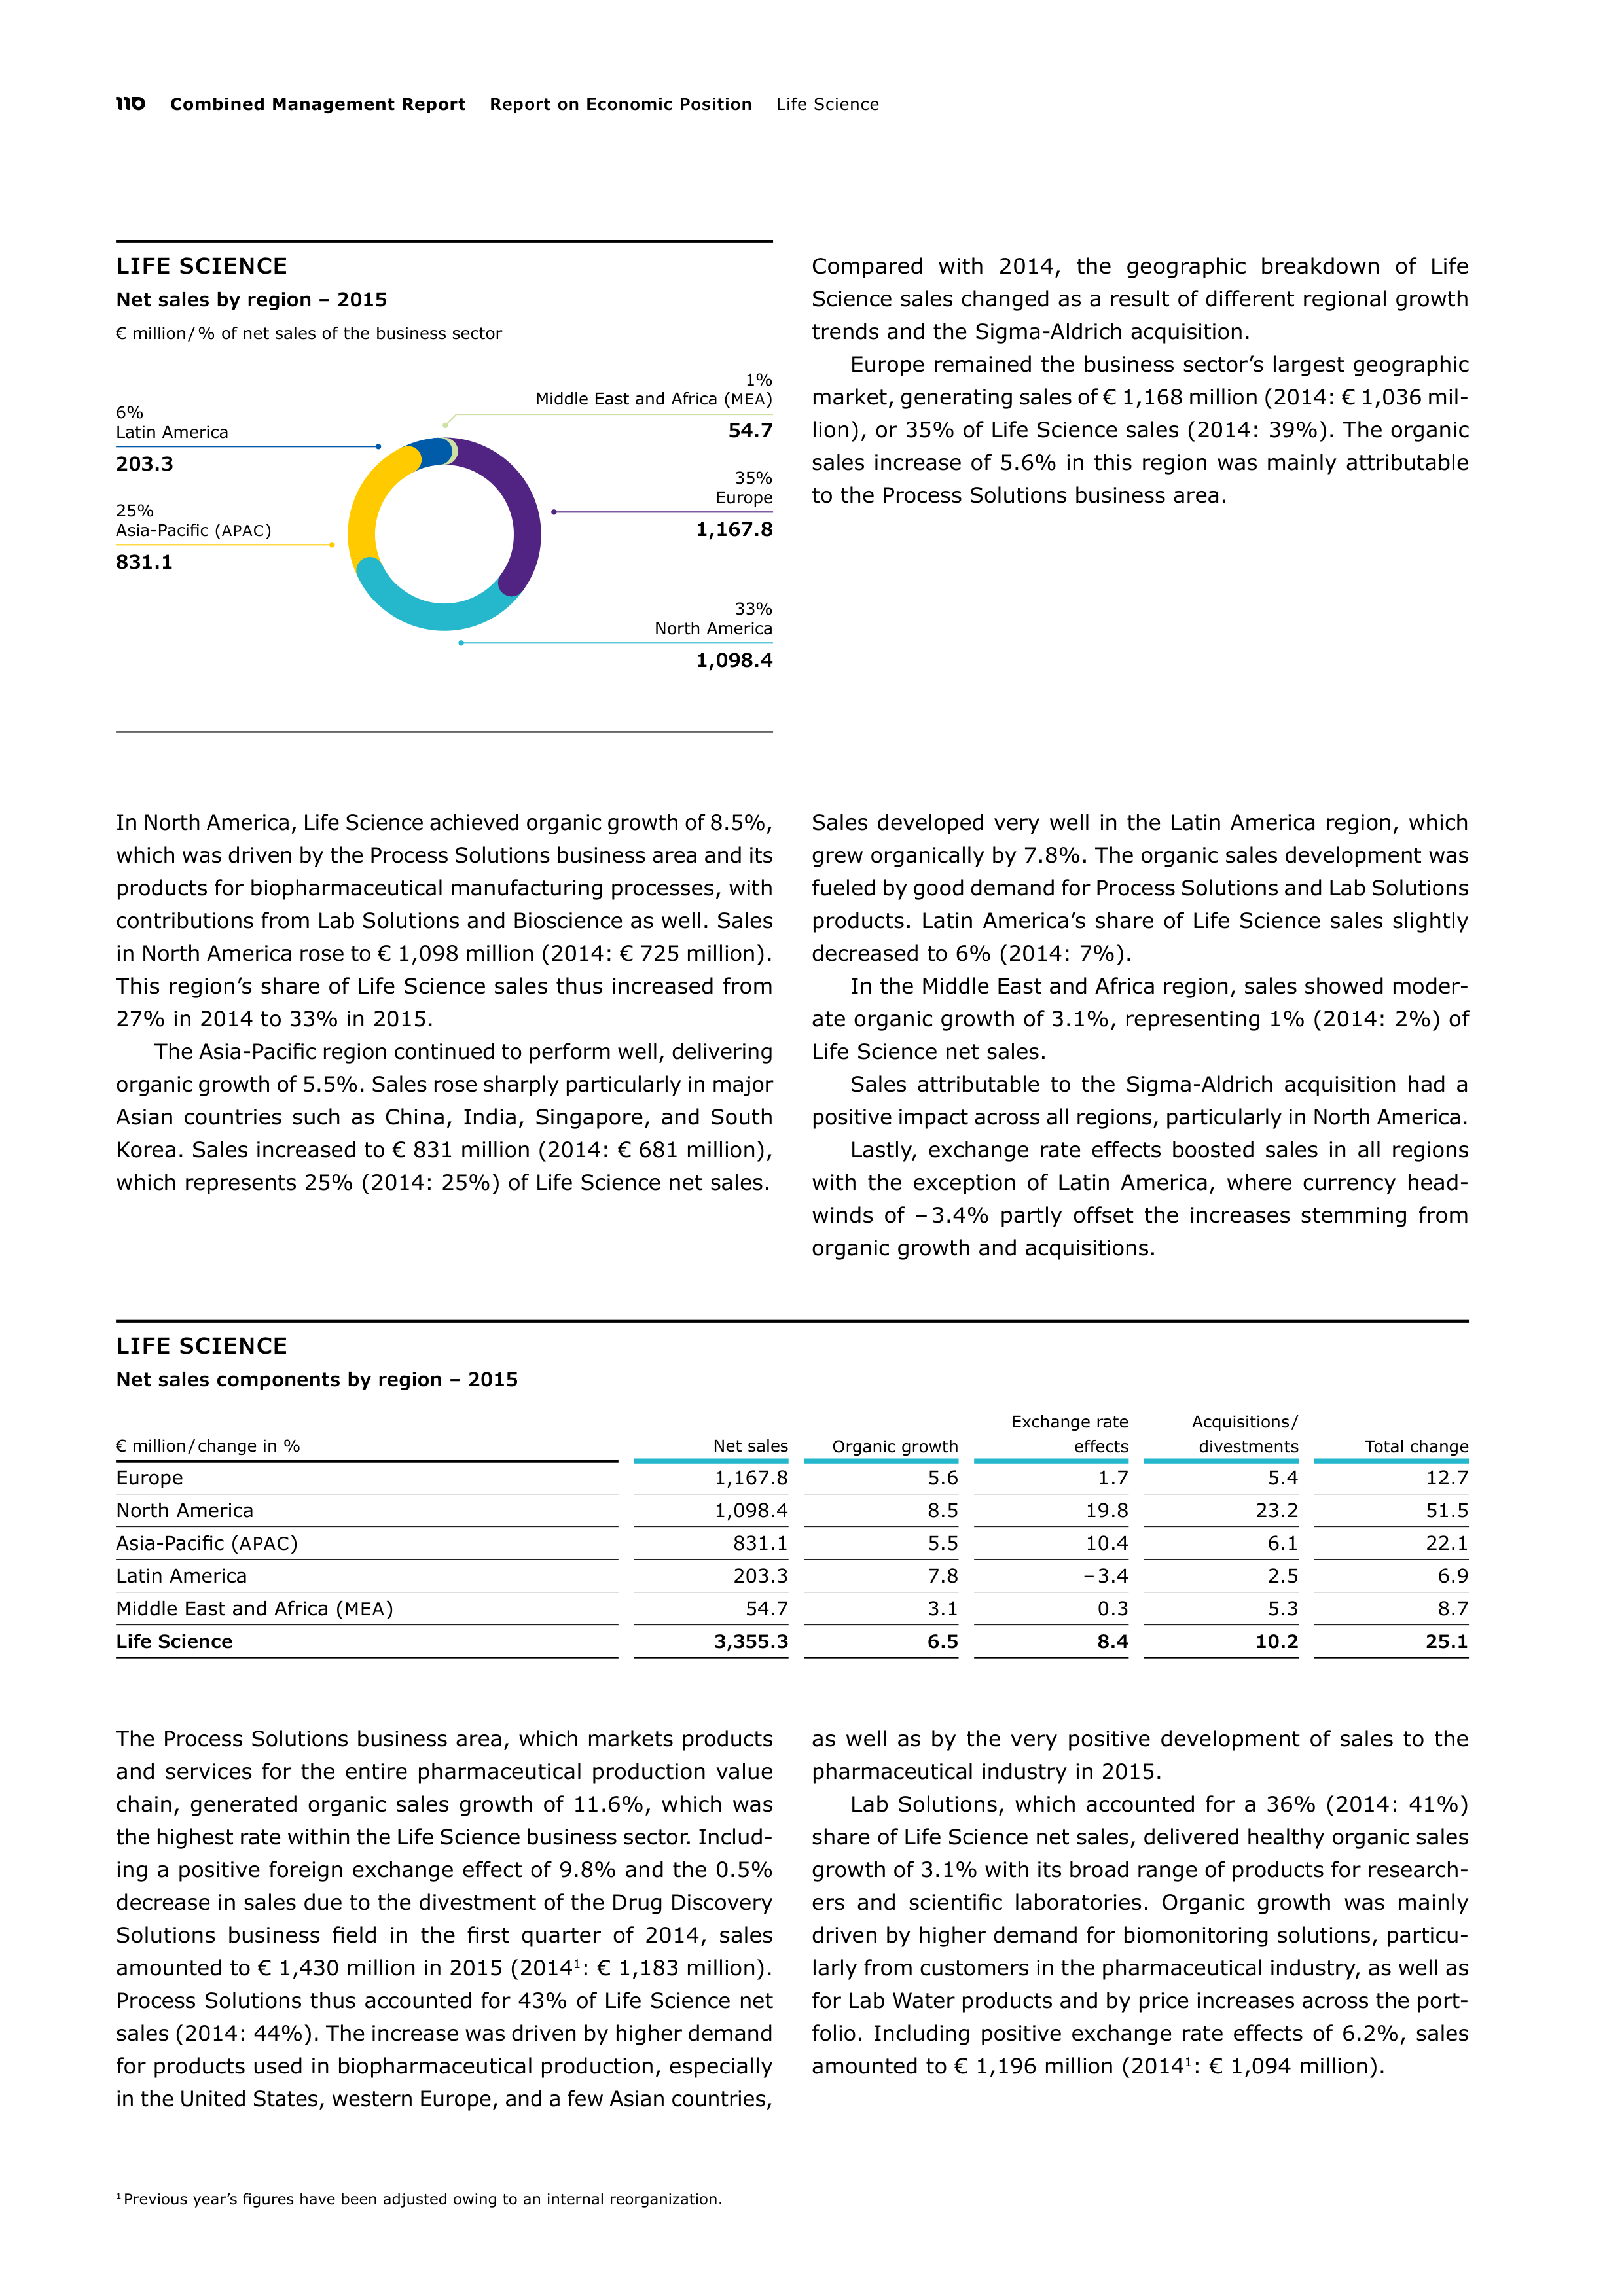
110
Combined Management Report
Report on Economic Position
Life Scienc
LIFE SCIENCE
Net sales by region – 2015
€ million / % of net sales of the business sector
35%
Europe
1,167.8
25%
Asia-Pacific (
APAC
)
831.1
33%
North America
1,098.4
6%
Latin America
203.3
1%
Middle East and Africa (
MEA
)
54.7
Compared with 2014, the geographic breakdown of Life
Science sales changed as a result of different regional growth
trends and the Sigma-Aldrich acquisition.
Europe remained the business sector’s largest geographic
market, generating sales of € 1,168 million (2014: € 1,036 mil-
lion), or 35% of Life Science sales (2014: 39%). The organic
sales increase of 5.6% in this region was mainly attributable
to the Process Solutions business area.
In North America, Life Science achieved organic growth of 8.5%,
which was driven by the Process Solutions business area and its
products for biopharmaceutical manufacturing processes, with
contributions from Lab Solutions and Bioscience as well. Sales
in North America rose to € 1,098 million (2014: € 725 million).
This region’s share of Life Science sales thus increased from
27% in 2014 to 33% in 2015.
The Asia-Pacific region continued to perform well, delivering
organic growth of 5.5%. Sales rose sharply particularly in major
Asian countries such as China, India, Singapore, and South
Korea. Sales increased to € 831 million (2014: € 681 million),
which represents 25% (2014: 25%) of Life Science net sales.
Sales developed very well in the Latin America region, which
grew organically by 7.8%. The organic sales development was
fueled by good demand for Process Solutions and Lab Solutions
products. Latin America’s share of Life Science sales slightly
decreased to 6% (2014: 7%).
In the Middle East and Africa region, sales showed moder-
ate organic growth of 3.1%, representing 1% (2014: 2%) of
Life Science net sales.
Sales attributable to the Sigma-Aldrich acquisition had a
positive impact across all regions, particularly in North America.
Lastly, exchange rate effects boosted sales in all regions
with the exception of Latin America, where currency head-
winds of – 3.4% partly offset the increases stemming from
organic growth and acquisitions.
LIFE SCIENCE
Net sales components by region – 2015
€ million / change in %
Net sales
Organic growth
Exchange rate
effects
Acquisitions /
divestments
Total change
Europe
1,167.8
5.6
1.7
5.4
12.7
North America
1,098.4
8.5
19.8
23.2
51.5
Asia-Pacific (
APAC
)
831.1
5.5
10.4
6.1
22.1
Latin America
203.3
7.8
– 3.4
2.5
6.9
Middle East and Africa (
MEA
)
54.7
3.1
0.3
5.3
8.7
Life Science
3,355.3
6.5
8.4
10.2
25.1
The Process Solutions business area, which markets products
and services for the entire pharmaceutical production value
chain, generated organic sales growth of 11.6%, which was
the highest rate within the Life Science business sector. Includ-
ing a positive foreign exchange effect of 9.8% and the 0.5%
decrease in sales due to the divestment of the Drug Discovery
Solutions business field in the first quarter of 2014, sales
amounted to € 1,430 million in 2015 (2014
1
: € 1,183 million).
Process Solutions thus accounted for 43% of Life Science net
sales (2014: 44%). The increase was driven by higher demand
for products used in biopharmaceutical production, especially
in the United States, western Europe, and a few Asian countries,
as well as by the very positive development of sales to the
pharmaceutical industry in 2015.
Lab Solutions, which accounted for a 36% (2014: 41%)
share of Life Science net sales, delivered healthy organic sales
growth of 3.1% with its broad range of products for research-
ers and scientific laboratories. Organic growth was mainly
driven by higher demand for biomonitoring solutions, particu-
larly from customers in the pharmaceutical industry, as well as
for Lab Water products and by price increases across the port-
folio. Including positive exchange rate effects of 6.2%, sales
amounted to € 1,196 million (2014
1
: € 1,094 million).
1
Previous year’s figures have been adjusted owing to an internal reorganization.
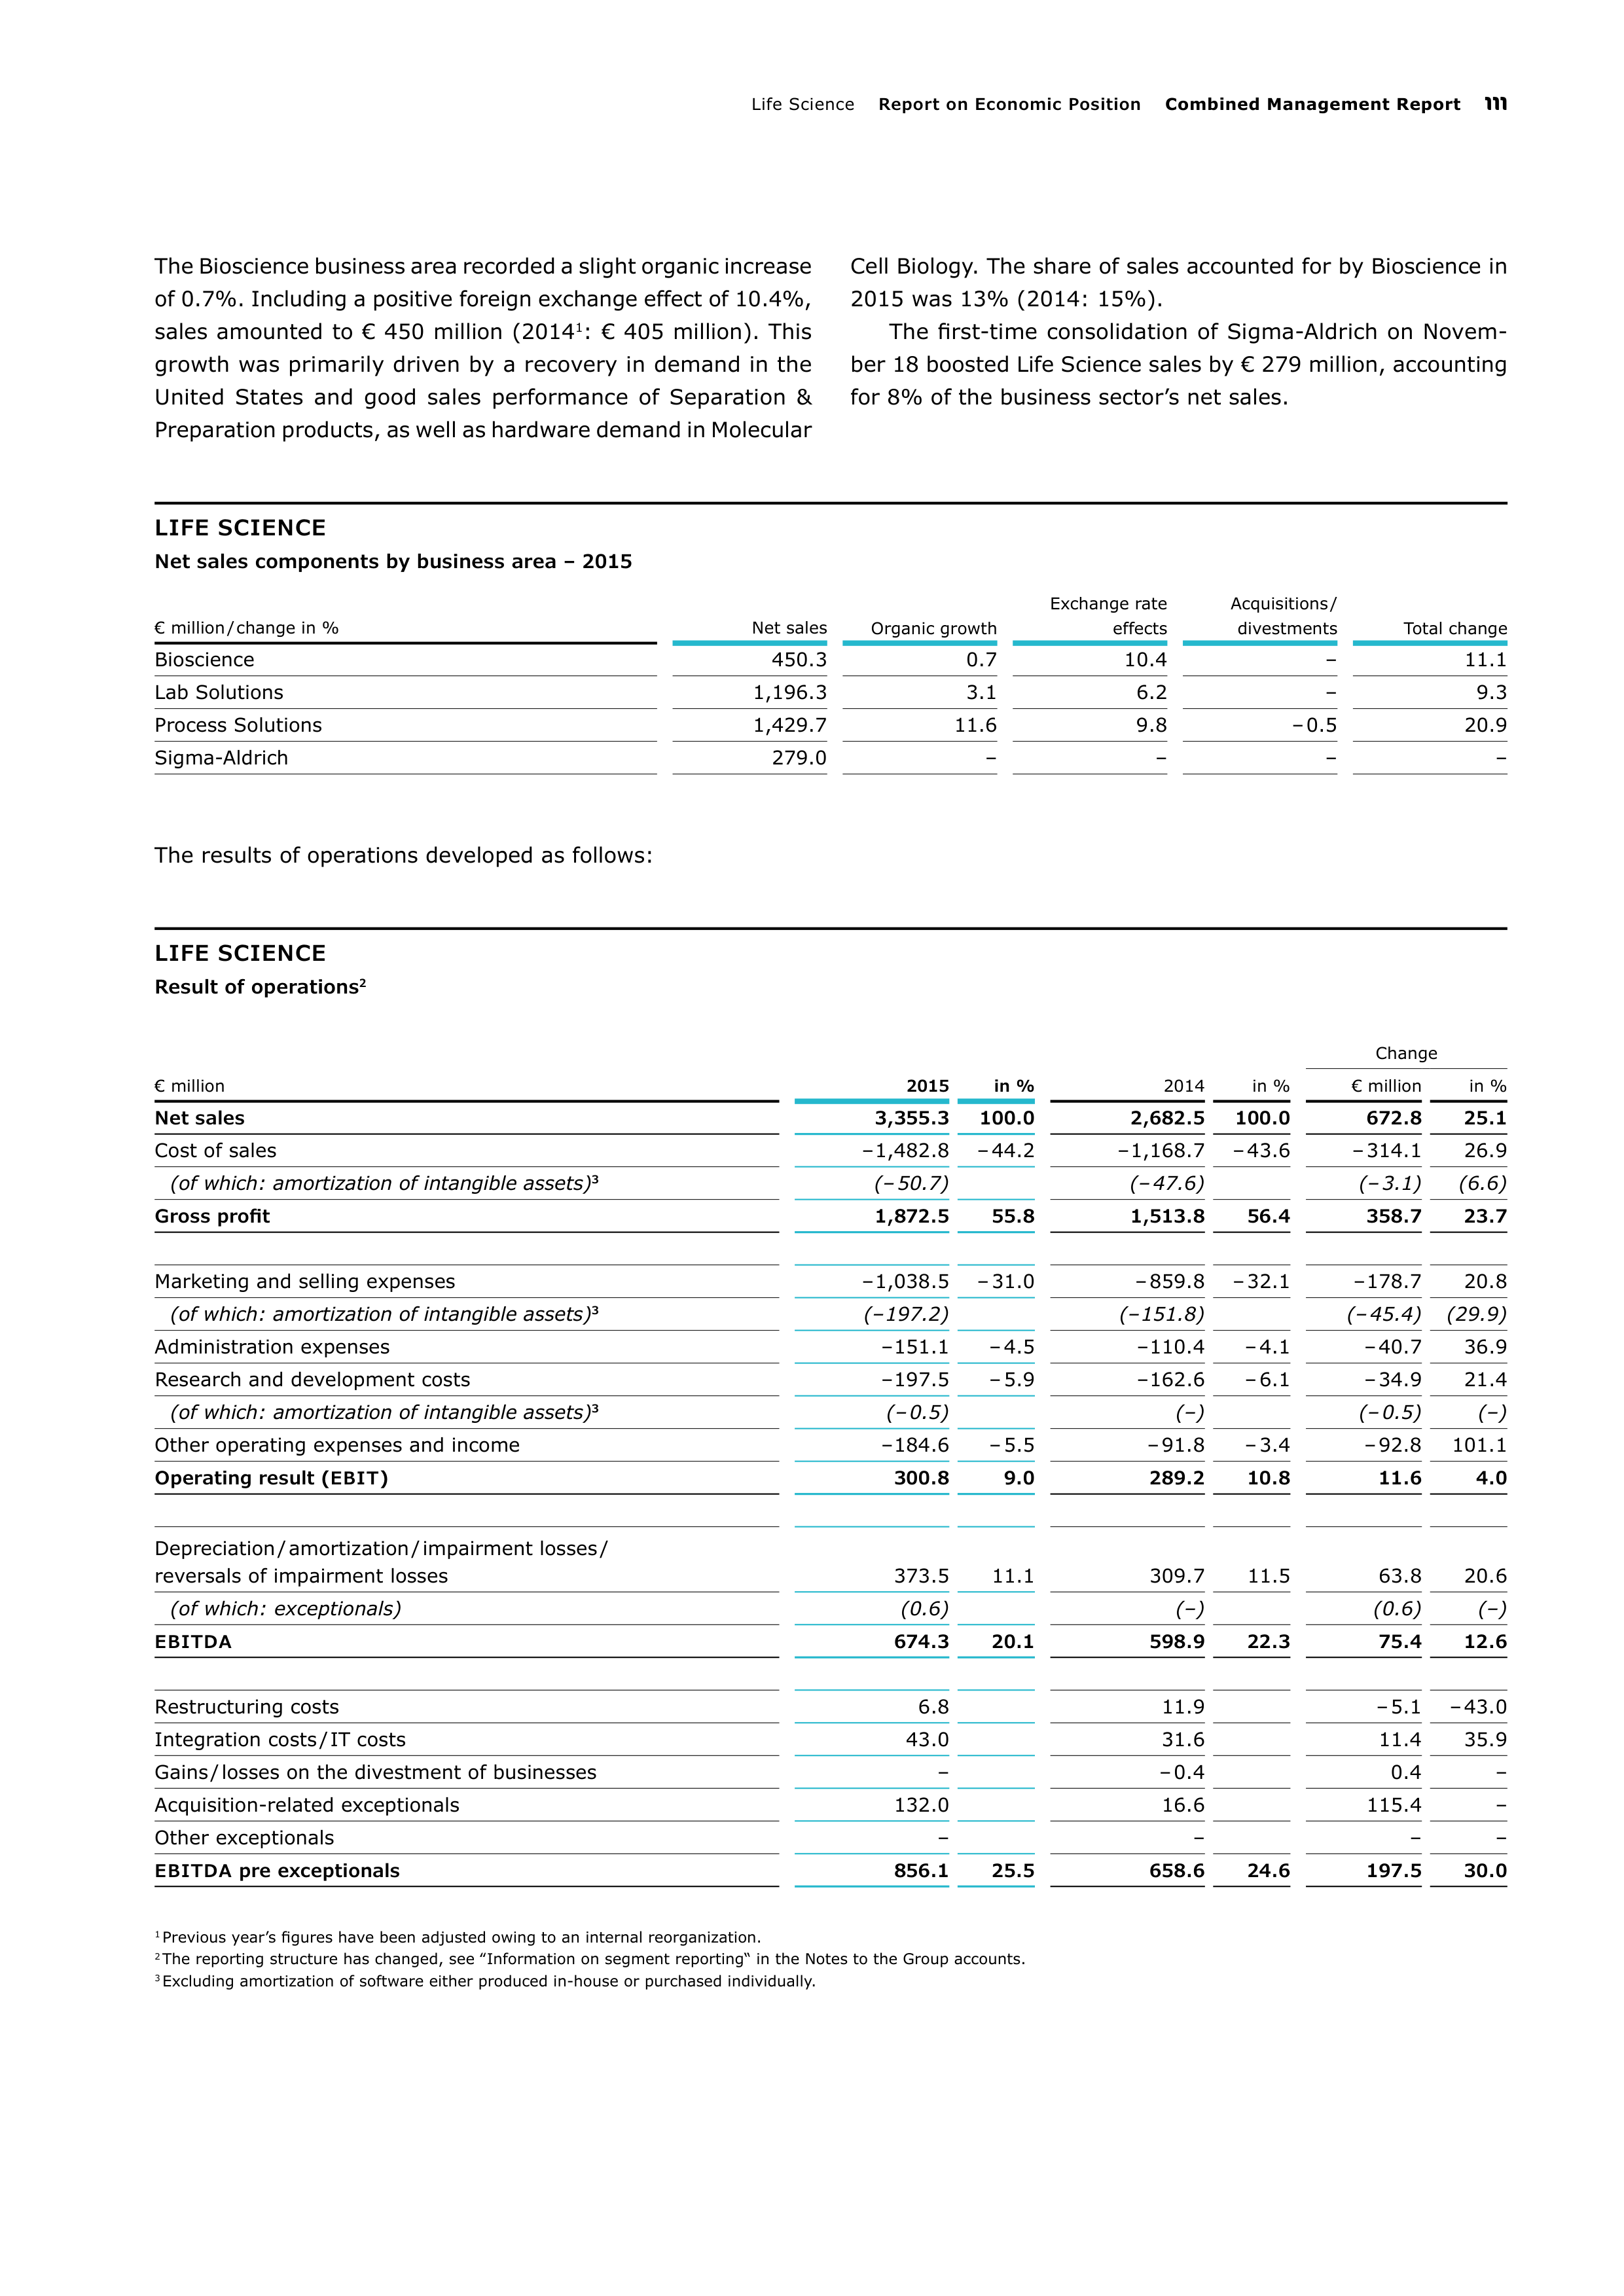
Life Scienc
Report on Economic Position
Combined Management Report
111
The Bioscience business area recorded a slight organic increase
of 0.7%. Including a positive foreign exchange effect of 10.4%,
sales amounted to € 450 million (2014
1
: € 405 million). This
growth was primarily driven by a recovery in demand in the
United States and good sales performance of Separation &
Preparation products, as well as hardware demand in Molecular
Cell Biology. The share of sales accounted for by Bioscience in
2015 was 13% (2014: 15%).
The first-time consolidation of Sigma-Aldrich on Novem-
ber 18 boosted Life Science sales by € 279 million, accounting
for 8% of the business sector’s net sales.
LIFE SCIENCE
Net sales components by business area – 2015
€ million / change in %
Net sales
Organic growth
Exchange rate
effects
Acquisitions /
divestments
Total change
Bioscience
450.3
0.7
10.4
–
11.1
Lab Solutions
1,196.3
3.1
6.2
–
9.3
Process Solutions
1,429.7
11.6
9.8
– 0.5
20.9
Sigma-Aldrich
279.0
–
–
–
–
The results of operations developed as follows:
LIFE SCIENCE
Result of operations
2
Change
€ million
2015
in %
2014
in %
€ million
in %
Net sales
3,355.3
100.0
2,682.5
100.0
672.8
25.1
Cost of sales
– 1,482.8
– 44.2
– 1,168.7
– 43.6
– 314.1
26.9
(of which: amortization of intangible assets)
3
(– 50.7)
(– 47.6)
(– 3.1)
(6.6)
Gross profit
1,872.5
55.8
1,513.8
56.4
358.7
23.7
Marketing and selling expenses
– 1,038.5
– 31.0
– 859.8
– 32.1
– 178.7
20.8
(of which: amortization of intangible assets)
3
(– 197.2)
(– 151.8)
(– 45.4)
(29.9)
Administration expenses
– 151.1
– 4.5
– 110.4
– 4.1
– 40.7
36.9
Research and development costs
– 197.5
– 5.9
– 162.6
– 6.1
– 34.9
21.4
(of which: amortization of intangible assets)
3
(– 0.5)
(–)
(– 0.5)
(–)
Other operating expenses and income
– 184.6
– 5.5
– 91.8
– 3.4
– 92.8
101.1
Operating result (
EBIT
)
300.8
9.0
289.2
10.8
11.6
4.0
Depreciation / amortization / impairment losses /
reversals of impairment losses
373.5
11.1
309.7
11.5
63.8
20.6
(of which: exceptionals)
(0.6)
(–)
(0.6)
(–)
EBITDA
674.3
20.1
598.9
22.3
75.4
12.6
Restructuring costs
6.8
11.9
– 5.1
– 43.0
Integration costs / IT costs
43.0
31.6
11.4
35.9
Gains / losses on the divestment of businesses
–
– 0.4
0.4
–
Acquisition-related exceptionals
132.0
16.6
115.4
–
Other exceptionals
–
–
–
–
EBITDA
pre exceptionals
856.1
25.5
658.6
24.6
197.5
30.0
1
Previous year’s figures have been adjusted owing to an internal reorganization.
2
The reporting structure has changed, see ‟Information on segment reporting“ in the Notes to the Group accounts.
3
Excluding amortization of software either produced in-house or purchased individually.
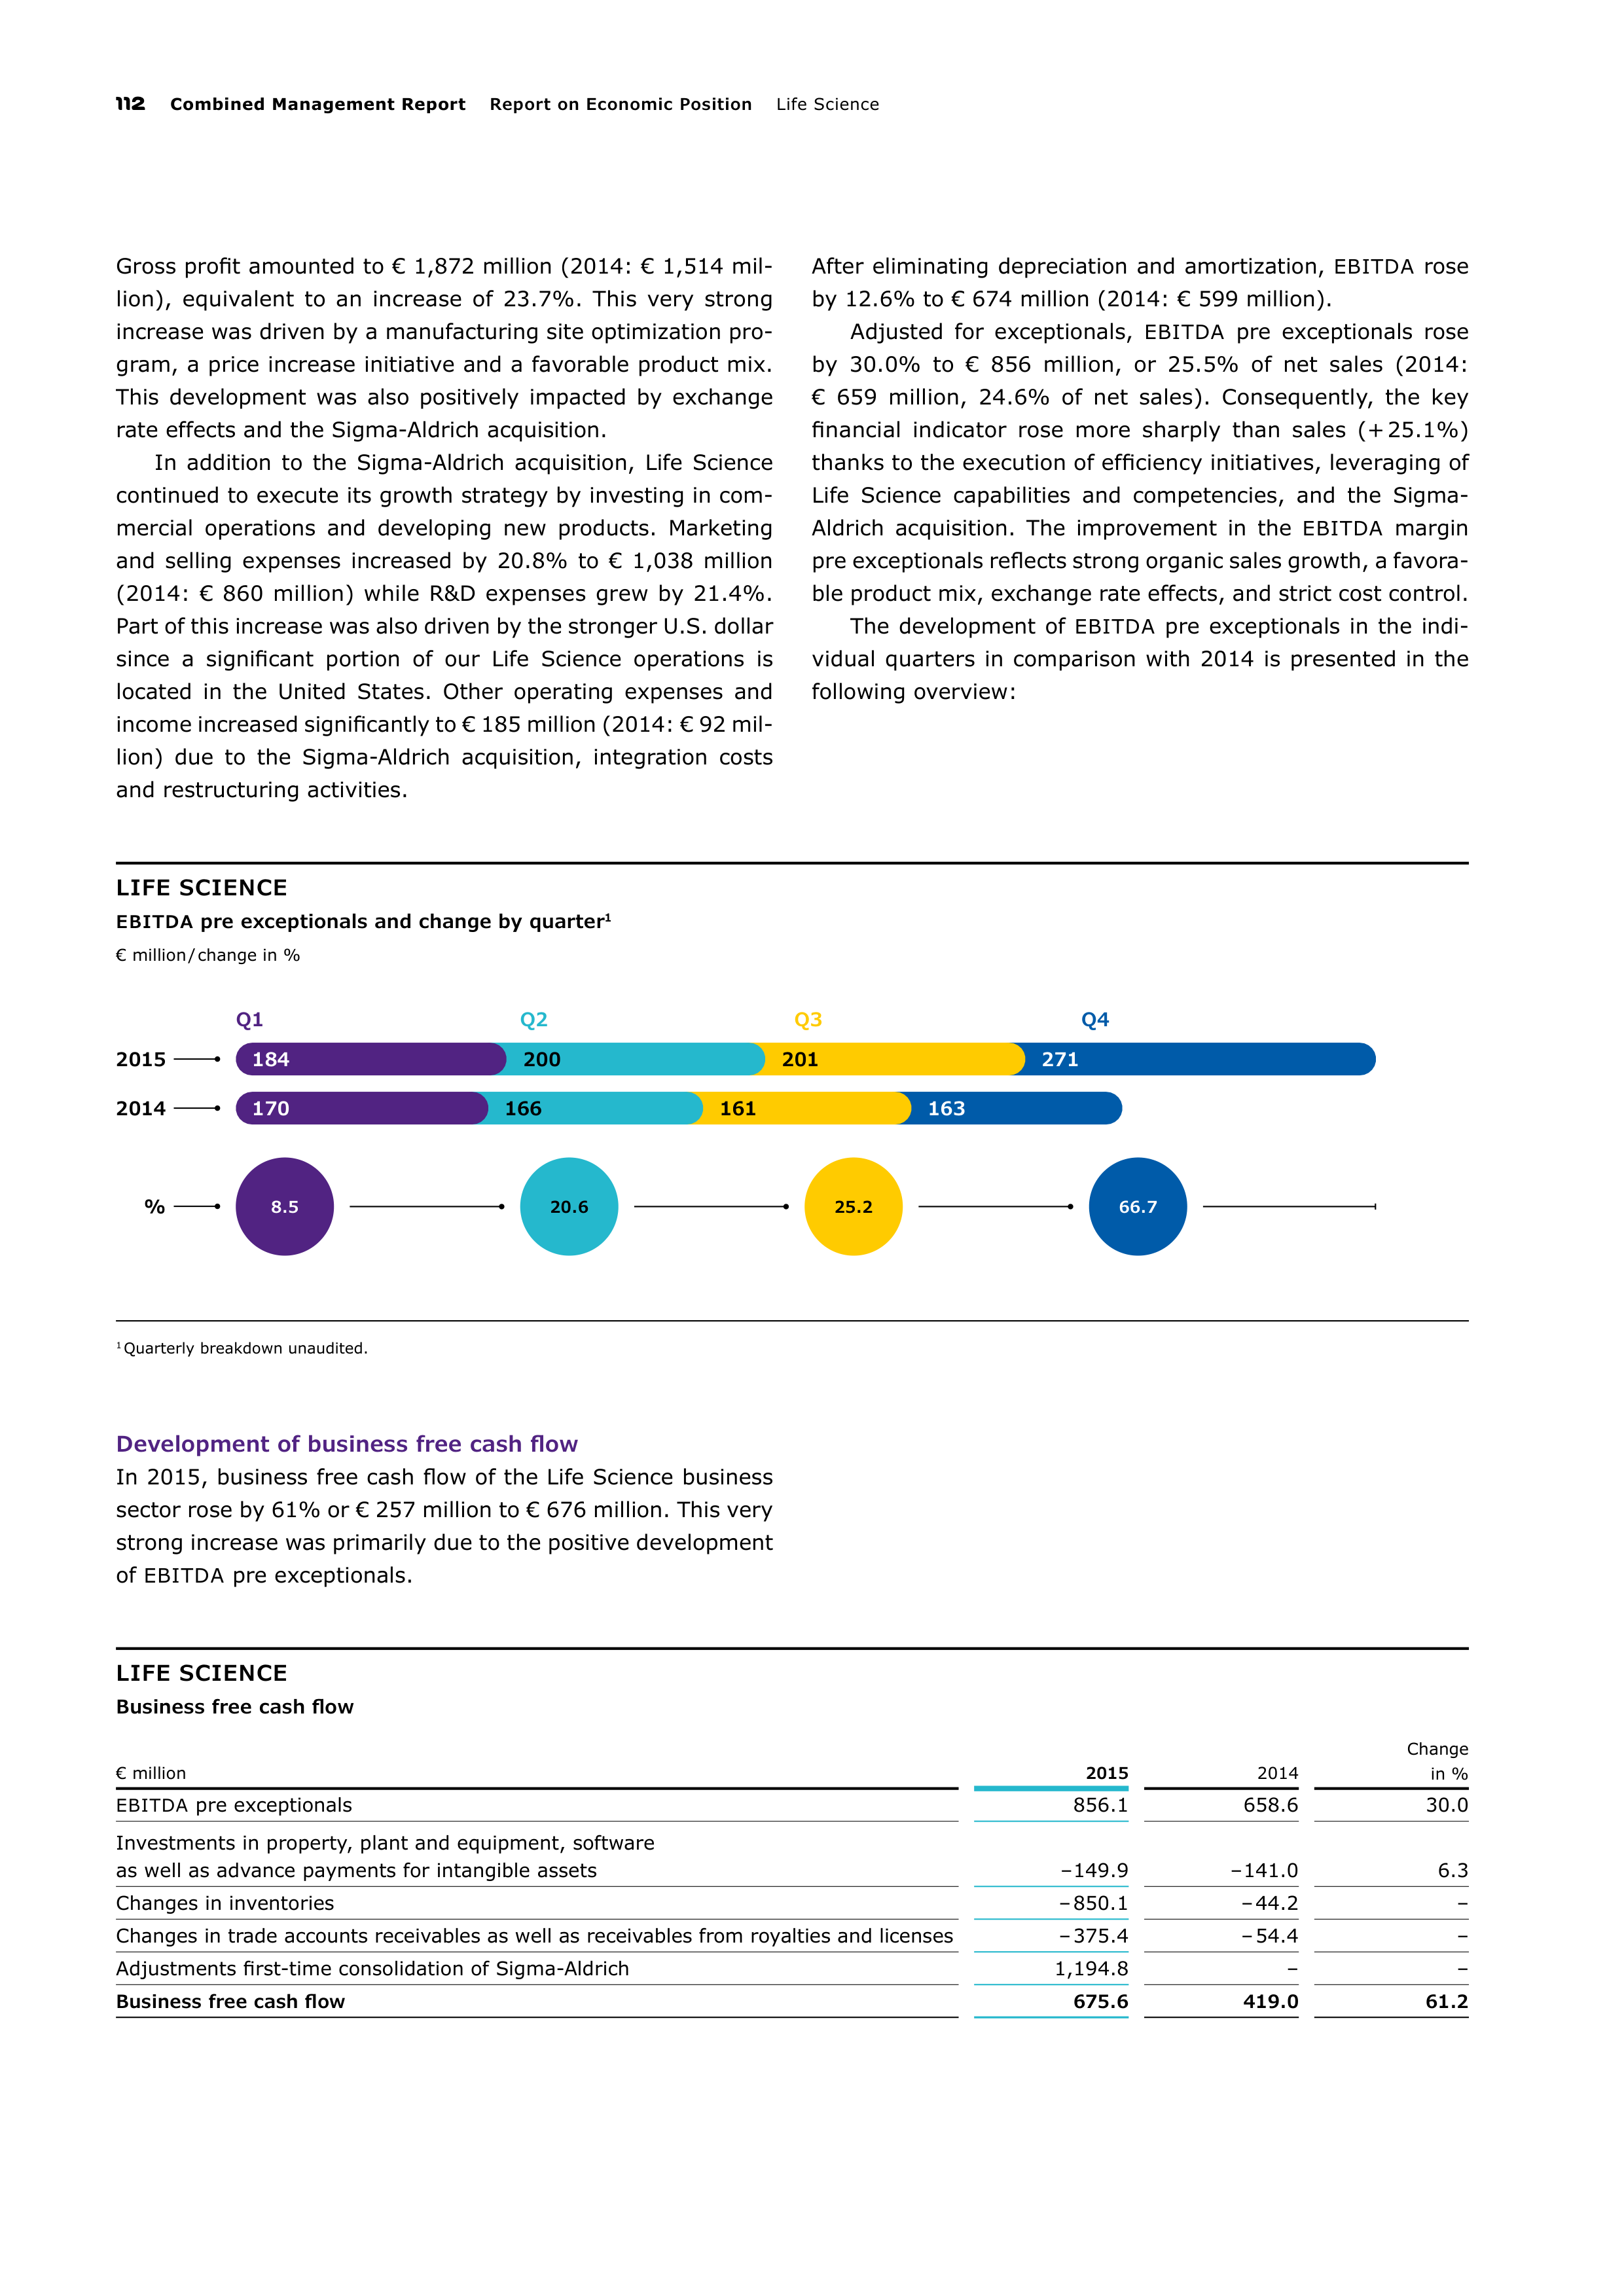
112
Combined Management Report
Report on Economic Position
Life Scienc
LIFE SCIENCE
EBITDA
pre exceptionals and change by quarter
1
€ million / change in %
1
Quarterly breakdown unaudited.
2015
2014
Q1
Q2
Q3
Q4
%
8.5
20.6
25.2
66.7
184
200
201
271
170
166
161
163
Gross profit amounted to € 1,872 million (2014: € 1,514 mil-
lion), equivalent to an increase of 23.7%. This very strong
increase was driven by a manufacturing site optimization pro-
gram, a price increase initiative and a favorable product mix.
This development was also positively impacted by exchange
rate effects and the Sigma-Aldrich acquisition.
In addition to the Sigma-Aldrich acquisition, Life Science
continued to execute its growth strategy by investing in com-
mercial operations and developing new products. Marketing
and selling expenses increased by 20.8% to € 1,038 million
(2014: € 860 million) while R&D expenses grew by 21.4%.
Part of this increase was also driven by the stronger U.S. dollar
since a significant portion of our Life Science operations is
located in the United States. Other operating expenses and
income increased significantly to € 185 million (2014: € 92 mil-
lion) due to the Sigma-Aldrich acquisition, integration costs
and restructuring activities.
After eliminating depreciation and amortization,
EBITDA
rose
by 12.6% to € 674 million (2014: € 599 million).
Adjusted for exceptionals,
EBITDA
pre exceptionals rose
by 30.0% to € 856 million, or 25.5% of net sales (2014:
€ 659 million, 24.6% of net sales). Consequently, the key
financial indicator rose more sharply than sales (+ 25.1%)
thanks to the execution of efficiency initiatives, leveraging of
Life Science capabilities and competencies, and the Sigma-
Aldrich acquisition. The improvement in the
EBITDA
margin
pre exceptionals reflects strong organic sales growth, a favora-
ble product mix, exchange rate effects, and strict cost control.
The development of
EBITDA
pre exceptionals in the indi-
vidual quarters in comparison with 2014 is presented in the
following overview:
Development of business free cash flow
In 2015, business free cash flow of the Life Science business
sector rose by 61% or € 257 million to € 676 million. This very
strong increase was primarily due to the positive development
of
EBITDA
pre exceptionals.
LIFE SCIENCE
Business free cash flow
€ million
2015
2014
Change
in %
EBITDA
pre exceptionals
856.1
658.6
30.0
Investments in property, plant and equipment, software
as well as advance payments for intangible assets
– 149.9
– 141.0
6.3
Changes in inventories
– 850.1
– 44.2
–
Changes in trade accounts receivables as well as receivables from royalties and licenses
– 375.4
– 54.4
–
Adjustments first-time consolidation of Sigma-Aldrich
1,194.8
–
–
Business free cash flow
675.6
419.0
61.2
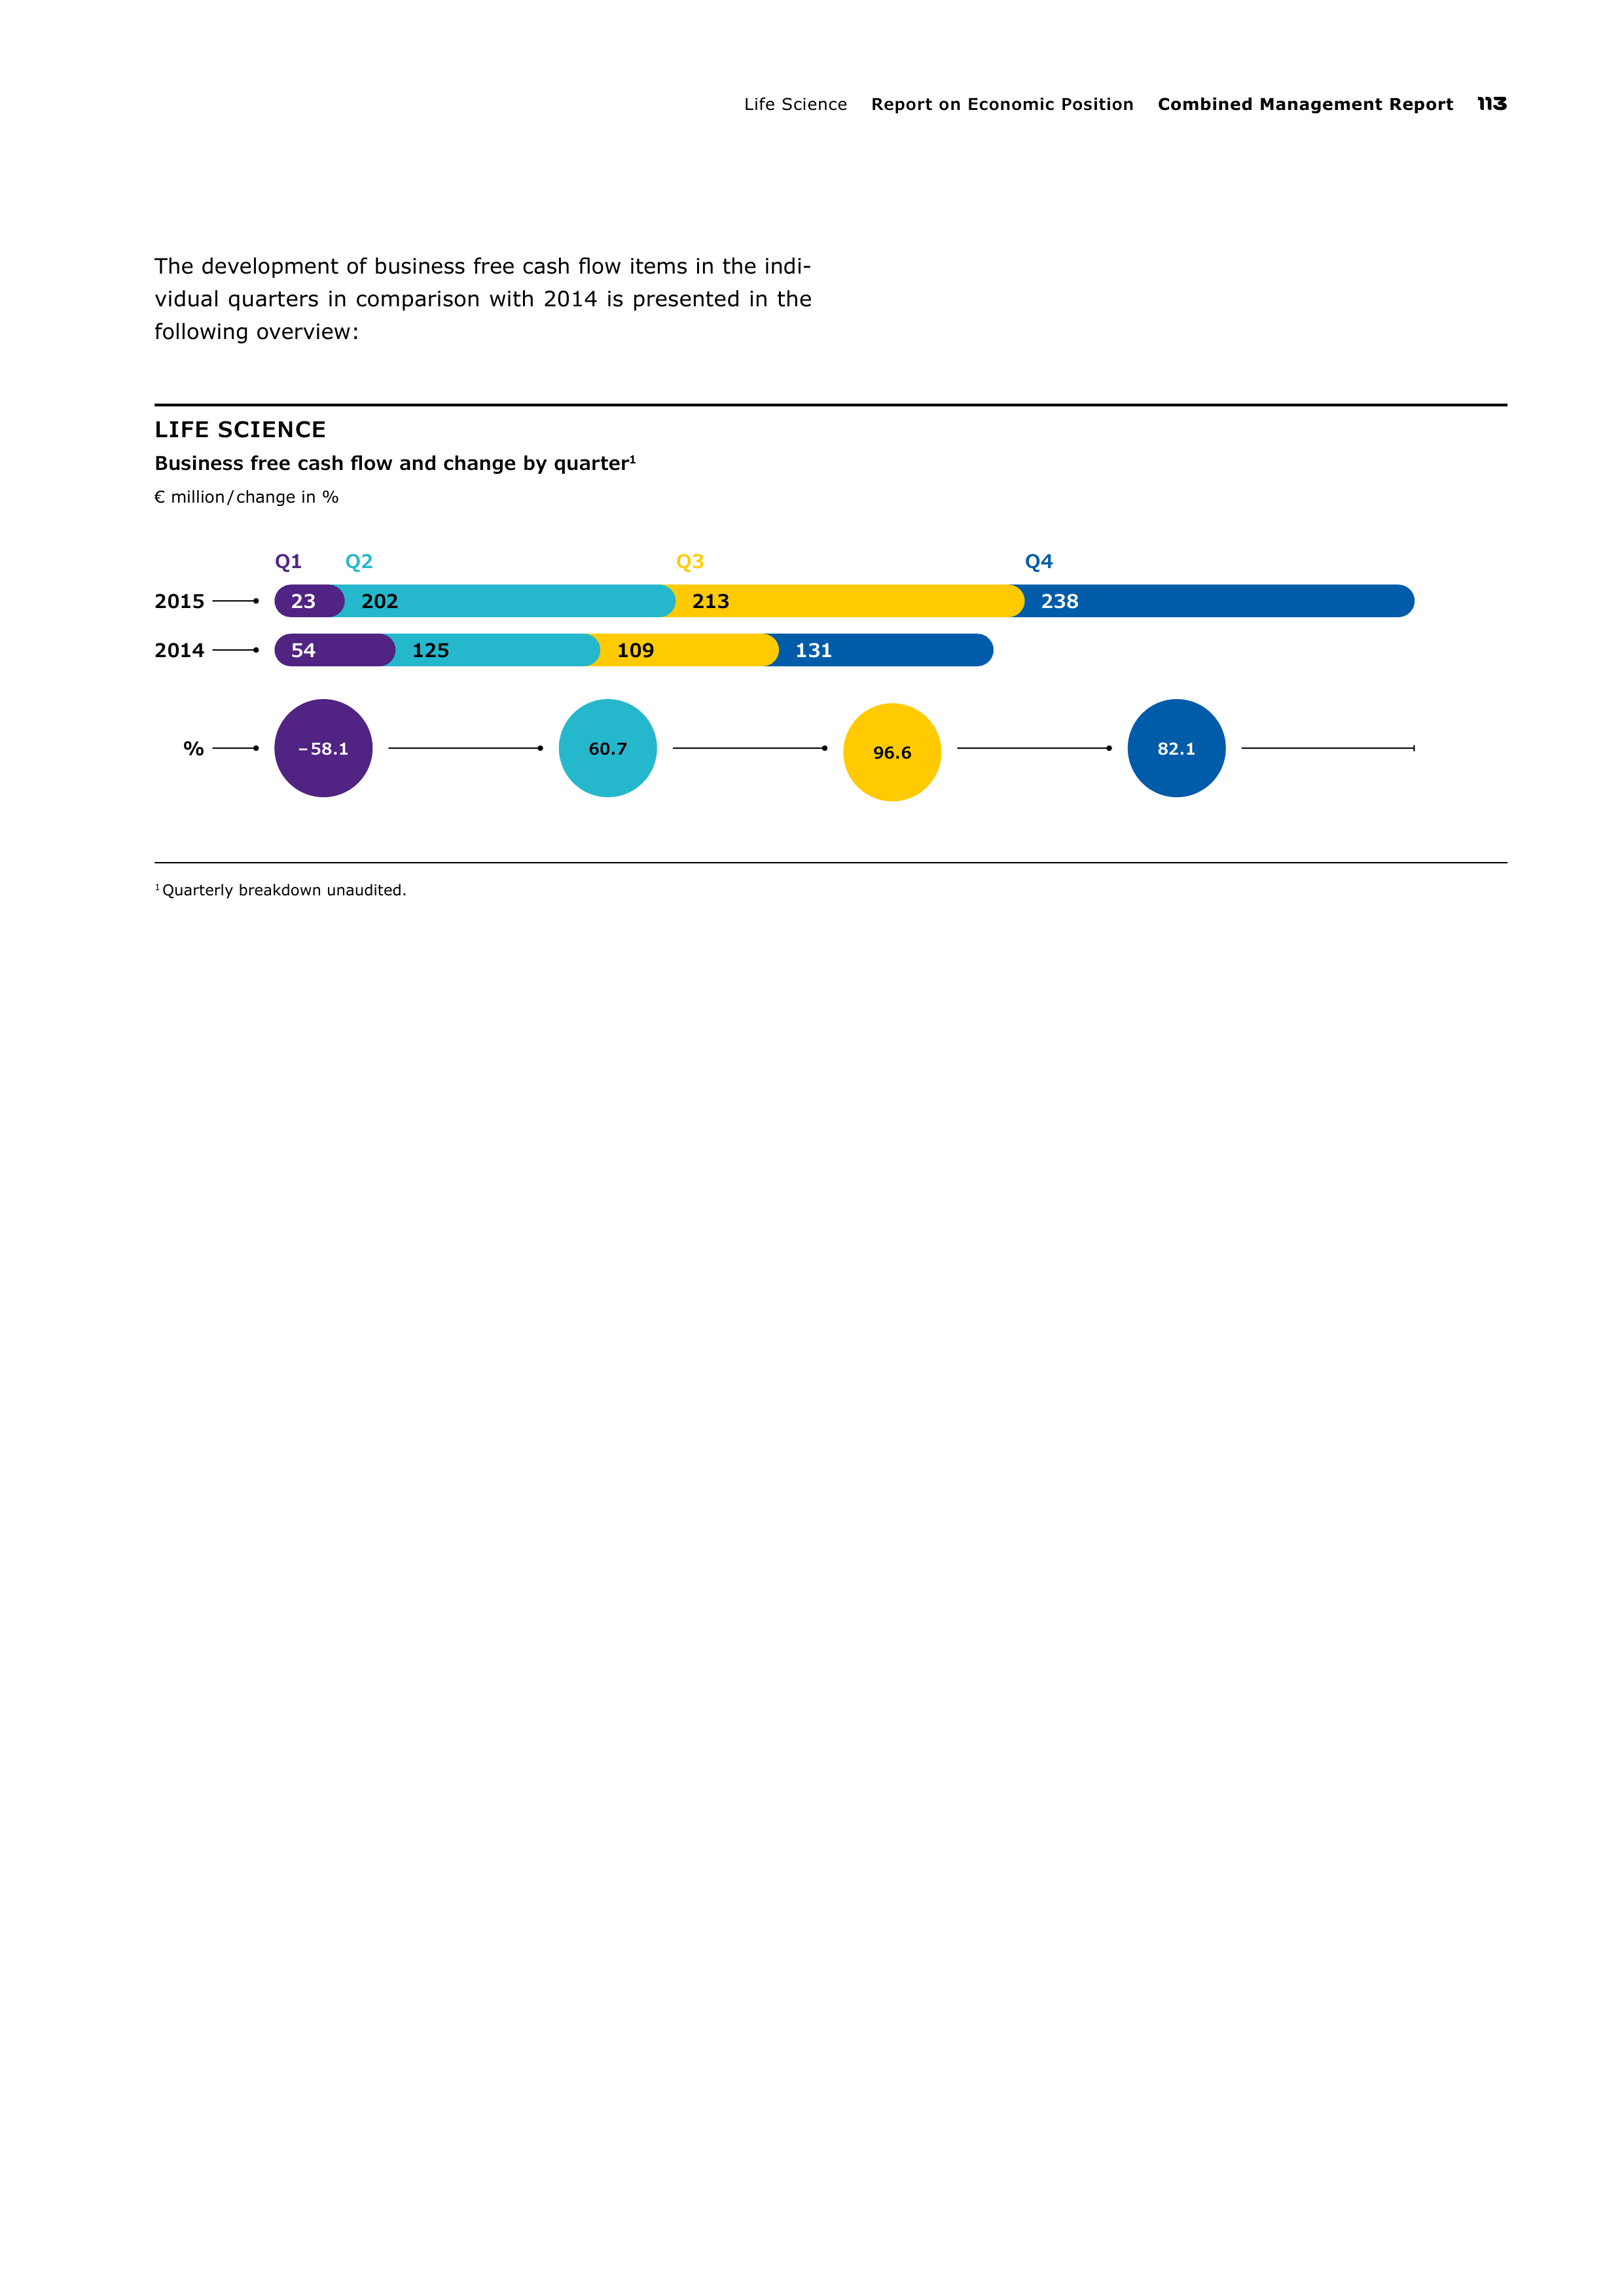
Life Scienc
Report on Economic Position
Combined Management Report
113
LIFE SCIENCE
Business free cash flow and change by quarter
1
€ million / change in %
1
Quarterly breakdown unaudited.
2015
2014
%
Q1
Q2
Q3
Q4
– 58.1
60.7
96.6
82.1
23
202
213
238
54
125
109
131
The development of business free cash flow items in the indi-
vidual quarters in comparison with 2014 is presented in the
following overview:
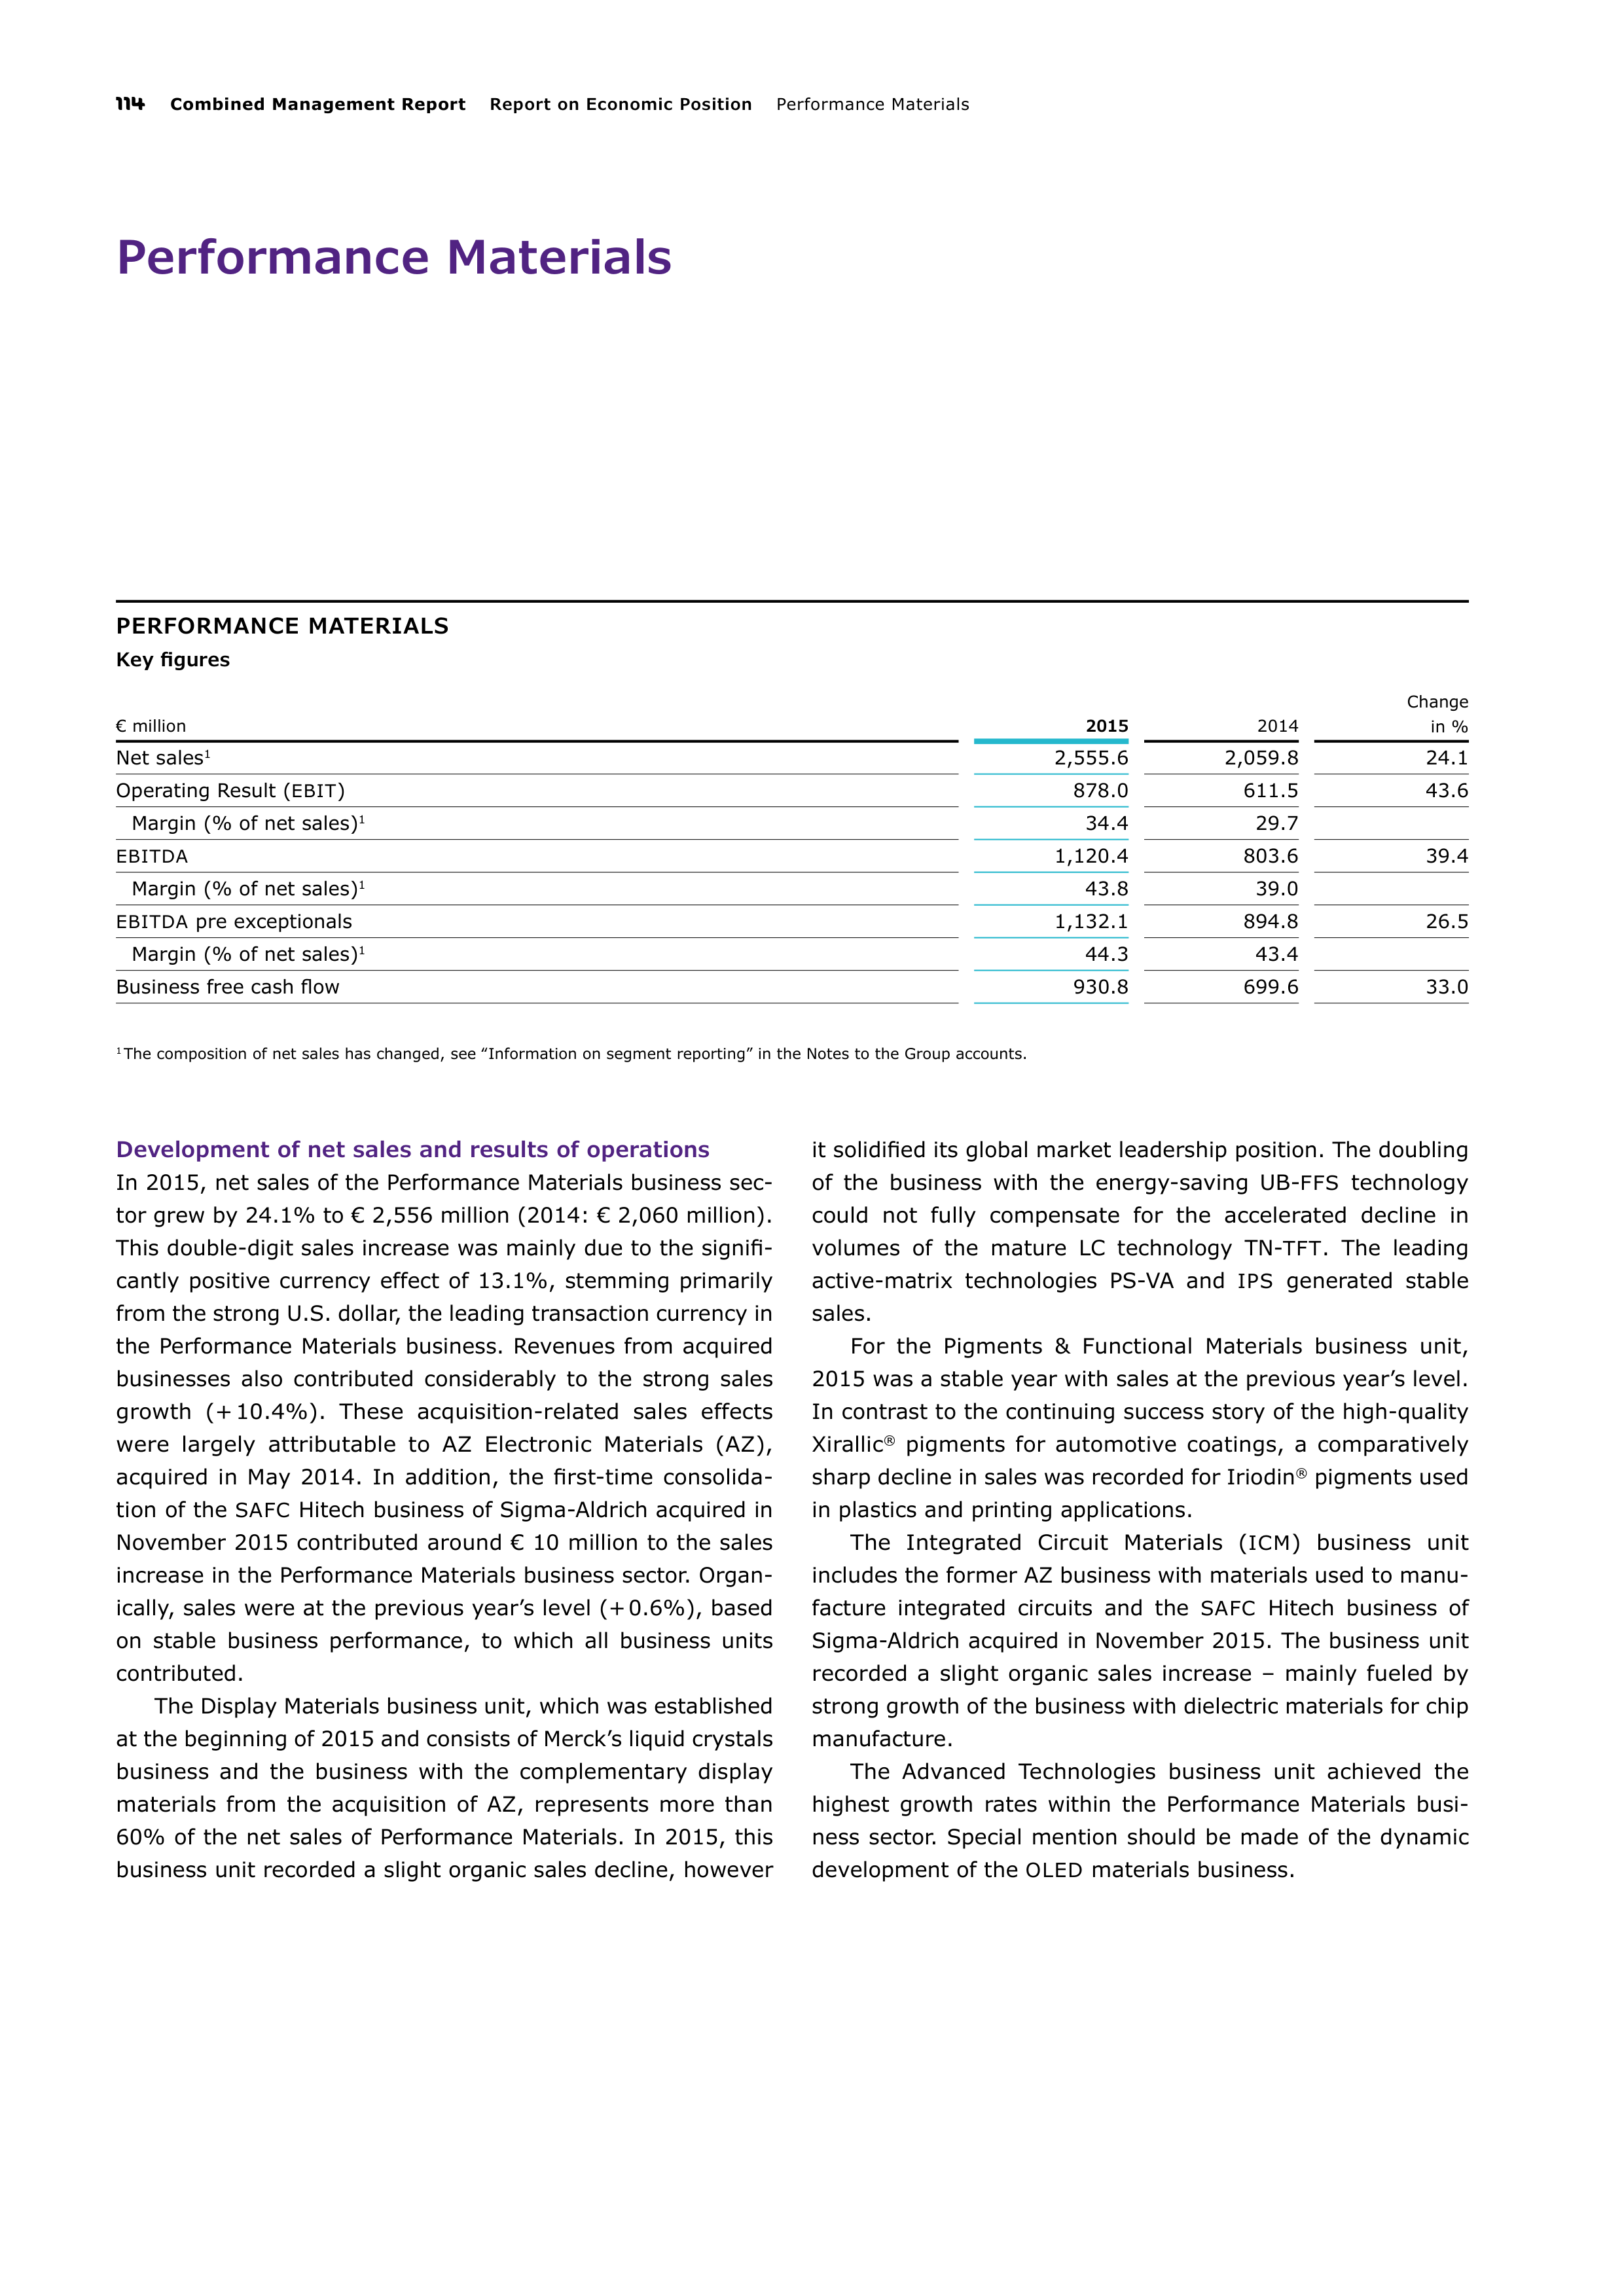
114
Combined Management Report
Report on Economic Position
Performance Material
Performance Materials
PERFORMANCE MATERIALS
Key figures
€ million
2015
2014
Change
in %
Net sales
1
2,555.6
2,059.8
24.1
Operating Result (
EBIT
)
878.0
611.5
43.6
Margin (% of net sales)
1
34.4
29.7
EBITDA
1,120.4
803.6
39.4
Margin (% of net sales)
1
43.8
39.0
EBITDA
pre exceptionals
1,132.1
894.8
26.5
Margin (% of net sales)
1
44.3
43.4
Business free cash flow
930.8
699.6
33.0
1
The composition of net sales has changed, see ‟Information on segment reporting” in the Notes to the Group accounts.
Development of net sales and results of operations
In 2015, net sales of the Performance Materials business sec-
tor grew by 24.1% to € 2,556 million (2014: € 2,060 million).
This double-digit sales increase was mainly due to the signifi-
cantly positive currency effect of 13.1%, stemming primarily
from the strong U.S. dollar, the leading transaction currency in
the Performance Materials business. Revenues from acquired
businesses also contributed considerably to the strong sales
growth (+ 10.4%). These acquisition-related sales effects
were largely attributable to AZ Electronic Materials (AZ),
acquired in May 2014. In addition, the first-time consolida-
tion
of the
SAFC
Hitech business of Sigma-Aldrich acquired in
November 2015 contributed around € 10 million to the sales
increase in the Performance Materials business sector. Organ-
ically, sales were at the previous year’s level (+ 0.6%), based
on stable business performance, to which all business units
contributed.
The Display Materials business unit, which was established
at the beginning of 2015 and consists of Merck’s liquid crystals
business and the business with the complementary display
materials from the acquisition of AZ, represents more than
60% of the net sales of Performance Materials. In 2015, this
business unit recorded a slight organic sales decline, however
it solidified its global market leadership position. The doubling
of the business with the energy-saving UB-
FFS
technology
could not fully compensate for the accelerated decline in
volumes of the mature LC technology TN-
TFT
. The leading
active-matrix technologies PS-VA and
IPS
generated stable
sales.
For the Pigments & Functional Materials business unit,
2015 was a stable year with sales at the previous year’s level.
In contrast to the continuing success story of the high-quality
Xirallic
®
pigments for automotive coatings, a comparatively
sharp decline in sales was recorded for Iriodin
®
pigments used
in plastics and printing applications.
The Integrated Circuit Materials (
ICM
) business unit
includes the former AZ business with materials used to manu-
facture integrated circuits and the
SAFC
Hitech business of
Sigma-Aldrich acquired in November 2015. The business unit
recorded a slight organic sales increase – mainly fueled by
strong growth of the business with dielectric materials for chip
manufacture.
The Advanced Technologies business unit achieved the
highest growth rates within the Performance Materials busi-
ness sector. Special mention should be made of the dynamic
development of the
OLED
materials business.
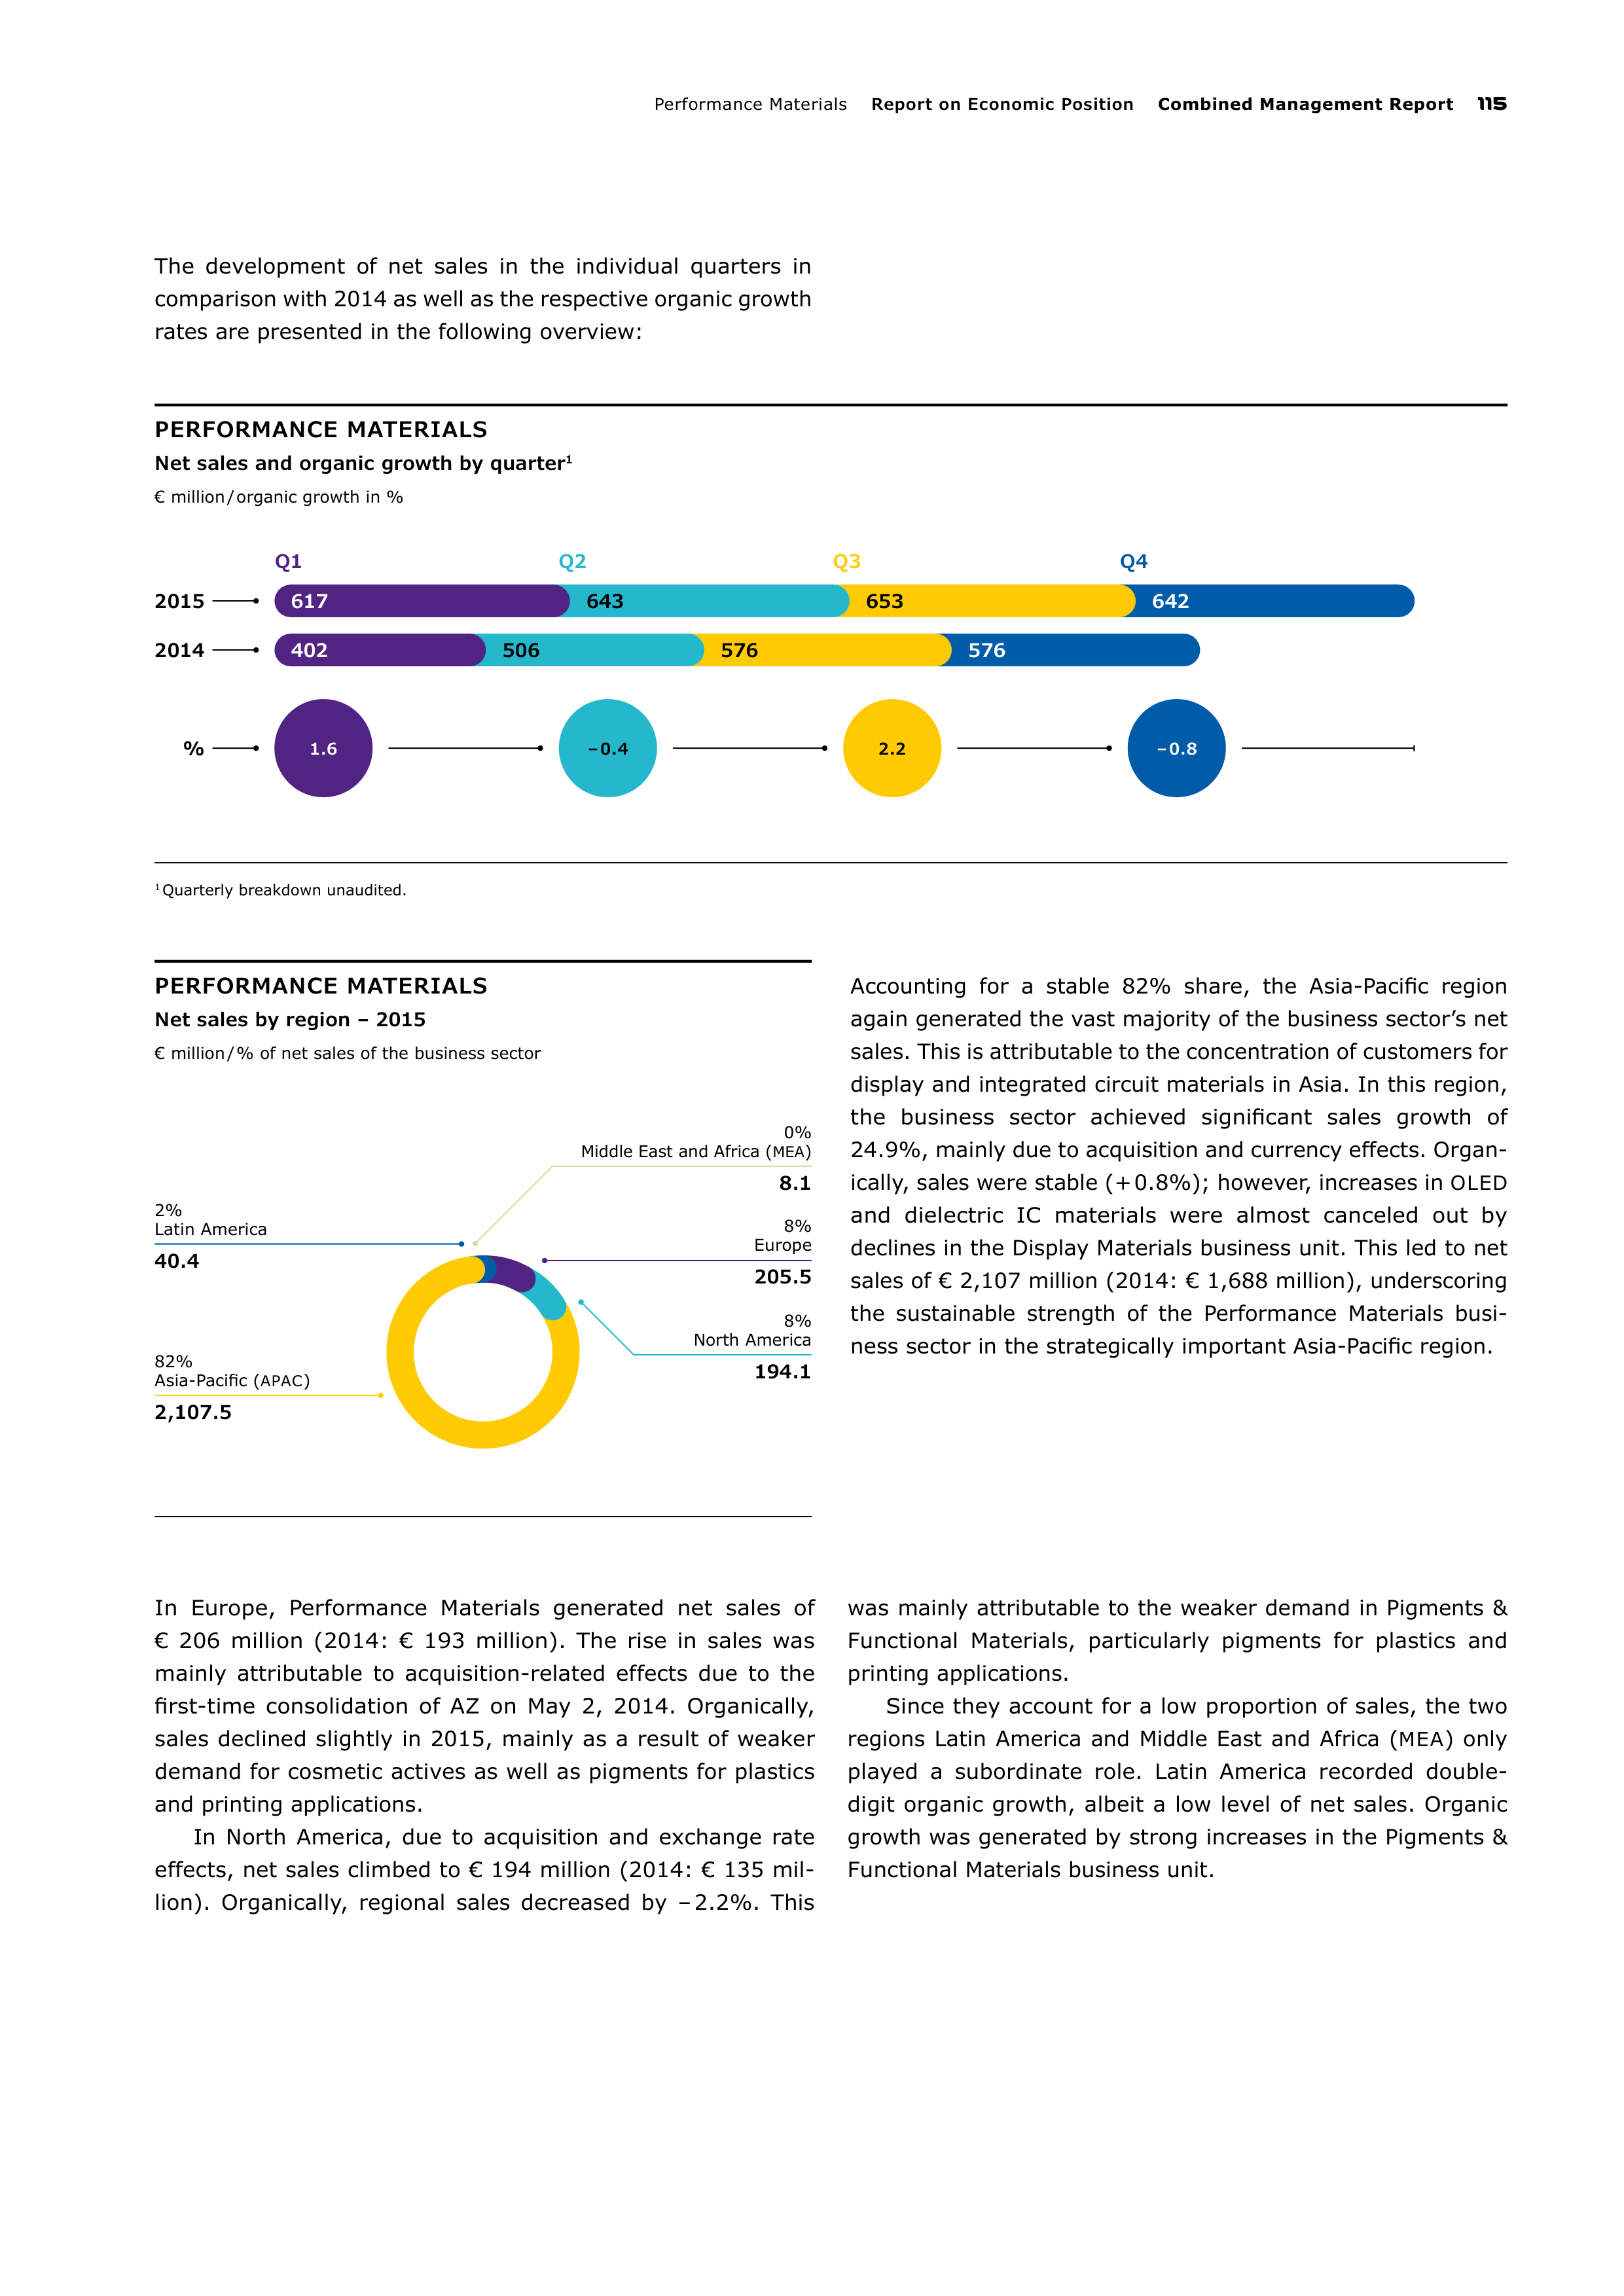
Performance Material
Report on Economic Position
Combined Management Report
115
PERFORMANCE MATERIALS
Net sales and organic growth by quarter
1
€ million / organic growth in %
1
Quarterly breakdown unaudited.
2015
2014
Q1
Q2
Q3
Q4
617
643
653
642
402
506
576
576
%
1.6
– 0.4
2.2
– 0.8
PERFORMANCE MATERIALS
Net sales by region – 2015
€ million / % of net sales of the business sector
82%
Asia-Pacific (
APAC
)
2,107.5
8%
North America
194.1
0%
Middle East and Africa (
MEA
)
8.1
8%
Europe
205.5
2%
Latin America
40.4
Accounting for a stable 82% share, the Asia-Pacific region
again generated the vast majority of the business sector’s net
sales. This is attributable to the concentration of customers for
display and integrated circuit materials in Asia. In this region,
the business sector achieved significant sales growth of
24.9%, mainly due to acquisition and currency effects. Organ-
ically, sales were stable (+ 0.8%); however, increases in
OLED
and dielectric IC materials were almost canceled out by
declines in the Display Materials business unit. This led to net
sales of € 2,107 million (2014: € 1,688 million), underscoring
the sustainable strength of the Performance Materials busi-
ness sector in the strategically important Asia-Pacific region.
In Europe, Performance Materials generated net sales of
€ 206 million (2014: € 193 million). The rise in sales was
mainly attributable to acquisition-related effects due to the
first-time consolidation of AZ on May 2, 2014. Organically,
sales declined slightly in 2015, mainly as a result of weaker
demand for cosmetic actives as well as pigments for plastics
and printing applications.
In North America, due to acquisition and exchange rate
effects, net sales climbed to € 194 million (2014: € 135 mil-
lion). Organically, regional sales decreased by – 2.2%. This
was
mainly attributable to the weaker demand in Pigments &
Functional Materials, particularly pigments for plastics and
printing applications.
Since they account for a low proportion of sales, the two
regions Latin America and Middle East and Africa (
MEA
) only
played a subordinate role. Latin America recorded double-
digit organic growth, albeit a low level of net sales. Organic
growth
was generated by strong increases in the Pigments &
Func
tional
Materials business unit.
The development of net sales in the individual quarters in
comparison with 2014 as well as the respective organic growth
rates are presented in the following overview:
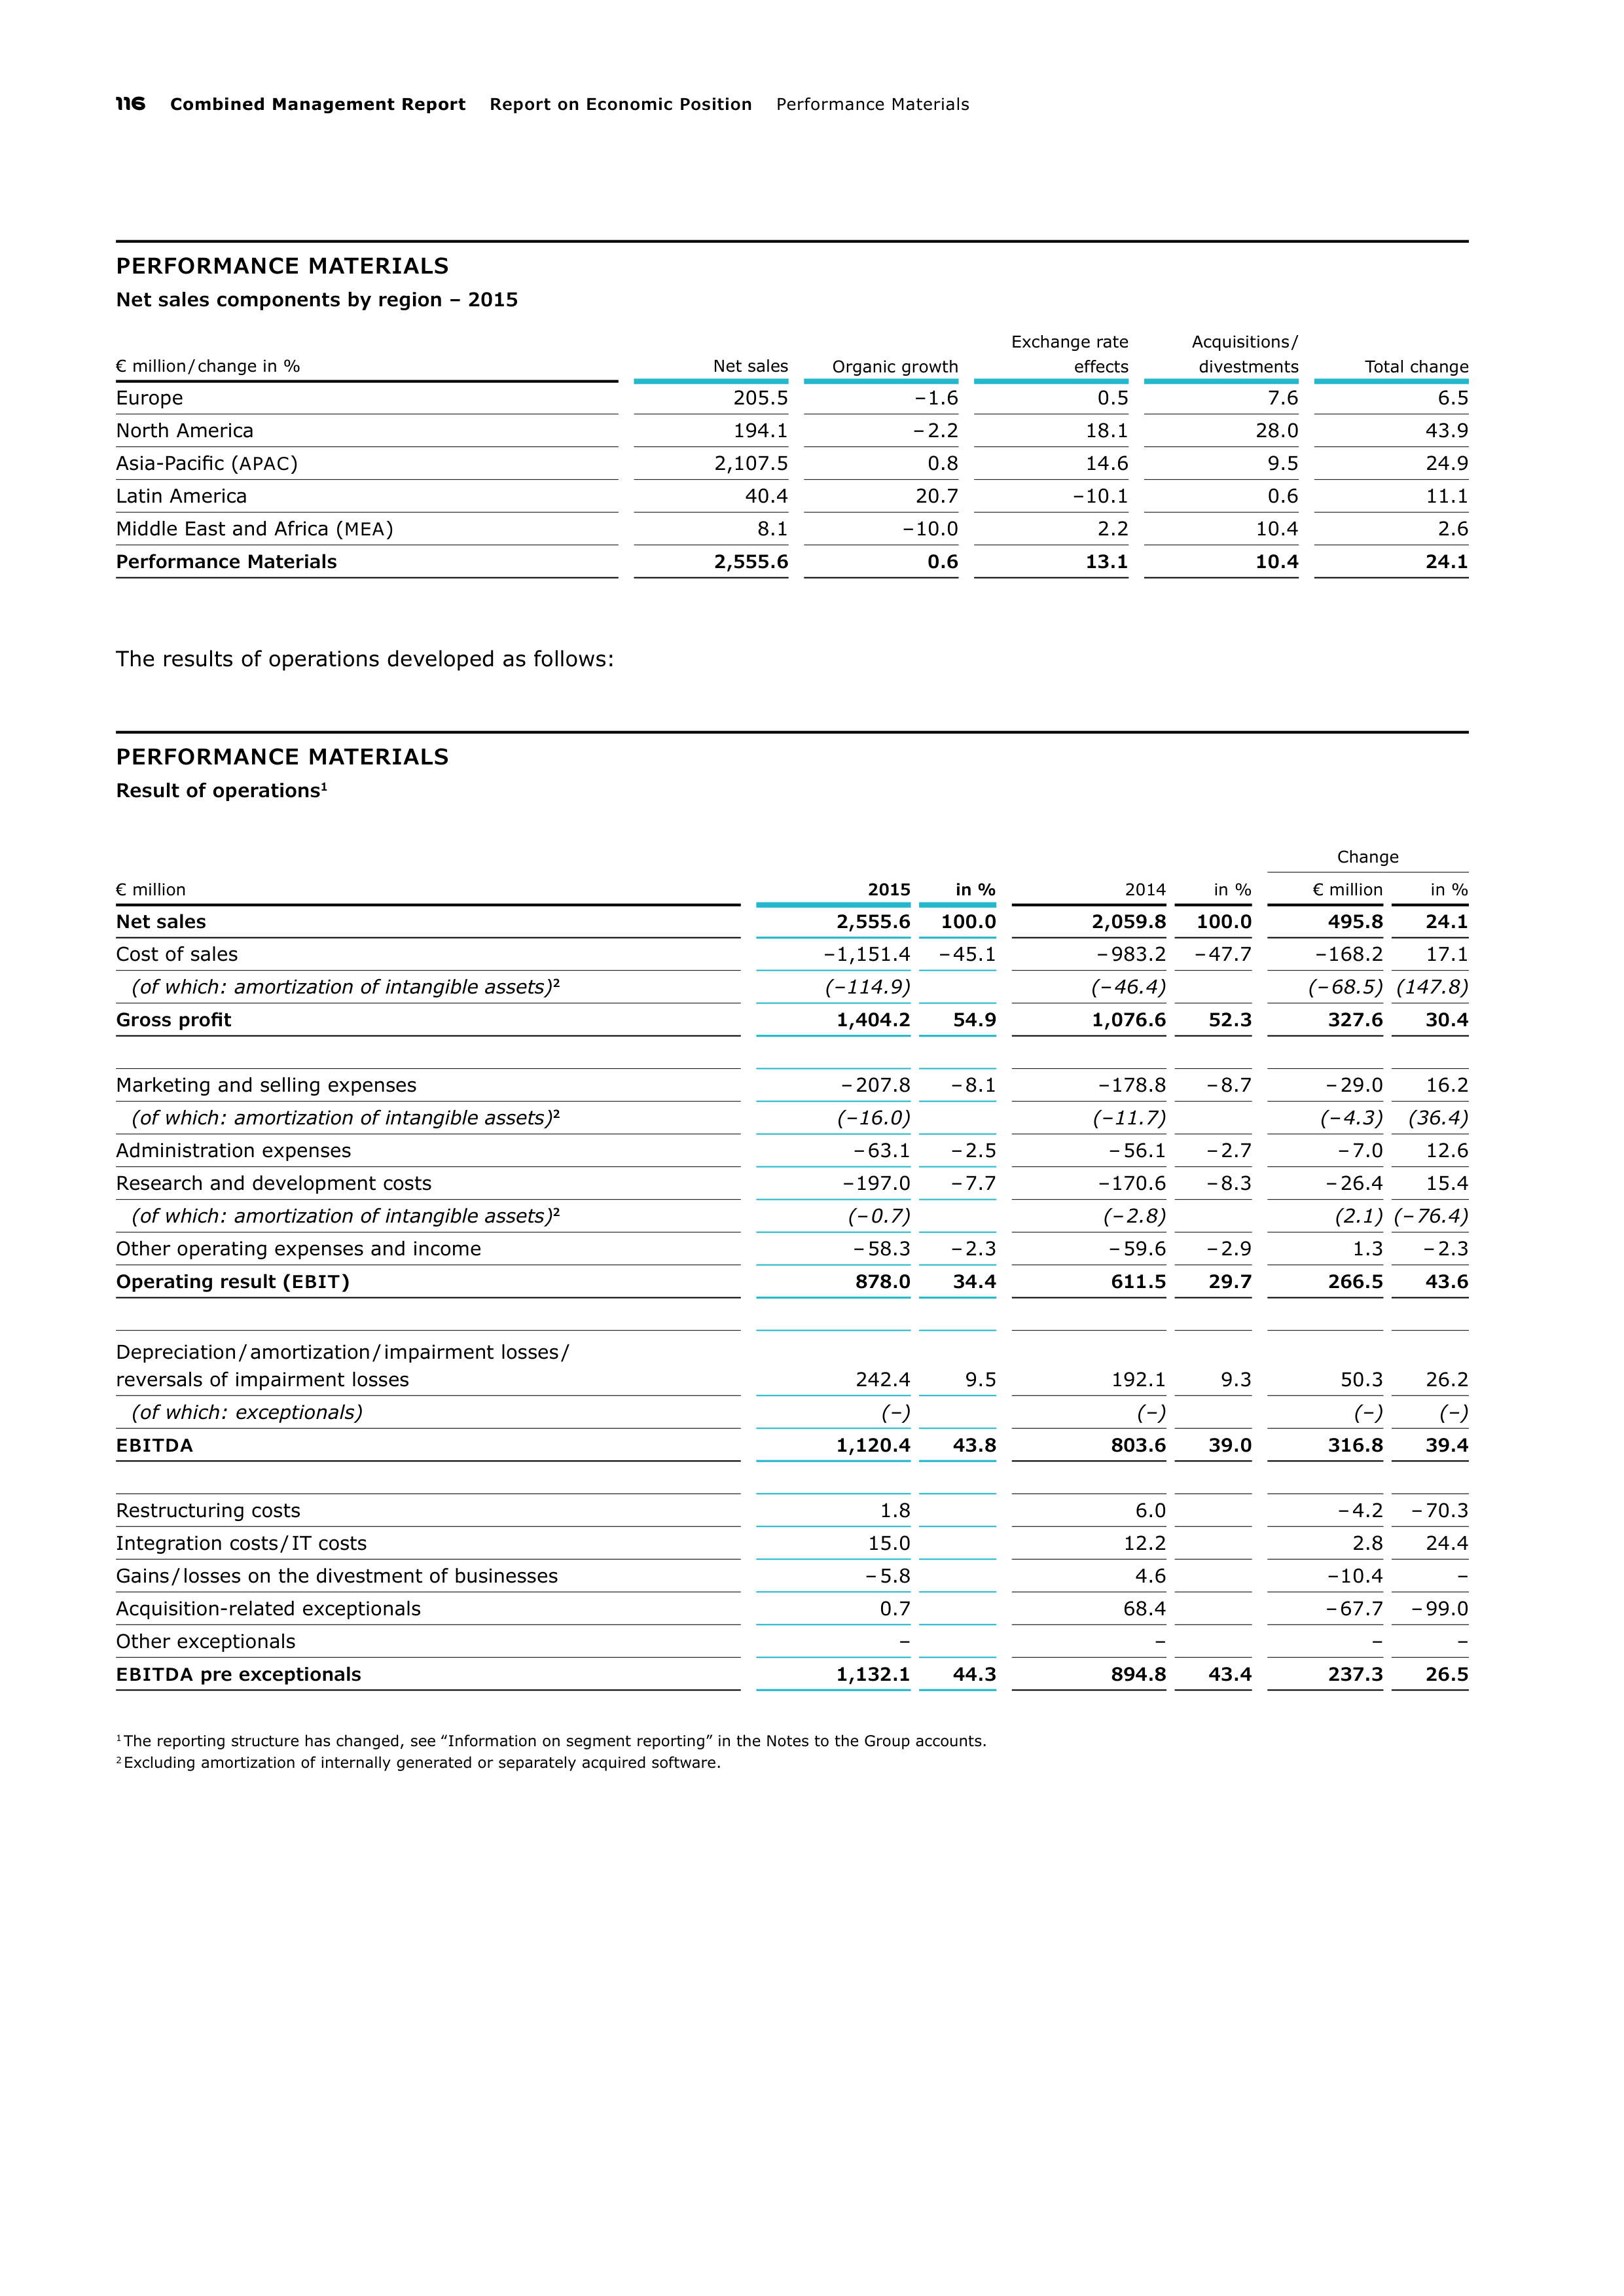
116
Combined Management Report
Report on Economic Position
Performance Material
PERFORMANCE MATERIALS
Net sales components by region – 2015
€ million / change in %
Net sales
Organic growth
Exchange rate
effects
Acquisitions /
divestments
Total change
Europe
205.5
– 1.6
0.5
7.6
6.5
North America
194.1
– 2.2
18.1
28.0
43.9
Asia-Pacific (
APAC
)
2,107.5
0.8
14.6
9.5
24.9
Latin America
40.4
20.7
– 10.1
0.6
11.1
Middle East and Africa (
MEA
)
8.1
– 10.0
2.2
10.4
2.6
Performance Materials
2,555.6
0.6
13.1
10.4
24.1
The results of operations developed as follows:
PERFORMANCE MATERIALS
Result of operations
1
Change
€ million
2015
in %
2014
in %
€ million
in %
Net sales
2,555.6
100.0
2,059.8
100.0
495.8
24.1
Cost of sales
– 1,151.4
– 45.1
– 983.2
– 47.7
– 168.2
17.1
(of which: amortization of intangible assets)
2
(– 114.9)
(– 46.4)
(– 68.5)
(147.8)
Gross profit
1,404.2
54.9
1,076.6
52.3
327.6
30.4
Marketing and selling expenses
– 207.8
– 8.1
– 178.8
– 8.7
– 29.0
16.2
(of which: amortization of intangible assets)
2
(– 16.0)
(– 11.7)
(– 4.3)
(36.4)
Administration expenses
– 63.1
– 2.5
– 56.1
– 2.7
– 7.0
12.6
Research and development costs
– 197.0
– 7.7
– 170.6
– 8.3
– 26.4
15.4
(of which: amortization of intangible assets)
2
(– 0.7)
(– 2.8)
(2.1)
(– 76.4)
Other operating expenses and income
– 58.3
– 2.3
– 59.6
– 2.9
1.3
– 2.3
Operating result (
EBIT
)
878.0
34.4
611.5
29.7
266.5
43.6
Depreciation / amortization / impairment losses /
reversals of impairment losses
242.4
9.5
192.1
9.3
50.3
26.2
(of which: exceptionals)
(–)
(–)
(–)
(–)
EBITDA
1,120.4
43.8
803.6
39.0
316.8
39.4
Restructuring costs
1.8
6.0
– 4.2
– 70.3
Integration costs / IT costs
15.0
12.2
2.8
24.4
Gains / losses on the divestment of businesses
– 5.8
4.6
– 10.4
–
Acquisition-related exceptionals
0.7
68.4
– 67.7
– 99.0
Other exceptionals
–
–
–
–
EBITDA
pre exceptionals
1,132.1
44.3
894.8
43.4
237.3
26.5
1
The reporting structure has changed, see ‟Information on segment reporting” in the Notes to the Group accounts.
2
Excluding amortization of internally generated or separately acquired software.
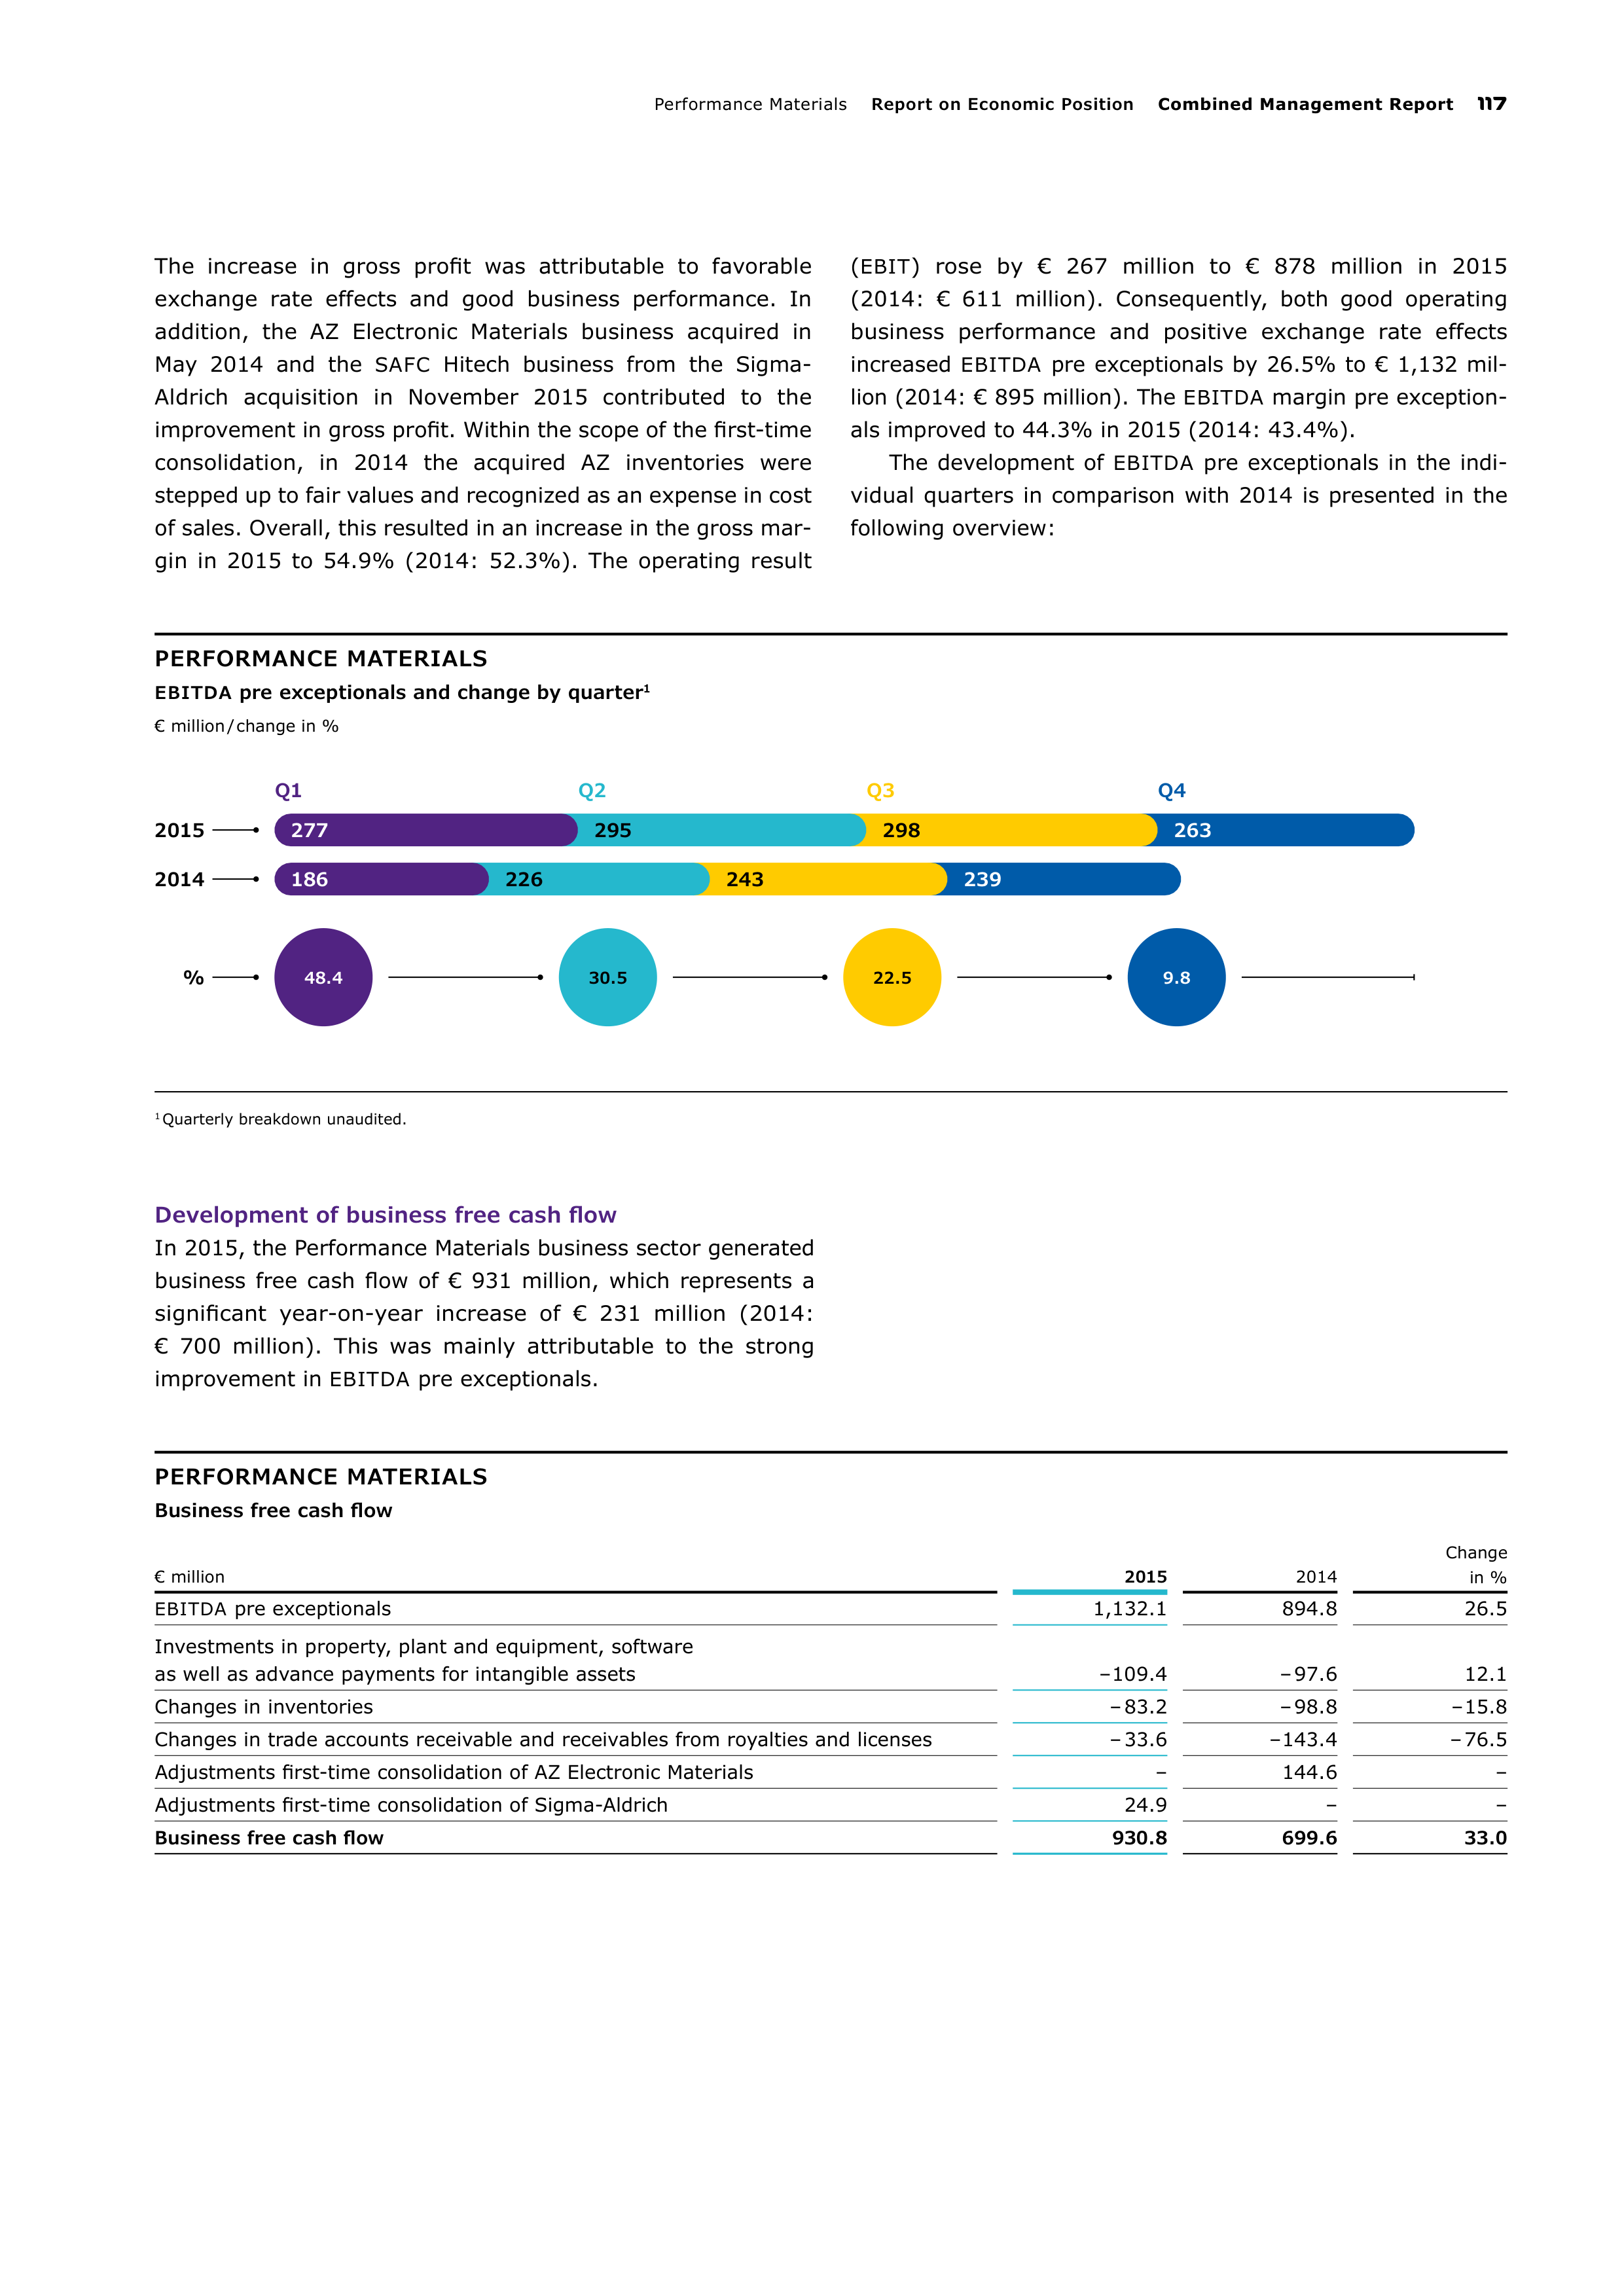
Performance Material
Report on Economic Position
Combined Management Report
117
PERFORMANCE MATERIALS
EBITDA
pre exceptionals and change by quarter
1
€ million / change in %
1
Quarterly breakdown unaudited.
Q1
Q2
Q3
Q4
2015
2014
%
48.4
30.5
22.5
9.8
277
295
298
263
186
226
243
239
The increase in gross profit was attributable to favorable
exchange rate effects and good business performance. In
addition, the AZ Electronic Materials business acquired in
May
2014 and the
SAFC
Hitech business from the Sigma-
Aldrich acquisition in November
2015 contributed to the
improvement in gross profit. Within the scope of the first-time
consolidation, in 2014 the acquired AZ inventories were
stepped up to fair values and recognized as an expense in cost
of sales. Overall, this resulted in an increase in the gross mar-
gin in 2015 to 54.9% (2014: 52.3%). The operating result
(
EBIT
) rose by €
267
million to €
878
million in 2015
(2014: € 611 million). Consequently, both good operating
business performance and positive exchange rate effects
increased
EBITDA
pre exceptionals by 26.5% to € 1,132 mil-
lion (2014:
€ 895 million). The
EBITDA
margin pre exception-
als improved to 44.3% in 2015 (2014: 43.4%).
The development of
EBITDA
pre exceptionals in the indi-
vidual quarters in comparison with 2014 is presented in the
following overview:
Development of business free cash flow
In 2015, the Performance Materials business sector generated
business free cash flow of € 931 million, which represents a
significant year-on-year increase of € 231 million (2014:
€ 700 million). This was mainly attributable to the strong
improvement in
EBITDA
pre exceptionals.
PERFORMANCE MATERIALS
Business free cash flow
€ million
2015
2014
Change
in %
EBITDA
pre exceptionals
1,132.1
894.8
26.5
Investments in property, plant and equipment, software
as well as advance payments for intangible assets
– 109.4
– 97.6
12.1
Changes in inventories
– 83.2
– 98.8
– 15.8
Changes in trade accounts receivable and receivables from royalties and licenses
– 33.6
– 143.4
– 76.5
Adjustments first-time consolidation of AZ Electronic Materials
–
144.6
–
Adjustments first-time consolidation of Sigma-Aldrich
24.9
–
–
Business free cash flow
930.8
699.6
33.0
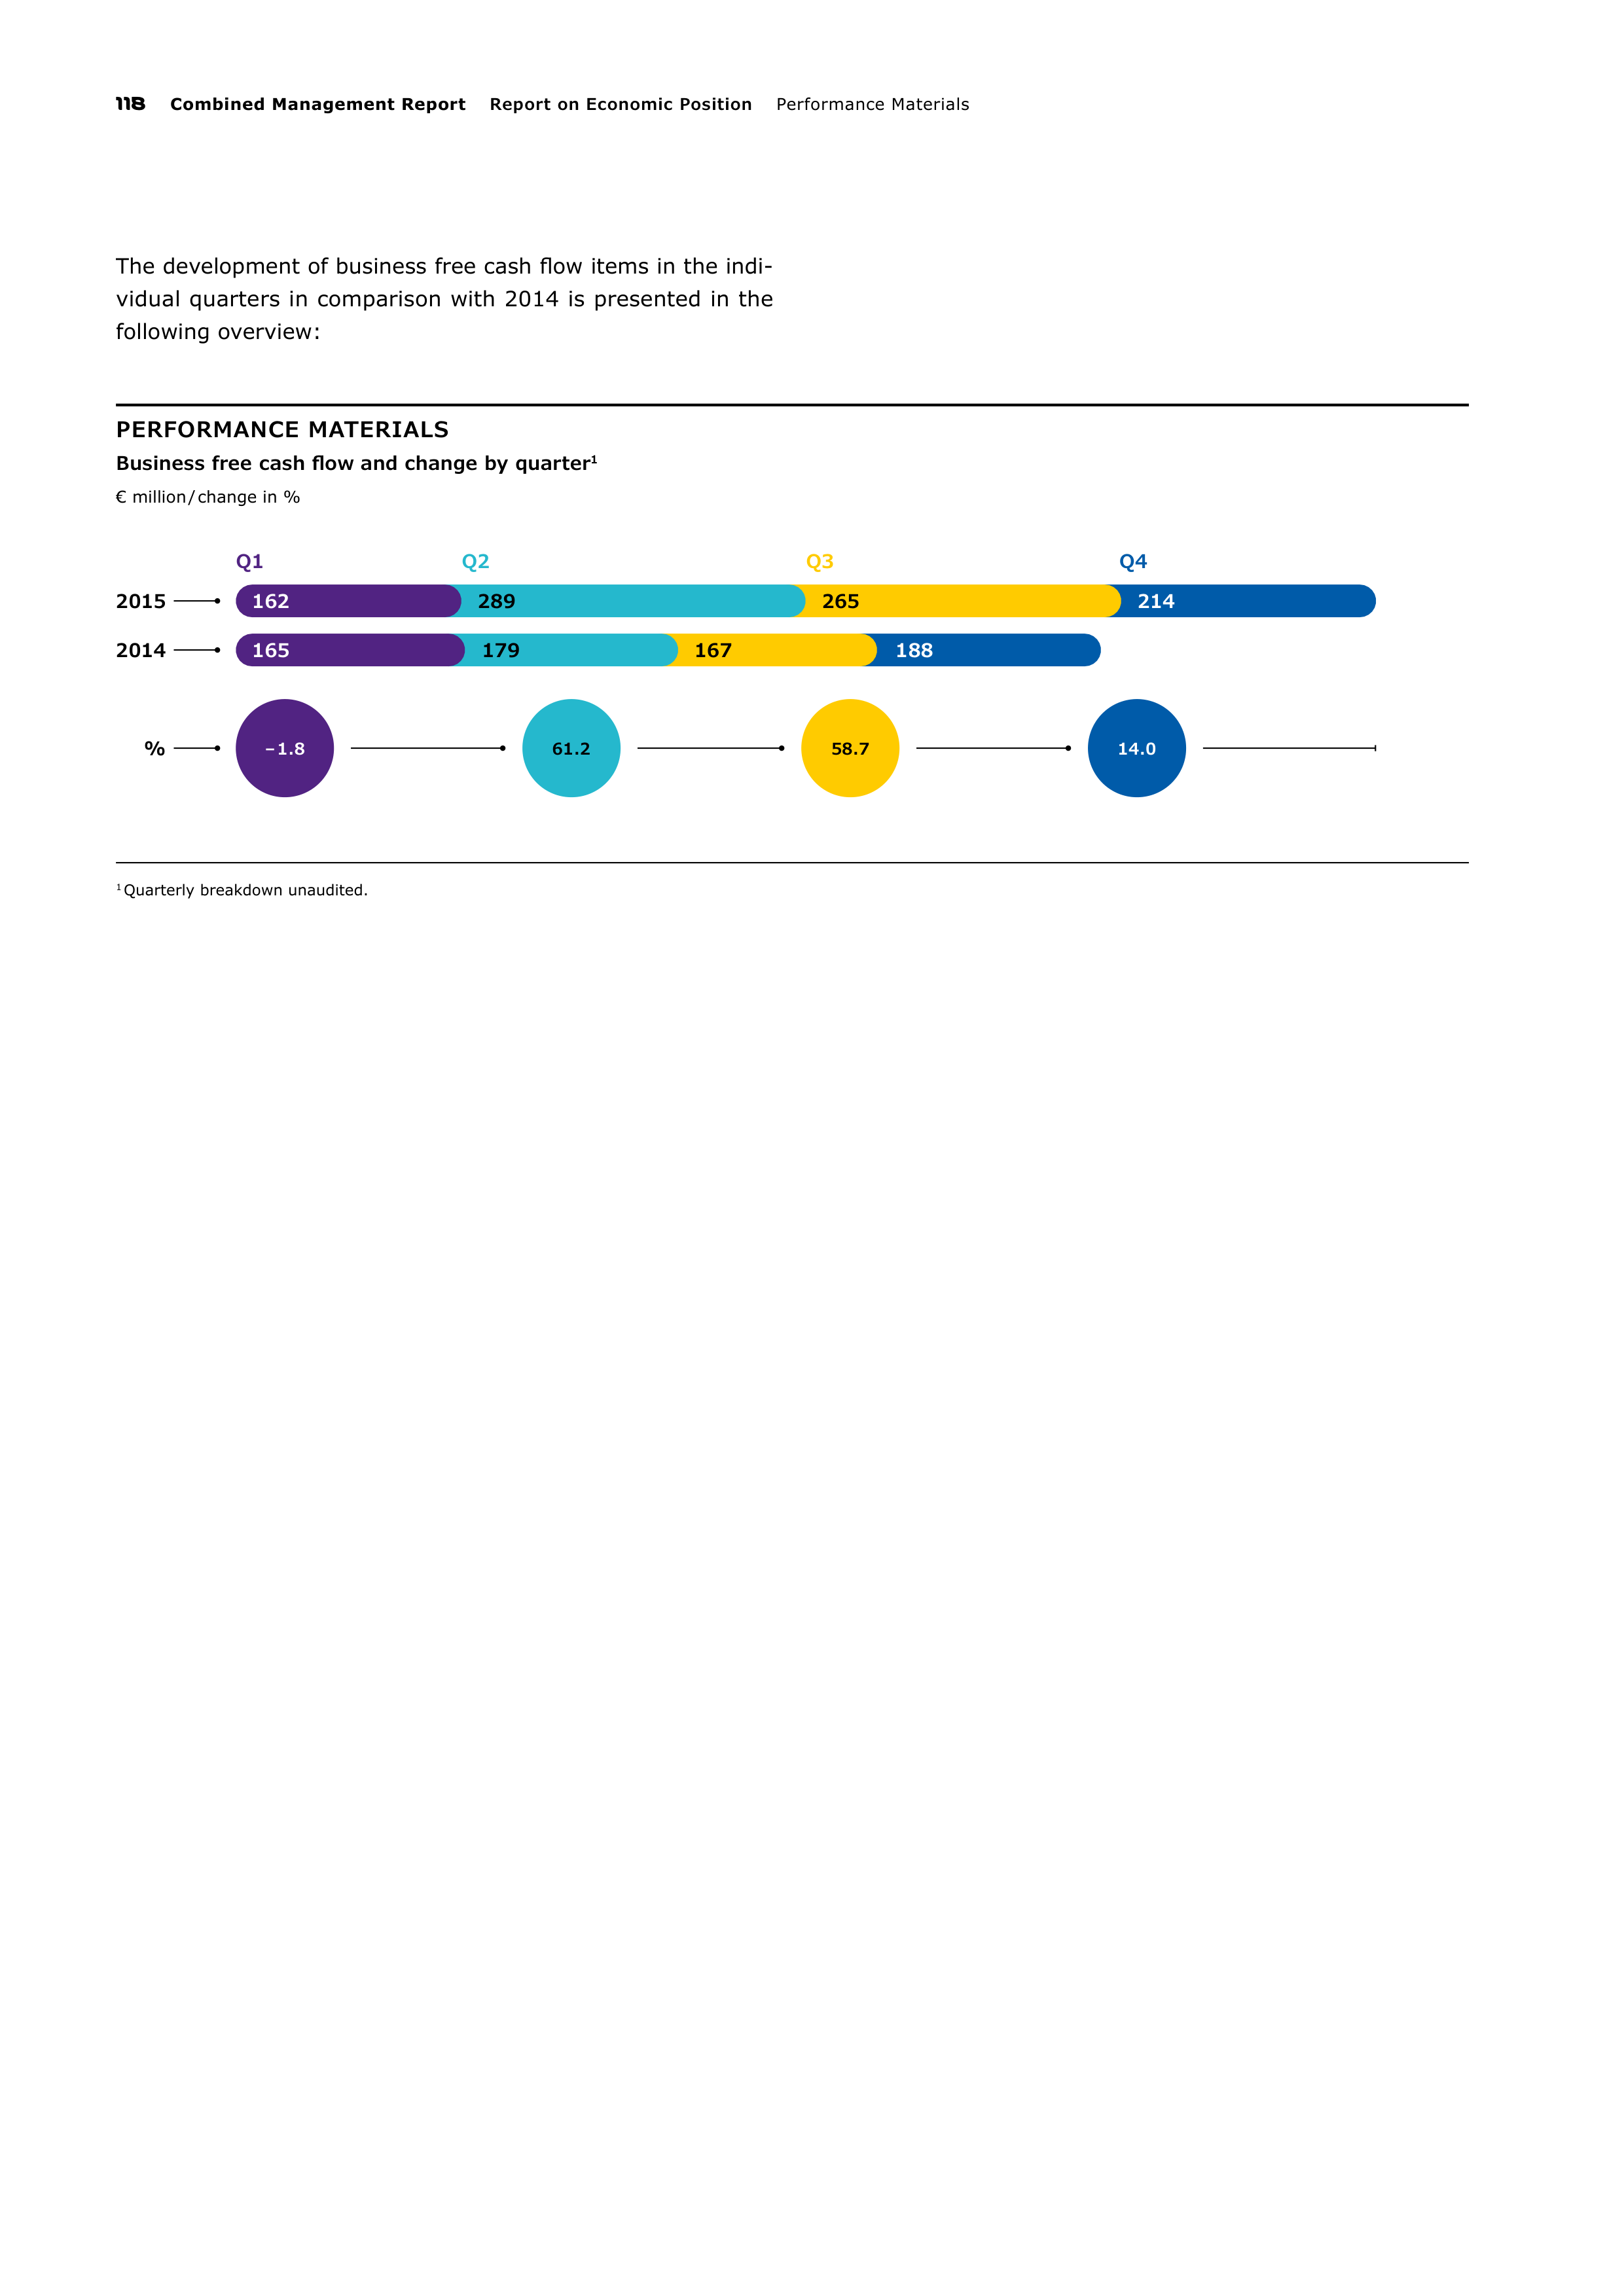
118
Combined Management Report
Report on Economic Position
Performance Material
PERFORMANCE MATERIALS
Business free cash flow and change by quarter
1
€ million / change in %
1
Quarterly breakdown unaudited.
Q1
Q2
Q3
Q4
2015
2014
%
– 1.8
61.2
58.7
14.0
162
289
265
214
165
179
167
188
The development of business free cash flow items in the indi-
vidual quarters in comparison with 2014 is presented in the
following overview:
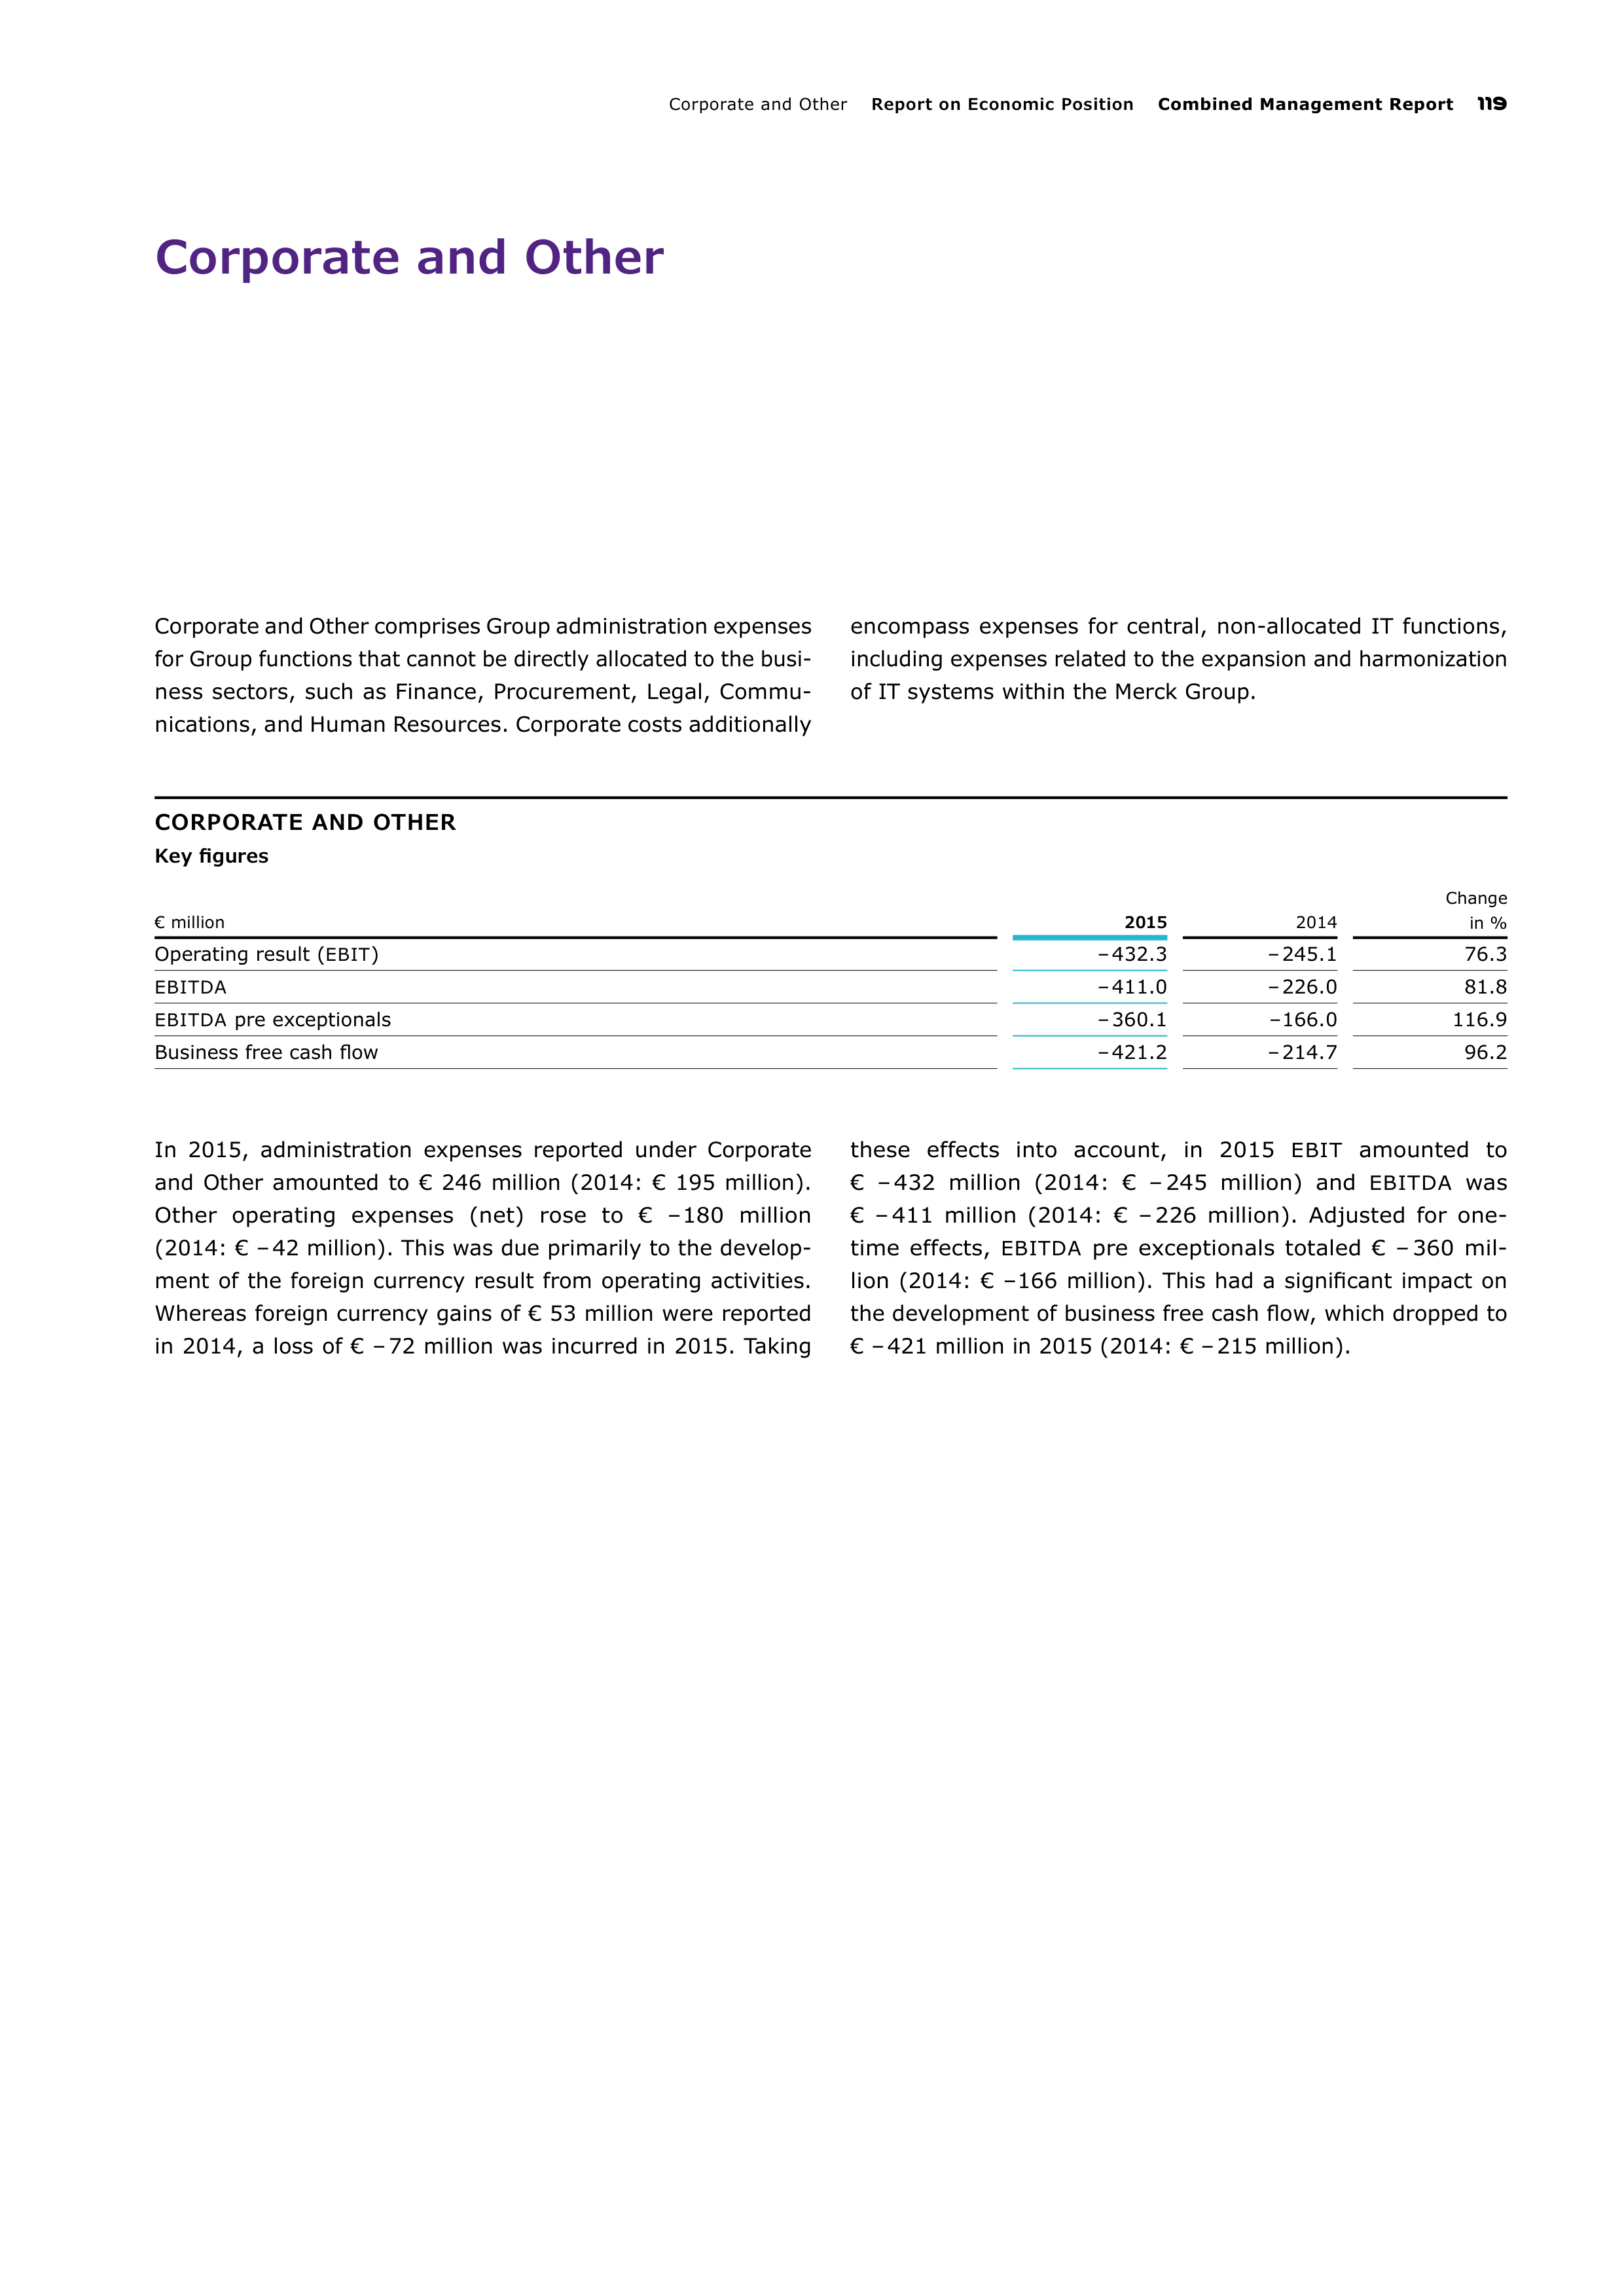
Corporate and Other
Report on Economic Position
Combined Management Report
119
Corporate and Other
Corporate and Other comprises Group administration expenses
for Group functions that cannot be directly allocated to the busi-
ness sectors, such as Finance, Procurement, Legal, Commu-
nications, and Human Resources. Corporate costs additionally
encompass expenses for central, non-allocated IT functions,
including expenses related to the expansion and harmonization
of IT systems within the Merck Group.
CORPORATE AND OTHER
Key figures
€ million
2015
2014
Change
in %
Operating result (
EBIT
)
– 432.3
– 245.1
76.3
EBITDA
– 411.0
– 226.0
81.8
EBITDA
pre exceptionals
– 360.1
– 166.0
116.9
Business free cash flow
– 421.2
– 214.7
96.2
In 2015, administration expenses reported under Corporate
and Other amounted to € 246 million (2014: € 195 million).
Other operating expenses (net) rose to €
– 180
million
(2014: € – 42 million). This was due primarily to the develop-
ment of the foreign currency result from operating activities.
Whereas foreign currency gains of € 53 million were reported
in 2014, a loss of € – 72 million was incurred in 2015. Taking
these effects into account, in 2015
EBIT
amounted to
€ – 432 million (2014: € – 245 million) and
EBITDA
was
€ – 411 million (2014: € – 226 million). Adjusted for one-
time effects,
EBITDA
pre exceptionals totaled € – 360 mil-
lion
(2014: € – 166 million). This had a significant impact on
the development of business free cash flow, which dropped to
€ – 421 million in 2015 (2014: € – 215 million).
120
Combined Management Report
Report on Risks and Opportunities
REPORT ON RISKS AND OPPORTUNITIES
Risks and opportunities are inherent to entrepreneurial activity.
We have put systems and processes in place to identify risks
at an early stage and to counteract them by taking appropriate
action. Within the company, opportunity management is an
integral component of internal decision-making processes such
as short- and medium-term operational planning and intra-year
business plans.
Risk and opportunity management
Merck is part of a complex, global business world and is there-
fore exposed to a multitude of external and internal influences.
Every business decision is therefore based on the associated
risks and opportunities.
In our internal risk reporting, risks are defined as possible
future events or developments that could lead to a negative
deviation from our (financial) targets. In parallel, opportuni-
ties are defined as possible events or developments that imply
a positive deviation from our planned (financial) targets. Iden-
tified future events and expected developments are taken into
account in internal planning provided that it can be assumed
that their occurrence is likely in the planning period. The risks
and opportunities presented in the following risk and oppor
tu-
nities report are those possible future events that could
res
pectively lead to a negative or positive deviation from the
topics covered by planning.
Risk management process
The objective of our risk management activities is to recognize,
assess and manage risks early on and to implement appropriate
measures to minimize them. The responsibilities, objectives
and processes of risk management are described in our internal
risk management guidelines. The business heads, managing
directors of Merck subsidiaries, and the heads of Group func-
tions are specified as employees with responsibility for risks.
The group of consolidated companies for risk reporting pur-
poses is the same as the group of consolidated companies for
the consolidated financial statements. Every six months, the
risk owners assess their risk status and report their risk port-
folio to Risk Management. We use special risk management
software in the context of these activities.
If risk-mitigating measures can be taken, their impact on
risk is also assessed. The residual risk after the implementation
of mitigation measures is presented in the internal risk report
as
net risk. The planned timeframe for implementation and the
assumed mitigation effect are tracked by Group Risk Manage-
ment.
Group Controlling & Risk Management forms the organizational
framework for risk management and reports directly to the
Group Chief Financial Officer. Group Risk Management uses the
information reported to determine the current risk portfolio for
the Merck Group, presenting this in a report to the Executive
Board, the Supervisory Board and the Finance Committee with
detailed explanations twice per year. Furthermore, significant
changes in the assessment of the risks already known and
new significant risks can be reported at any time and are com-
municated to the corporate bodies on an ad hoc basis.
In the standard process a lower limit for reporting risks
is
set at a value of € 5 million and for the ad hoc process at
a value of € 25 million. Risks below these limits are steered
independently within the business sectors. The relevant time-
frame for internal risk reporting is five years. The effects of
risks described in this report on risks and opportunities are
presented as annual values. The assessment of the risks pre-
sented relates to December 31, 2015. There were no relevant
changes after the end of the reporting period that would have
necessitated an amended presentation of the risk situation
of
the Group.
Within the scope of audits, Group Internal Auditing regu-
larly reviews the performance of risk management processes
within the units and, at the same time, the communication of
relevant risks from the operating businesses to Group Risk
Management.
Opportunity management process
The risk management system described concentrates on
busi
ness risks, and not on opportunities at the same time. The
opportunity management process is integrated into our internal
controlling processes and carried out in the operating units on
the basis of the Group strategy. The businesses analyze and
assess potential market opportunities as part of strategy and
planning processes. In this connection, investment opportuni-
ties are examined and prioritized primarily in terms of their
potential value proposition in order to ensure an effective allo-
cation of resources. We selectively invest in growth markets to
leverage the opportunities of dynamic development and cus-
tomer proximity at a local level.
If the occurrence of the identified opportunities is rated as
likely, they are incorporated into the business plans and the
short-term forecasts. Trends going beyond this or events that
could lead to a positive development in the net assets, financial
position and results of operations are presented in the following
report as opportunities. These could have a positive effect on
our medium-term prospects and lead to a positive deviation
from forecasts.
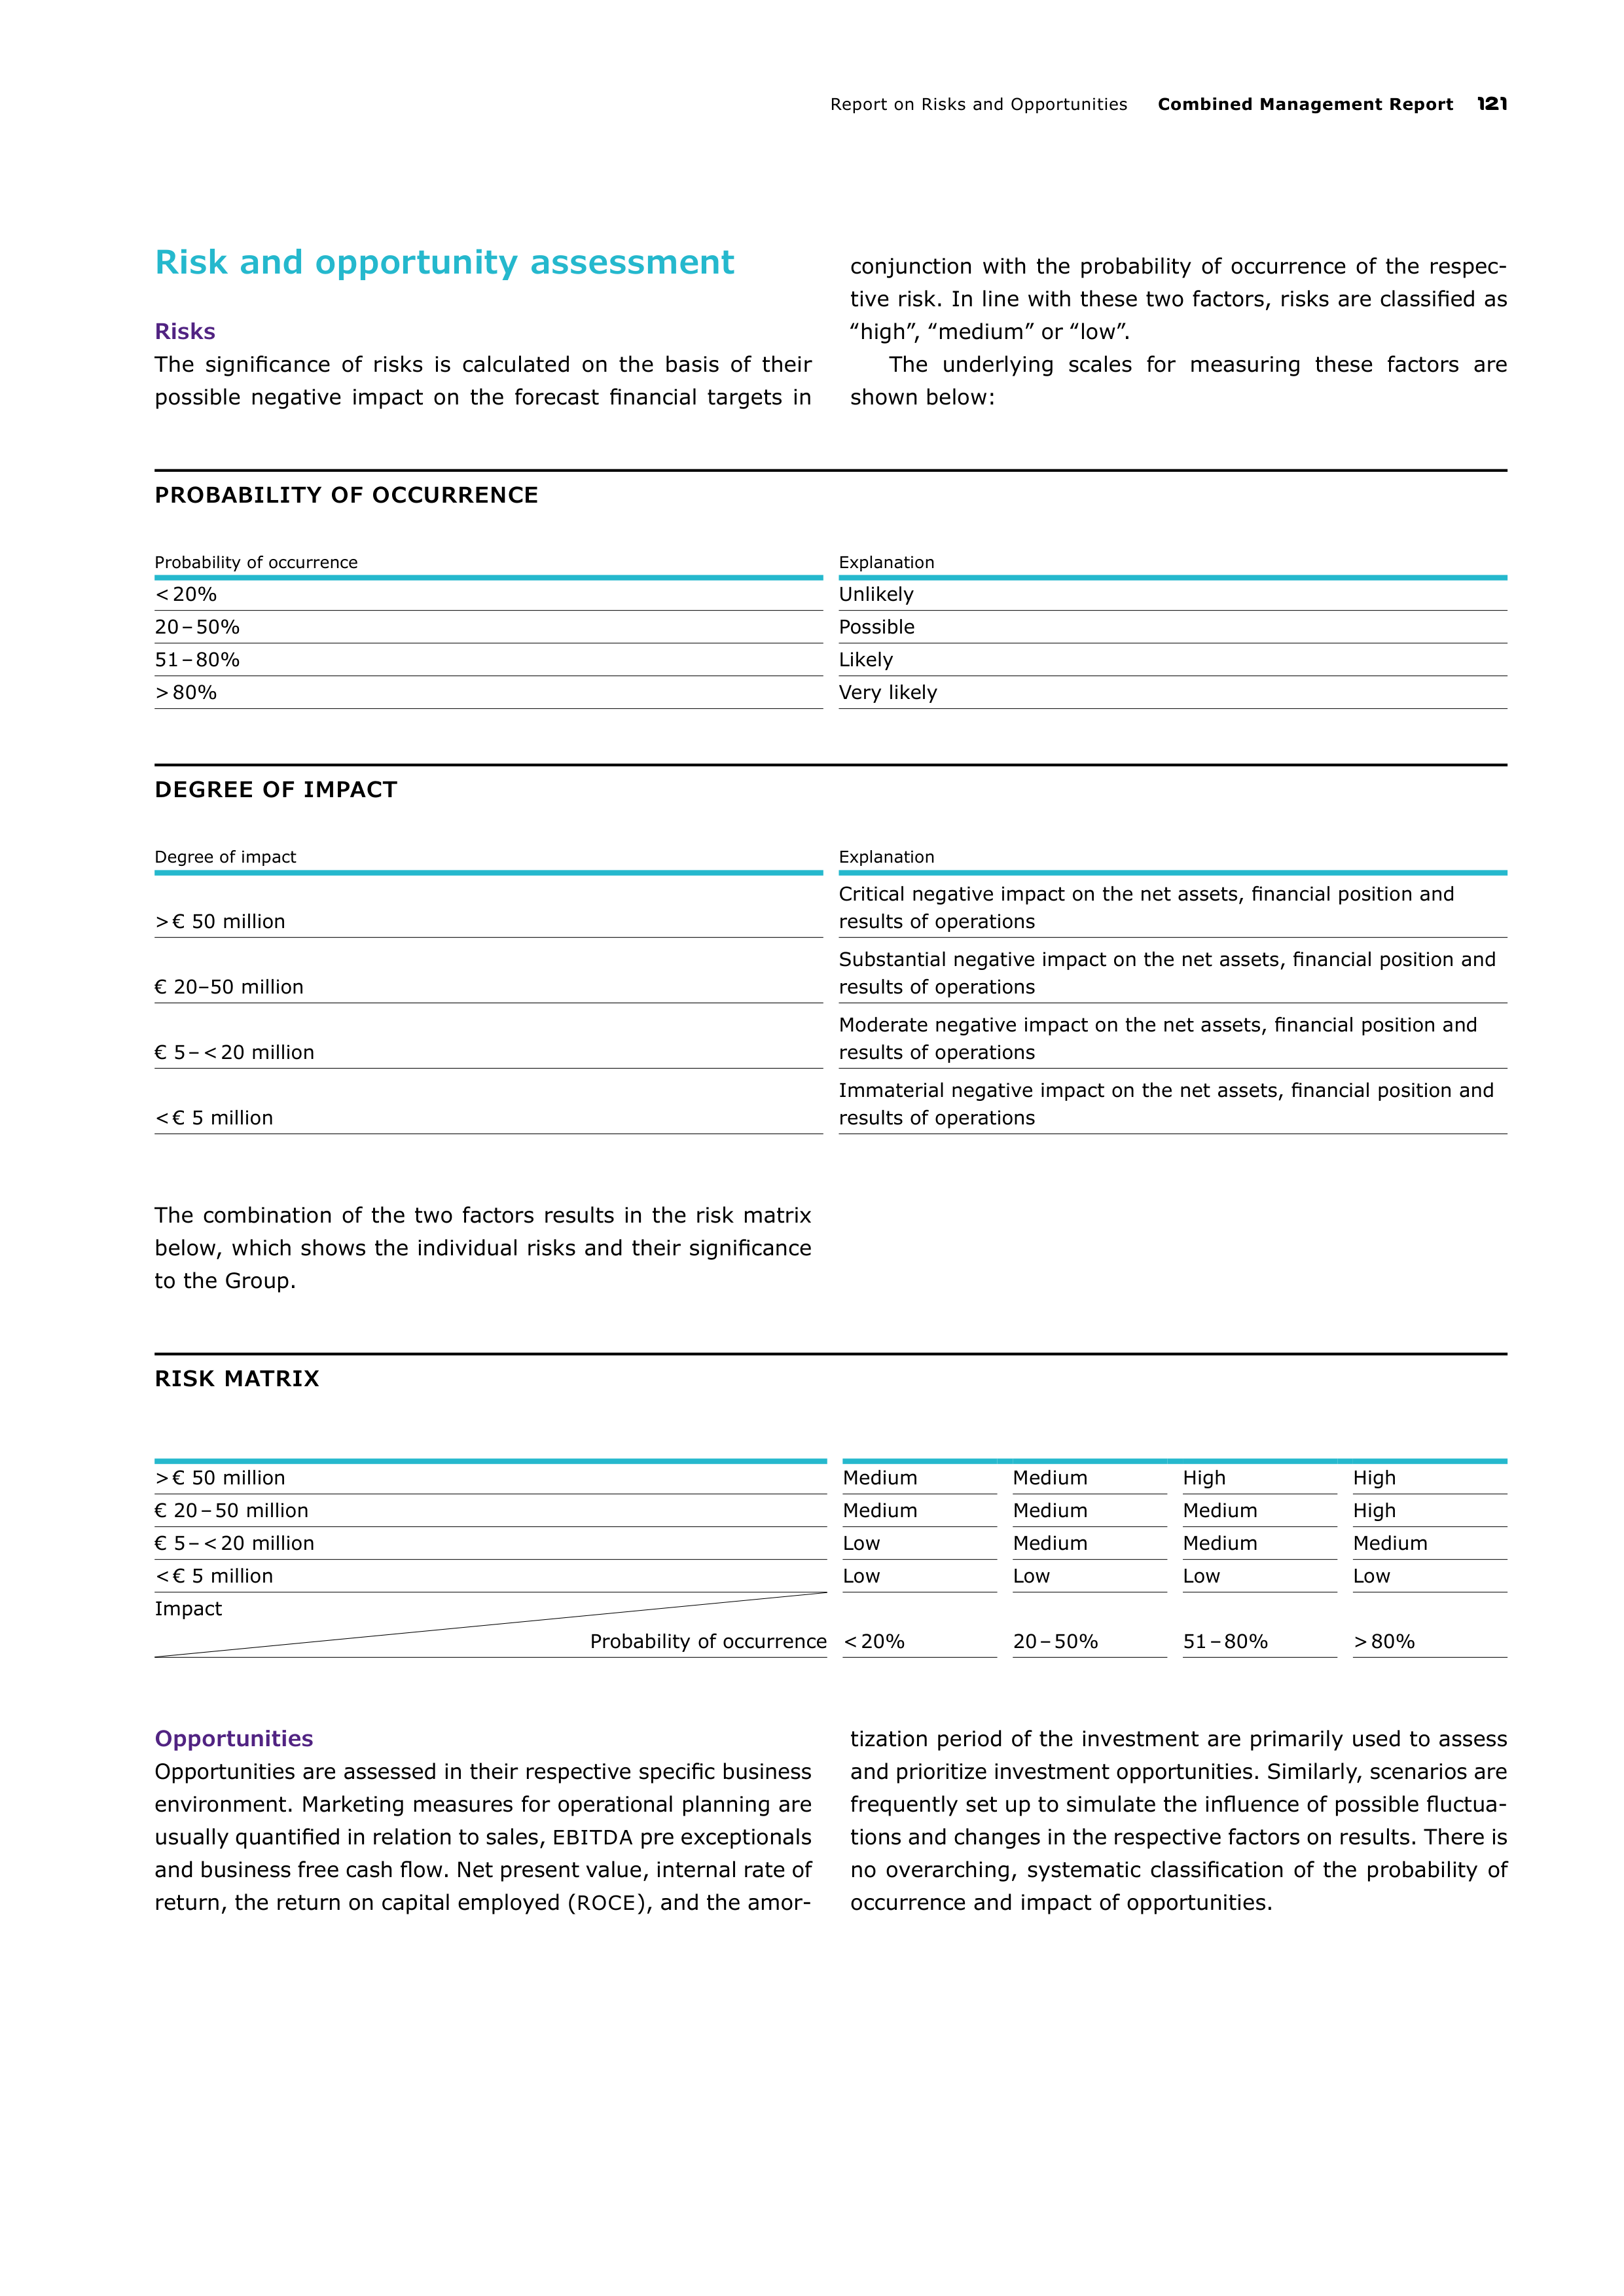
Report on Risks and Opportunities
Combined Management Report
121
Risk and opportunity assessment
Risks
The significance of risks is calculated on the basis of their
pos
sible negative impact on the forecast financial targets in
conjunction with the probability of occurrence of the respec-
tive risk. In line with these two factors, risks are classified as
‟high”, ‟medium” or ‟low”.
The underlying scales for measuring these factors are
shown below:
PROBABILITY OF OCCURRENCE
Probability of occurrence
Explanation
< 20%
Unlikely
20 – 50%
Possible
51 – 80%
Likely
> 80%
Very likely
DEGREE OF IMPACT
Degree of impact
Explanation
> € 50 million
Critical negative impact on the net assets, financial position and
results of operations
€ 20–50 million
Substantial negative impact on the net assets, financial position and
results of operations
€ 5 – < 20 million
Moderate negative impact on the net assets, financial position and
results of operations
< € 5 million
Immaterial negative impact on the net assets, financial position and
results of operations
The combination of the two factors results in the risk matrix
below, which shows the individual risks and their significance
to the Group.
RISK MATRIX
> € 50 million
Medium
Medium
High
High
€ 20 – 50 million
Medium
Medium
Medium
High
€ 5 – < 20 million
Low
Medium
Medium
Medium
< € 5 million
Low
Low
Low
Low
Impact
Probability of occurrence
< 20%
20 – 50%
51 – 80%
> 80%
Opportunities
Opportunities are assessed in their respective specific business
environment. Marketing measures for operational planning are
usually quantified in relation to sales,
EBITDA
pre exceptionals
and business free cash flow. Net present value, internal rate of
return, the return on capital employed (
ROCE
), and the amor-
tization period of the investment are primarily used to assess
and prioritize investment opportunities. Similarly, scenarios are
frequently set up to simulate the influence of possible fluctua-
tions and changes in the respective factors on results. There is
no overarching, systematic classification of the probability of
occurrence and impact of opportunities.
122
Combined Management Report
Report on Risks and Opportunities
Internal control system for the Group
accounting process
The objective of the internal control system for the accounting
process is to implement controls that provide assurance that
the financial statements are prepared in compliance with the
relevant accounting laws and standards. It covers measures
designed to ensure the complete, correct and timely convey-
ance and presentation of information that is relevant for the
preparation of the consolidated financial statements and the
management report.
Key tools
The internal control system is geared to ensuring the accuracy
of the consolidated accounting process and the implementation
of internal controls for the preparation of compliant financial
statements with reasonable assurance. The Group Accounting
function centrally steers the preparation of the consolidated
financial statements of Merck KGaA as the parent company of
the Merck Group. This Group function defines the reporting
requirements that the Merck subsidiaries must meet as a min-
imum requirement. At the same time, this function steers and
monitors the scheduling and process-related requirements of
the consolidated financial statements. Group-wide accounting
guidelines form the basis for the preparation of the statutory
financial statements of the parent company and of the subsid-
iaries, which are reported to Group Accounting; the guidelines
are adapted in a timely manner to reflect changes in the finan-
cial regulatory environment and are updated in accordance
with internal reporting requirements. Intra-group transactions
are eliminated during the consolidation process. This gives rise
to the need for a mirrored entry at the corresponding subsidi-
aries that is monitored during the consolidation process.
Group Accounting also ensures the timely central manage-
ment of changes to the equity holding structure and corre-
spondingly adapts the Group’s scope of consolidation. The
individual companies have a local internal control system.
Where financial processes are handled by a Shared Service
Center, the internal control system of the Shared Service
Center is additionally applied. Both ensure that accounting
complies with
IFRS
(International Financial Reporting Stand-
ards) and with the Group accounting guidelines.
Group Accounting provides support to the local contacts
and ensures a consistently high quality of reporting through
out
the entire reporting process.
The accounting process is designed at all levels to ensure
a clearly defined segregation of duties and assignment of
responsibilities to the units involved in the accounting process
at all times within the scope of dual control.
For the assessment of balance sheet items, Group Account-
ing closely cooperates with Group Risk Management in order
to correctly present potential balance sheet risks. For special
issues, such as the measurement of intangible assets within
the scope of company acquisitions or pension obligations,
external experts are additionally involved where necessary.
For the Group accounting process, we use a standard
SAP
software tool in most countries. Via a detailed authorization
concept to limit user rights on a need-to-have basis, and in
line with the principles of the separation of duties, the system
contains both single-entity reporting and the consolidated
financial statements.
The effectiveness of Merck’s internal control system with
regard to accounting and the compliance of financial reporting
by the individual companies is confirmed by both the local
managing director and the local chief financial officer when
they sign the single-entity reporting. All the structures and
processes described are subject to regular review by Group
Internal Auditing based on an annual audit plan set out by the
Executive Board. The results of these audits are dealt with by
the Executive Board, the Supervisory Board and the Finance
Committee.
The internal control system at Merck makes it possible to
lower the risk of material misstatements in accounting to
a minimum. However, no internal control system – regardless
of its design – can entirely rule out a residual risk.
Business-related risks and
opportunities
Political and regulatory risks and opportunities
As a global company, we face political and regulatory changes
in a large number of countries and markets.
Risk of more restrictive regulatory requirements regarding
drug pricing, reimbursement and approval
In the Healthcare business sector, the known trend towards
increasingly restrictive requirements in terms of drug pricing,
reimbursement and approval is continuing. These requirements
can negatively influence the profitability of our products, also
through market referencing between countries, and jeopardize
the success of market launches and new approvals. Close
communication with health and regulatory authorities serves
as a preventive measure to avert risks. The effects of corre-
sponding risks are taken into account as best possible in the
business sector’s plans.
Risk of stricter regulations for the manufacture, testing
and marketing of products
Likewise, in our Life Science and Performance Materials
business sectors, we must adhere to a multitude of regulatory
specifications regarding the manufacture, testing and mar-
ket
ing of many of our products. Specifically in the European
Union, we are subject to the European chemicals regulation
REACH
. It demands comprehensive tests for chemical prod-
ucts. Moreover, the use of chemicals in production could be
restricted, which would make it impossible to continue manu-
facturing certain products. We are constantly pursuing
research and development in substance characterization and
the possible substitution of critical substances so as to reduce
the occurrence of this risk, and therefore view it as unlikely.
Report on Risks and Opportunities
Combined Management Report
123
Nevertheless, it is classified as a medium risk given its critical
negative impact on the net assets, financial position and results
of operations.
Risk of destabilization of political systems and the
establishment of trade barriers
The destabilization of political systems as for example in
Ukraine and the Middle East and the possible establishment of
trade barriers as well as foreign exchange policy changes can
lead to declines in sales in certain countries and regions.
Diversification in terms of products, industries and regions
enables the mitigation of potential negative effects. The effects
of corresponding risks are taken into account to the best of
ability in the business plans for the countries and regions con-
cerned. In particular, our business can furthermore be affected
by macroeconomic developments in, for example, Venezuela,
Argentina, Brazil, Russia, and Greece. Corresponding sales
strategy measures have been introduced in these countries to
minimize the impact on business. Nevertheless, the remaining
possible net risk could have critical negative effects on the net
assets, financial position and results of operations and there-
fore we rate this as a medium risk.
Market risks and opportunities
Merck competes with numerous companies in the pharma-
ceu
tical, chemical and life science sectors. Rising competitive
pressure can have a significant impact on the quantities sold
and prices attainable for our products.
Opportunities due to the further development of the
Biosimilars business
Over the past three and a half years, we have moved forward
with the development of our own Biosimilars business with
a
focus on the therapeutic areas of oncology and autoimmune
diseases. Apart from the development of our own active ingre-
dients, we entered into a partnership with Dr. Reddy’s Labora-
tories Ltd., Hyderabad, India, among others, to co-develop
a
portfolio of biosimilars in oncology. Moreover, in 2014 we
established a partnership in the Brazilian market with Bionovis
SA, Barueri, Brazil to develop a portfolio of biosimilars. Signifi-
cant
contributions to sales by the Biosimilars business unit are
not to be expected before the medium to long term. However,
the expenditure required for the development of this business
unit has already been taken into account in today’s planning.
Opportunities due to new technologies in the
manufacture of displays
We see opportunities in the medium- to long-term possibilities
of significant market growth of
OLED
applications in high-
qual
ity display applications. We are building on more than ten
years of experience in manufacturing organic light-emitting
diode (
OLED
) materials as well as a strong portfolio of world-
wide patents in order to develop ultrapure and extremely
stable materials that are precisely tailored to customer
requirements. The development in the
OLED
market is being
driven by the diversification of applications for
OLED
displays.
OLED
technology is an established alternative to
LCD
s in
s
mall-area displays, for instance smartphones. However, owing
to technological advances,
OLED
technology is increasingly
being used in more and more large-area displays, such as
televisions. High-quality lighting applications, for example for
automobiles, offer further growth potential for
OLED
s. In order
to make the mass production of large-area
OLED
displays
more efficient, we have been cooperating since the end of 2012
with Seiko Epson Corporation to enable printing processes for
OLED
displays. To support the expected market growth, we
are investing around € 30 million in a new
OLED
production
unit at the Darmstadt site, where we will start manufacturing
ultra-high-purity
OLED
materials for applications in modern
displays and lighting systems as of summer 2016. We made
a further investment of around € 7 million to construct a new
OLED
Application Center (
OAC
) in Korea, which was inaugu-
rated in May 2015. With the
OAC
, we are securing competitive
advantages since it enables us to better meet the needs of
Korean customers and to correspondingly shorten the time to
market launch.
Moreover, within the framework of partnerships with display
manufacturers, start-ups and universities, progress has been
made in the realization of shapeable displays. Through the
a
pplication of flexible organic electronics, an entirely glass-free
plastic LC display that is both bendable and extremely robust
has been developed.
Lastly, we fully acquired the Israeli company Qlight Nano-
tech Ltd., Tel Aviv, Israel in order to actively support techno-
logical advances in the display industry. This move is expected
to strengthen the further development of quantum materials
for display applications.
Opportunities due to new application possibilities for
liquid crystals
We are pursuing a strategy of leveraging our expertise as the
global market leader in liquid crystals in order to develop new
fields of application for innovative liquid crystal technologies,
e.g. liquid crystal windows (
LCW
s), mobile antennas or liquid
crystal displays (
LCD
s). With the acquisition of our long-standing
cooperation partner Peer+ B.V., we are further advancing the
development of the future-oriented market for
LCW
s. Thanks
to licrivision™ technology,
LCW
s create new architectural pos-
sibilities. Through progressive brightness control, they can for
example increase a building’s energy efficiency.
Antennas that can receive signals transmitted in the high
frequency range (e.g. Ka and Ku band) can also be realized
with the aid of corresponding liquid crystal mixtures. As a result,
mobile data exchange could improve significantly in a wide vari-
ety
of fields of application. Since novel liquid crystal materials
for antennas are currently being developed, the market launch
of liquid crystal antennas could still take a few years. New
application opportunities for liquid crystals could have medium-
to long-term positive effects on the financial indicators of the
Performance Materials business sector.
124
Combined Management Report
Report on Risks and Opportunities
Opportunities from the launch of our new branding
In October 2015, we announced that we had relaunched our
branding and in this context presented our new visual appear-
ance and new logo to the public. Our new branding reflects our
transformation into a science and technology company while
at the same time ensuring that we operate uniformly as Merck
worldwide, with the exception of the United States and Canada.
Through this step, we will be uniformly and widely visible.
Due to the higher recognition and the brand strengthening we
are aiming for, potential new business opportunities could
arise. Moreover, stronger customer ties could have positive
effects on our business and financial results. However, since
the new brand must first be established, the effects on our
business will only be possible in the medium to long term.
Opportunities from leveraging the e-commerce and
distribution platform
With the acquisition of Sigma-Aldrich we have gained access
to the leading life science e-commerce platform. Our cus-
tom
ers are already benefiting from an offering of more than
300,000 products including highly respected brands distrib-
uted via this e-commerce platform. Our goal is to expand this
platform and to continuously increase the number of products
available on it. Making ordering processes faster and more
convenient for our customers could lead to higher sales vol-
umes and enable us to reach new customers. If this opportunity
materializes, our net sales could increase faster than expected.
Risk due to increased competition and customer technol-
ogy changes
In the Healthcare business sector, both our biopharmaceutical
products and classic pharmaceutical business are exposed to
increased competition from rival products (in the form of bio-
similars and generics). In the Life Science and Performance
Materials business sectors, risks are posed not only by cyclical
business fluctuations but also, particularly with respect to
liquid crystals, by changes in the technologies used or customer
sourcing strategies. We use close customer relationships and
in-house further developments as well as precise market
analyses as mitigating measures. Overall, owing to its possible
occurrence with a critical negative impact, the market risk is
classified as a medium risk.
Risks and opportunities of research and development
For us, innovation is a major element of the Group strategy.
Research and development projects can experience delays,
expected budgets can be exceeded, or targets can remain
unmet. Research and development activities are of special
importance to the Healthcare business sector. In the course of
portfolio management, we regularly evaluate and, if necessary,
refocus research areas and all R&D pipeline projects.
Special mention should be made of the strategic alliance
f
ormed in 2014 between our company and Pfizer Inc. as a
research and development opportunity in the Healthcare
busi
ness
sector. By making the required investments jointly
and combining their strengths and expertise, Pfizer and we
will maximize the potential value of the research compound
MSB
0010718C, an anti-PD-L1 antibody that we developed.
Owing to the relatively long cycles in active ingredient devel-
opment, we expect that positive effects of this alliance will be
reflected in the sales and profitability of the Healthcare busi-
ness sector in the medium to long term. By contrast, expenses
currently being incurred particularly in the research and
development units of our Healthcare business sector are
already reflected in the latest plans. The same applies to the
pro rata recognition of deferred income from Pfizer’s upfront
payment.
Risks of discontinuing development projects and regulatory
approval of developed medicines
Sometimes development projects are discontinued after high
levels of investment at a late phase of clinical development.
Decisions – such as those relating to the transition to the next
clinical phase – are taken with a view to minimizing risk. Fur-
thermore, there is the risk that the regulatory authorities
either do not grant or delay approval, which can have an
impact on earnings. Additionally, there is the danger that
undesirable side effects of a pharmaceutical product could
remain undetected until after approval or registration, which
could result in a restriction of approval or withdrawal from the
market. We are currently not aware of any risks beyond
general development risks that could significantly affect the
net assets, financial position and results of operations.
Risks and opportunities of product quality and
availability
Risk of a temporary ban on products / production facilities
or of non-registration of products due to non-compliance
with quality standards
We are required to comply with the highest standards of quality
in the manufacture of pharmaceutical products (Good Manufac-
turing Practice). In this regard we are subject to the supervision
of the regulatory authorities. Conditions imposed by national
regulatory authorities could result in a temporary ban on
prod
ucts / production facilities, and possibly affect new regis-
trations with the respective authority. We take the utmost
effort to ensure compliance with regulations, regularly perform
our own internal inspections and also carry out external audits.
Thanks to these quality assurance processes, the occurrence
of a risk is unlikely, however cannot be entirely ruled out.
Depending on the product concerned and the severity of the
objection, such a risk can have a critical negative impact on
the net assets, financial position and results of operations.
Therefore, we rate this as a medium risk.
Risks of dependency on suppliers
Quality controls along the entire value chain reduce the risks
related to product quality and availability. This starts with the
qualification of our suppliers. Quality controls also include
Report on Risks and Opportunities
Combined Management Report
125
comprehensive quality requirements for raw materials, pur-
chased semi-finished products and plants. We are dependent
on individual suppliers of precursor products for some of our
main products. In the event that one of these suppliers curtails
or discontinues production, or supply is disrupted, this could
potentially have a critical impact on the business concerned.
With long-term strategic alliances for precursor products critical
to supply and price as well as alternative sourcing strategies,
we reduce the probability of occurrence of these risks and rate
them as unlikely. Overall, these are classified as medium risks.
Damage and product liability risks
Further risks include the risk of operational failures due to
force majeure, for example natural disasters such as floods or
earthquakes, which could lead to a substantial interruption or
restriction of business activities. Insofar as it is possible and
economical to do so, the Group limits its damage risks with
insurance coverage, the nature and extent of which is constantly
adapted to current requirements. Although the occurrence of
these risks is considered unlikely, an individual event could
have a critical negative effect on the net assets, financial
position
and results of operations and is therefore classified as
a medium risk.
Companies in the chemical and pharmaceutical industries
are exposed to product liability risks in particular. Product
liability risks can lead to considerable claims for damages and
costs to avert damages. We have taken out the liability insur-
ance that is standard in the industry for such risks. However,
it could be that the insurance coverage available is insufficient
for individual cases. Although the occurrence of product liability
claims in excess of the existing insurance coverage is consid-
ered unlikely, individual cases could still have a critical negative
effect on the net assets, financial position and results of oper-
ations. We therefore rate a potential product liability risk as
a medium risk.
Risks due to product-related crime and espionage
Owing to our portfolio, we are exposed to a number of sector-
specific crime risks. This relates primarily to products, including
among other things, counterfeiting, illegal channeling, misuse as
well as all types of property crime, including attempts at these
crimes. Crime phenomena such as cybercrime and espionage
could equally affect our innovations or innovation abilities as
such.
To combat product-related crime, an internal coordination
network covering all functions and businesses (‟Merck Anti-
Counterfeiting Operational Network”) was set up several years
ago. In addition, security measures are in use to protect
prod
ucts against counterfeiting. Innovative technical security
solutions and defined preventive approaches are used to ward
off dangers relating to cybercrime and espionage. Measures
to
prevent risks and to prosecute identified offenses are con-
ducted in all the relevant crime areas in close and trustworthy
cooperation with the responsible authorities.
The impact of these risks on business operations depends
on the respective individual case, product-specific factors, the
value chain, as well as on regional aspects in particular. Group
Security is responsible for the overall coordination of all meas-
ures in this area. Overall, the threat resulting from crime in
general is seen as being possible and is classified as a medium
risk.
Opportunities due to an expanding local presence in
high-growth markets
We continue to assume that in the coming years, the markets
of Asia, the Middle East, Latin America, and Africa will be of
above-average importance to the growth of all the business
sectors. In order to further use this potential for our businesses,
we have moved forward with several investment projects in
recent years. These include for example the construction of our
new
OLED
Application Center in Korea and a new production
facility for liquid crystals as well as the establishment of a new
Biopharma site in China. Moreover, we are strengthening our
activities in Africa through strategic investments as well as
geographic expansion in selected regions. The greater local
presence and customer proximity could give us a key com-
petitive edge and, in the medium to long term, offers the
opportunity for significant growth in sales and
EBITDA
pre
exceptionals.
126
Combined Management Report
Report on Risks and Opportunities
Financial risks and opportunities
As a corporate group that operates internationally and due to
our presence in the capital market, we are exposed to various
financial risks and opportunities. Above all, these are liquidity
and counterparty risks, financial market risks and opportu-
ni
ties, risks of fluctuations in the market values of operational
tangible and intangible assets, as well as risks and opportu-
ni
ties from pension obligations.
Risk and opportunity management in relation to the use
of financial instruments
In the area of financial risks and opportunities, we use an active
management strategy to reduce the effects of fluctuations in
exchange and interest rates. The management of financial
risks and opportunities by using derivatives in particular is
regulated by extensive guidelines. Speculation is prohibited.
Derivative transactions are subject to constant risk controls.
A
strict separation of functions between trading, settlement
and control functions is ensured.
Liquidity risks
In order to ensure its continued existence, a company must be
able to fulfill its commitments from operating and financial
activities at all times. We therefore have a central Group-wide
liquidity management process to reduce potential liquidity
risks. Furthermore, we have a multi-currency revolving credit
facility of € 2 billion with a term of five years, which ensures
continuing solvency if any liquidity bottlenecks occur. As our
loan agreements do not contain any financial covenants, these
agreed lines of credit can be accessed even if Merck’s credit
rating should deteriorate. Additionally, we have a commercial
paper program with a maximum volume of € 2 billion as well
as a debt issuance program that forms the contractual basis
for the issue of bonds with a maximum volume of € 15 billion.
The acquisition of Sigma-Aldrich (US$ 17 billion) was
financed by cash on hand, diverse euro and U.S. dollar bonds,
as well as various bilateral loans and a syndicated credit line
with a bank consortium. The financing instruments are to be
successively repaid in the coming years. Overall, the liquidity
risk is rated as low.
Counterparty risks
Counterparty risks arise from the potential default by a partner
in connection with financial investments, loans and financing
commitments on the one hand and receivables in operating
business on the other.
As for counterparty risks from financial transactions, we
review all positions relating to trading partners and their credit
ratings on a daily basis. We manage financial risks of default
by diversifying our financial positions and through the related
active management of our trading partners. Significant finan-
cial transactions involving credit risk are entered into with banks
and industrial companies that have a good credit rating. More-
over, our large banking syndicate – the multi-currency revolving
credit facility of € 2 billion was syndicated by 19 banks –
reduces possible losses in the event of default.
The solvency and operational development of trading partners
is regularly reviewed as part of the management of opera-
tional counterparty risks. Sovereign risks are also analyzed.
The volume of receivables of each customer is capped in line
with their credit ratings. Risk-mitigating measures, such as
credit insurance, are utilized as appropriate. Nevertheless,
defaults by isolated trading partners, even those with out-
standing credit ratings, cannot be entirely ruled out, although
rated as unlikely (further information can be found in ‟Credit
risks” under ‟Management of financial risks” in the Notes to
the Group accounts).
Counterparty risk is classified as a medium risk overall
owing to the unlikely probability of occurrence with a potential
critical negative effect.
Financial market opportunities and risks
As a result of our international business activities and global
corporate structure, we are exposed to risks and opportunities
from fluctuations in exchange rates. These result from financial
transactions, operating receivables and liabilities, as well as
forecast future cash flows from sales and costs in foreign
cur
rency. We use derivatives to manage and reduce the afore-
mentioned risks and opportunities (further information can be
found in ‟Derivative financial instruments” in the Notes to the
Group accounts). Due to their possible occurrence with a poten-
tially critical negative effect on the net assets, financial position
and results of operations, foreign exchange rate risks are
rated as medium risk.
Future refinancing and cash investments are exposed to
the risks and opportunities of interest rate fluctuations. These
are also managed and reduced using derivatives. Following
the issue of multiple fixed-interest financing instruments
within the context of the Sigma-Aldrich acquisition, interest
rate risks have declined. They have a potentially moderate
negative impact, are considered unlikely and pose low risks
overall.
Risks of impairment of balance sheet items
The carrying amounts of individual balance sheet items are
subject to the risk of changing market and business conditions
and thus to changes in fair values as well. Necessary impair-
ments could have a significant negative non-cash impact on
earnings and affect the accounting ratios. This applies in par-
ticular to the high level of intangible assets including goodwill,
which mainly derive from the purchase price allocations made
in connection with past acquisitions (further information can
be found under ‟Intangible assets” in the Notes to the Group
accounts). All relevant risks were assessed during the prepa-
ration of the consolidated financial statements and taken into
account accordingly. We rate risks beyond this as low.
Risks and opportunities from pension obligations
We have commitments in connection with pension obligations.
The present value of defined benefit obligations can be signifi-
cantly increased or reduced by changes in the relevant valuation
parameters, for example the interest rate or future salary
increases. Pension obligations are regularly assessed as part of
annual actuarial reports. Some of these obligations are covered
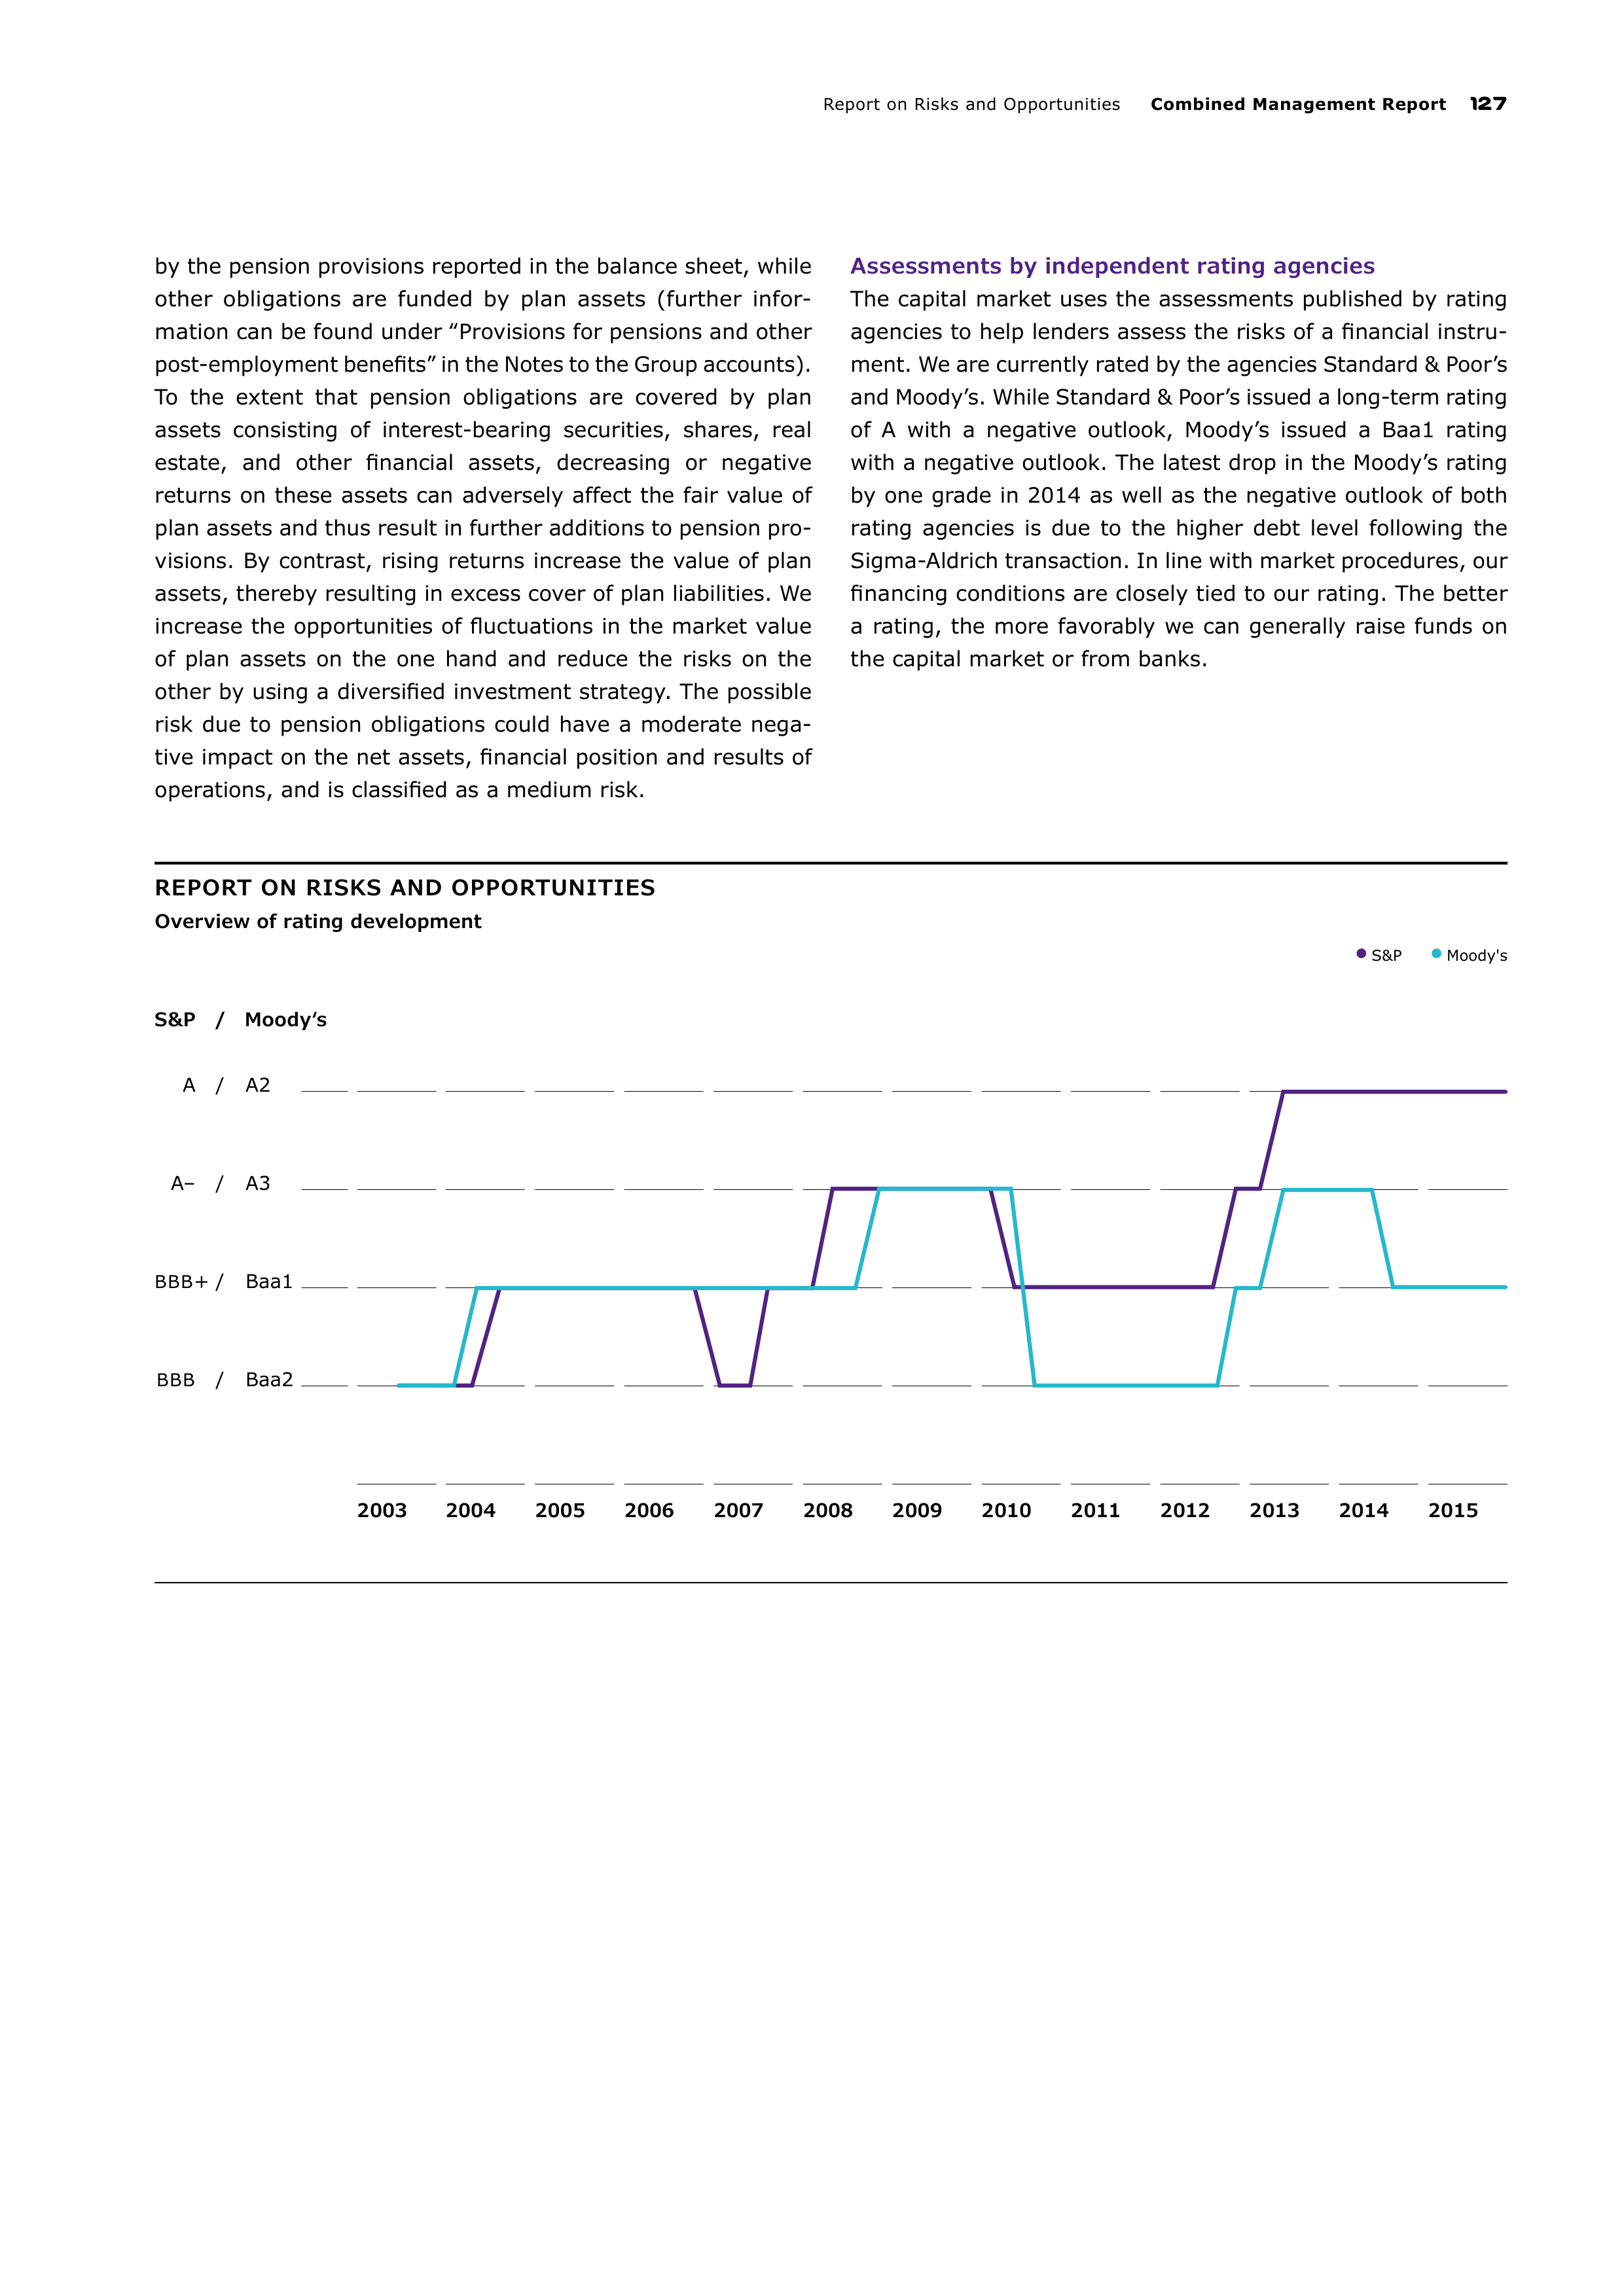
Report on Risks and Opportunities
Combined Management Report
127
REPORT ON RISKS AND OPPORTUNITIES
Overview of rating development
S&P
/
Moody‘s
A
/
A2
A–
/
A3
BBB
+ /
Baa1
BBB
/
Baa2
2003
2004
2005
2006
2007
2008
2009
2010
2011
2012
2013
2014
2015
S&P
Moody's
by the pension provisions reported in the balance sheet, while
other obligations are funded by plan assets (further infor
ma
tion can be found under ‟Provisions for pensions and other
post-employment benefits” in the Notes to the Group accounts).
To the extent that pension obligations are covered by plan
assets consisting of interest-bearing securities, shares, real
estate, and other financial assets, decreasing or negative
returns on these assets can adversely affect the fair value of
plan assets and thus result in further additions to pension pro-
visions. By contrast, rising returns increase the value of plan
assets, thereby resulting in excess cover of plan liabilities. We
increase the opportunities of fluctuations in the market value
of plan assets on the one hand and reduce the risks on the
other by using a diversified investment strategy. The possible
risk due to pension obligations could have a moderate nega-
tive impact on the net assets, financial position and results of
operations, and is classified as a medium risk.
Assessments by independent rating agencies
The capital market uses the assessments published by rating
agencies to help lenders assess the risks of a financial instru-
ment. We are currently rated by the agencies Standard & Poor’s
and Moody’s. While Standard & Poor’s issued a long-term
rating
of A with a negative outlook, Moody’s issued a Baa1 rating
with a negative outlook. The latest drop in the Moody’s rating
by one grade in 2014 as well as the negative outlook of both
rating agencies is due to the higher debt level following the
Sigma-Aldrich transaction. In line with market procedures, our
financing conditions are closely tied to our rating. The better
a
rating, the more favorably we can generally raise funds on
the capital market or from banks.
128
Combined Management Report
Report on Risks and Opportunities
Legal risks
Generally, we strive to minimize and control our legal risks. To
this end, we have taken the necessary precautions to identify
threats and defend our rights where necessary.
Nevertheless, we are still exposed to litigation risks or legal
proceedings. In particular, these include risks in the areas of
product liability, competition and antitrust law, pharmaceutical
law, patent law, tax law, and environmental protection. As
a research-based company, we have a valuable portfolio of
industrial property rights, patents and brands that could
become the target of attacks and infringements. The outcome
of future proceedings or those currently pending is difficult to
foresee. Generally, due to long statutes of limitations or in
some cases the absence thereof, it is not possible to rule out
that we will face third-party claims arising from the same issue
despite the conclusion of legal proceedings. Court or official
rulings or settlements can lead to expenses with a significant
impact on our business and earnings.
Tax risks are reviewed regularly and systematically by
Group Tax. Corresponding standards and guidelines are used
in order to identify tax risks at an early stage as well as to
review, evaluate and correspondingly minimize them. Risk
reduction measures are coordinated by Group Tax together
with the subsidiaries abroad.
In our opinion, the lawsuits described below constitute the
most significant legal risks. This should not be seen as an
exhaustive list of all legal disputes currently ongoing.
Risks from product-related and patent law disputes
We are involved in a patent dispute in the United States with
Biogen
IDEC
Inc. (Massachusetts,
USA
) (‟Biogen”). Biogen
claims that the sale of Rebif
®
in the United States infringes on
a Biogen patent. The disputed patent was granted to Biogen in
2009 in the United States. Subsequently, Biogen sued Merck
and other pharmaceutical companies for infringement of this
patent. Merck defended itself against all allegations and
brought a countersuit claiming that the patent was invalid and
not infringed on by our actions. A Markman hearing took
place
in January 2012, however a decision has not yet been
announced. The parties are currently engaged in court-ordered
mediation proceedings that have not yet officially ended. It is
currently not clear when a first-instance decision will be made.
We have taken appropriate accounting measures. Given the
potential critical negative effects of the legal dispute on the
financial position in the event of a negative decision, we never
theless classify this as a high risk.
In the Performance Materials business sector we have
negotiated with a competitor regarding potential patent
infringements. We maintain that the competitor’s patent
infringement assertion is invalid owing to relevant prior art
and have filed the corresponding nullity actions. The compet-
itor has meanwhile filed two patent infringement lawsuits.
We
are prepared for a confrontation in this issue and have
taken appropriate measures. Nevertheless, a potentially critical
negative impact on the financial position cannot be ruled out.
Risks due to antitrust and other government
proceedings
Raptiva
®
: In December 2011, the federal state of São Paulo
sued us for damages because of alleged collusion between
various pharmaceutical companies and an association of
patients suffering from psoriasis and vitiligo. This collusion is
alleged to have been intended to increase sales of the medi-
cines from the companies involved to the detriment of patients
and state coffers. Moreover, patients are also suing for dam-
ages in connection with the product Raptiva
®
. We have taken
appropriate accounting measures for these issues. Risks in
excess of this with a substantial negative effect on the net
assets, financial position and results of operations cannot be
ruled out, but are considered unlikely. This is rated as a medium
risk.
In one jurisdiction, we are subject to a government inves-
tigation regarding compliance with foreign exchange transfer
restrictions. In this connection, the responsible authorities are
investigating whether import prices led to impermissibly high
foreign exchange transfers. Appropriate accounting measures
have been taken for repayments and fines that are estimated to
be probable due to the uncertain legal situation in the affected
country. We classify this as a medium risk since a substantial
negative impact on the financial position cannot be ruled out.
Risks from drug pricing by the divested Generics Group
Paroxetine: In connection with the divested generics busi-
ness,
we are subject to antitrust investigations by the British
Competition and Market Authority (
CMA
) in the United Kingdom.
In March 2013, the authorities informed us of the assumption
that a settlement agreement entered into in 2002 between
Generics (UK) Ltd. and several GlaxoSmithKline companies in
connection with the antidepressant drug paroxetine violates
British and European competition law. Merck, the then owner of
Generics (UK) Ltd., was allegedly involved in the negotiations
for the settlement agreement and is therefore liable. The
investigations into Generics (UK) Ltd. started in 2011, without
this being known to us. On February 11, 2016, the
CMA
imposed a fine in this matter. We intend to take legal action
against this decision and have taken appropriate accounting
measures. Given the latest decision, we classify this as a
medium risk with a moderate negative impact on the financial
position.
Report on Risks and Opportunities
Combined Management Report
129
Human resources risks
Our future growth is highly dependent on our innovative
strength. Therefore, the expertise and engagement of employ-
ees in all sectors in which we operate are crucial to the success
of the company.
The markets relevant to the company are characterized
by
intensive competition for qualified specialists and by demo-
graphic challenges. Fluctuation risks specific to countries and
industries have to be identified ahead of time and specifically
addressed in order to keep the skills and expertise critical to
success and business within the company.
Recruiting and retaining specialists and talent is therefore
one of the key priorities for the company and is managed
through the targeted use of, for instance, employer branding
initiatives, global talent and succession management processes
as well as competitive compensation packages. Nevertheless,
employee-related risks that affect business activities are
possible, even though their impact is difficult to assess. We
rate this as a medium risk.
Information technology risks
We use a variety of IT systems and processes in order to opti-
mally focus and adequately support our globalization. Trends
in information technology offer various opportunities but also
harbor risks.
Risks due to cybercrime and the failure of business-
critical IT applications
Increasing international networking and the related possibility
of IT system abuse are resulting in cybercrime risks for Merck,
such as the failure of central IT systems, the disclosure of
confidential research and business development data, the
manipulation of IT systems in chemical process control, or an
increased burden or adverse impact on IT systems as a result
of virus attacks. The entire Group has global security guidelines
a
nd information protection management for IT and non-IT
areas, each with organizational and technical standards for
access rights as well as information and data protection, based
on
ISO
27001.
Additionally, IT applications used globally form the basis for
the contractual delivery of products and solutions. The failure
of
business-critical IT applications could therefore have a direct
influence on our ability to deliver; likewise this applies to
the failure of a data center. To achieve the required service
quality, we use a quality management system certified to
ISO
20000:2011. In addition, to reduce the risk of failure, we
operate several redundantly designed data centers.
Despite the mitigating measures taken and functional continuity
plans, the effects of cybercrime or the failure of business-
critical IT applications and their influence on the net assets,
financial position and results of operations are considered
medium risks owing to possibly substantial impacts.
Environmental and safety risks
As a company with global production operations, we are
exposed to risks of possible damage to people, goods and our
reputation. Audits, consulting and training on environmental
protection and occupational health and safety minimize these
risks to people and the environment. In order to ensure the
continuity of plant and equipment, we monitor these risks
both at our own sites as well as at suppliers and contract
manufacturers. By adhering to high technical standards, our
rules of conduct and all legal requirements in environmental
protection and occupational health and safety, we ensure the
preservation of goods and assets. We have taken sufficient
appropriate accounting measures for the environmental risks
known to us. Nevertheless, we classify these as a high risk
since a critical negative impact on the financial position cannot
be ruled out.
Risks of the divestment, acquisition
and integration of companies and
businesses
Irrespective of the fact that acquisitions made in the past
have
been successfully completed, the risk of conducting the
acquisition and integration exists for future transactions, for
instance for the current integration of Sigma-Aldrich. This
includes, among other things, the inability to meet sales vol-
ume targets and higher integration costs than expected, as
well as the failure to meet synergy goals. The divestment of
companies and businesses can lead to liability vis-à-vis the
buyer, for instance through indemnity clauses and guarantee
commitments. Through strong due diligence processes and
closely managed integration processes, we seek to reduce the
probability of occurrence of this risk. Nevertheless, owing to
a
possible occurrence of this risk with potentially critical neg-
ative effects on the net assets, financial position and results of
operations, we classify this as a medium risk.
130
Combined Management Report
Report on Risks and Opportunities
Overall view of the risk
and opportunity situation and
management assessment
Although the number of risks reported is higher than the
spe
cific opportunities identified, we consider the distribution
of risks and opportunities to be balanced. A balanced overall
view is also supported by the fact that net sales and business
success are built on a diverse range of pharmaceutical and
chemical products for a variety of industries. As the markets
differ in their structure and economic cycles, this diversification
helps to lower risk. This diversification is being strengthened
by the current acquisition of Sigma-Aldrich and the strategic
alliance entered into with Pfizer in 2014.
The most significant individual risks in the businesses have
been named in the report above, with business-related risks
being the most significant alongside legal risks.
With respect to high and medium risks, certain changes
have resulted as the assessment of the individual risks has of
course altered over the fiscal year due to changing external
and internal conditions, while the overall risk assessment
remained stable. Thanks to the risk reduction measures taken –
such as the consistent implementation of management action
(organizational responsibility and process improvements),
existing insurance coverage and accounting precautions
–
Merck’s significant risks in particular have been further mini-
mized in net terms.
The overall view of the risk situation of the Group, which is
derived from the summary of the risks described on the basis
of their impact and probability of occurrence, leads to the
assessment that the risks are not of a nature to threaten the
existence of the Group as a going concern. We are confident
that we will continue to successfully master the challenges
arising from the above risks in the future as well.
In our view, business-related opportunities offer the great-
est potential. An important element here is the continuous
expansion in Asia, Latin America, Africa, and the Middle East.
With the continuing intensification and focusing of our research
and development activities, we want to be able to continue to
offer our customers innovative products and help shape mar-
kets. Moreover, we also consolidate our expertise in numerous
alliances, for instance with Pfizer Inc., Seiko Epson, as well as
with various universities and start-ups. The topic of innovation
is at the forefront of all our activities. Externally, this is becom-
ing particularly apparent through our new Innovation Center
at Group headquarters in Darmstadt, which is to develop into
a nucleus of creativity at Merck. The activities listed hold sig-
nificant opportunities for us in the medium to long term,
beyond the underlying forecast period.
We pursue the opportunities that arise and show their
expected effects in the forecast development of our key per-
formance indicators – net sales,
EBITDA
pre exceptionals and
b
usiness free cash flow. Furthermore, we will actively seek new
opportunities, examine their implementation and drive them
forward where appropriate. If opportunities arise in addition to
the forecast developments, or these occur more quickly than
anticipated, this could have correspondingly positive effects
on our net assets, financial position and results of operations.
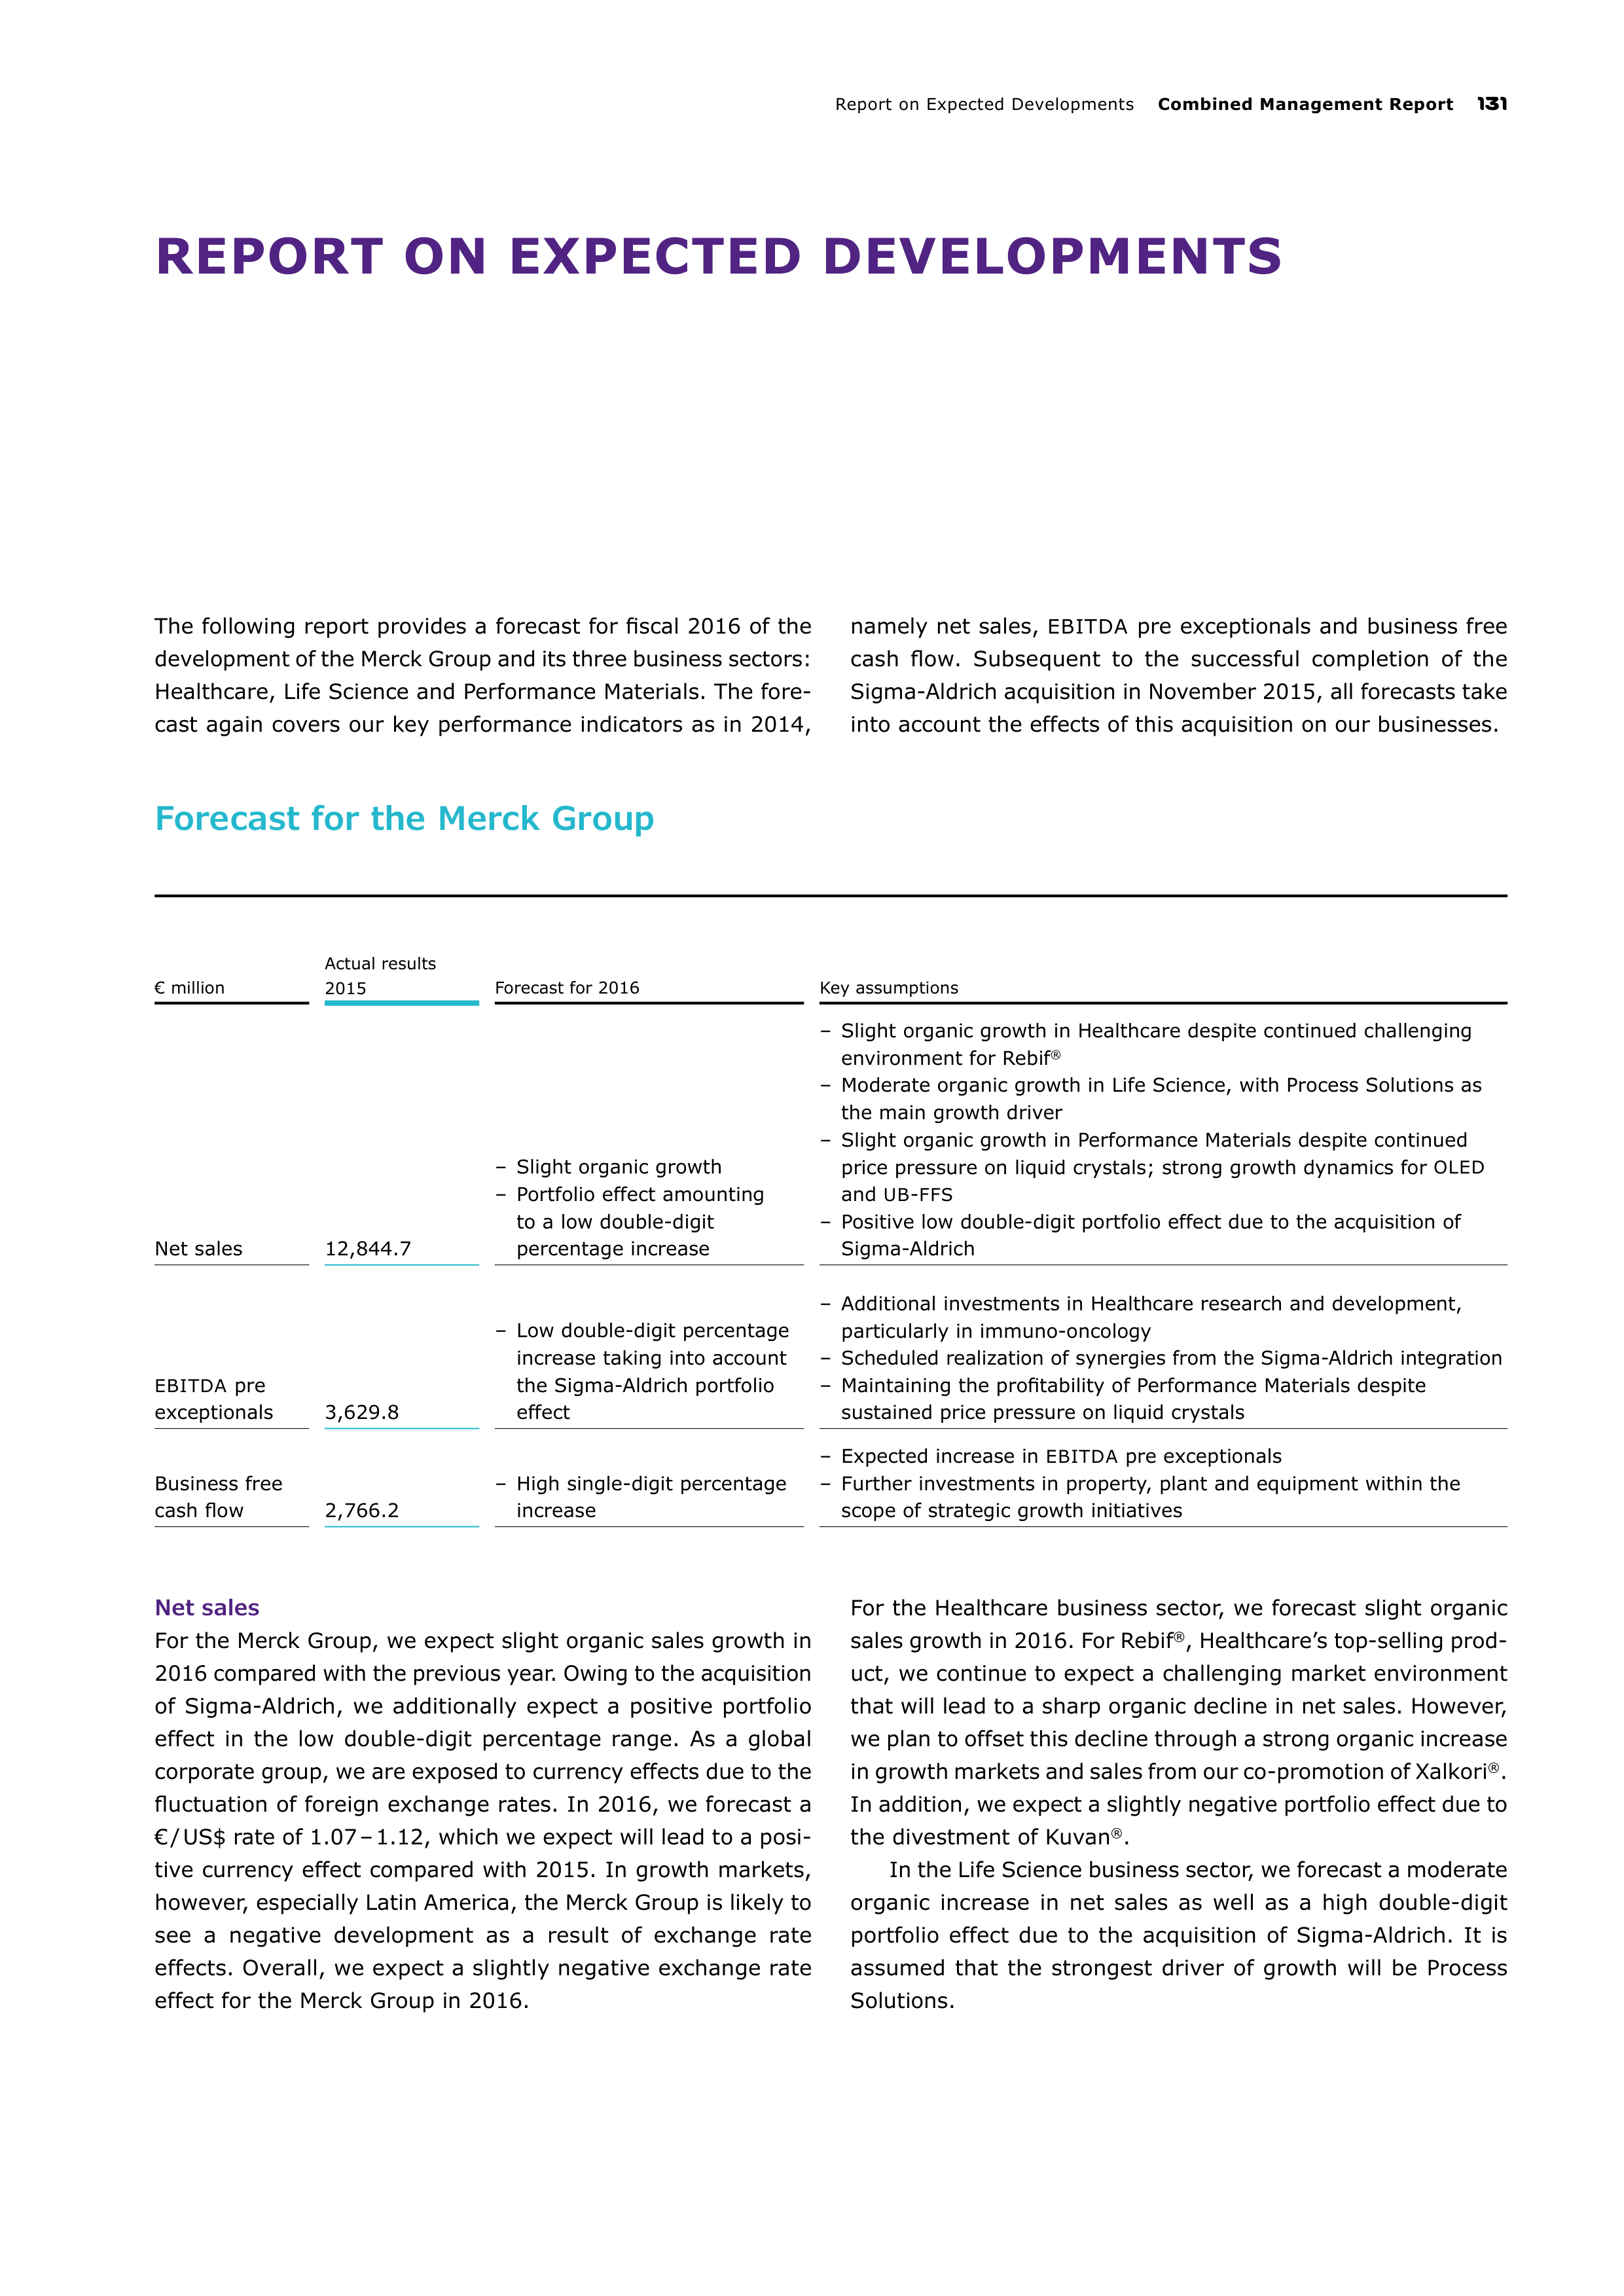
Report on Expected Developments
Combined Management Report
131
REPORT ON EXPECTED DEVELOPMENTS
The following report provides a forecast for fiscal 2016 of the
development of the Merck Group and its three business sectors:
Healthcare, Life Science and Performance Materials. The fore-
cast again covers our key performance indicators as in 2014,
namely net sales,
EBITDA
pre exceptionals and business free
cash flow. Subsequent to the successful completion of the
Sigma-Aldrich acquisition in November 2015, all forecasts take
into account the effects of this acquisition on our businesses.
Forecast for the Merck Group
€ million
Actual results
2015
Forecast for 2016
Key assumptions
Net sales
12,844.7
– Slight organic growth
– Portfolio effect amounting
to a low double-digit
percentage increase
– Slight organic growth in Healthcare despite continued challenging
environment for Rebif
®
– Moderate organic growth in Life Science, with Process Solutions as
the main growth driver
– Slight organic growth in Performance Materials despite continued
price pressure on liquid crystals; strong growth dynamics for
OLED
and
UB
-
FFS
– Positive low double-digit portfolio effect due to the acquisition of
Sigma-Aldrich
EBITDA
pre
exceptionals
3,629.8
– Low double-digit percentage
increase taking into account
the Sigma-Aldrich portfolio
effect
– Additional investments in Healthcare research and development,
particularly in immuno-oncology
–
Scheduled realization of synergies from the Sigma-Aldrich integration
– Maintaining the profitability of Performance Materials despite
sustained price pressure on liquid crystals
Business free
cash flow
2,766.2
– High single-digit percentage
increase
– Expected increase in
EBITDA
pre exceptionals
– Further investments in property, plant and equipment within the
scope of strategic growth initiatives
Net sales
For the Merck Group, we expect slight organic sales growth in
2016 compared with the previous year. Owing to the acquisition
of Sigma-Aldrich, we additionally expect a positive portfolio
effect in the low double-digit percentage range. As a global
corporate group, we are exposed to currency effects due to the
fluctuation of foreign exchange rates. In 2016, we forecast a
€ / US$ rate of 1.07 – 1.12, which we expect will lead to a posi
tive currency effect compared with 2015. In growth markets,
however, especially Latin America, the Merck Group is likely to
see a negative development as a result of exchange rate
effects. Overall, we expect a slightly negative exchange rate
effect for the Merck Group in 2016.
For the Healthcare business sector, we forecast slight organic
sales growth in 2016. For Rebif
®
, Healthcare’s top-selling prod
uct,
we continue to expect a challenging market environment
that will lead to a sharp organic decline in net sales. However,
we plan to offset this decline through a strong organic increase
in growth markets and sales from our co-promotion of Xalkori
®
.
In addition, we expect a slightly negative portfolio effect due
to
the divestment of Kuvan
®
.
In the Life Science business sector, we forecast a moderate
organic increase in net sales as well as a high double-digit
portfolio effect due to the acquisition of Sigma-Aldrich. It is
assumed that the strongest driver of growth will be Process
Solutions.
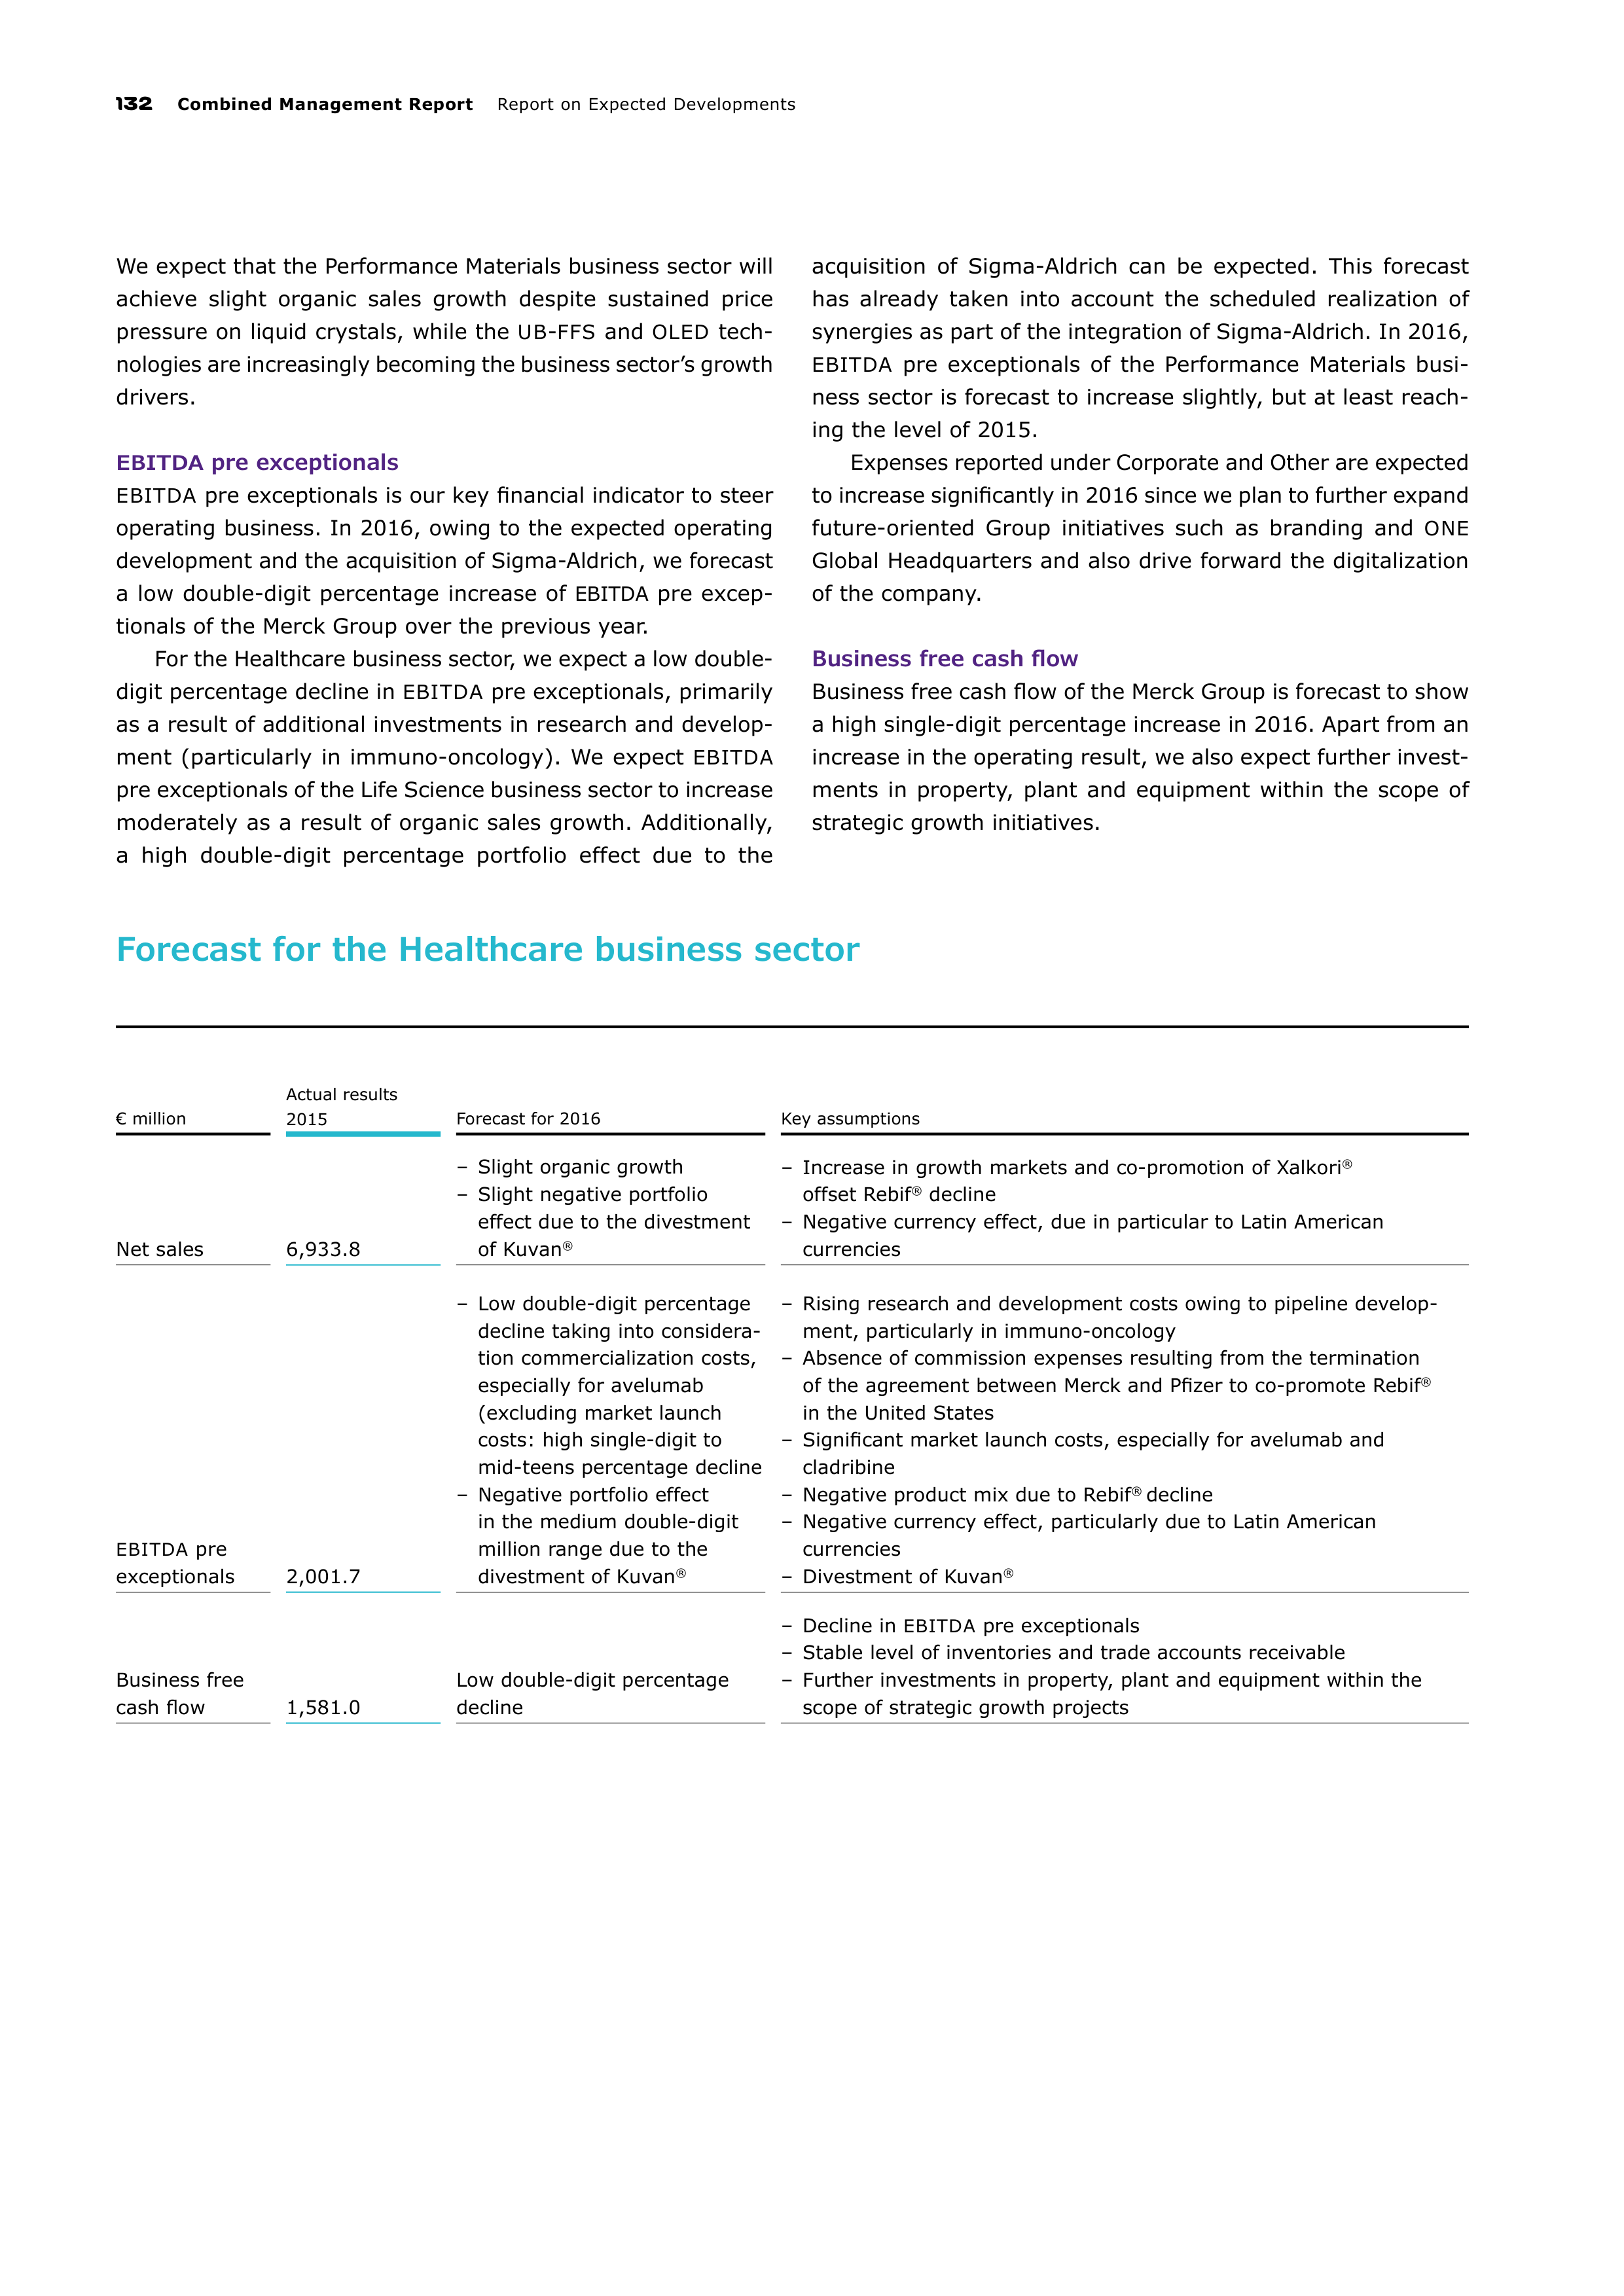
132
Combined Management Report
Report on Expected Developments
We expect that the Performance Materials business sector will
achieve slight organic sales growth despite sustained price
pressure on liquid crystals, while the
UB
-
FFS
and
OLED
tech-
nologies are increasingly becoming the business sector’s growth
drivers.
EBITDA
pre exceptionals
EBITDA
pre exceptionals is our key financial indicator to steer
operating business. In 2016, owing to the expected operating
development and the acquisition of Sigma-Aldrich, we forecast
a low double-digit percentage increase of
EBITDA
pre excep-
tionals of the Merck Group over the previous year.
For the Healthcare business sector, we expect a low double-
digit percentage decline in
EBITDA
pre exceptionals, primarily
as a result of additional investments in research and develop-
ment (particularly in immuno-oncology). We expect
EBITDA
pre exceptionals of the Life Science business sector to increase
moderately as a result of organic sales growth. Additionally,
a high double-digit percentage portfolio effect due to the
acquisition of Sigma-Aldrich can be expected. This forecast
has already taken into account the scheduled realization of
synergies as part of the integration of Sigma-Aldrich. In 2016,
EBITDA
pre exceptionals of the Performance Materials busi-
ness sector is forecast to increase slightly, but at least reach-
ing the level of 2015.
Expenses reported under Corporate and Other are expected
to increase significantly in 2016 since we plan to further expand
future-oriented Group initiatives such as branding and
ONE
Global Headquarters and also drive forward the digitalization
of the company.
Business free cash flow
Business free cash flow of the Merck Group is forecast to show
a high single-digit percentage increase in 2016. Apart from an
increase in the operating result, we also expect further invest-
ments in property, plant and equipment within the scope of
strategic growth initiatives.
Forecast for the Healthcare business sector
€ million
Actual results
2015
Forecast for 2016
Key assumptions
Net sales
6,933.8
– Slight organic growth
– Slight negative portfolio
effect due to the divestment
of Kuvan
®
– Increase in growth markets and co-promotion of Xalkori
®
offset Rebif
®
decline
– Negative currency effect, due in particular to Latin American
currencies
EBITDA
pre
exceptionals
2,001.7
– Low double-digit percentage
decline taking into considera-
tion commercialization costs,
especially for avelumab
(excluding market launch
costs: high single-digit to
mid-teens percentage decline
– Negative portfolio effect
in the medium double-digit
million range due to the
divestment of Kuvan
®
– Rising research and development costs owing to pipeline develop-
ment, particularly in immuno-oncology
– Absence of commission expenses resulting from the termination
of the agreement between Merck and Pfizer to co-promote Rebif
®
in the United States
– Significant market launch costs, especially for avelumab and
cladribine
– Negative product mix due to Rebif
®
decline
– Negative currency effect, particularly due to Latin American
currencies
– Divestment of Kuvan
®
Business free
cash flow
1,581.0
Low double-digit percentage
decline
– Decline in
EBITDA
pre exceptionals
– Stable level of inventories and trade accounts receivable
– Further investments in property, plant and equipment within the
scope of strategic growth projects
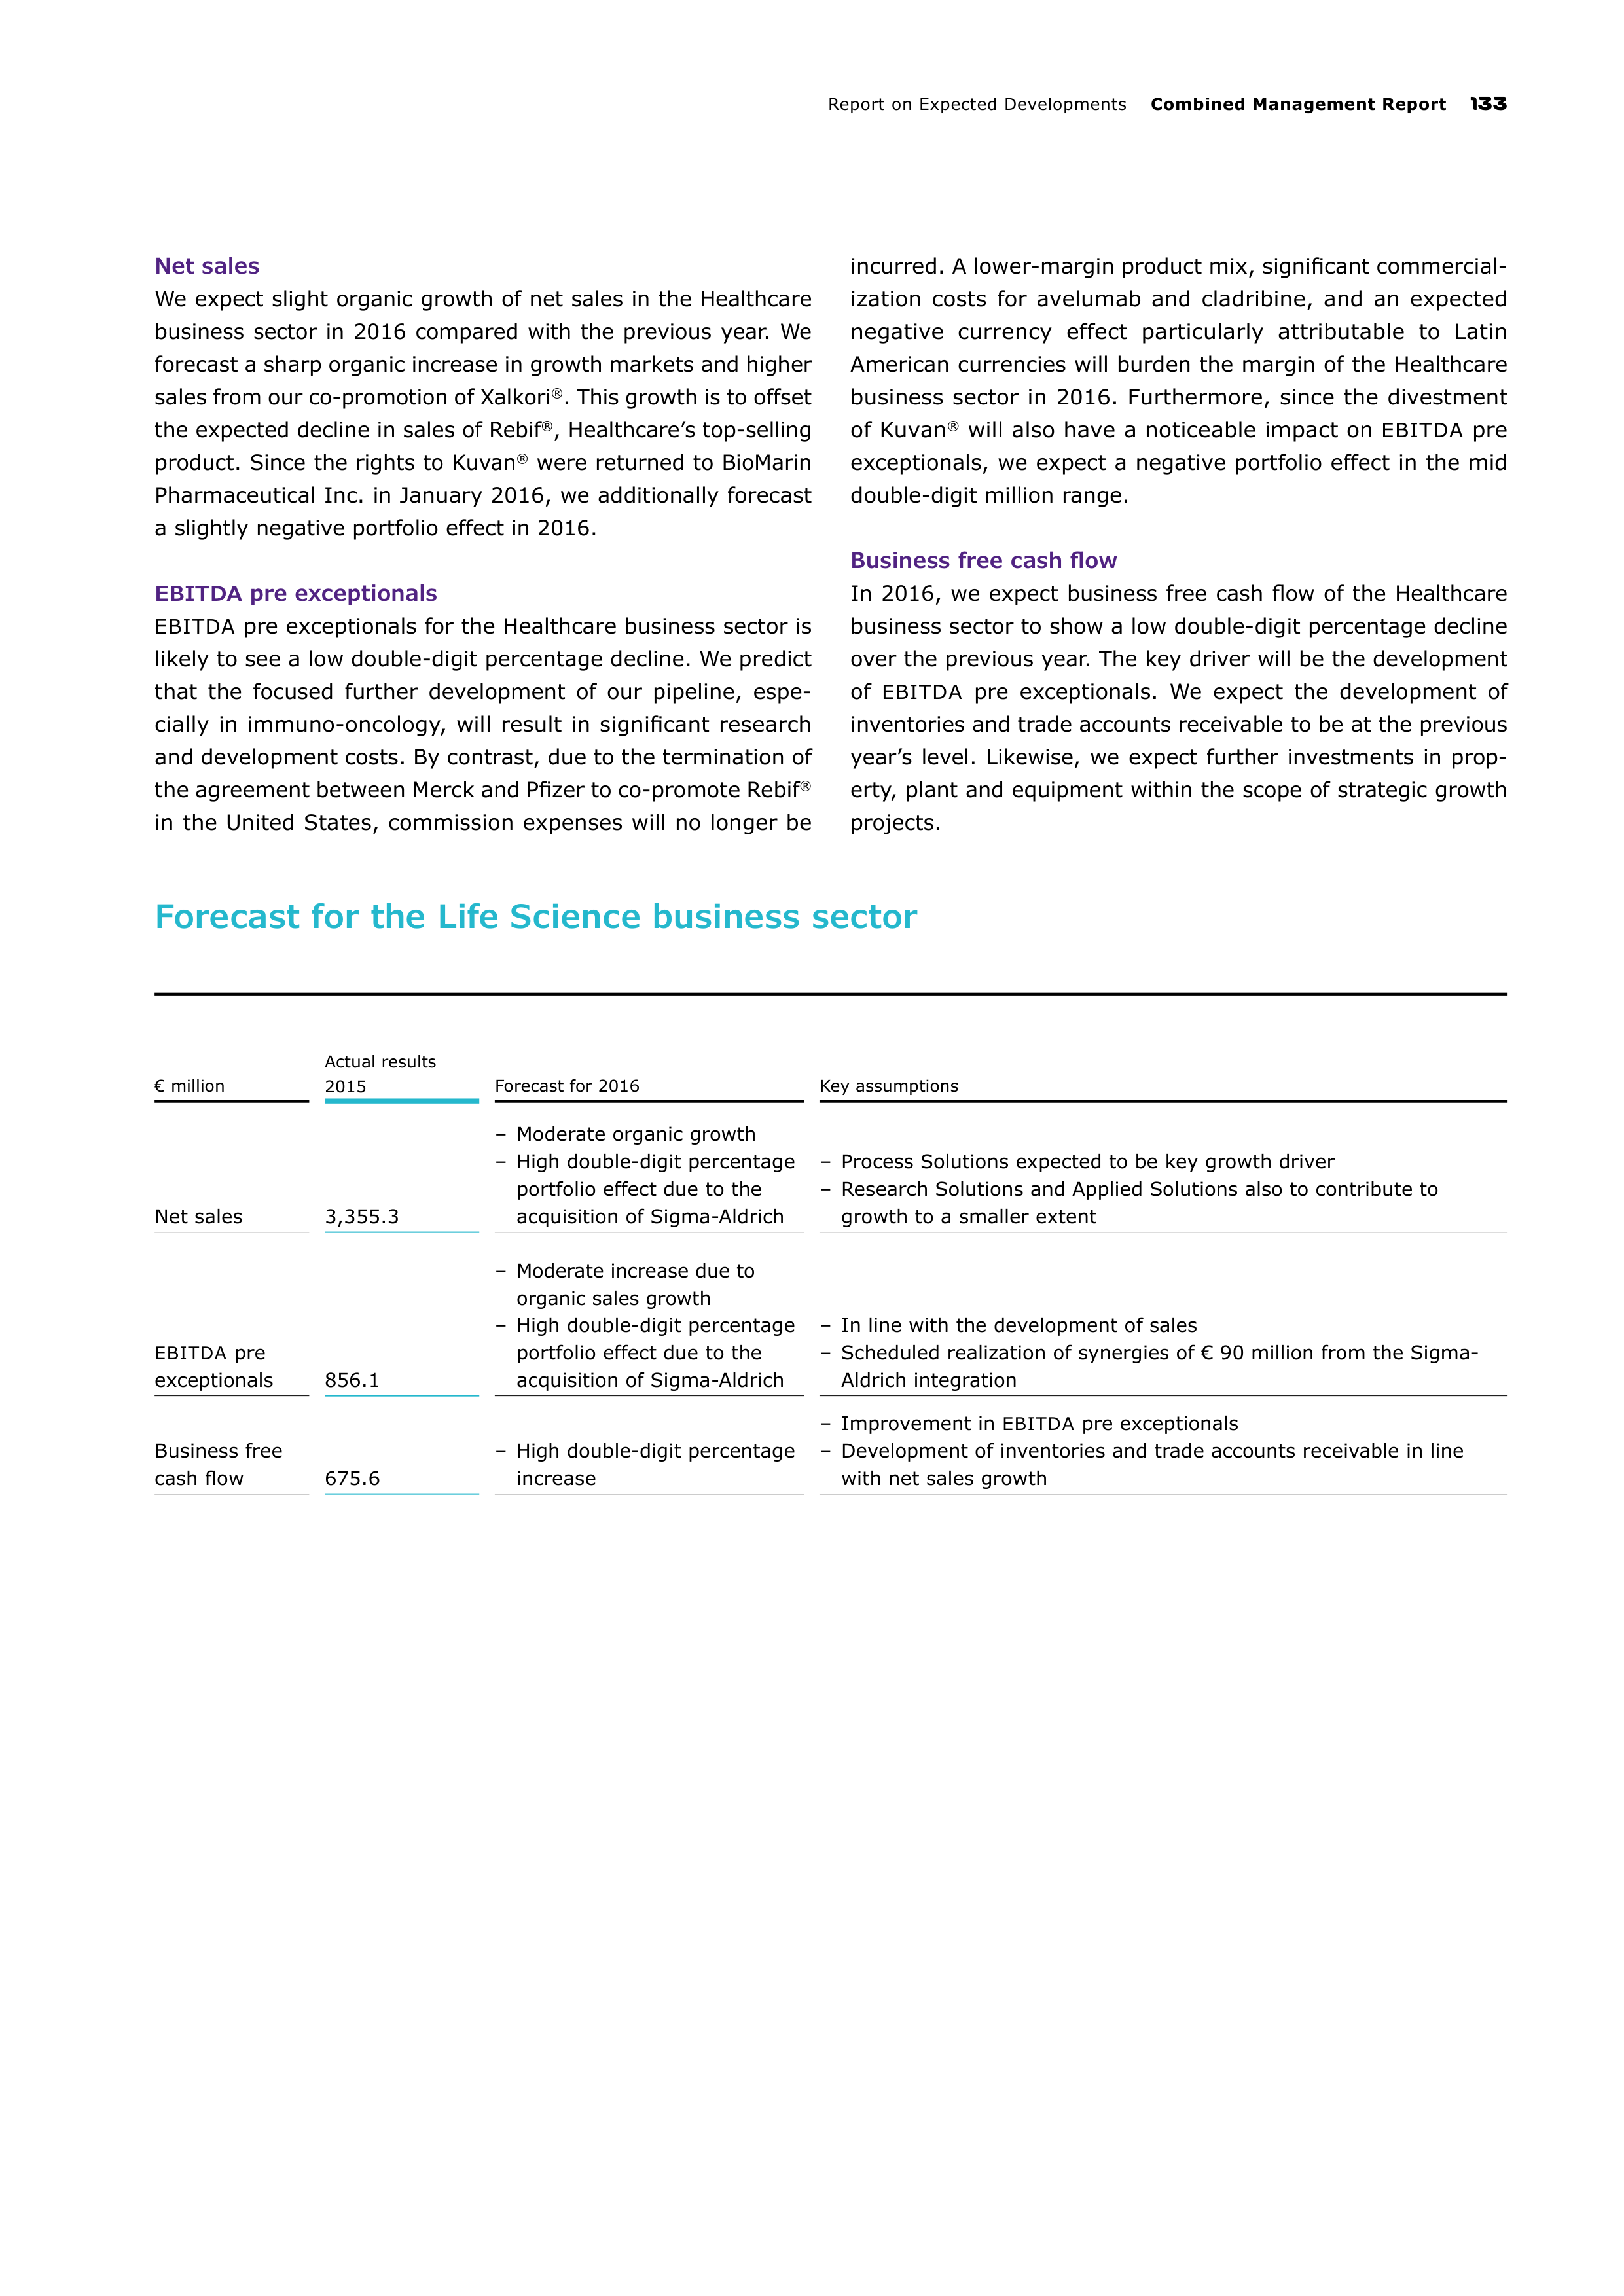
Report on Expected Developments
Combined Management Report
133
Net sales
We expect slight organic growth of net sales in the Healthcare
business sector in 2016 compared with the previous year. We
forecast a sharp organic increase in growth markets and higher
sales from our co-promotion of Xalkori
®
. This growth is to offset
the expected decline in sales of Rebif
®
, Healthcare’s top-selling
product. Since the rights to Kuvan
®
were returned to BioMarin
Pharmaceutical Inc. in January 2016, we additionally forecast
a slightly negative portfolio effect in 2016.
EBITDA
pre exceptionals
EBITDA
pre exceptionals for the Healthcare business sector is
likely to see a low double-digit percentage decline. We predict
that the focused further development of our pipeline, espe-
cially in immuno-oncology, will result in significant research
and development costs. By contrast, due to the termination of
the agreement between Merck and Pfizer to co-promote Rebif
®
in the United States, commission expenses will no longer be
incurred. A lower-margin product mix, significant commercial-
ization costs for avelumab and cladribine, and an expected
negative currency effect particularly attributable to Latin
American currencies will burden the margin of the Healthcare
business sector in 2016. Furthermore, since the divestment
of Kuvan
®
will also have a noticeable impact on
EBITDA
pre
exceptionals, we expect a negative portfolio effect in the mid
double-digit million range.
Business free cash flow
In 2016, we expect business free cash flow of the Healthcare
business sector to show a low double-digit percentage decline
over the previous year. The key driver will be the development
of
EBITDA
pre exceptionals. We expect the development of
inventories and trade accounts receivable to be at the previous
year’s level. Likewise, we expect further investments in prop-
erty, plant and equipment within the scope of strategic growth
projects.
Forecast for the Life Science business sector
€ million
Actual results
2015
Forecast for 2016
Key assumptions
Net sales
3,355.3
– Moderate organic growth
– High double-digit percentage
portfolio effect due to the
acquisition of Sigma-Aldrich
– Process Solutions expected to be key growth driver
– Research Solutions and Applied Solutions also to contribute to
growth to a smaller extent
EBITDA
pre
exceptionals
856.1
–
Moderate increase due to
organic sales growth
– High double-digit percentage
portfolio effect due to the
acquisition of Sigma-Aldrich
– In line with the development of sales
– Scheduled realization of synergies of € 90 million from the Sigma-
Aldrich integration
Business free
cash flow
675.6
– High double-digit percentage
increase
– Improvement in
EBITDA
pre exceptionals
– Development of inventories and trade accounts receivable in line
with net sales growth
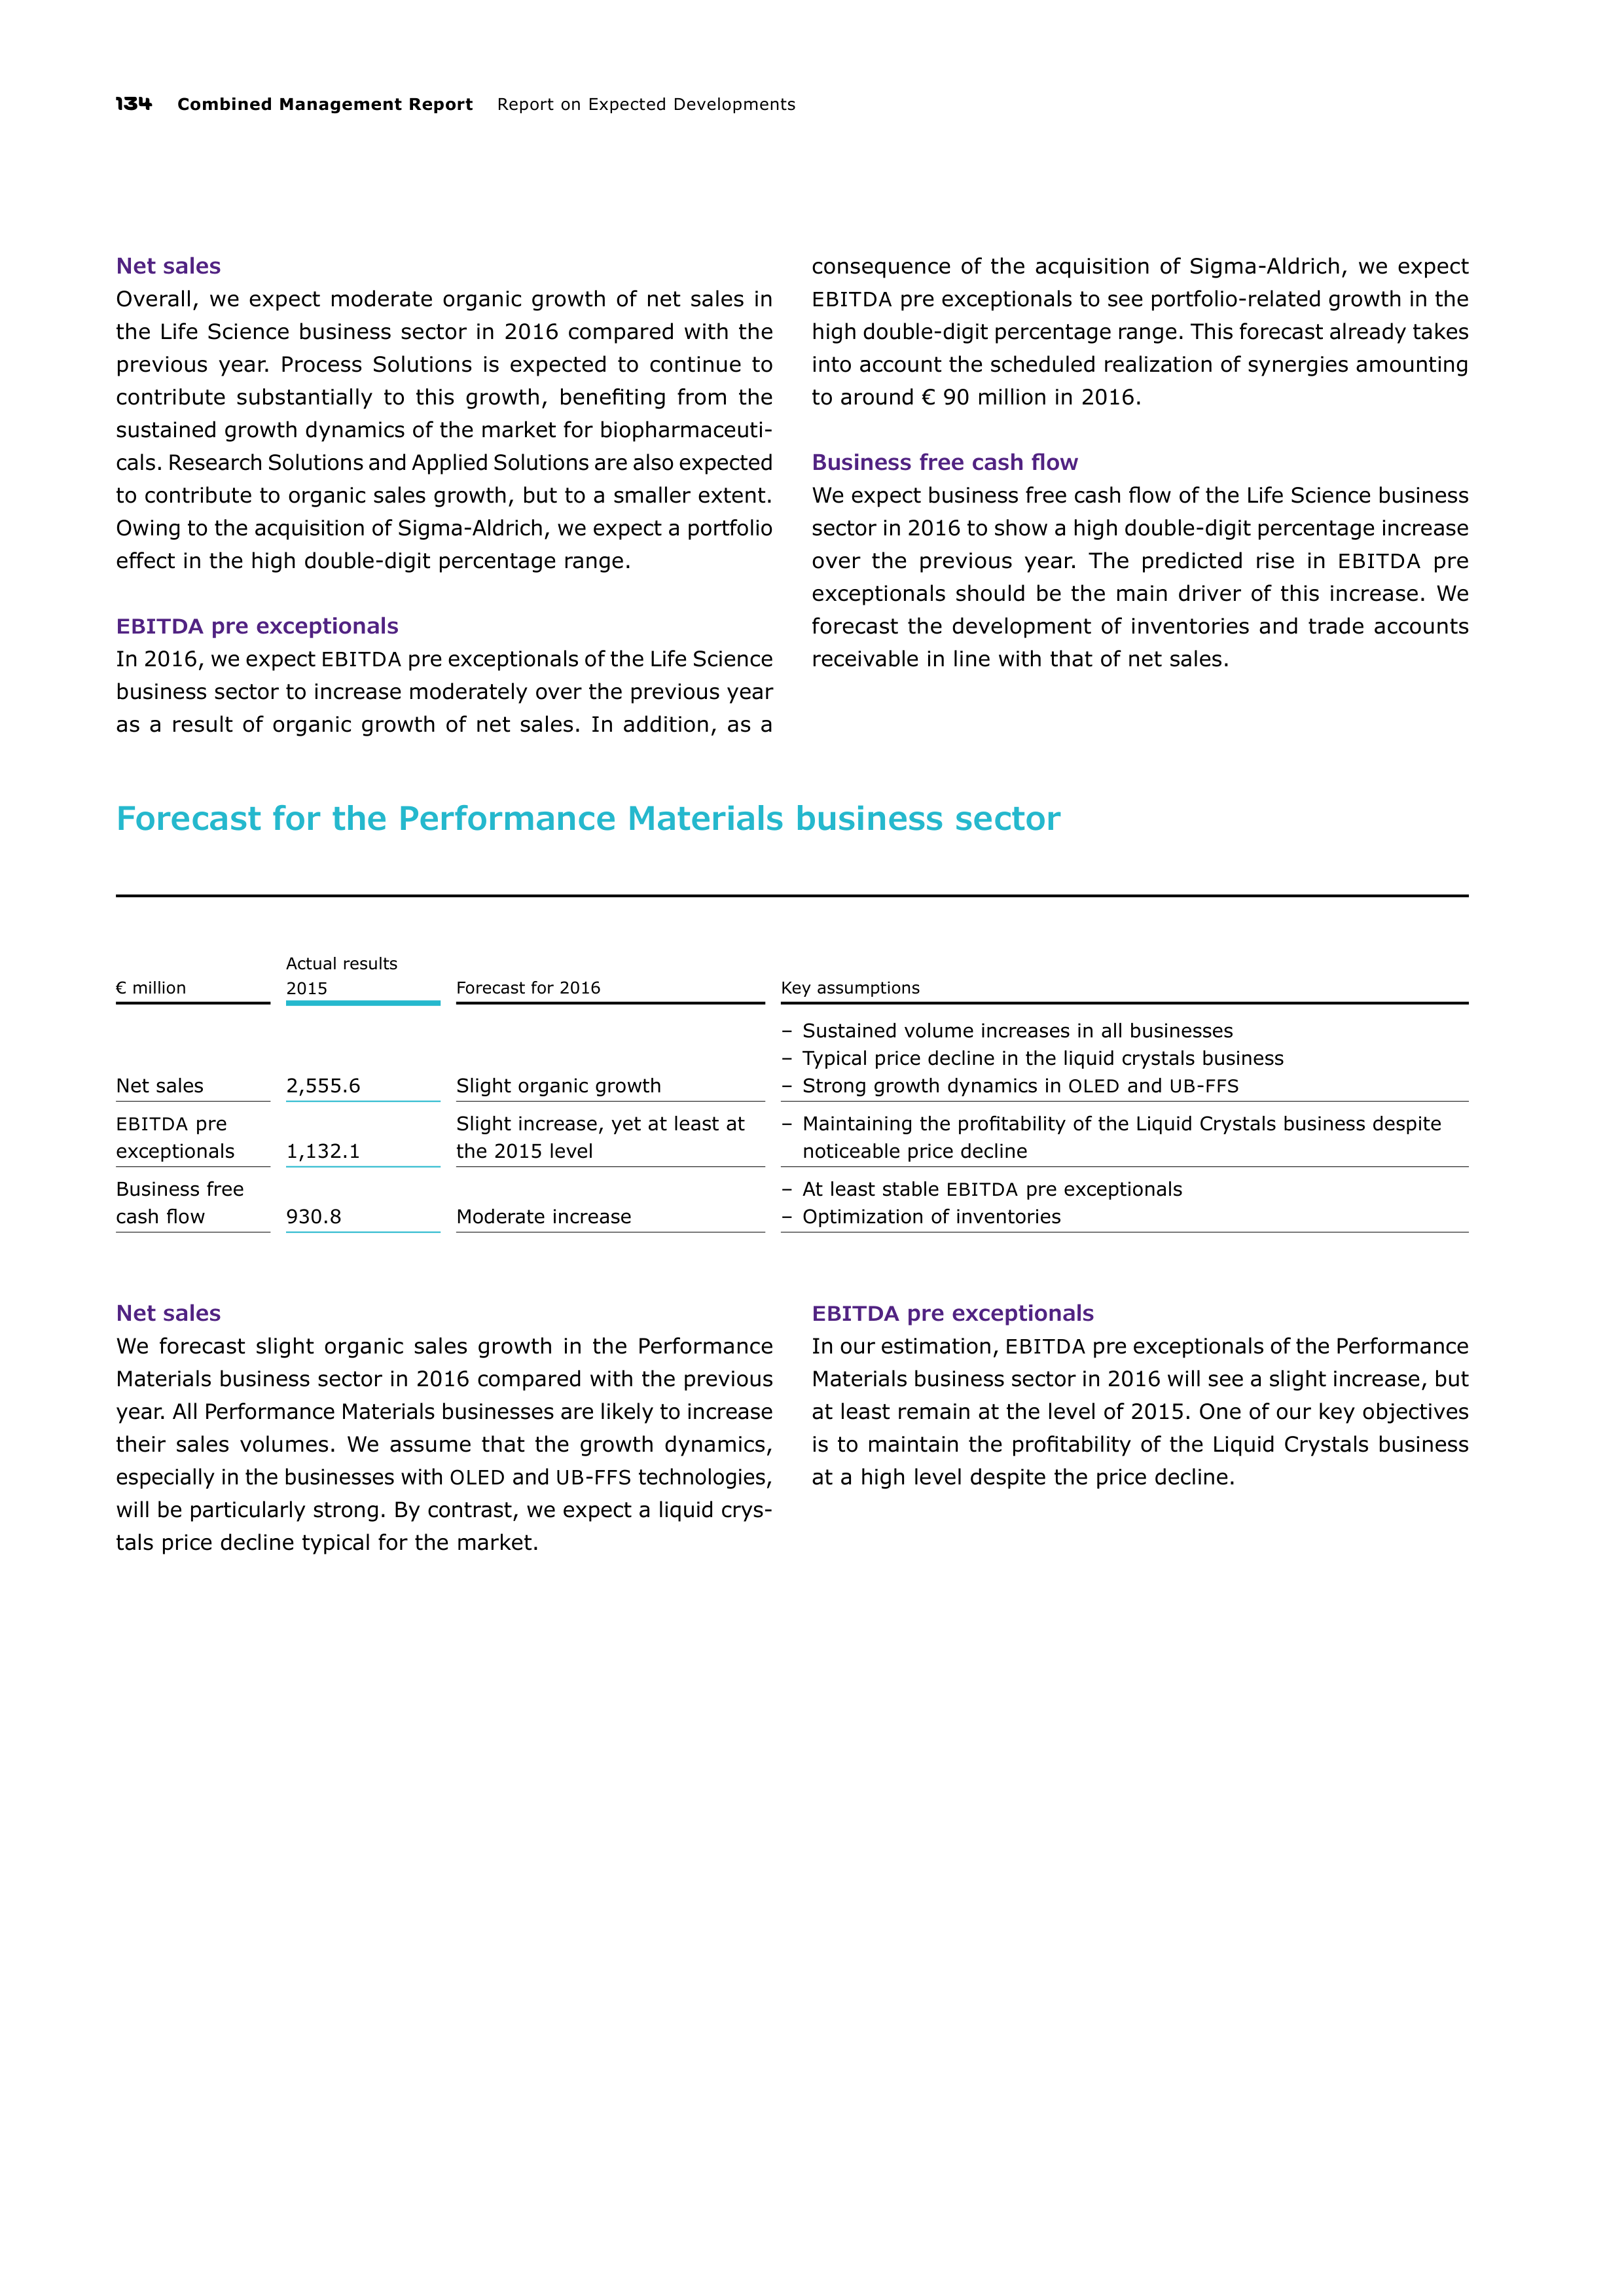
134
Combined Management Report
Report on Expected Developments
Net sales
Overall, we expect moderate organic growth of net sales in
the Life Science business sector in 2016 compared with the
previous year. Process Solutions is expected to continue to
contribute substantially to this growth, benefiting from the
sustained growth dynamics of the market for biopharmaceuti-
cals. Research Solutions and Applied Solutions are also expected
to contribute to organic sales growth, but to a smaller extent.
Owing to the acquisition of Sigma-Aldrich, we expect a portfolio
effect in the high double-digit percentage range.
EBITDA
pre exceptionals
In 2016, we expect
EBITDA
pre exceptionals of the Life Science
business sector to increase moderately over the previous year
as a result of organic growth of net sales. In addition, as a
consequence of the acquisition of Sigma-Aldrich, we expect
EBITDA
pre exceptionals to see portfolio-related growth in the
high double-digit percentage range. This forecast already takes
into account the scheduled realization of synergies amounting
to around € 90 million in 2016.
Business free cash flow
We expect business free cash flow of the Life Science business
sector in 2016 to show a high double-digit percentage increase
over the previous year. The predicted rise in
EBITDA
pre
exceptionals should be the main driver of this increase. We
forecast the development of inventories and trade accounts
receivable in line with that of net sales.
Forecast for the Performance Materials business sector
€ million
Actual results
2015
Forecast for 2016
Key assumptions
Net sales
2,555.6
Slight organic growth
– Sustained volume increases in all businesses
– Typical price decline in the liquid crystals business
– Strong growth dynamics in
OLED
and
UB
-
FFS
EBITDA
pre
exceptionals
1,132.1
Slight increase, yet at least at
the 2015 level
– Maintaining the profitability of the Liquid Crystals business despite
noticeable price decline
Business free
cash flow
930.8
Moderate increase
– At least stable
EBITDA
pre exceptionals
– Optimization of inventories
Net sales
We forecast slight organic sales growth in the Performance
Materials business sector in 2016 compared with the previous
year. All Performance Materials businesses are likely to increase
their sales volumes. We assume that the growth dynamics,
especially in the businesses with
OLED
and
UB
-
FFS
technologies,
will be particularly strong. By contrast, we expect a liquid crys-
tals price decline typical for the market.
EBITDA
pre exceptionals
In our estimation,
EBITDA
pre exceptionals of the Performance
Materials business sector in 2016 will see a slight increase, but
at least remain at the level of 2015. One of our key objectives
is to maintain the profitability of the Liquid Crystals business
at a high level despite the price decline.
Report on Expected Developments
Combined Management Report
135
Business free cash flow
In 2016, business free cash flow of the Performance Materials
business sector is forecast to increase moderately. This fore-
cast is in line with the expected development of
EBITDA
pre
exceptionals. As regards inventories, we expect an optimiza-
tion of these in 2016.
Summary
For 2016, we expect a slight organic increase in Group net sales,
to which all business sectors are forecast to contribute.
Owing
to the acquisition of Sigma-Aldrich, we additionally expect a
positive portfolio effect in the low double-digit percentage
range compared with the previous year.
EBITDA
pre exceptionals of the Merck Group is expected to
increase by a low double-digit percentage in 2016, taking into
consideration the portfolio effect resulting from the Sigma-
Aldrich acquisition. This includes expected cost synergies from
the integration of Sigma-Aldrich. In the Healthcare business
sector, we will invest further in the research and development
of innovative medicines and therefore expect additional
expenses for the pharmaceutical pipeline. For the Performance
Materials business sector, we continue to expect high earning
power and assume that
EBITDA
pre exceptionals will increase
slightly, but at least remain at the level of 2015. We expect
business free cash flow of the Merck Group to show a high
single-digit percentage increase over 2015.
136
Combined Management Report
Report in accordance with section 315 (4) of the German Commercial Code (HGB)
REPORT IN ACCORDANCE WITH SECTION 315 (4)
OF THE GERMAN COMMERCIAL CODE (HGB)
The following information is provided in accordance with sec
tion 315 (4) of the German Commercial Code and the explana
tory report pursuant to section 176 (1) sentence 1 of the
German Stock Corporation Act (AktG).
As of the balance sheet date, the company’s subscribed
capital is divided into 129,242,251 no-par value bearer shares
plus one registered share. Each share therefore corresponds
to € 1.30 of the share capital. The holder of the registered
share is E. Merck Beteiligungen KG. It is entitled and obliged
to appoint one-third of the members of the Supervisory Board
representing the limited liability shareholders. If the holder of
the registered share is a general partner, he or she has no
such right of appointment. The transfer of the registered share
requires the company’s approval. The approval is granted at
the sole discretion of the personally liable general partner with
an equity interest, namely E. Merck KG.
Pursuant to the information on voting rights submitted
to us in accordance with the German Securities Trading Act
(WpHG), on December 31, 2015 no shareholders owned direct
or indirect investments exceeding more than 10% of the vot
ing rights.
According to the Articles of Association of Merck, the gen
eral partners not holding an equity interest who form the
Executive Board are admitted by E. Merck KG with the consent
of a simple majority of the other general partners. A person
may only be a general partner not holding an equity interest if
he or she is also a general partner of E. Merck KG. In addition,
at the proposal of E. Merck KG and with the approval of all
general partners not holding an equity interest, further per
sons who are not general partners not holding an equity inter
est may be appointed to the Executive Board.
The Articles of Association can be amended by a resolution
by the Annual Meeting that requires the approval of the gen
eral partners. The resolutions of the General Meeting are, not
withstanding any statutory provisions to the contrary, adopted
by a simple majority of the votes cast. Where the law requires
a capital majority in addition to the voting majority, resolu
tions are adopted by a simple majority of the share capital
represented in the vote. The Articles of Association of the
company specify the authorized share capital.
The Executive Board is authorized, with the approval of the
Supervisory Board and of E. Merck KG, to increase the share
capital on one or several occasions until April 26, 2018 by up
to a total of € 56,521,124.19 by issuing new shares against
cash and / or contributions in kind (Authorized Capital). The
Executive Board is authorized to exclude, with the approval of
the Supervisory Board, the statutory subscription right of the
limited liability shareholders in the case of capital increases
against cash contributions if the issue price of the new shares
is not significantly lower than the stock exchange price of
already listed shares carrying the same rights, as defined in
section 203 (1) and (2) and section 186 (3) sentence 4 of the
German Stock Corporation Act (AktG), at the time when the
Executive Board finally fixes the issue price, and if the pro
portion of the share capital represented by the new shares
for
which the subscription right is excluded does not exceed
10%
of the share capital available at the time of the resolu
tion of the Annual General Meeting or – if this amount is
lower – of the share capital available at the time of exercising
this authorization. This upper limit shall be reduced by the
prorated amount of shares that are sold during the term of the
authorized capital under exclusion of shareholders’ subscrip
tion rights pursuant to section 71 (1) no. 8 sentence 5 and
section 186 (3) sentence 4 of the German Stock Corporation
Act, as well as shares that must be issued to redeem option
or
convertible bonds, as long as the bonds have been issued
during the term of this authorization under exclusion of sub
scription rights. In addition, with the approval of the Super
vi
sory Board, the subscription right of the shareholders can be
excluded in order to enable E. Merck KG to exercise its right
pursuant to Article 32 (3) of the Articles of Association to par
ticipate in a capital increase by issuing shares or freely trans
ferable share subscription rights and to enable E. Merck KG
to
exercise its right pursuant to Article 33 of the Articles of
Association to convert its equity interest into share capital.
Moreover, with the approval of the Supervisory Board, the
subscription right of the shareholders can be excluded as far
as this is necessary, in order to grant subscription rights for
new shares to holders of warrants and convertible bonds
issued by the company or its subsidiaries, to the extent to
which they would be entitled after exercising their option and
conversion rights or fulfilling their option and conversion obli
gations. Lastly, with the approval of the Supervisory Board,
the subscription right of the shareholders can be excluded in
order to exclude fractional amounts from the subscription
right.
The Articles of Association also encompass contingent
capital. The share capital is contingently increased by up to
€ 66,406,298.40 divided into 51,081,768 shares (Contingent
Capital I). The contingent capital increase serves to grant
Report in accordance with section 315 (4) of the German Commercial Code (HGB)
Combined Management Report
137
exchange rights to E. Merck KG in accordance with Article 33
of the Articles of Association to enable the conversion of its
equity interest. The shares carry dividend rights from the
beginning of the fiscal year following the year in which the
conversion option is exercised. Moreover, the share capital is
contingently increased by up to € 16,801,491.20 composed
of up to 12,924,224 no-par value bearer shares (Contingent
Capital II). This increase in contingent capital is only to be
implemented insofar as the bearers or creditors of option or
conversion rights or the conversion obligations on warrant
bonds, option participation certificates, option participation
bonds, convertible bonds, convertible participation certificates
or convertible participation bonds issued against contributions
that are issued or guaranteed by the company or a subordi
nate Group company on the basis of the authorization resolu
tion of the Annual General Meeting of May 9, 2014 to May 8,
2019, utilize their option or conversion rights or, to fulfill their
conversion obligation insofar as they are obliged to fulfill their
conversion obligation, or insofar as the company exercises an
option, wholly or in part, of granting shares in the company
instead of paying the sum of money due and to the extent that
in each case a cash settlement is not granted, or own shares
or other forms of fulfillment are used. Each issue of new shares
shall take place at the determined option or conversion price,
pursuant to the aforementioned authorization resolution. The
new shares participate in the profit from the beginning of the
fiscal year in which they are created; insofar as this is legally
permissible, the Executive Board may, with the approval of the
Supervisory Board, and in deviation from section 60 (2) AktG,
stipulate that the new shares also participate in the profit for
a past fiscal year. The Executive Board is authorized, with the
approval of the Supervisory Board and of E. Merck, to stipulate
the further details of the implementation of the increase in
contingent capital.
The company is not authorized to acquire its own shares.
The company has not entered into any material agree
ments subject to a change of control pursuant to a takeover
offer nor has it entered into any compensation agreements
with the members of the Executive Board or employees in the
event of a takeover offer.
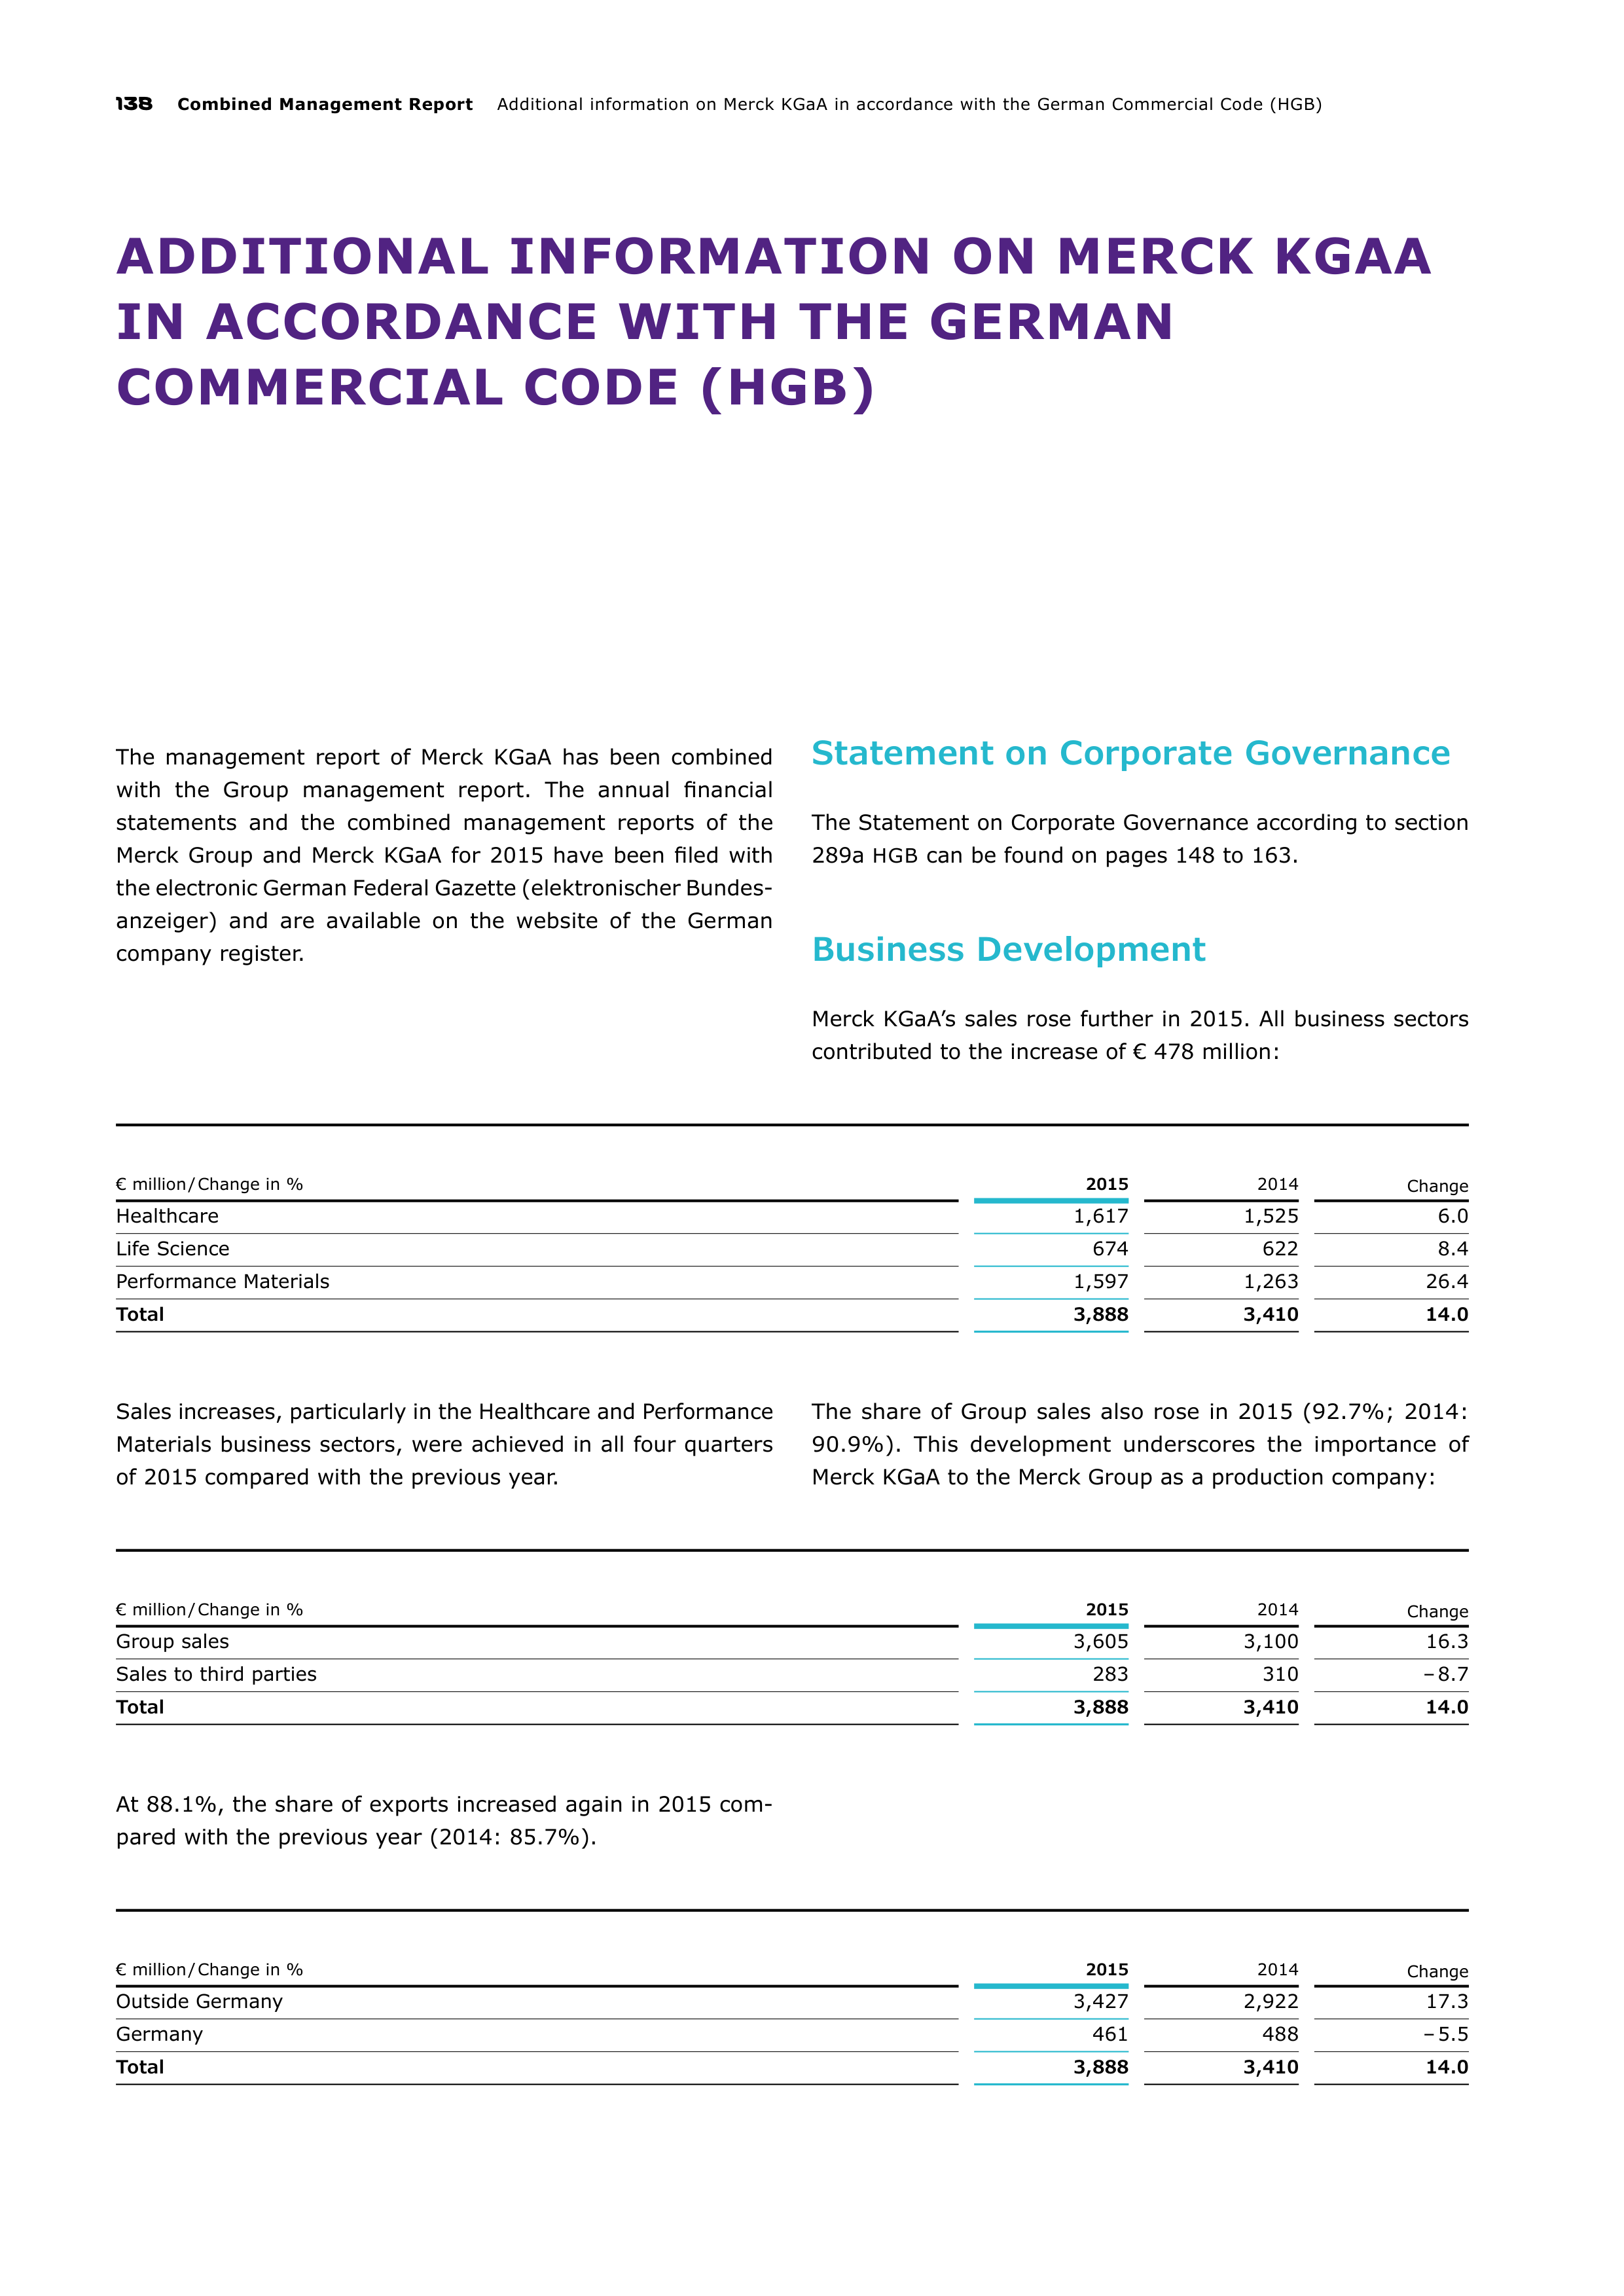
138
Combined Management Report
Additional information on Merck KGaA in accordance with the German Commercial Code (HGB)
ADDITIONAL INFORMATION ON MERCK KGAA
IN ACCORDANCE WITH THE GERMAN
COMMERCIAL CODE (HGB)
The management report of Merck KGaA has been combined
with the Group management report. The annual financial
statements and the combined management reports of the
Merck Group and Merck KGaA for 2015 have been filed with
the electronic German Federal Gazette (elektronischer Bundes
anzeiger) and are available on the website of the German
company register.
Statement on Corporate Governance
The Statement on Corporate Governance according to section
289a
HGB
can be found on pages 148 to 163.
Business Development
Merck KGaA’s sales rose further in 2015. All business sectors
contributed to the increase of € 478 million:
€ million / Change in %
2015
2014
Change
Healthcare
1,617
1,525
6.0
Life Science
674
622
8.4
Performance Materials
1,597
1,263
26.4
Total
3,888
3,410
14.0
Sales increases, particularly in the Healthcare and Performance
Materials business sectors, were achieved in all four quarters
of 2015 compared with the previous year.
The share of Group sales also rose in 2015 (92.7%; 2014:
90.9%). This development underscores the importance of
Merck KGaA to the Merck Group as a production company:
€ million / Change in %
2015
2014
Change
Group sales
3,605
3,100
16.3
Sales to third parties
283
310
– 8.7
Total
3,888
3,410
14.0
At 88.1%, the share of exports increased again in 2015 com
pared with the previous year (2014: 85.7%).
€ million / Change in %
2015
2014
Change
Outside Germany
3,427
2,922
17.3
Germany
461
488
– 5.5
Total
3,888
3,410
14.0
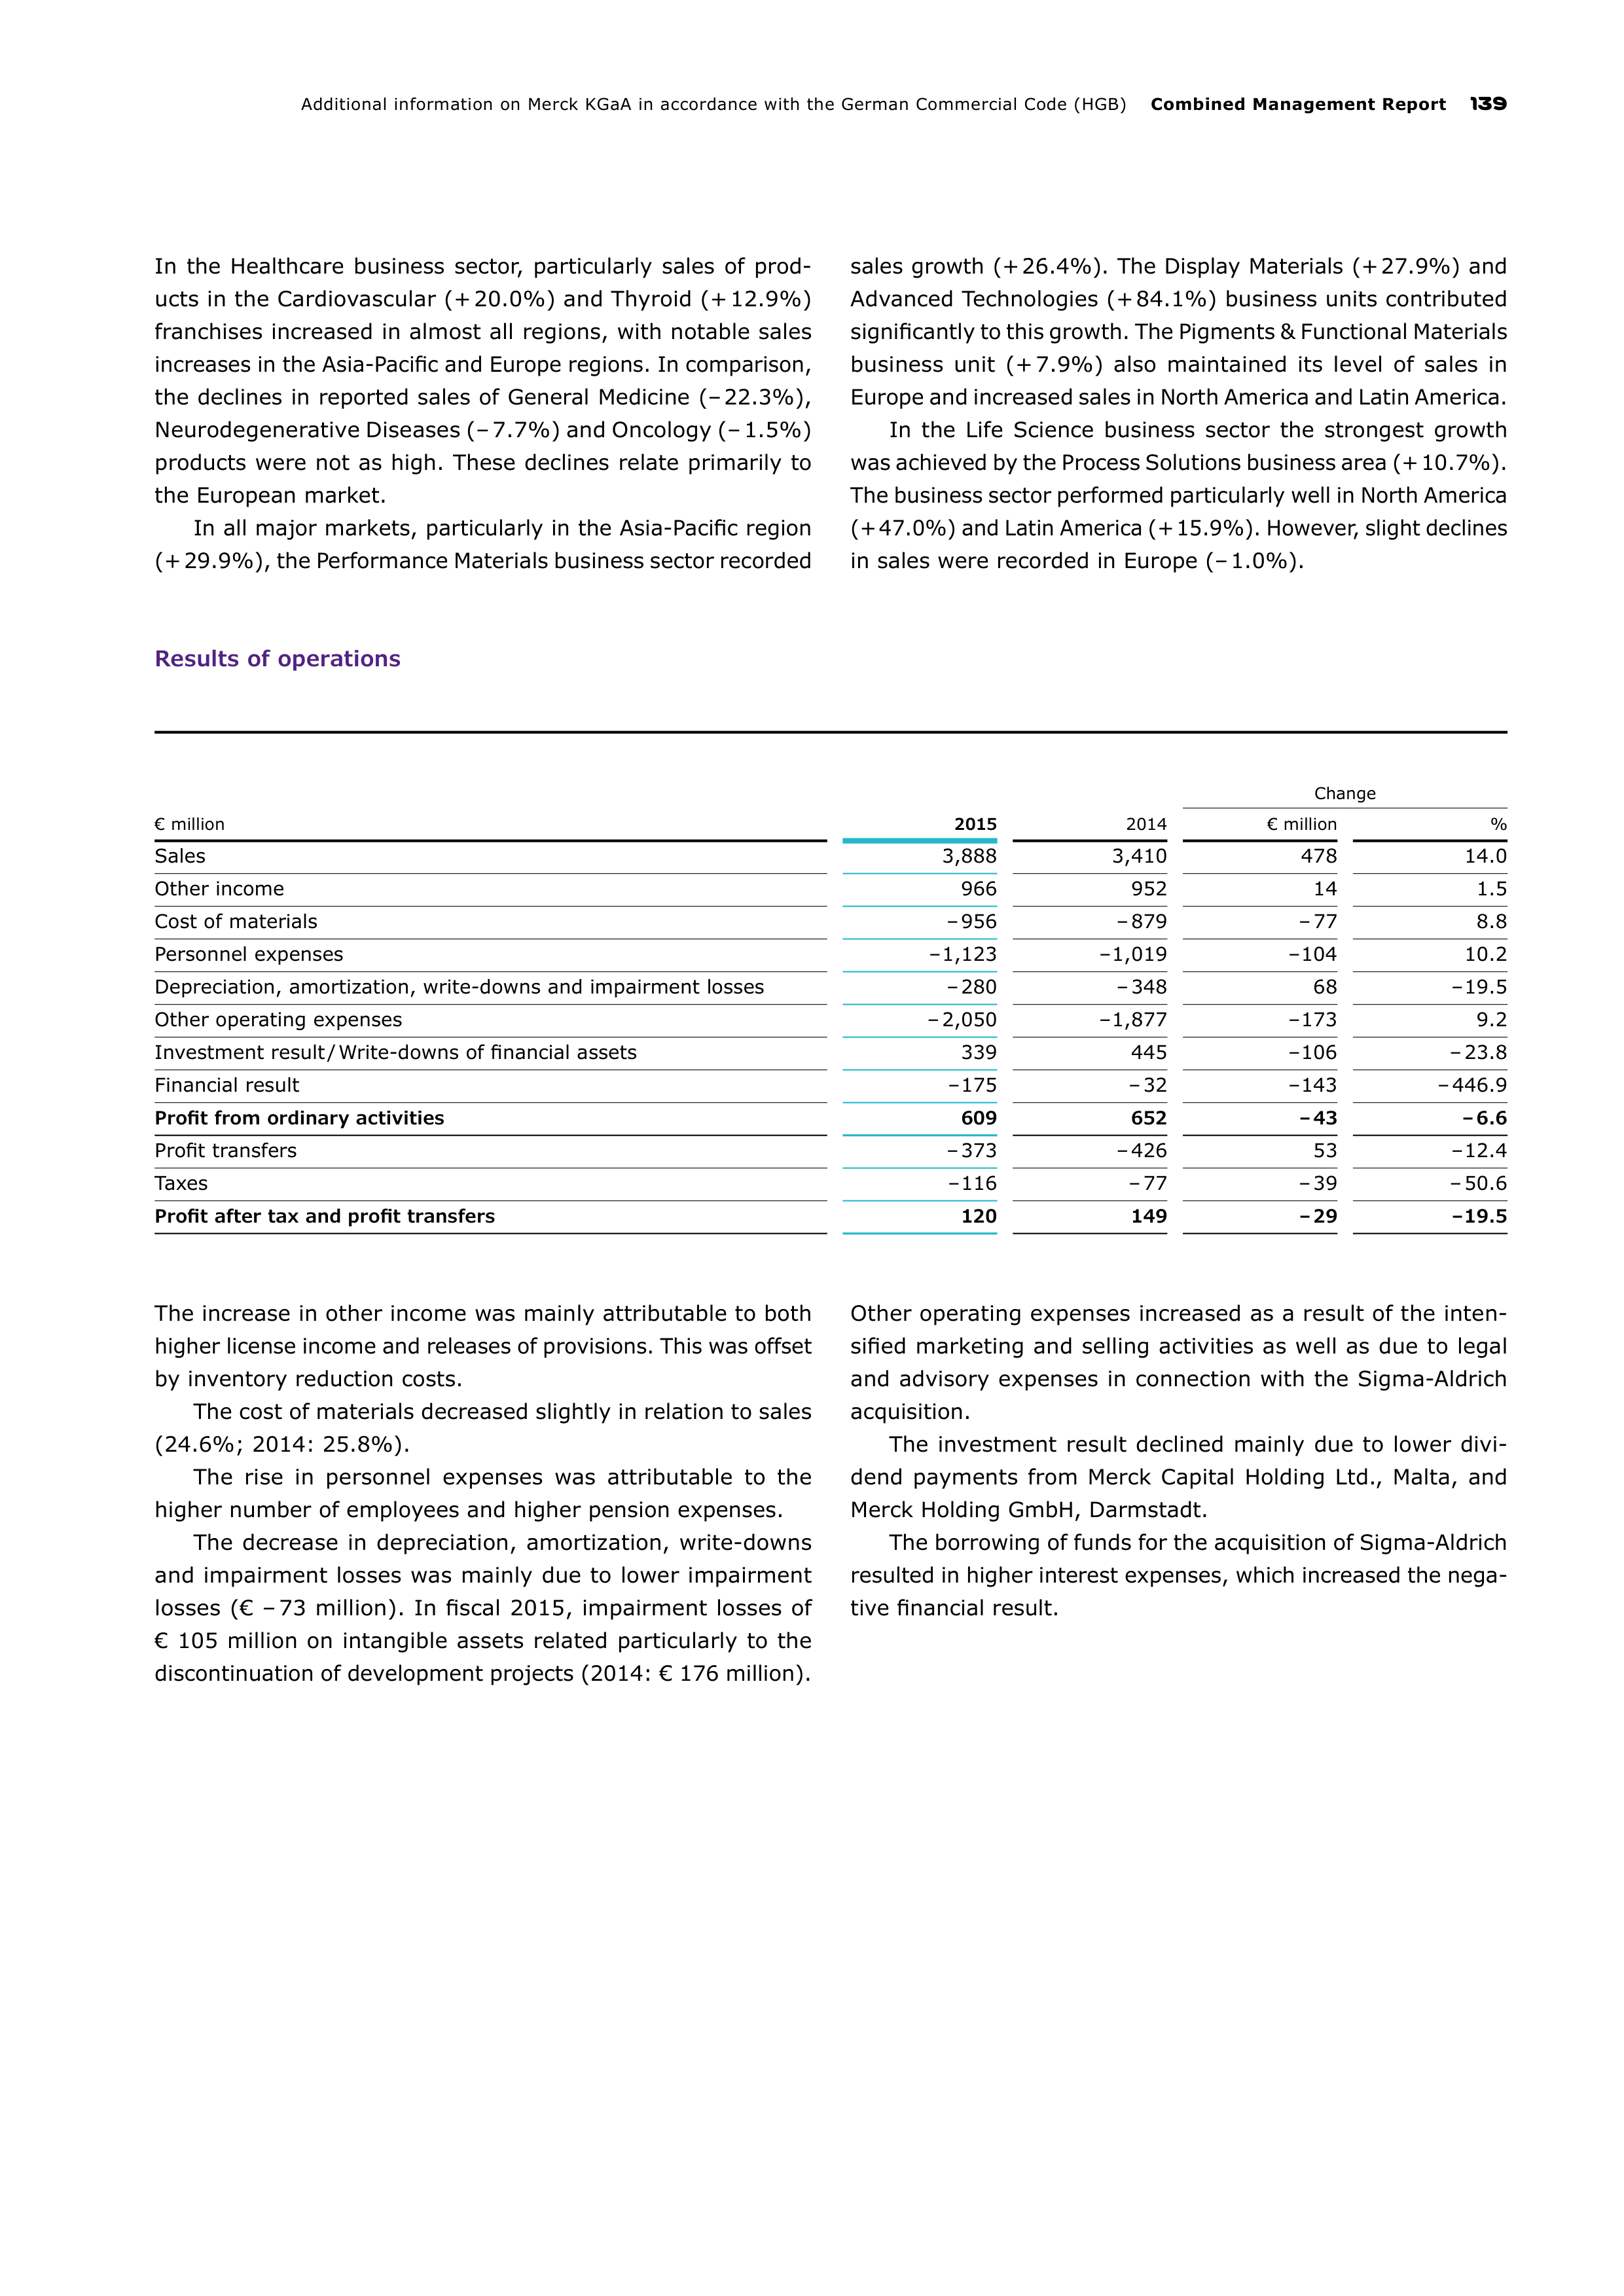
Additional information on Merck KGaA in accordance with the German Commercial Code (HGB)
Combined Management Report
139
In the Healthcare business sector, particularly sales of prod
ucts in the Cardiovascular (+ 20.0%) and Thyroid (+ 12.9%)
franchises increased in almost all regions, with notable sales
increases in the Asia-Pacific and Europe regions. In comparison,
the declines in reported sales of General Medicine (– 22.3%),
Neurodegenerative Diseases (– 7.7%) and Oncology (– 1.5%)
products were not as high. These declines relate primarily to
the European market.
In all major markets, particularly in the Asia-Pacific region
(+ 29.9%), the Performance Materials business sector recorded
sales growth (+ 26.4%). The Display Materials (+ 27.9%) and
Advanced Technologies (+ 84.1%) business units contributed
significantly to this growth. The Pigments & Functional Materials
business unit (+ 7.9%) also maintained its level of sales in
Europe and increased sales in North America and Latin America.
In the Life Science business sector the strongest growth
was achieved by the Process Solutions business area (+ 10.7%).
The business sector performed particularly well in North America
(+ 47.0%) and Latin America (+ 15.9%). However, slight declines
in sales were recorded in Europe (– 1.0%).
Results of operations
Change
€ million
2015
2014
€ million
%
Sales
3,888
3,410
478
14.0
Other income
966
952
14
1.5
Cost of materials
– 956
– 879
– 77
8.8
Personnel expenses
– 1,123
– 1,019
– 104
10.2
Depreciation, amortization, write-downs and impairment losses
– 280
– 348
68
– 19.5
Other operating expenses
– 2,050
– 1,877
– 173
9.2
Investment result / Write-downs of financial assets
339
445
– 106
– 23.8
Financial result
– 175
– 32
– 143
– 446.9
Profit from ordinary activities
609
652
– 43
– 6.6
Profit transfers
– 373
– 426
53
– 12.4
Taxes
– 116
– 77
– 39
– 50.6
Profit after tax and profit transfers
120
149
– 29
– 19.5
The increase in other income was mainly attributable to both
higher license income and releases of provisions. This was offset
by inventory reduction costs.
The cost of materials decreased slightly in relation to sales
(24.6%; 2014: 25.8%).
The rise in personnel expenses was attributable to the
higher number of employees and higher pension expenses.
The decrease in depreciation, amortization, write-downs
and impairment losses was mainly due to lower impairment
losses (€ – 73 million). In fiscal 2015, impairment losses of
€ 105 million on intangible assets related particularly to the
discontinuation of development projects (2014: € 176 million).
Other operating expenses increased as a result of the inten
sified marketing and selling activities as well as due to legal
and advisory expenses in connection with the Sigma-Aldrich
acquisition.
The investment result declined mainly due to lower divi
dend payments from Merck Capital Holding Ltd., Malta, and
Merck Holding GmbH, Darmstadt.
The borrowing of funds for the acquisition of Sigma-Aldrich
resulted in higher interest expenses, which increased the nega
tive financial result.
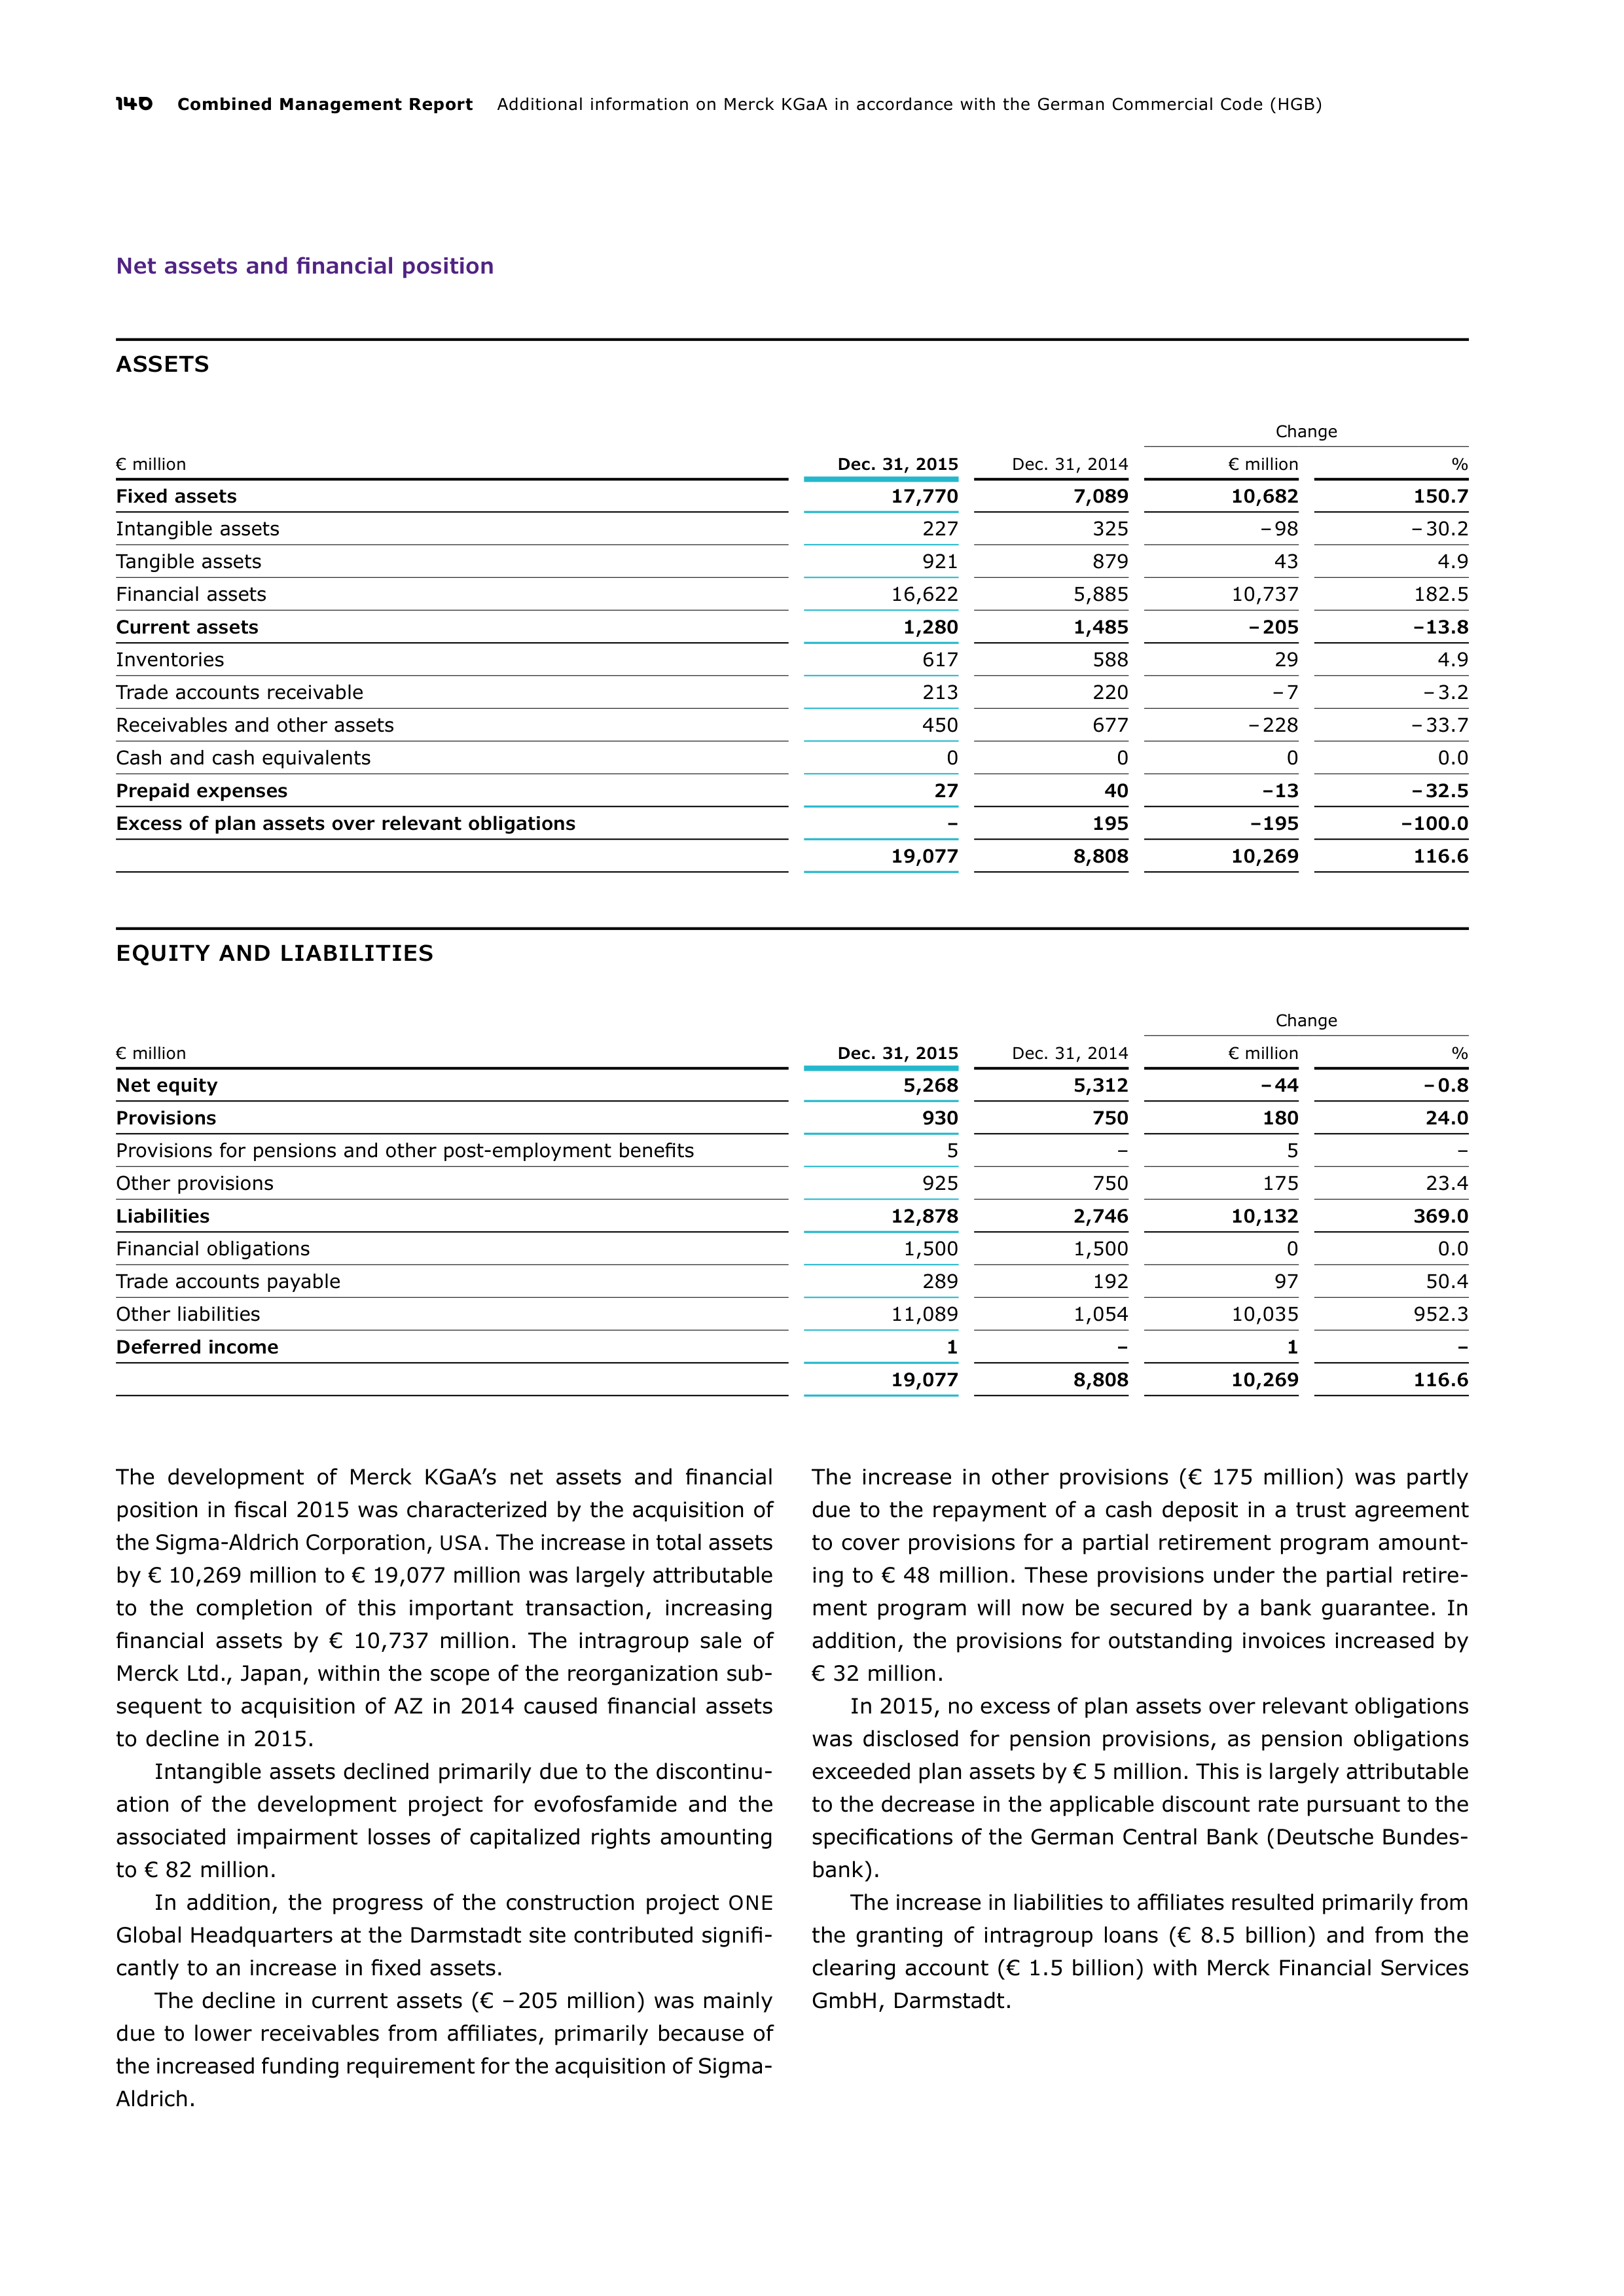
140
Combined Management Report
Additional information on Merck KGaA in accordance with the German Commercial Code (HGB)
Net assets and financial position
ASSETS
Change
€ million
Dec. 31, 2015
Dec. 31, 2014
€ million
%
Fixed assets
17,770
7,089
10,682
150.7
Intangible assets
227
325
– 98
– 30.2
Tangible assets
921
879
43
4.9
Financial assets
16,622
5,885
10,737
182.5
Current assets
1,280
1,485
– 205
– 13.8
Inventories
617
588
29
4.9
Trade accounts receivable
213
220
– 7
– 3.2
Receivables and other assets
450
677
– 228
– 33.7
Cash and cash equivalents
0
0
0
0.0
Prepaid expenses
27
40
– 13
– 32.5
Excess of plan assets over relevant obligations
–
195
– 195
– 100.0
19,077
8,808
10,269
116.6
EQUITY AND LIABILITIES
Change
€ million
Dec. 31, 2015
Dec. 31, 2014
€ million
%
Net equity
5,268
5,312
– 44
– 0.8
Provisions
930
750
180
24.0
Provisions for pensions and other post-employment benefits
5
–
5
–
Other provisions
925
750
175
23.4
Liabilities
12,878
2,746
10,132
369.0
Financial obligations
1,500
1,500
0
0.0
Trade accounts payable
289
192
97
50.4
Other liabilities
11,089
1,054
10,035
952.3
Deferred income
1
–
1
–
19,077
8,808
10,269
116.6
The development of Merck KGaA’s net assets and financial
position in fiscal 2015 was characterized by the acquisition of
the Sigma-Aldrich Corporation,
USA
. The increase in total assets
by € 10,269 million to € 19,077 million was largely attributable
to the completion of this important transaction, increasing
financial assets by € 10,737 million. The intragroup sale of
Merck Ltd., Japan, within the scope of the reorganization sub
sequent to acquisition of AZ in 2014 caused financial assets
to
decline in 2015.
Intangible assets declined primarily due to the discontinu
ation of the development project for evofosfamide and the
associated impairment losses of capitalized rights amounting
to € 82 million.
In addition, the progress of the construction project
ONE
Global Headquarters at the Darmstadt site contributed signifi
cantly to an increase in fixed assets.
The decline in current assets (€ – 205 million) was mainly
due to lower receivables from affiliates, primarily because of
the increased funding requirement for the acquisition of Sigma-
Aldrich.
The increase in other provisions (€ 175 million) was partly
due to the repayment of a cash deposit in a trust agreement
to cover provisions for a partial retirement program amount
ing to € 48 million. These provisions under the partial retire
ment program will now be secured by a bank guarantee. In
addition, the provisions for outstanding invoices increased by
€ 32 million.
In 2015, no excess of plan assets over relevant obligations
was disclosed for pension provisions, as pension obligations
exceeded plan assets by € 5 million. This is largely attributable
to the decrease in the applicable discount rate pursuant to the
specifications of the German Central Bank (Deutsche Bundes
bank).
The increase in liabilities to affiliates resulted primarily from
the granting of intragroup loans (€ 8.5 billion) and from
the
clearing account (€ 1.5 billion) with Merck Financial
Services
GmbH, Darmstadt.
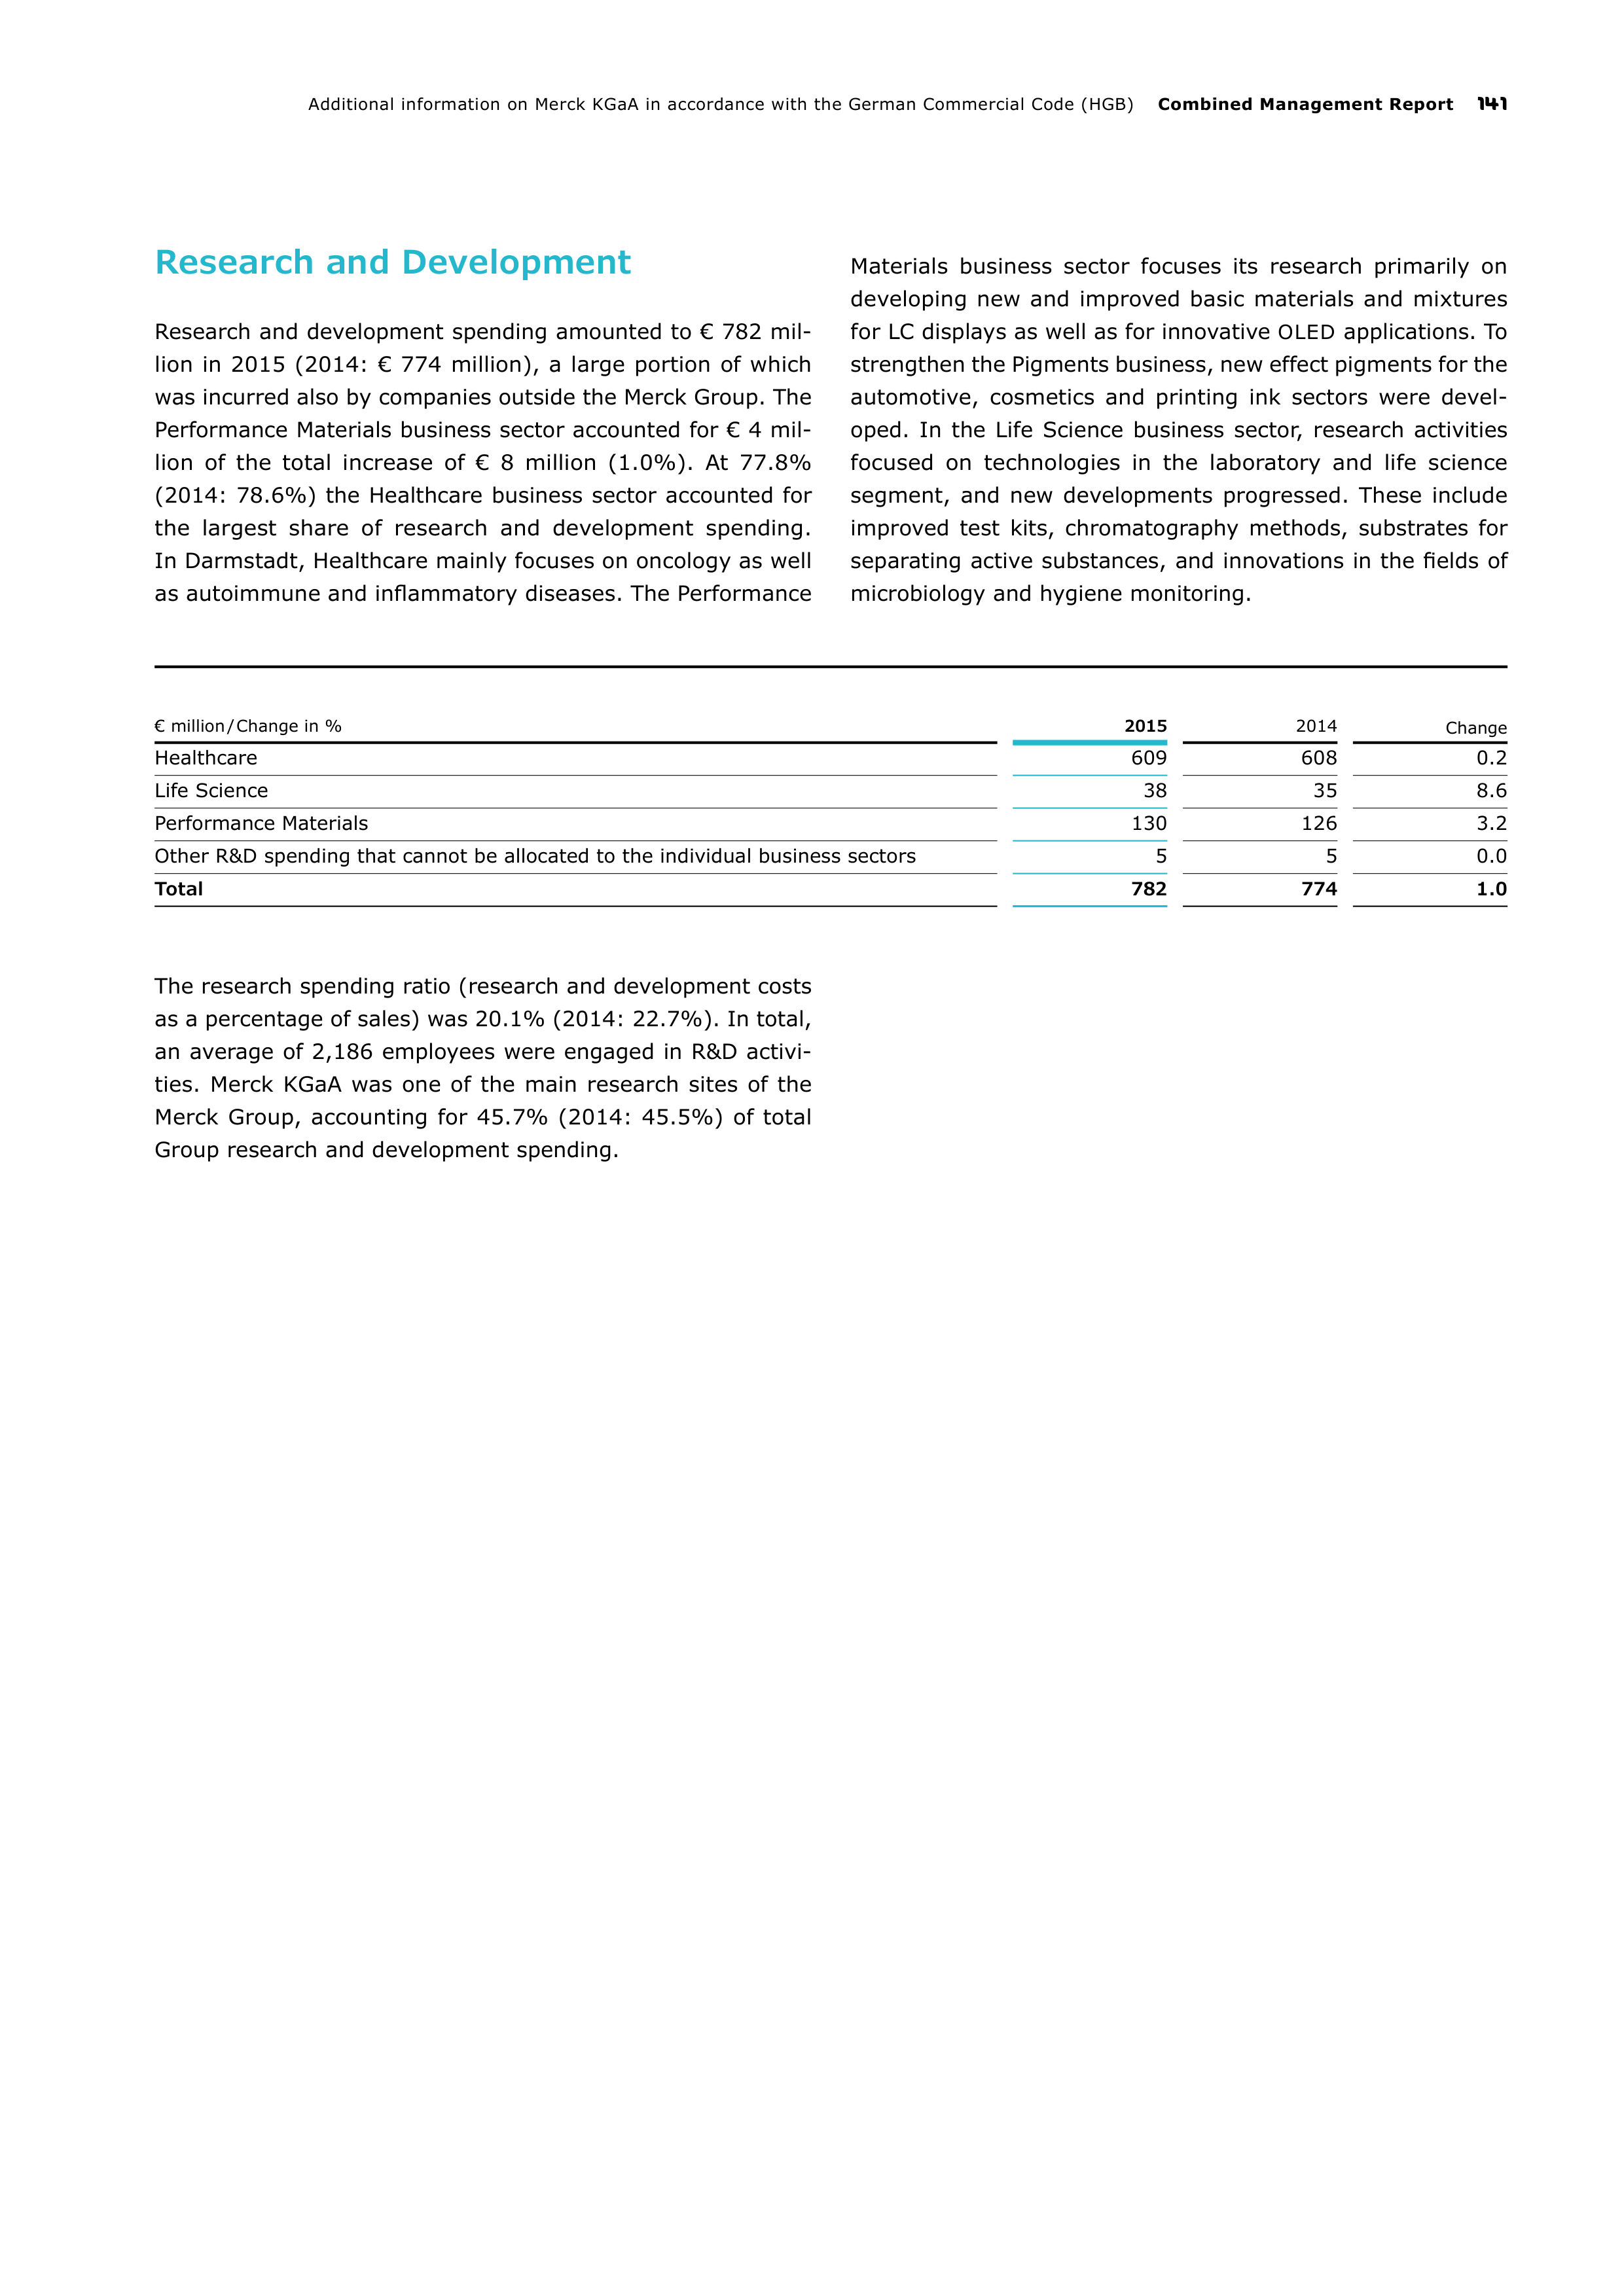
Additional information on Merck KGaA in accordance with the German Commercial Code (HGB)
Combined Management Report
141
Research and Development
Research and development spending amounted to € 782 mil
lion in 2015 (2014: € 774 million), a large portion of which
was incurred also by companies outside the Merck Group. The
Performance Materials business sector accounted for € 4 mil
lion of the total increase of € 8 million (1.0%). At 77.8%
(2014: 78.6%) the Healthcare business sector accounted for
the largest share of research and development spending.
In Darmstadt, Healthcare mainly focuses on oncology as well
as autoimmune and inflammatory diseases. The Performance
Materials business sector focuses its research primarily on
developing new and improved basic materials and mixtures
for
LC displays as well as for innovative
OLED
applications. To
strengthen the Pigments business, new effect pigments for the
automotive, cosmetics and printing ink sectors were devel
oped. In the Life Science business sector, research activities
focused on technologies in the laboratory and life science
segment, and new developments progressed. These include
improved test kits, chromatography methods, substrates for
separating active substances, and innovations in the fields of
microbiology and hygiene monitoring.
€ million / Change in %
2015
2014
Change
Healthcare
609
608
0.2
Life Science
38
35
8.6
Performance Materials
130
126
3.2
Other R&D spending that cannot be allocated to the individual business sectors
5
5
0.0
Total
782
774
1.0
The research spending ratio (research and development costs
as a percentage of sales) was 20.1% (2014: 22.7%). In total,
an average of 2,186 employees were engaged in R&D activi
ties. Merck KGaA was one of the main research sites of the
Merck Group, accounting for 45.7% (2014: 45.5%) of total
Group research and development spending.
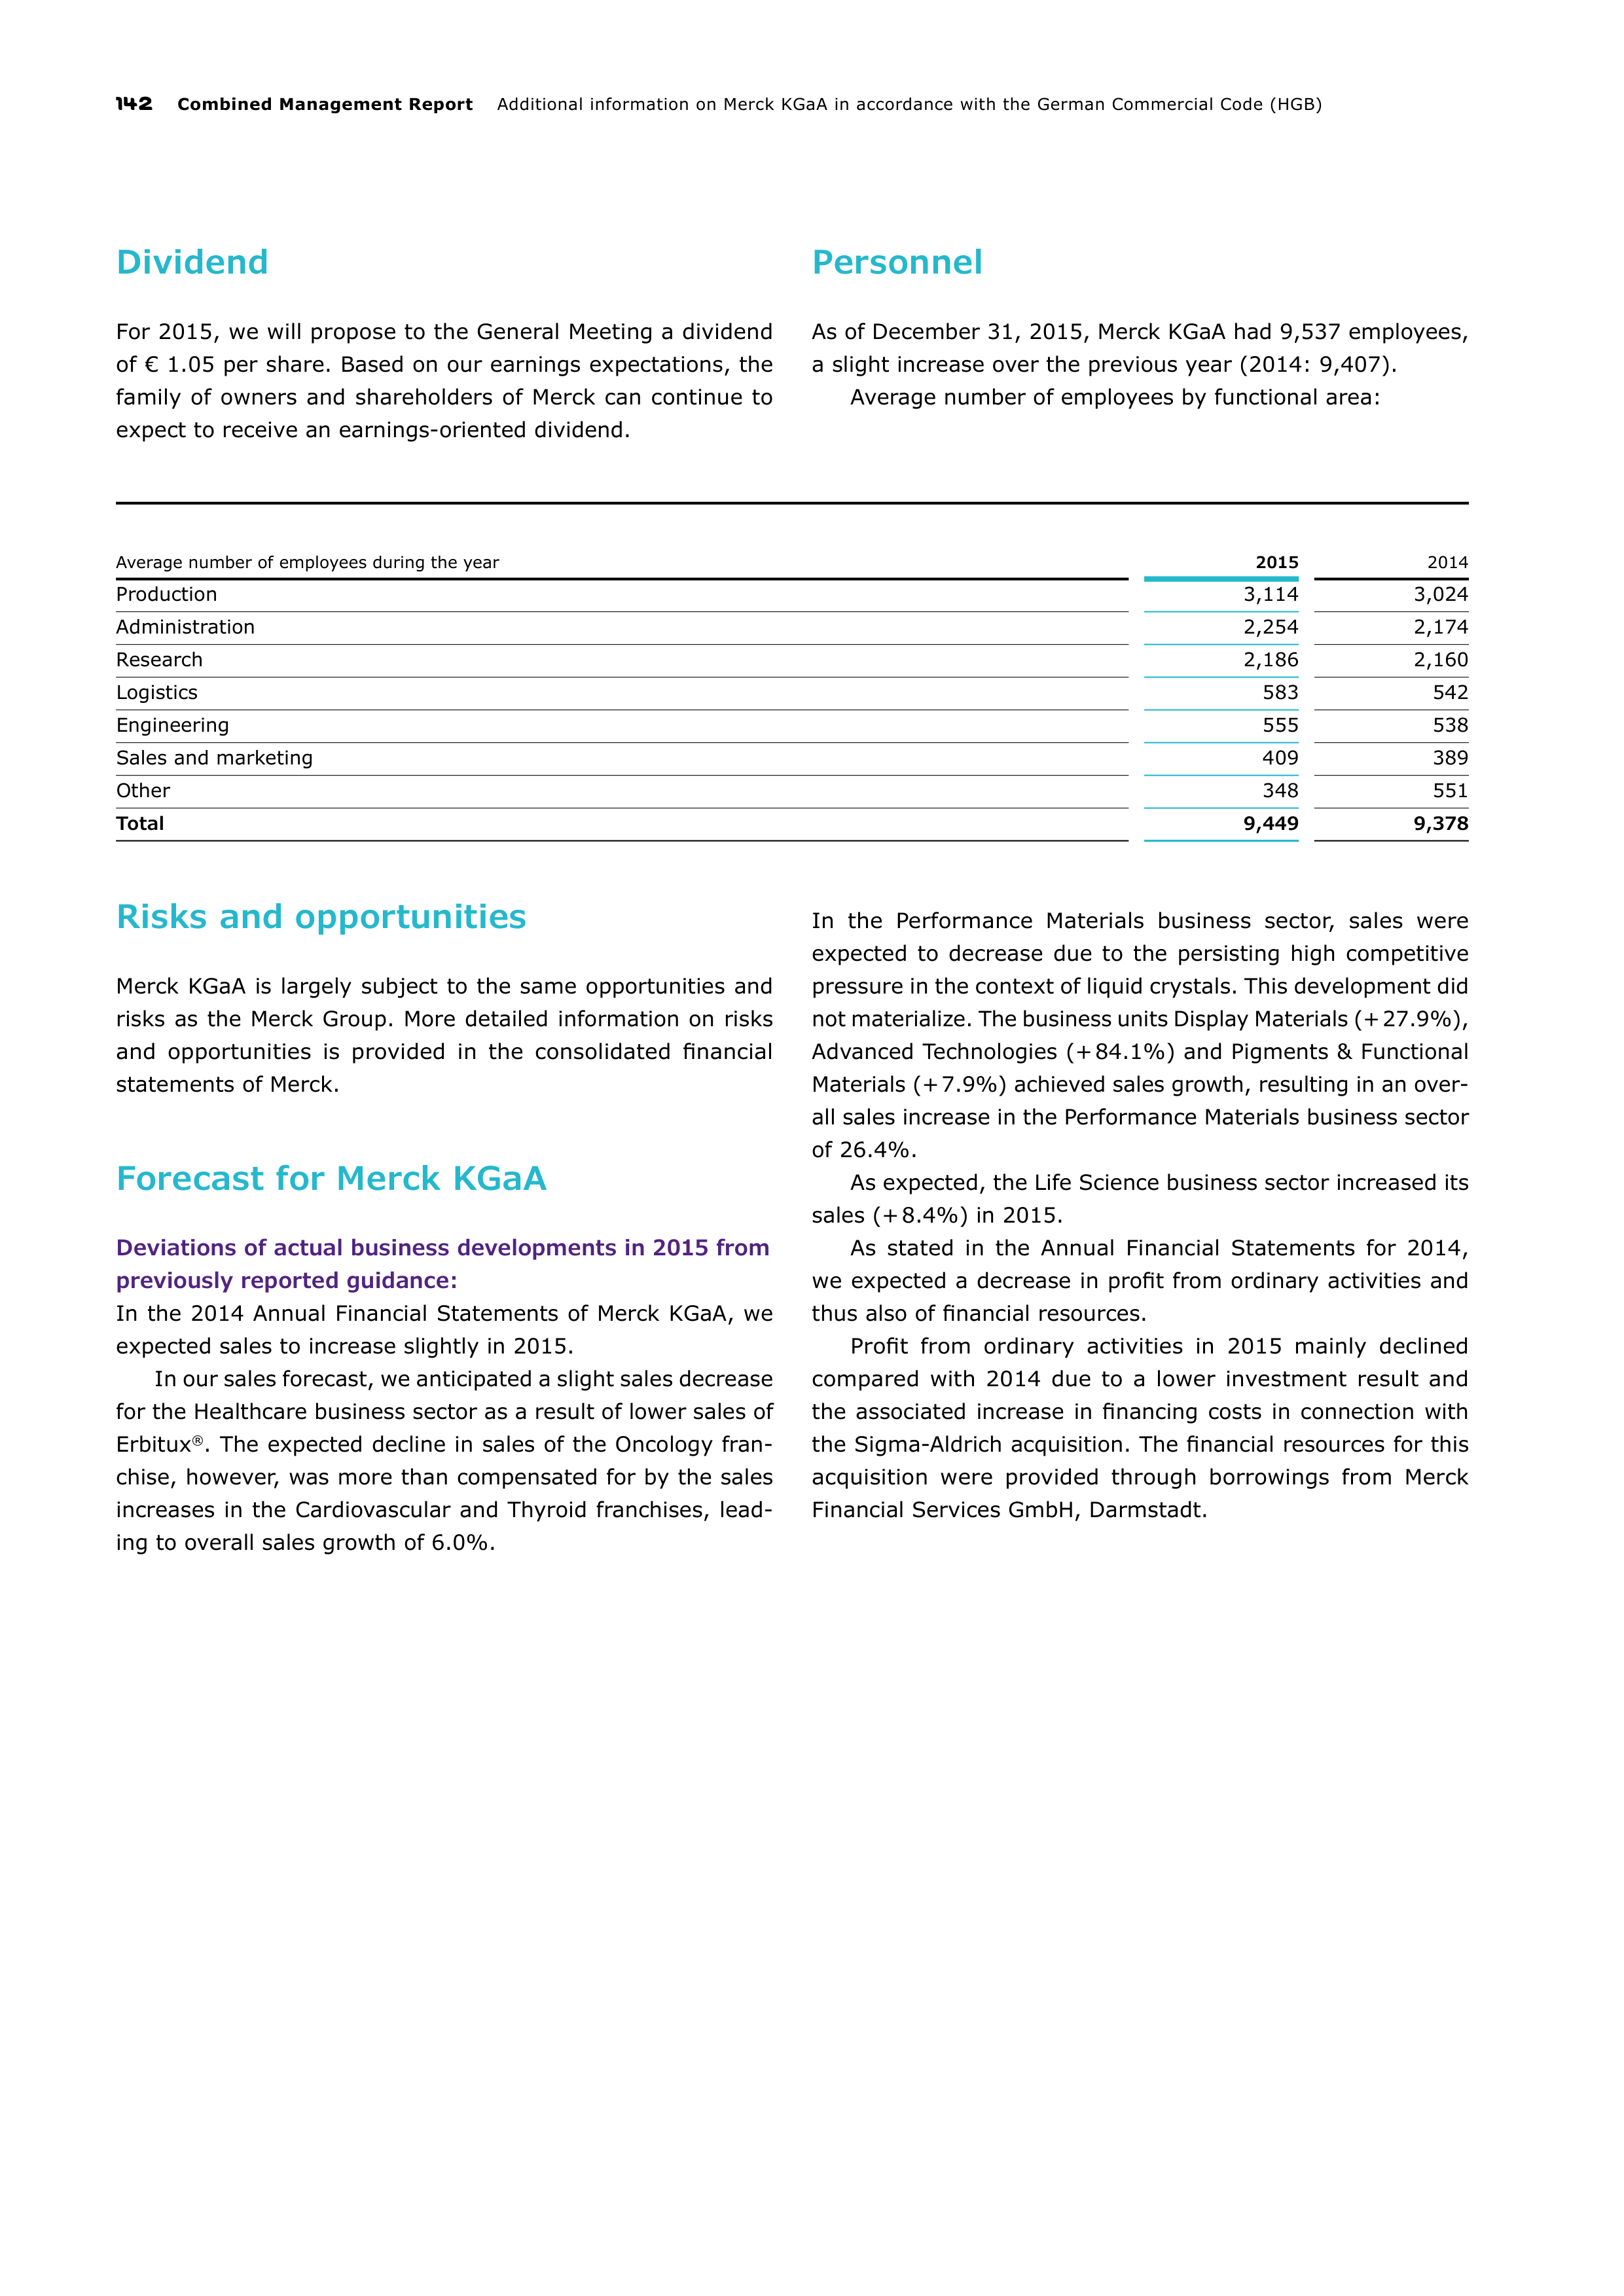
142
Combined Management Report
Additional information on Merck KGaA in accordance with the German Commercial Code (HGB)
Dividend
For 2015, we will propose to the General Meeting a dividend
of
€ 1.05 per share. Based on our earnings expectations, the
family of owners and shareholders of Merck can continue to
expect to receive an earnings-oriented dividend.
Personnel
As of December 31, 2015, Merck KGaA had 9,537 employees,
a slight increase over the previous year (2014: 9,407).
Average number of employees by functional area:
Average number of employees during the year
2015
2014
Production
3,114
3,024
Administration
2,254
2,174
Research
2,186
2,160
Logistics
583
542
Engineering
555
538
Sales and marketing
409
389
Other
348
551
Total
9,449
9,378
Risks and opportunities
Merck KGaA is largely subject to the same opportunities and
risks as the Merck Group. More detailed information on risks
and opportunities is provided in the consolidated financial
statements of Merck.
Forecast for Merck KGaA
Deviations of actual business developments in 2015 from
previously reported guidance:
In the 2014 Annual Financial Statements of Merck KGaA, we
expected sales to increase slightly in 2015.
In our sales forecast, we anticipated a slight sales decrease
for the Healthcare business sector as a result of lower sales of
Erbitux
®
. The expected decline in sales of the Oncology fran
chise, however, was more than compensated for by the sales
increases in the Cardiovascular and Thyroid franchises, lead
ing to overall sales growth of 6.0%.
In the Performance Materials business sector, sales were
expected to decrease due to the persisting high competitive
pressure in the context of liquid crystals. This development did
not materialize. The business units Display Materials (+ 27.9%),
Advanced Technologies (+ 84.1%) and Pigments & Functional
Materials (+ 7.9%) achieved sales growth, resulting in an over
all
sales increase in the Performance Materials business sector
of 26.4%.
As expected, the Life Science business sector increased its
sales (+ 8.4%) in 2015.
As stated in the Annual Financial Statements for 2014,
we
expected a decrease in profit from ordinary activities and
thus also of financial resources.
Profit from ordinary activities in 2015 mainly declined
compared with 2014 due to a lower investment result and
the associated increase in financing costs in connection with
the Sigma-Aldrich acquisition. The financial resources for this
acquisition were provided through borrowings from Merck
Financial Services GmbH, Darmstadt.
Additional information on Merck KGaA in accordance with the German Commercial Code (HGB)
Combined Management Report
143
Forecast for 2016
A slight decline in sales is assumed for 2016 for the Healthcare
and Performance Materials business sectors. This decline is
expected to be nearly fully offset by sales growth in the Life
Science business sector.
The financing costs of the Sigma-Aldrich acquisition will
have a negative impact on earnings. Accordingly, we expect
net income to decline. Net income will also be influenced
sig
nificantly by investment results and dividend payments of
subsidiaries. The provision of a sufficient amount of financial
resources is ensured by Merck Financial Services GmbH.
Currently no risks can be identified that could jeopardize
the continued existence of Merck KGaA.
The internal control system for the
accounting process according to
section 289 (5)
HGB
The annual financial statements of Merck KGaA are prepared
by Merck Accounting Solutions & Services Europe GmbH,
Darmstadt, an independent legal entity within the Merck Group.
The financial statement process of Merck KGaA is based on the
accounting provisions of the German Commercial Code with
due consideration of key processes and uniform deadlines.
The objective of the internal control system for accounting is
to implement controls that will provide the security needed to
ensure that financial statements are prepared in compliance
with the relevant accounting laws and standards. It covers
measures designed to ensure the complete, correct and timely
conveyance and presentation of information that is relevant
for the preparation of the financial statements. The financial
reporting processes are monitored via a stringent internal
control system that ensures the accuracy of financial reporting
as well as compliance with the relevant legal regulations.
The main rules and tools used are as follows:
•
Accounting guidelines based on Group-wide guidelines.
These Group-wide accounting guidelines are the responsi
bility of Group Accounting and are available to all employees
of the relevant units via the Merck intranet. Detailed account
allocation instructions are provided here for all major trans
actions. These guidelines include, for example, clear require
ments for the inventory valuation process and transfer pric
ing within intragroup supply relationships.
•
Clearly defined segregation of tasks and assignment of
responsibilities to the units involved in the financial report
ing process. Through corresponding organizational measures,
the company ensures that in the accounting system duties
are segregated between the booking of transactions and
the review and approval of transactions. These measures
include the power of disposition approved by the Executive
Board in relation to authorizing contracts and credit notes,
as well as consistently implementing a dual-control principle.
•
Involvement of external experts as needed, for example for
the valuation of pension obligations
•
Use of suitable, largely uniform IT finance systems and the
application of detailed authorization concepts to limit user
rights on a need-to-have basis, taking into account principles
concerning the segregation of duties.
•
System-based IT controls as well as manual, process-inte
grated controls, particularly within the scope of the financial
reporting process
•
Consideration of risks recorded and assessed by the risk
management system in the annual financial statements
insofar as this is required by existing accounting rules.
The management of the respective department is responsible
for the implementation of these rules and utilization of the
tools.
The annual financial statements of Merck are the respon
si
bility of the Chief Financial Officer, who is a member of the
Executive Board of Merck KGaA. This responsibility is laid down
in the rules of procedure of the Executive Board.
All the structures and processes described are subject to
constant review by Group Internal Auditing. The Executive
Board determines the structures and processes that are to be
audited in an annual audit plan.
The results of these audits are dealt with regularly in
meetings of the Executive Board, the Supervisory Board and
the Finance Committee of E. Merck KG.
144
Combined Management Report
Subsequent Events
SUBSEQUENT EVENTS
At the beginning of January 2016, two contracts entered into
with BioMarin Pharmaceutical Inc.,
USA
(BioMarin), became
effective. Firstly,
the sale of the rights to Kuvan
®
, a drug used
to treat the metabolic disorder known as phenylketonuria
(
PKU
)
, was agreed. And secondly, Merck returned its option
to
develop and commercialize Peg-Pal to BioMarin. Based on
these two agreements, in January 2016 Merck received an
upfront payment of € 340 million for the sale of the rights to
Kuvan
®
as well as an entitlement to milestone payments of up
to
€ 185 million. The financial statements of Merck KGaA pre
pared in accordance with the German Commercial Code are
only affected by this via future dividend payments from sub
sidiaries.
More information can be found in Note [4] ‟Acquisi
tions, assets held for sale and disposal groups” in the Notes to
the Group accounts.
Subsequent to the balance sheet date, no further events of
special importance occurred that could have a material impact
on the net assets, financial position or results of operations.
03
Corporate
Governance
Pages 145 – 168

147
Capital structure and governance bodies of Merck KGaA
148
Statement on Corporate Governance
164
Report of the Supervisory Board
166
Objectives of the Supervisory Board with respect to its composition
Corporate
Governance
Pages 145 – 168
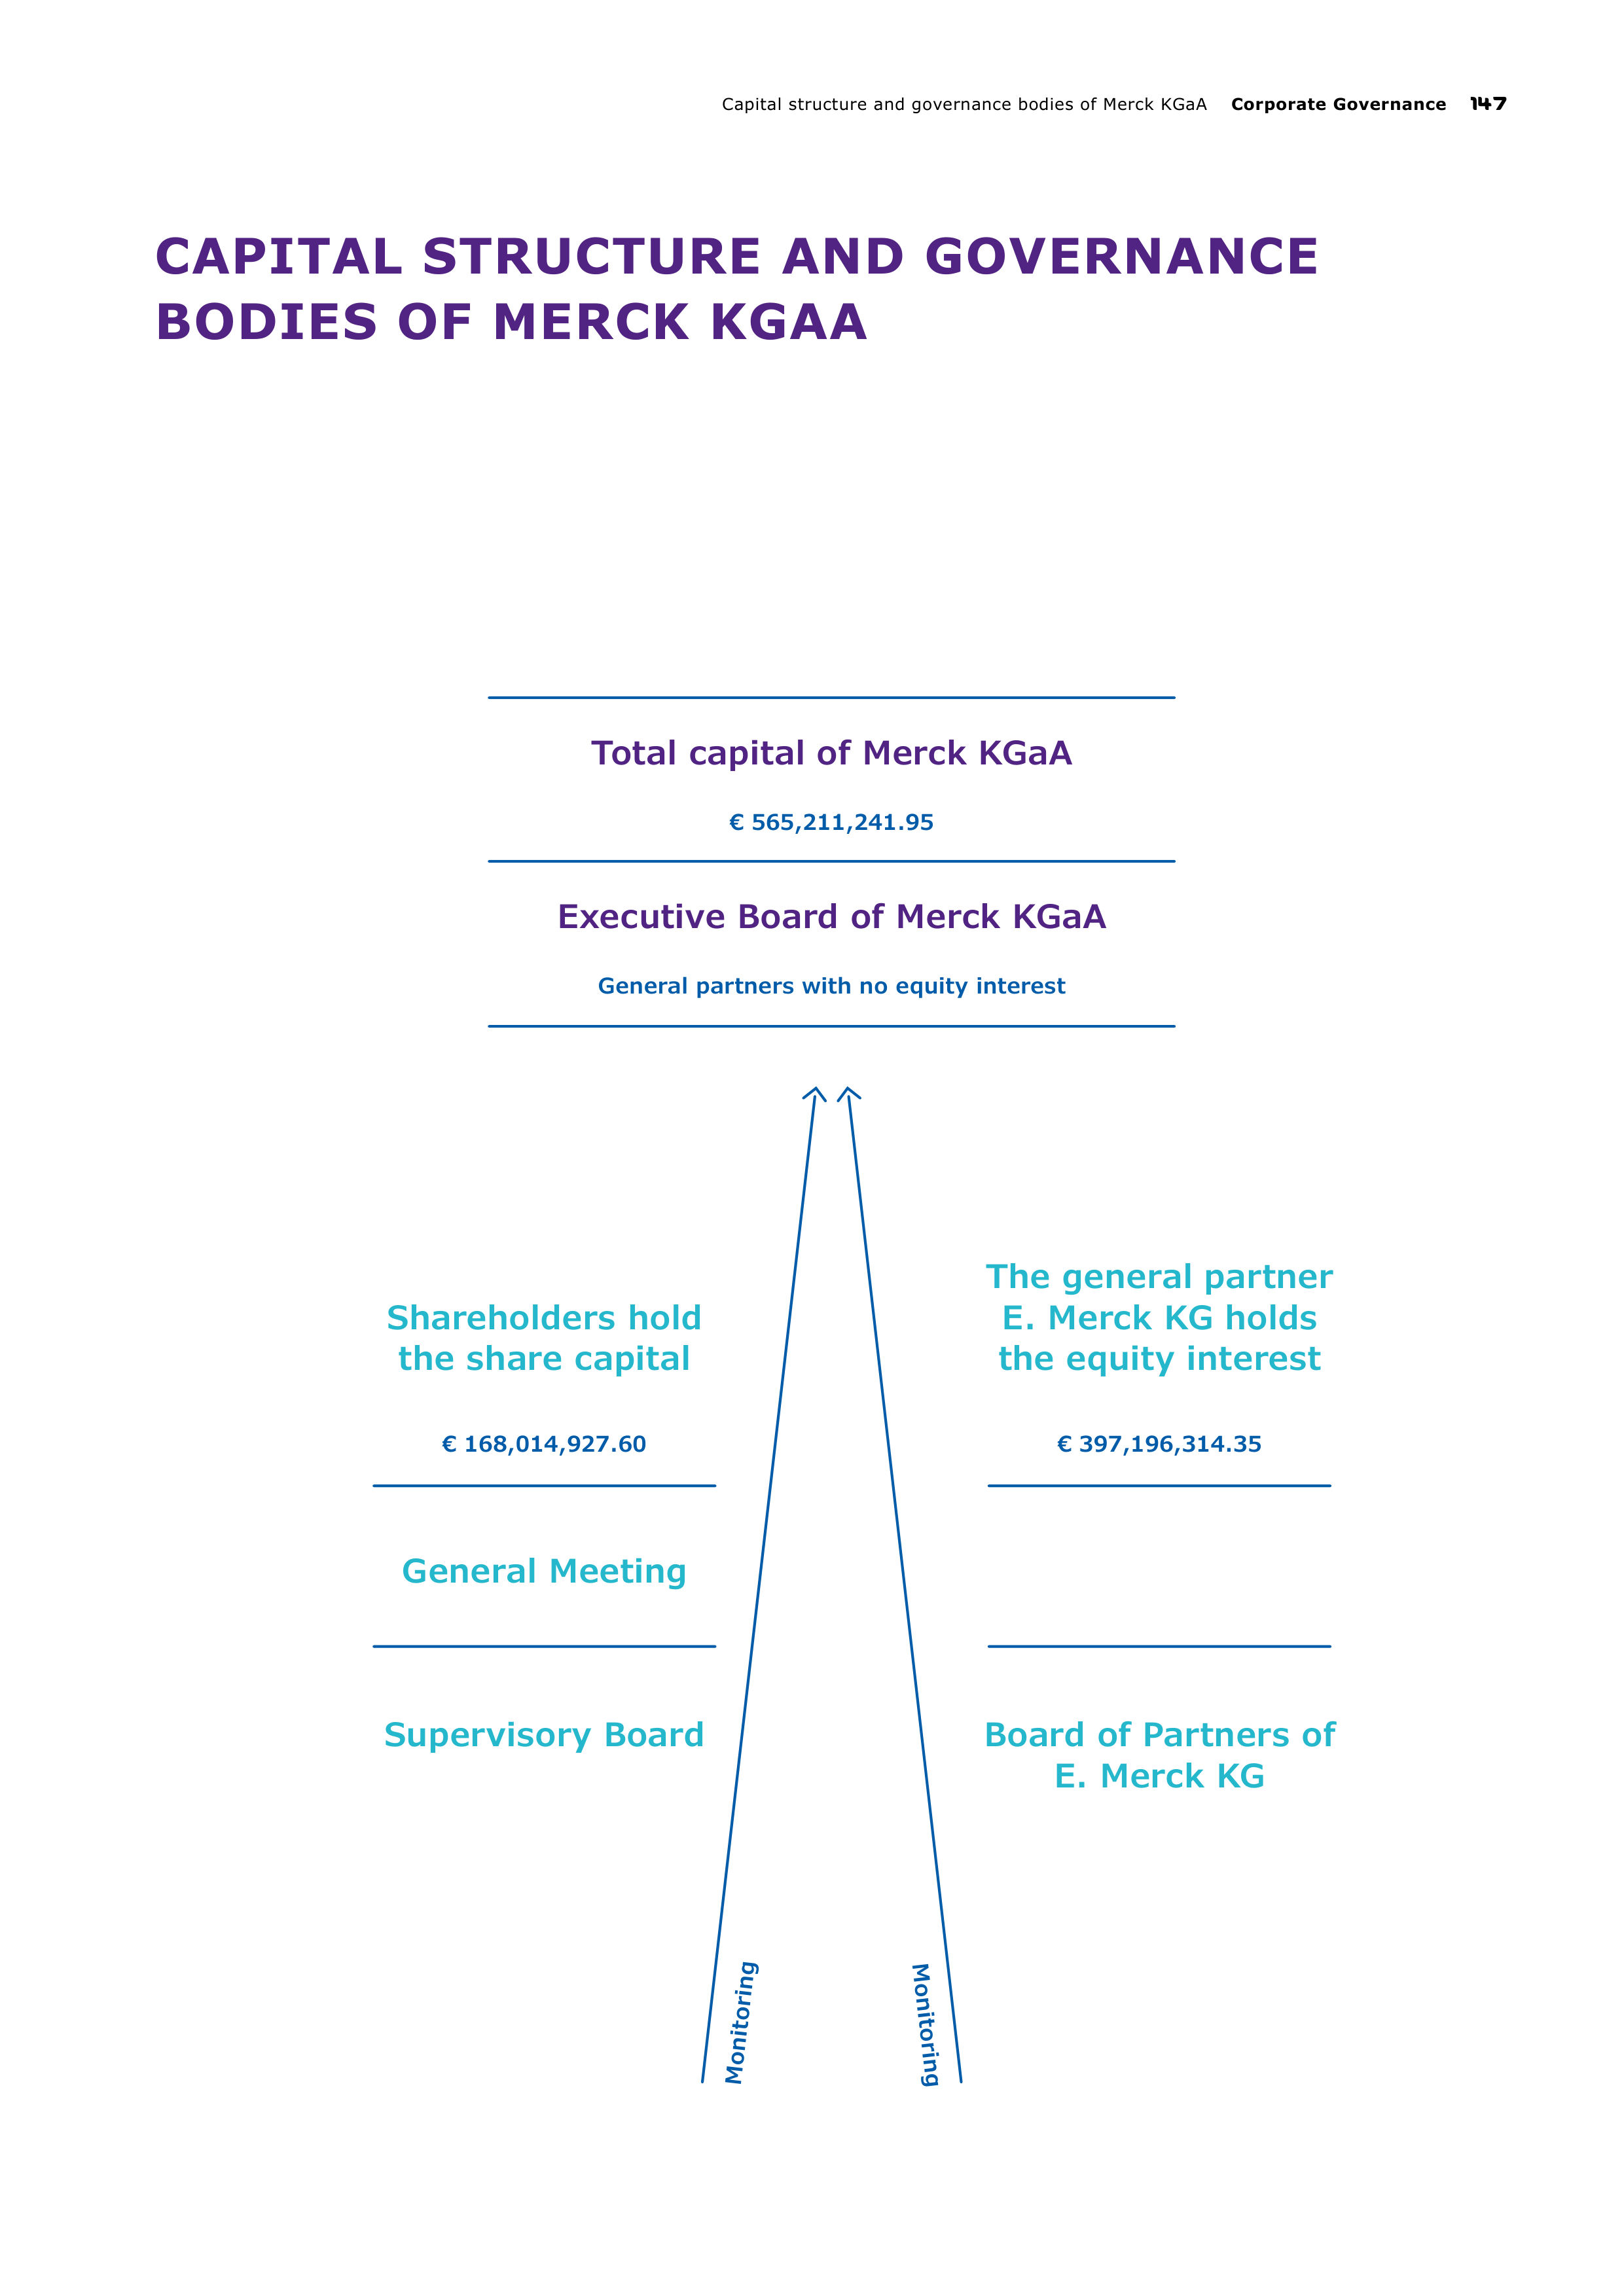
Supervisory Board
Board of Partners of
E. Merck KG
Total capital of Merck KGaA
€ 565,211,241.95
Executive Board of Merck KGaA
General partners with no equity interest
Monitoring
Monitoring
Shareholders hold
the share capital
€ 168,014,927.60
The general partner
E. Merck KG holds
the equity interest
€ 397,196,314.35
General Meeting
Capital structure and governance bodies of Merck KGaA
Corporate Governance
147
CAPITAL STRUCTURE AND GOVERNANCE
BODIES OF MERCK KGAA
148
Corporate Governance
Statement on Corporate Governance
STATEMENT ON CORPORATE GOVERNANCE
The Statement on Corporate Governance contains the
Statement of Compliance, relevant information on prac-
tices within the company as well as a description of the
procedures of the corporate bodies.
Joint report of the Executive Board
and the Supervisory Board according
to section 3.10 of the German
Corporate Governance Code including
Statement of Compliance
The German Corporate Governance Code is geared toward
the conditions found in a German stock corporation (‟Aktien
gesellschaft” or ‟AG”) and does not take into consideration
the
special characteristics of a corporation with general part
ners (‟Kommanditgesellschaft auf Aktien” or ‟KGaA”) such as
Merck KGaA. Given the structural differences between an AG
and a KGaA, several recommendations of the German Corporate
Governance Code are to be applied to a KGaA only in a modified
form. Major differences between the two legal forms exist in
terms of liability and management. While, in the case of an AG,
only the AG is liable as a legal entity, the general partners of a
KGaA also have unlimited personal liability for the company’s
obligations (section 278 (1) of the German Stock Corporation
Act – ‟AktG”). At Merck KGaA, this pertains to both E. Merck KG –
which pursuant to Art. 8 (5) of the Articles of Association is
excluded from management and representation – as well as to
the managing general partners, who together make up the
Executive Board of Merck KGaA. The members of the Execu
tive Board of Merck KGaA are therefore subject to unlimited
personal liability. Unlike an AG, their executive authority is not
conferred by the Supervisory Board, but rather by their status
as general partners.
Consequently, in addition to other responsibilities typical
of
the supervisory board of an AG (see description of the pro
cedures of the Supervisory Board on page 159 et seq.), the
supervisory board of a KGaA does not have the authority to
appoint the management board, draw up management board
contracts or specify compensation of the management board.
This legal form also involves special features with regard to
the General Meeting. For example, in a KGaA, many of the
resolutions made require the consent of the general partners
(section 285 (2) AktG), including in particular the adoption of
the annual financial statements (section 286 (1) AktG).
Merck KGaA applies the Code analogously where these regula
tions are compatible with the legal form of a KGaA. In order to
enable shareholders to compare the situation at other compa
nies more easily, to a broad extent we base corporate govern
ance on the conduct recommendations made by the Govern
ment Commission of the German Corporate Governance Code
and forego having our own, equally permissible, code. The
recommendations of the Code in both of the last two versions
dated June 24, 2014 and May 5, 2015, the intent and meaning
of which are applied, were complied with in the period between
the last Statement of Compliance issued on February 27, 2015
with four exceptions. In the future, the recommendations of
the Code will again be adhered to with four exceptions. Further
details can be found on page 149.
For a clearer understanding, the following gives a general
explanation of the application of German company law at
Merck with additional references to the General Meeting and
shareholder rights.
Merck KGaA
The general partner E. Merck KG holds around 70% of the
total capital of Merck KGaA (equity interest); the shareholders
hold the remainder, which is divided into shares (share capital).
E. Merck KG is excluded from the management of business
activities. The general partners with no equity interest (Exec
utive Board) manage the business activities. Nevertheless,
due
to its substantial capital investment and unlimited personal
liability, E. Merck KG has a strong interest in the businesses
of Merck KGaA operating efficiently in compliance with pro
cedures, and exercises its influence accordingly. Merck KGaA’s
participation in the profit / loss of E. Merck KG in accordance
with Articles 26 et seq. of the Articles of Association further
harmonizes the interests of the shareholders and of E. Merck KG
.
E. Merck KG appoints and dismisses the Executive Board. In
addition, E. Merck KG has created bodies – complementing the
expertise and activities of the Supervisory Board – to monitor
and advise the Executive Board. This task applies primarily to
the Board of Partners of E. Merck KG. Based on the provisions
of the German Stock Corporation Act, the Articles of Associa
tion of Merck KGaA and the rules of procedure of the various
committees, Merck KGaA has a set of rules for the Executive
Board and its supervision that meet the requirements of the
Code. The investors, who bear the entrepreneurial risk, are
protected as provided for by the Code.
Statement on Corporate Governance
Corporate Governance
149
The General Meeting of Merck KGaA
The twentieth General Meeting of Merck KGaA was held on
April 17, 2015 in Frankfurt am Main, Germany. At 64.32%, the
proportion of share capital represented at the meeting was
slightly higher than in the previous year. In 2014, the propor
tion of share capital represented was 63.85%.
In particular, the Annual General Meeting passes resolutions
concerning the approval of the annual financial statements, the
appropriation of net retained profit, the approval of the actions
of the Executive Board members and the Supervisory Board
members, as well as the choice of the auditor. Changes to the
Articles of Association likewise require the adoption of a reso
lution by the General Meeting.
The shareholders of Merck KGaA exercise their rights at
the General Meeting. They may exercise their voting rights
personally, through an authorized representative or through a
proxy appointed by the company. The proxy is in attendance
throughout the duration of the General Meeting. All the docu
ments and information concerning upcoming General Meetings
(including a summary explanation of shareholder rights) are also
posted on our website. Moreover, the General Meeting is web
cast live on the Internet from its commencement until the end
of the speech by the Chairman of the Executive Board. The
introductory speeches by the Chairman of the Executive Board
and the Chairman of the Supervisory Board are recorded in
order to make them available to interested members of the
public at any time after the meeting. In this way, we are satis
fying
the high transparency requirements of the Merck Group.
Statement of Compliance
In accordance with section 161 AktG, applying the provisions
of the German Corporate Governance Code correspondingly,
the Executive Board and the Supervisory Board issued the
fol
lowing statement of compliance with the recommendations
of the Government Commission of the German Corporate
Gov
ernance Code:
‟Declaration of the Executive Board and the Supervisory
Board of Merck KGaA on the recommendations of the Govern
ment Commission of the German Corporate Governance Code
pursuant to section 161 AktG.
Since the last statement of compliance on February 27,
2015, the Merck Group has complied with the recommenda
tions of the Government Commission of the German Corporate
Governance Code in the versions dated June 24, 2014 and
May 5, 2015 published in the official section of the German
Federal Gazette during its period of validity with the following
exceptions:
Contrary to section 4.2.5 para 3 sentences 1 and 2 of the
German Corporate Governance Code, certain information on
the compensation of Executive Board members has not been
included, nor have the model tables provided for this purpose
been utilized. It seems doubtful as to whether the largely
repetitive provision of identical information in two additional
tables contributes to the transparency or the understandability
of the Compensation Report (see section 4.2.5 para 1 sen
tence 3 of the German Corporate Governance Code).
Contrary to section 5.3.2 of the German Corporate Gov
ernance Code, the Supervisory Board has not established an
audit committee. However, an audit committee does exist in
the form of the Finance Committee of the Board of Partners
of
E. Merck KG, which to a large extent exercises the duties
described in section 5.3.2 of the Code. Due to the relatively
limited authority of the supervisory board of a KGaA in com
parison with that of an AG, this therefore satisfies the require
ments of the German Corporate Governance Code.
Contrary to section 5.4.1 para 2 sentence 1 of the German
Corporate Governance Code, no age limit or regular limit on the
length of Supervisory Board membership is taken into account
when proposing candidates for election to the Supervisory
Board pursuant to the published objectives of the Supervisory
Board. The age and length of membership of Supervisory
Board members are not criteria for their qualifications and
competence. Moreover, we do not wish to forego the many
years of experience of Supervisory Board members. Crucial
to
the successful work of the Supervisory Board is a good bal
ance among Supervisory Board members in terms of age and
length of membership.
Contrary to section 7.1.2 sentence 4 of the German Corpo
rate Governance Code, owing to the way in which the German
legal holidays fall, the interim report for the first quarter was
only made publicly accessible slightly after the allotted 45-day
time limit from the end of the reporting period. In fiscal 2016,
the allotted 45-day time limit for publication of the interim
report for the first quarter will also be slightly exceeded again
for the same reason.
In view of future compliance with the current recommen
dations of the Government Commission of the German Corpo
rate Governance Code, the Executive Board and the Super
visory Board declare the following: With the exception of
the aforementioned deviations from section 4.2.5 para 3
sentences 1 and 2 (disclosure of compensation), section 5.3.2
(audit committee), section 5.4.1 para 2 sentence 1 (age limit,
regular limit on length of membership), and section 7.1.2 sen
tence 4 (publication deadline), the company will comply with
the recommendations of the Code in the version dated May 5,
2015.”
Darmstadt, March 4, 2016
For the Executive Board
For the Supervisory Board
s. Karl-Ludwig Kley
s. Wolfgang Büchele
150
Corporate Governance
Statement on Corporate Governance
Compensation report
(The Compensation Report is part of the audited Notes to the
Group accounts).
Compensation of members of the Executive Board of
Merck KGaA
Unlike management board members of German stock corpora
tions, the members of the Executive Board of Merck KGaA are
not employed officers of the company. Rather, they are per
sonally liable general partners of both Merck KGaA and the
general partner E. Merck KG, and in this capacity they receive
profit-based compensation from E. Merck KG. Given this con
text, the stipulations of the German Corporate Governance
Code concerning the compensation of management board
members of publicly listed German stock corporations as well
as the individual disclosure thereof do not apply to the Execu
tive Board members of Merck KGaA. Nevertheless, Merck KGaA
has decided to disclose the individual compensation of each
Executive Board member in the following report.
Unlike publicly listed German stock corporations, at
Merck KGaA it is not the Supervisory Board, but the Board
of
Partners of E. Merck KG that decides on the amount and
composition of compensation. E. Merck KG has transferred the
execution of this right to its Personnel Committee. Among
other things, the Personnel Committee is responsible for the
following decisions: contents of contracts with Executive Board
members, granting of loans and advance salary payments,
approval for taking on honorary offices, board positions and
other sideline activities, as well as the division of responsibili
ties within the Executive Board of Merck KGaA. The compen
sation system defined by the Personnel Committee for Execu
tive Board members takes into account various aspects
relevant to compensation, including the responsibilities and
duties of the individual Executive Board members and their
status as personally liable partners, their individual perform
ance, the economic situation, performance and prospects of
the company as well as normal compensation levels (by way
of peer comparison) and the rewards structure otherwise in
place in the company. The relationship between Executive
Board compensation and the compensation of top manage
ment and the workforce as a whole is also taken into account,
also in a multiyear assessment. The Personnel Committee reg
ularly commissions an independent compensation consultant
to review the appropriateness of the compensation.
Features of the compensation system
The compensation paid to the Executive Board members of
Merck KGaA in fiscal 2015 comprises fixed components, vari
able compensation components and additions to pension pro
visions. Benefits in kind and other benefits are additionally
granted.
Fixed compensation
Fixed compensation is paid in the form of 12 equivalent
monthly installments. The table on page 152 provides an
overview of the amount of the fixed compensation paid in
2014 and 2015.
Variable compensation
Variable compensation is based on the three-year rolling aver
age of profit after tax of the E. Merck Group. The Personnel
Committee of E. Merck KG decides at its own and equitable
discretion whether to consider exceptional factors of particular
importance. From the net income determined in this manner,
the members of the Executive Board receive individually fixed
per mille rates based on the net income of the E. Merck Group.
Additionally, in exceptional cases the Personnel Committee
of E. Merck KG, which is responsible for the compensation of
the Executive Board, may grant one-time payments volun
tar
ily and at its own discretion.
Additional variable compensation (Merck Long-Term
Incentive Plan)
In 2012, a long-term variable compensation component known
as the Merck Long-Term Incentive Plan was added to the vari
able compensation of the members of the Executive Board.
It aims to enhance the sustainability of the compensation sys
tem and to align it not only with target achievement based on
key performance indicators, but above all with a sustainable
performance of Merck shares.
Subject to the resolution of the Personnel Committee each
year, under the Merck Long-Term Incentive Plan the members
of the Executive Board could be eligible to receive a certain
number of virtual shares – Merck Share Units (
MSU
s) – at the
end of a three-year performance cycle. The number of
MSU
s
that could be received depends on the total value defined for
the respective person and the average closing price of Merck
shares in Xetra
®
trading during the last 60 trading days prior
to January 1 of the respective fiscal year (reference price).
In
order to participate in the Plan, members of the Executive
Board must personally own an investment in Merck shares
equivalent to 10% of their respective fixed annual compensa
tion, taking into account the equity interest held in E. Merck KG
as a personally liable general partner. It is not permitted to sell
these shares during the performance cycle. After termination
of the three-year performance cycle, the number of
MSU
s to
be granted then is determined based on the development of
two key performance indicators (
KPI
s). These are:
a) the performance of the Merck share price compared to the
DAX
®
with a weighting of 70%, and
b) the development of the
EBITDA
pre margin during the per
formance cycle as a proportion of a defined target value
with a weighting of 30%.
Depending on the development of the
KPI
s, at the end of the
respective performance cycle the members of the Executive
Board are granted between 0% and 150% of the
MSU
s they
could be eligible to receive.
Based on the number of
MSU
s
granted, the members of
the Executive Board receive a cash payment at a defined point
in time in the year following the expiration of the three-year
performance cycle. The value of an
MSU
corresponds to the
average closing price of Merck shares in Xetra
®
trading during
the last 60 trading days prior to January 1 after the perform
ance cycle. The payment amount is limited to three times the
reference price. The members of the Executive Board invest
50% of the payment amount in Merck shares. One-third of
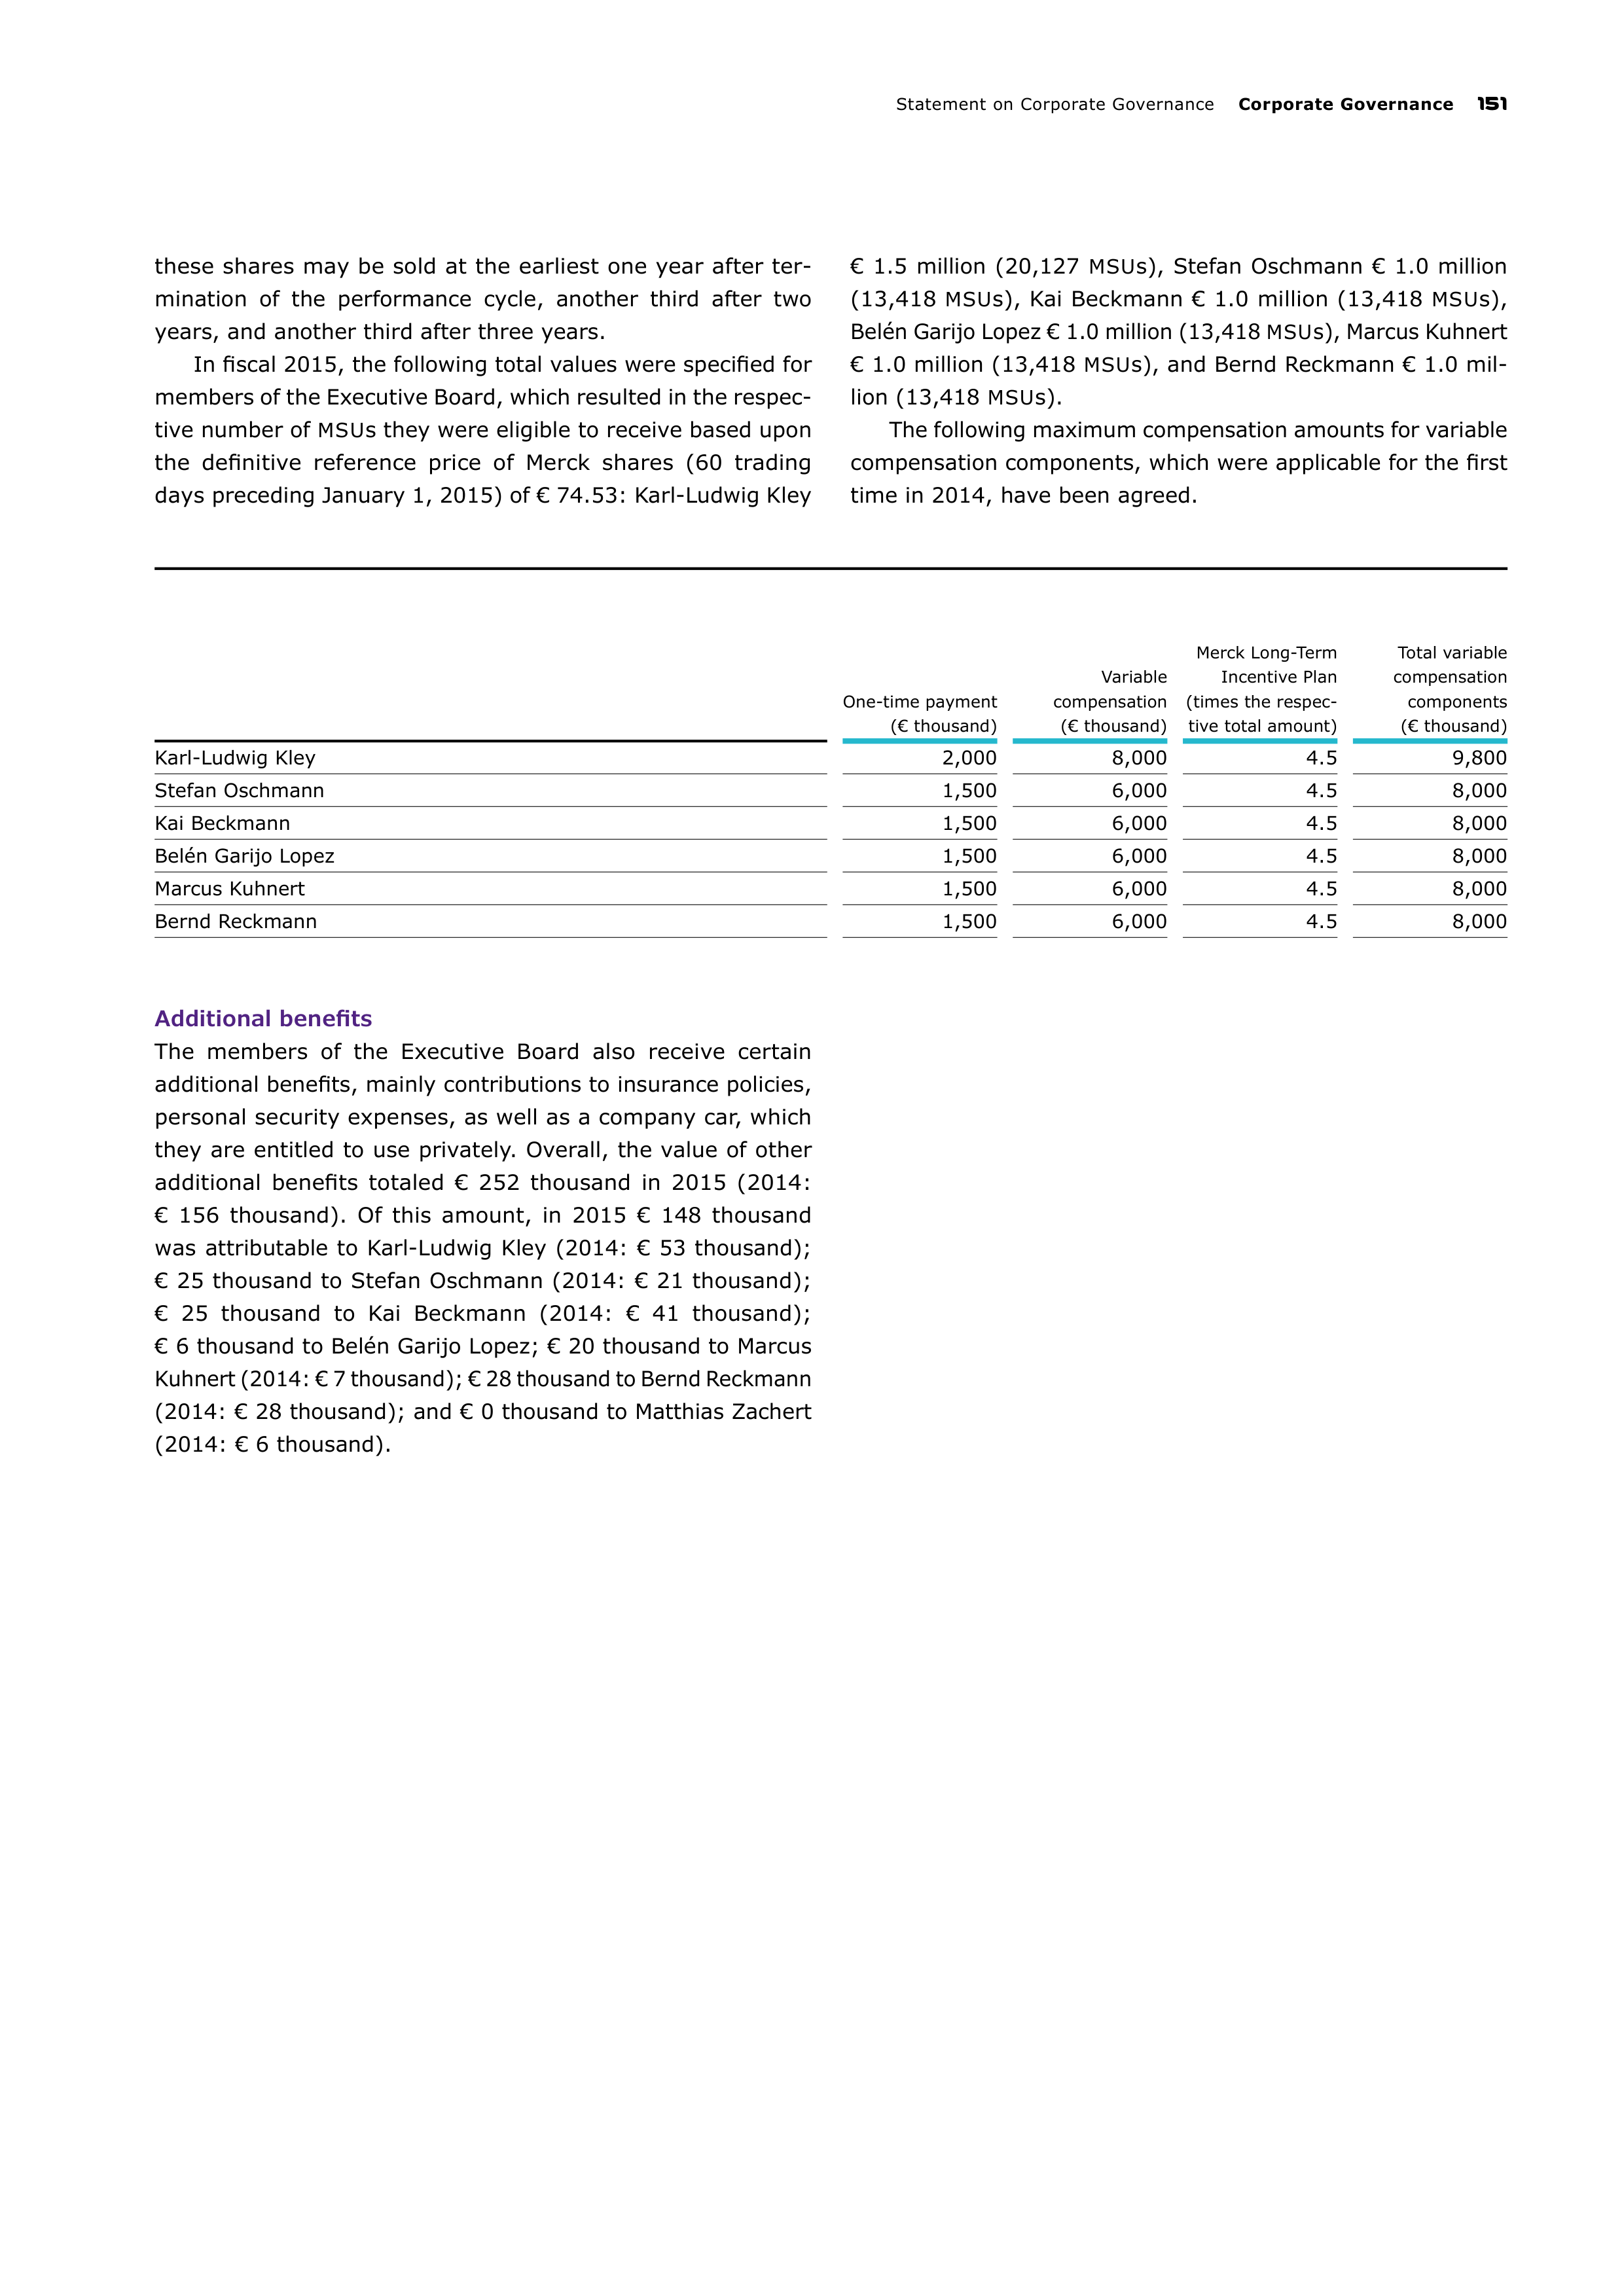
Statement on Corporate Governance
Corporate Governance
151
these shares may be sold at the earliest one year after
ter
mination of the performance cycle, another third after two
years, and another third after three years.
In fiscal 2015, the following total values were specified for
members of the Executive Board, which resulted in the respec
tive number of
MSU
s they were eligible to receive based upon
the definitive reference price of Merck shares (60 trading
days
preceding January 1, 2015) of € 74.53: Karl-Ludwig Kley
€ 1.5 million (20,127
MSU
s), Stefan Oschmann € 1.0 million
(13,418
MSU
s
), Kai Beckmann € 1.0 million (13,418
MSU
s
),
Belén Garijo Lopez € 1.0 million (13,418
MSU
s), Marcus
Kuhnert
€ 1.0 million (13,418
MSU
s), and Bernd Reckmann € 1.0 mil
lion (13,418
MSU
s).
The following maximum compensation amounts for variable
compensation components, which were applicable for the first
time in 2014, have been agreed.
One-time payment
(€ thousand)
Variable
compensation
(€ thousand)
Merck Long-Term
Incentive Plan
(times the respec
tive total amount)
Total variable
compensation
components
(€ thousand)
Karl-Ludwig Kley
2,000
8,000
4.5
9,800
Stefan Oschmann
1,500
6,000
4.5
8,000
Kai Beckmann
1,500
6,000
4.5
8,000
Belén Garijo Lopez
1,500
6,000
4.5
8,000
Marcus Kuhnert
1,500
6,000
4.5
8,000
Bernd Reckmann
1,500
6,000
4.5
8,000
Additional benefits
The members of the Executive Board also receive certain
addi
tional benefits, mainly contributions to insurance policies,
personal security expenses, as well as a company car, which
they are entitled to use privately. Overall, the value of other
additional benefits totaled € 252 thousand in 2015 (2014:
€ 156 thousand). Of this amount, in 2015 € 148 thousand
was
attributable to Karl-Ludwig Kley (2014: € 53 thousand);
€ 25 thousand to Stefan Oschmann (2014: € 21 thousand);
€ 25 thousand to Kai Beckmann (2014: € 41 thousand);
€ 6 thousand to Belén Garijo Lopez; € 20 thousand to Marcus
Kuhnert (2014: € 7 thousand); € 28 thousand to Bernd Reckmann
(2014: € 28 thousand); and € 0 thousand to Matthias Zachert
(2014: € 6 thousand).
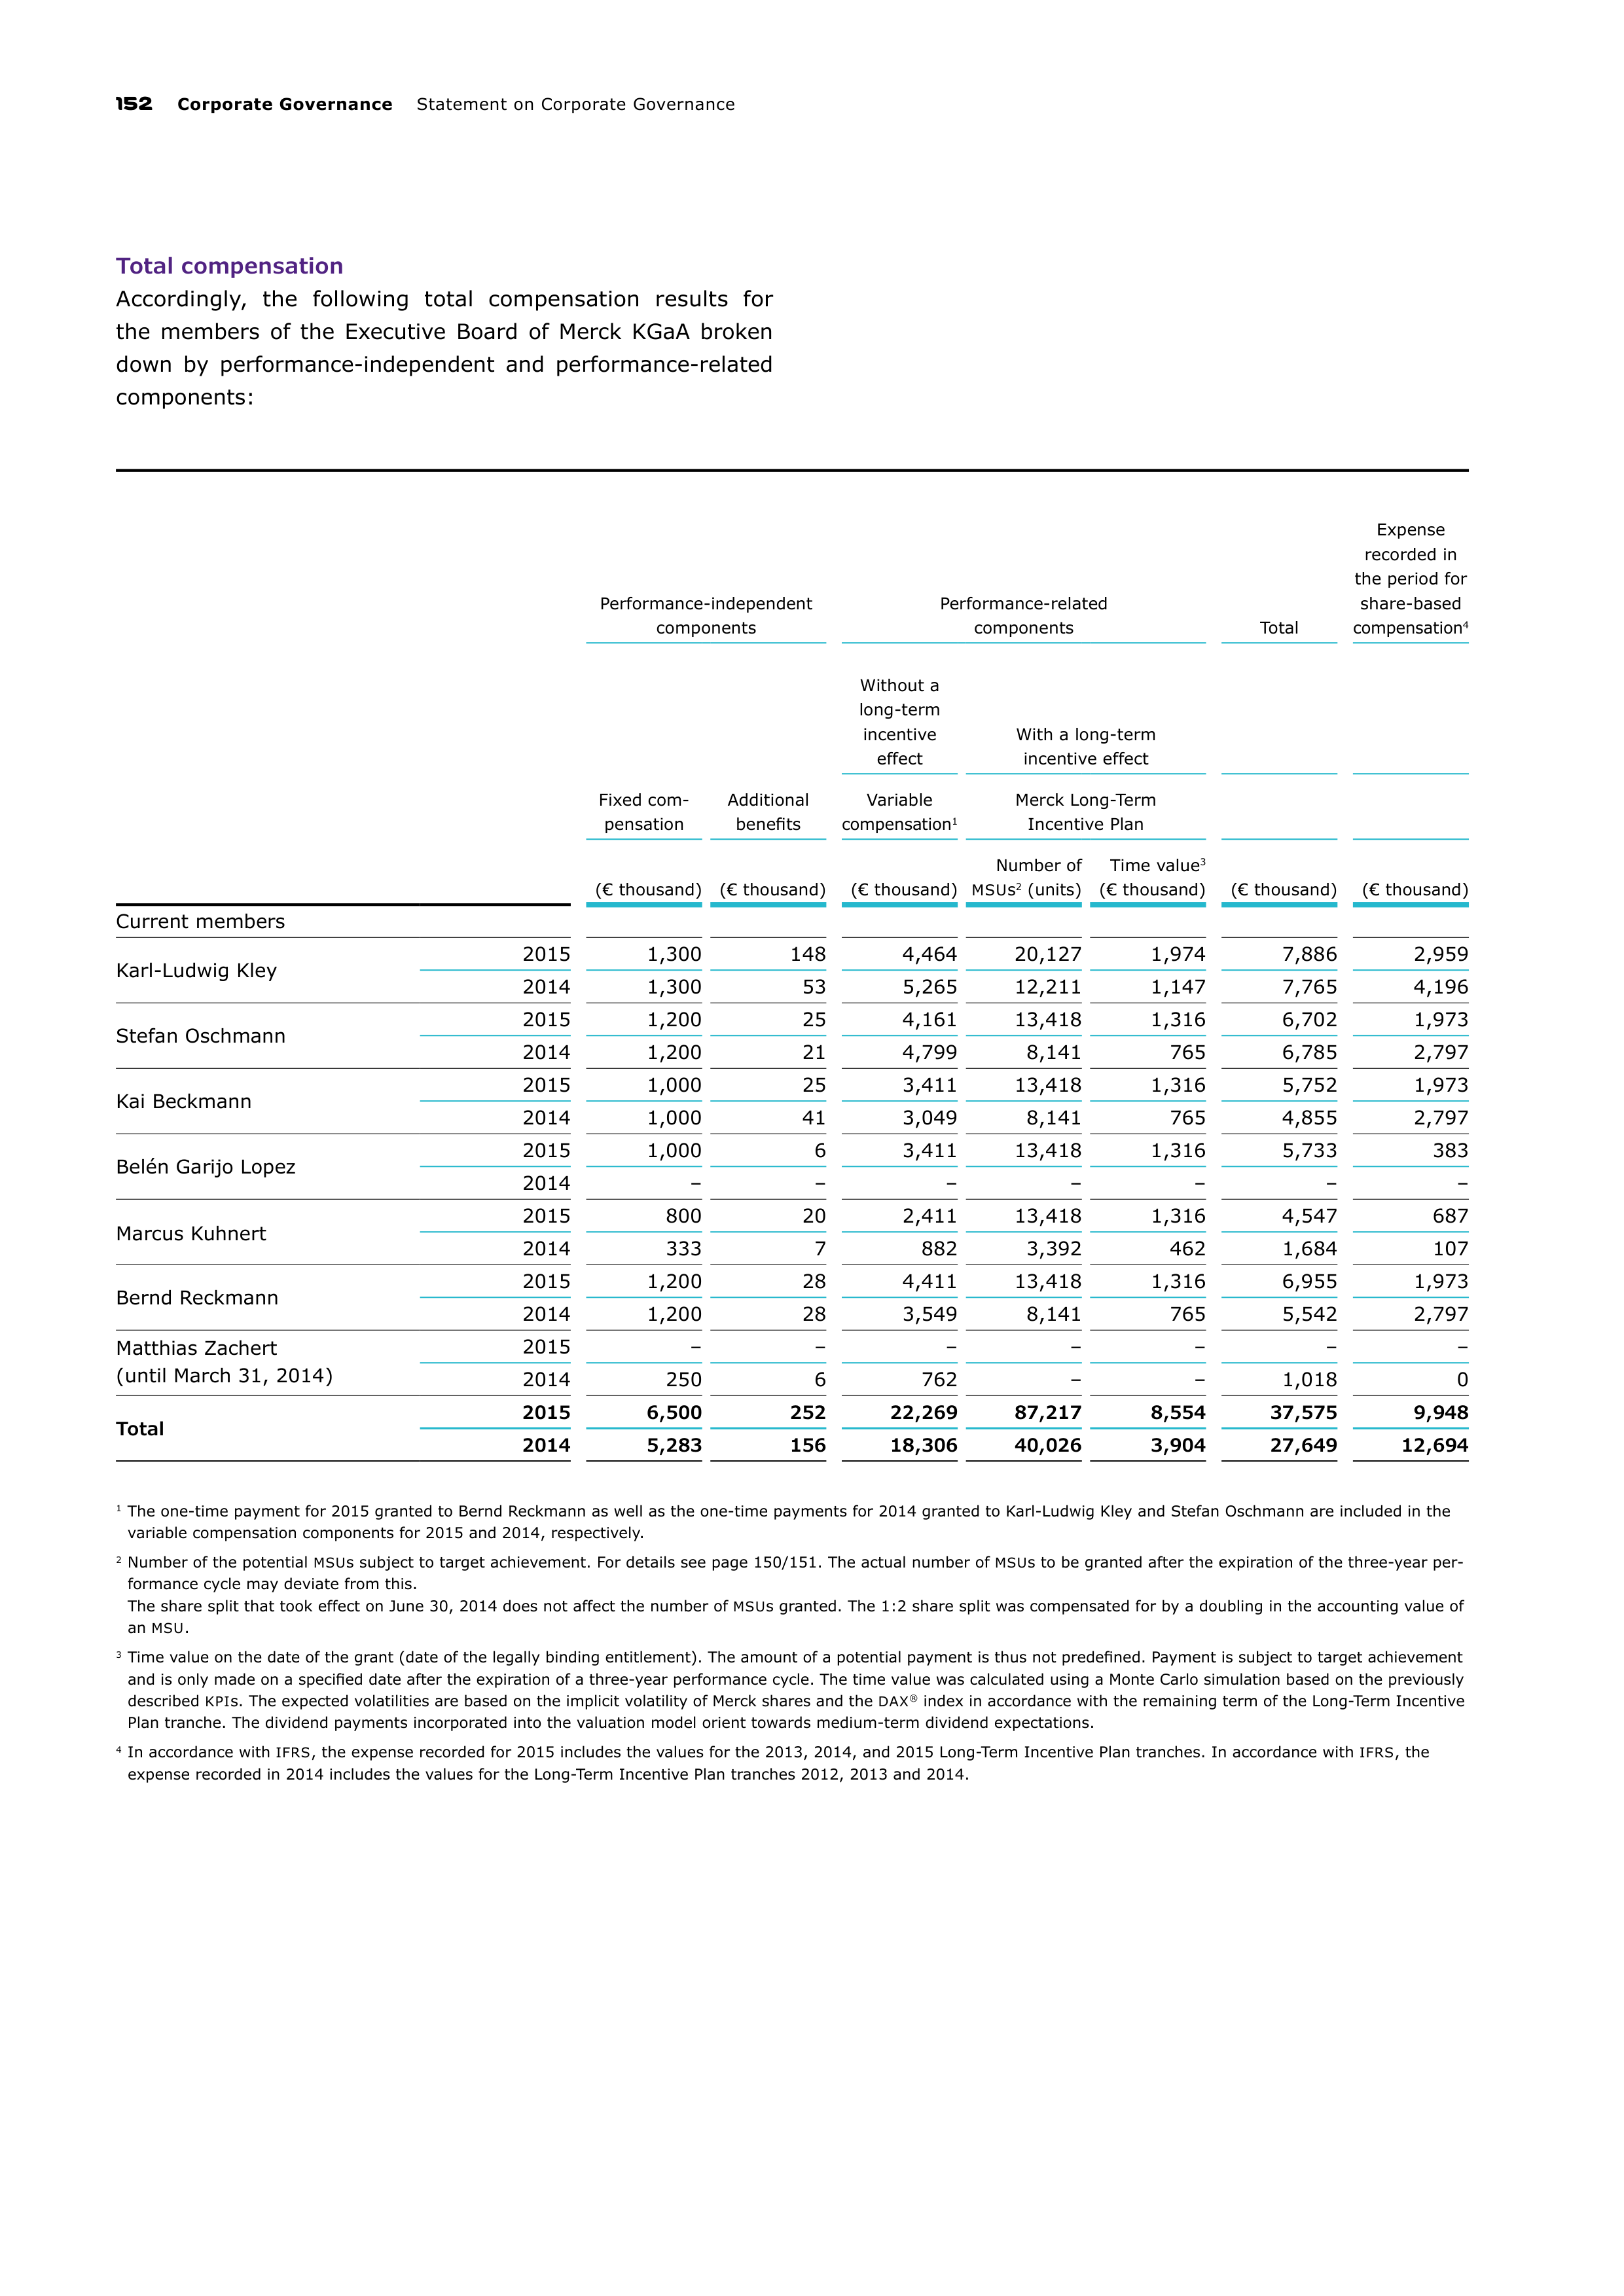
152
Corporate Governance
Statement on Corporate Governance
Total compensation
Accordingly, the following total compensation results for
the members of the Executive Board of Merck KGaA broken
down by performance-independent and performance-related
com
ponents:
Performance-independent
components
Performance-related
components
Total
Expense
recorded in
the period for
share-based
compensation
4
Without a
long-term
incentive
effect
With a long-term
incentive effect
Fixed com
pensation
Additional
benefits
Variable
compensation
1
Merck Long-Term
Incentive Plan
(€ thousand)
(€ thousand)
(€ thousand)
Number of
MSU
s
2
(units)
Time value
3
(€ thousand)
(€ thousand)
(€ thousand)
Current members
Karl-Ludwig Kley
2015
1,300
148
4,464
20,127
1,974
7,886
2,959
2014
1,300
53
5,265
12,211
1,147
7,765
4,196
Stefan Oschmann
2015
1,200
25
4,161
13,418
1,316
6,702
1,973
2014
1,200
21
4,799
8,141
765
6,785
2,797
Kai Beckmann
2015
1,000
25
3,411
13,418
1,316
5,752
1,973
2014
1,000
41
3,049
8,141
765
4,855
2,797
Belén Garijo Lopez
2015
1,000
6
3,411
13,418
1,316
5,733
383
2014
–
–
–
–
–
–
–
Marcus Kuhnert
2015
800
20
2,411
13,418
1,316
4,547
687
2014
333
7
882
3,392
462
1,684
107
Bernd Reckmann
2015
1,200
28
4,411
13,418
1,316
6,955
1,973
2014
1,200
28
3,549
8,141
765
5,542
2,797
Matthias Zachert
(until March 31, 2014)
2015
–
–
–
–
–
–
–
2014
250
6
762
–
–
1,018
0
Total
2015
6,500
252
22,269
87,217
8,554
37,575
9,948
2014
5,283
156
18,306
40,026
3,904
27,649
12,694
1
The one-time payment for 2015 granted to Bernd Reckmann as well as the one-time payments for 2014 granted to Karl-Ludwig Kley and Stefan Oschmann are included in the
variable compensation components for 2015 and 2014, respectively.
2
Number of the potential
MSU
s subject to target achievement. For details see page 150/151. The actual number of
MSU
s to be granted after the expiration of the three-year per
formance cycle may deviate from this.
The share split that took effect on June 30, 2014 does not affect the number of
MSU
s granted. The 1:2 share split was compensated for by a doubling in the accounting value of
an
MSU
.
3
Time value on the date of the grant (date of the legally binding entitlement). The amount of a potential payment is thus not predefined. Payment is subject to target achievement
and is only made on a specified date after the expiration of a three-year performance cycle. The time value was calculated using a Monte Carlo simulation based on the previously
described
KPI
s.
The expected volatilities are based on the implicit volatility of Merck shares and the
DAX
®
index in accordance with the remaining term of the Long-Term Incentive
Plan tranche. The dividend payments incorporated into the valuation model orient towards medium-term dividend expectations.
4
In accordance with
IFRS
, the expense recorded for 2015 includes the values for the 2013, 2014, and 2015 Long-Term Incentive Plan tranches. In accordance with
IFRS
, the
expense recorded in 2014 includes the values for the Long-Term Incentive Plan tranches 2012, 2013 and 2014.
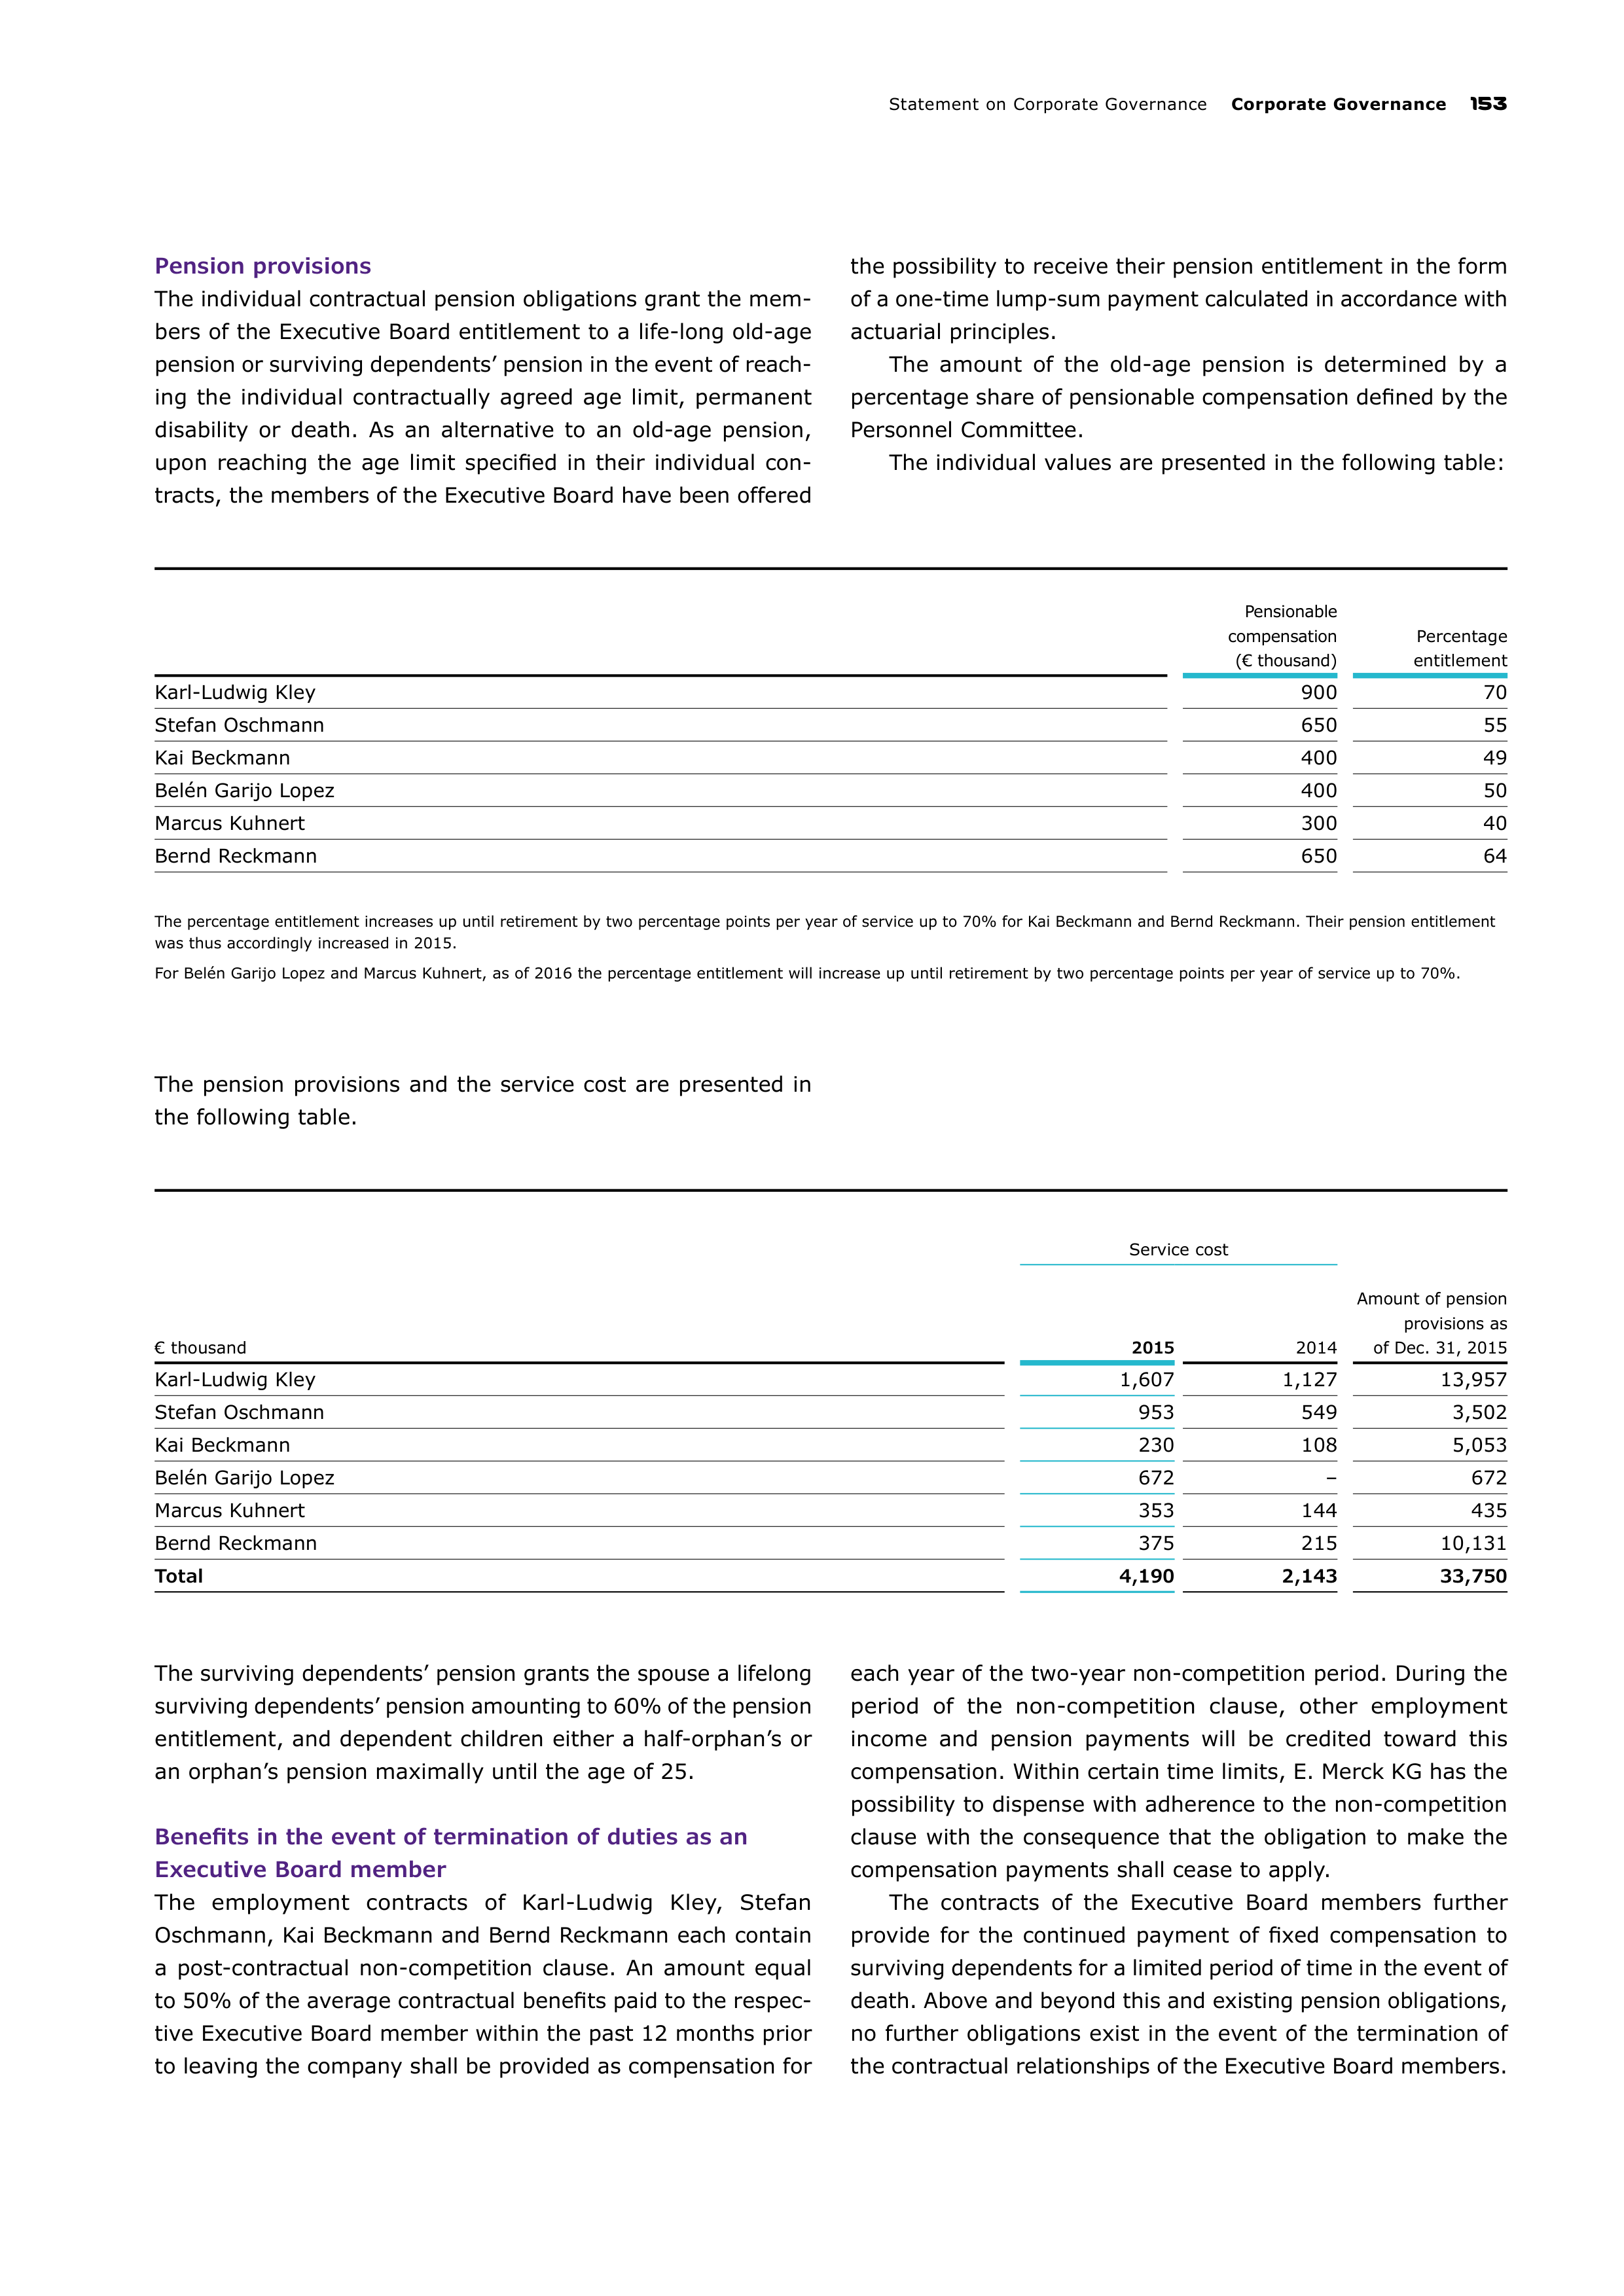
Statement on Corporate Governance
Corporate Governance
153
Pension provisions
The individual contractual pension obligations grant the mem
bers of the Executive Board entitlement to a life-long old-age
pension or surviving dependents’ pension in the event of reach
ing the individual contractually agreed age limit, permanent
disability or death. As an alternative to an old-age pension,
upon reaching the age limit specified in their individual con
tracts, the members of the Executive Board have been offered
the possibility to receive their pension entitlement in the form
of a one-time lump-sum payment calculated in accordance with
actuarial principles.
The amount of the old-age pension is determined by a
percentage share of pensionable compensation defined by the
Personnel Committee.
The individual values are presented in the following table:
Pensionable
compensation
(€ thousand)
Percentage
entitlement
Karl-Ludwig Kley
900
70
Stefan Oschmann
650
55
Kai Beckmann
400
49
Belén Garijo Lopez
400
50
Marcus Kuhnert
300
40
Bernd Reckmann
650
64
The percentage entitlement increases up until retirement by two percentage points per year of service up to 70% for Kai Beckmann and Bernd Reckmann. Their pension entitlement
was thus accordingly increased in 2015.
For Belén Garijo Lopez and Marcus Kuhnert, as of 2016 the percentage entitlement will increase up until retirement by two percentage points per year of service up to 70%.
The pension provisions and the service cost are presented in
the following table.
Service cost
€ thousand
2015
2014
Amount of pension
provisions as
of Dec. 31, 2015
Karl-Ludwig Kley
1,607
1,127
13,957
Stefan Oschmann
953
549
3,502
Kai Beckmann
230
108
5,053
Belén Garijo Lopez
672
–
672
Marcus Kuhnert
353
144
435
Bernd Reckmann
375
215
10,131
Total
4,190
2,143
33,750
The surviving dependents’ pension grants the spouse a lifelong
surviving dependents’ pension amounting to 60% of the pension
entitlement, and dependent children either a half-orphan’s or
an orphan’s pension maximally until the age of 25.
Benefits in the event of termination of duties as an
Executive Board member
The employment contracts of Karl-Ludwig Kley, Stefan
Oschmann, Kai Beckmann and Bernd Reckmann each contain
a post-contractual non-competition clause. An amount equal
to 50% of the average contractual benefits paid to the respec
tive Executive Board member within the past 12 months prior
to leaving the company shall be provided as compensation for
each year of the two-year non-competition period. During the
period of the non-competition clause, other employment
income and pension payments will be credited toward this
compensation. Within certain time limits, E. Merck KG has the
possibility to dispense with adherence to the non-competition
clause with the consequence that the obligation to make the
compensation payments shall cease to apply.
The contracts of the Executive Board members further
pro
vide for the continued payment of fixed compensation to
surviving dependents for a limited period of time in the event of
death. Above and beyond this and existing pension obligations,
no further obligations exist in the event of the termination of
the contractual relationships of the Executive Board members.
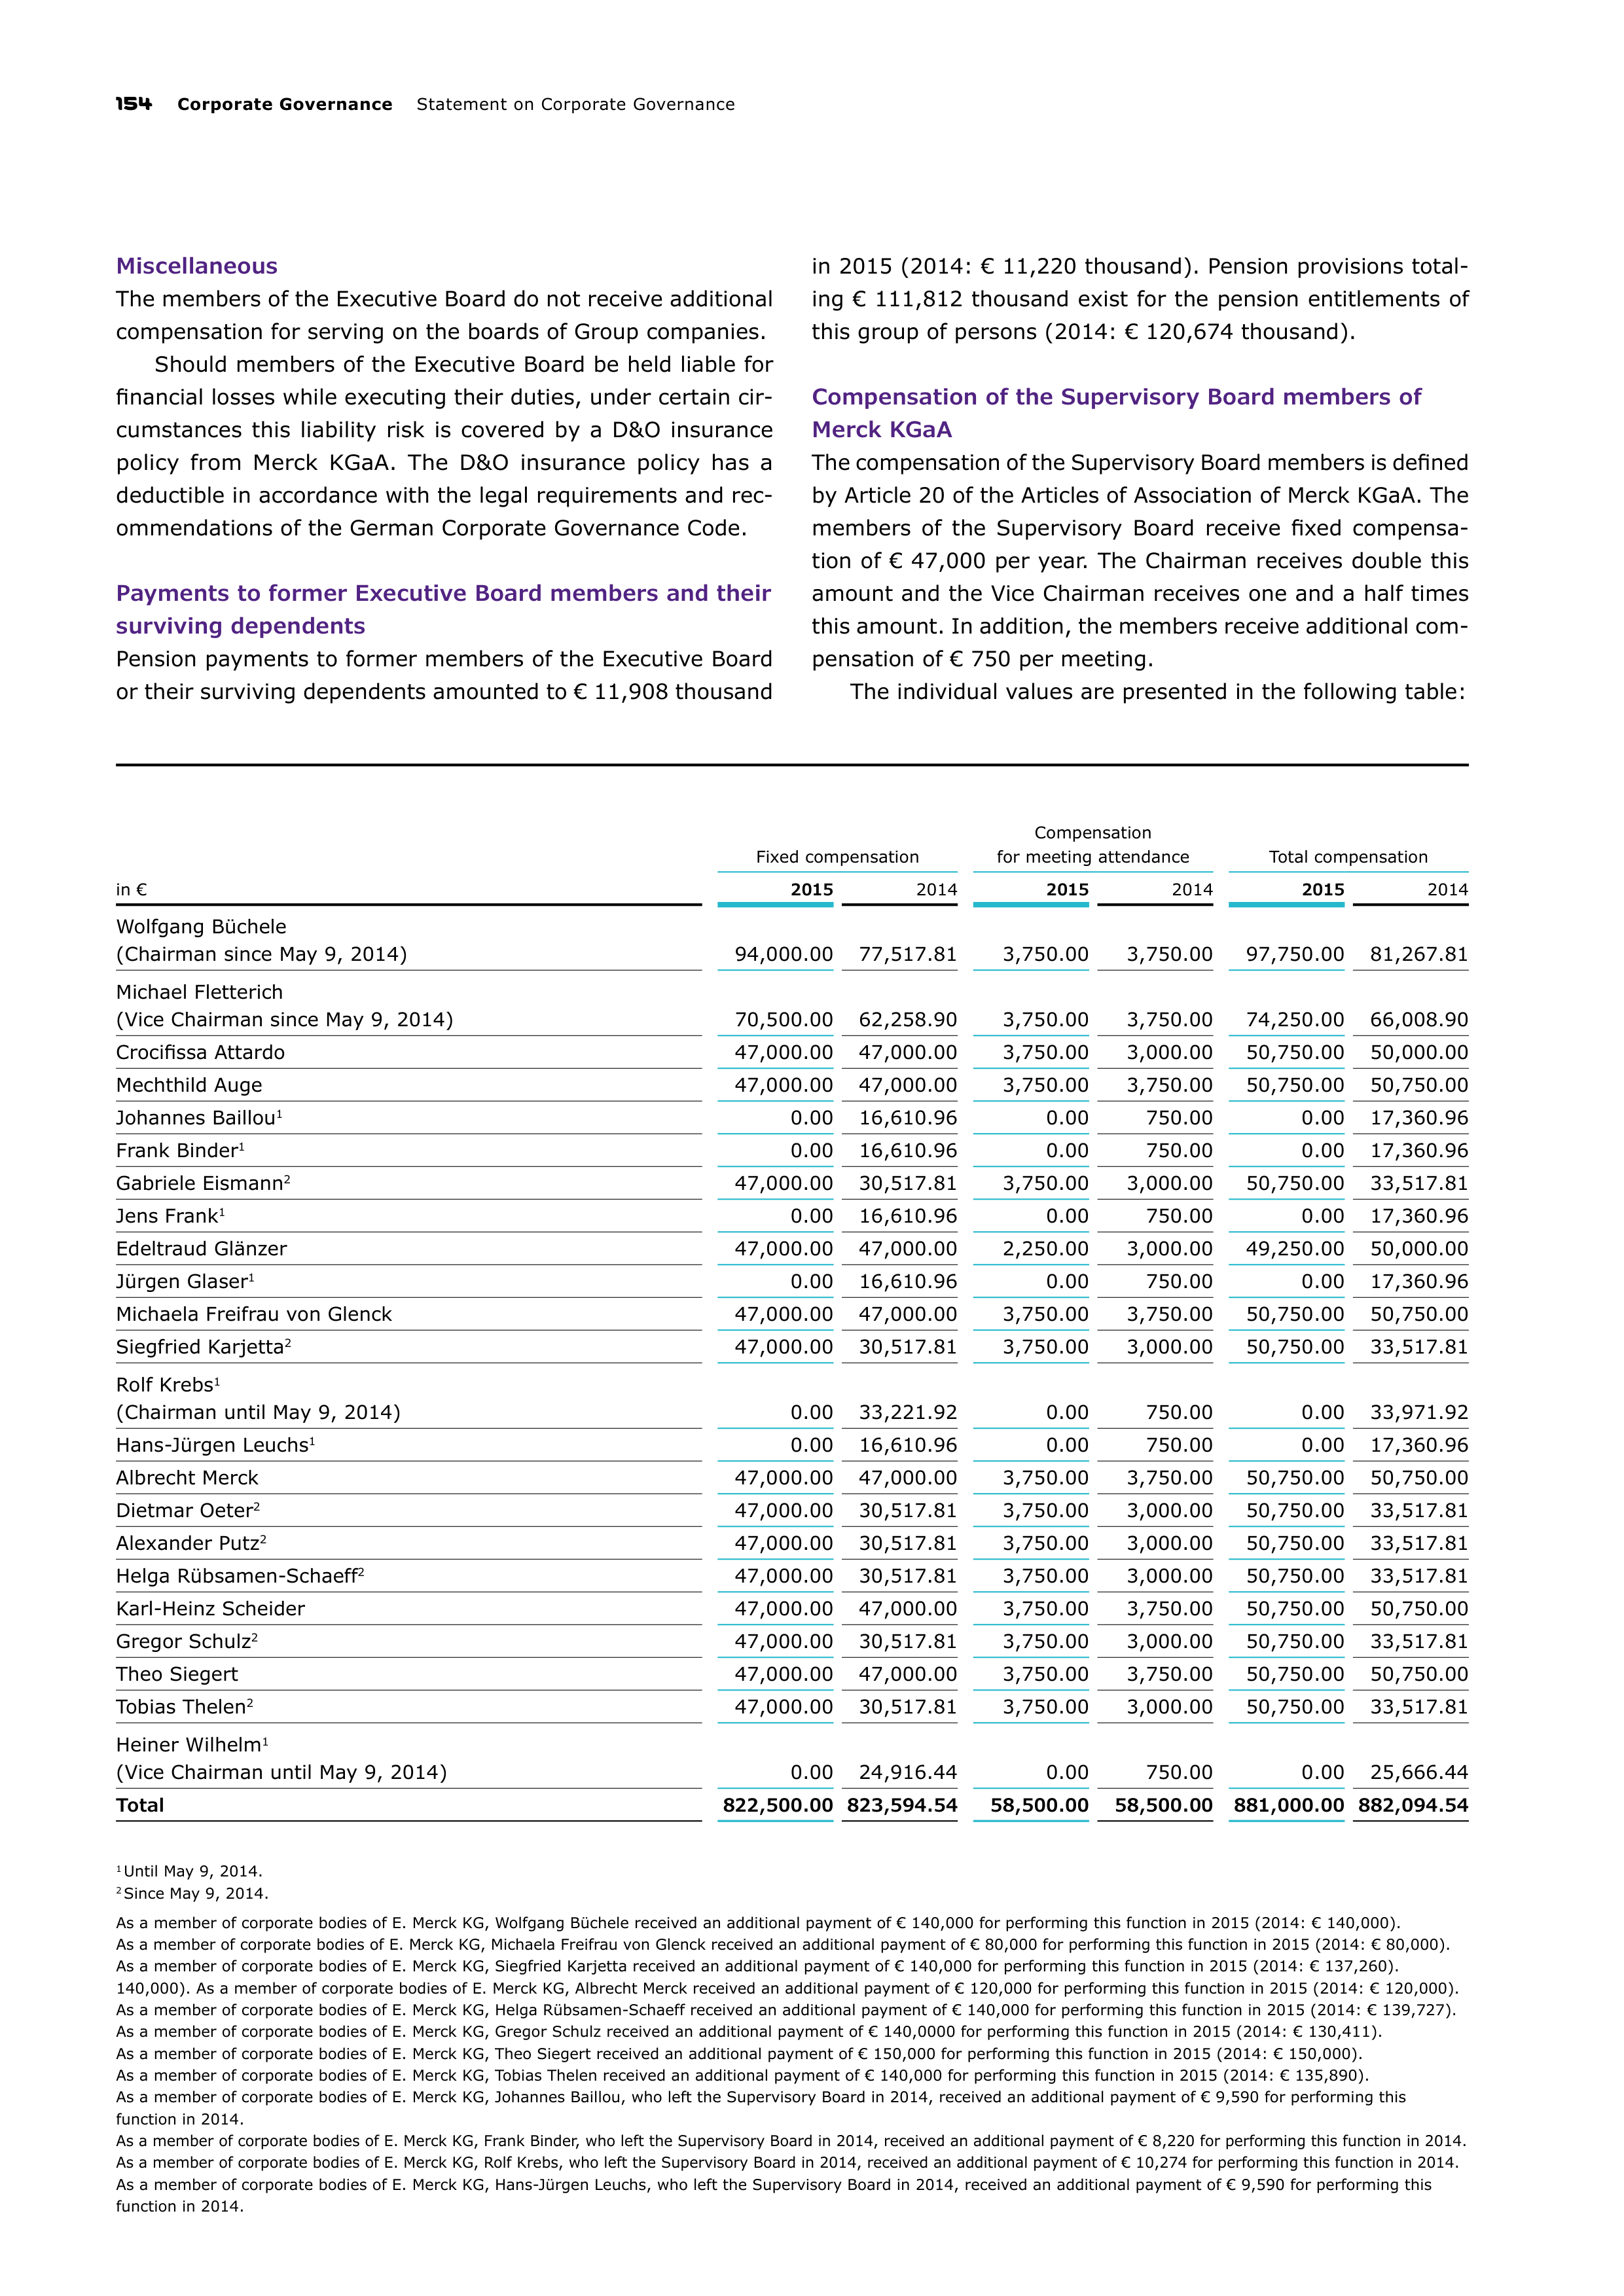
154
Corporate Governance
Statement on Corporate Governance
Miscellaneous
The members of the Executive Board do not receive additional
compensation for serving on the boards of Group companies.
Should members of the Executive Board be held liable for
financial losses while executing their duties, under certain cir
cumstances this liability risk is covered by a D&O insurance
policy from Merck KGaA. The D&O insurance policy has a
deductible in accordance with the legal requirements and rec
ommendations of the German Corporate Governance Code.
Payments to former Executive Board members and their
surviving dependents
Pension payments to former members of the Executive Board
or their surviving dependents amounted to € 11,908 thousand
in 2015 (2014: € 11,220 thousand). Pension provisions total
ing € 111,812 thousand exist for the pension entitlements of
this group of persons (2014: € 120,674 thousand).
Compensation of the Supervisory Board members of
Merck KGaA
The compensation of the Supervisory Board members is defined
by Article 20 of the Articles of Association of Merck KGaA. The
members of the Supervisory Board receive fixed compensa
tion of € 47,000 per year. The Chairman receives double this
amount and the Vice Chairman receives one and a half times
this amount. In addition, the members receive additional com
pensation of € 750 per meeting.
The individual values are presented in the following table:
Fixed compensation
Compensation
for meeting attendance
Total compensation
in €
2015
2014
2015
2014
2015
2014
Wolfgang Büchele
(Chairman since May 9, 2014)
94,000.00
77,517.81
3,750.00
3,750.00
97,750.00
81,267.81
Michael Fletterich
(Vice Chairman since May 9, 2014)
70,500.00
62,258.90
3,750.00
3,750.00
74,250.00
66,008.90
Crocifissa Attardo
47,000.00
47,000.00
3,750.00
3,000.00
50,750.00
50,000.00
Mechthild Auge
47,000.00
47,000.00
3,750.00
3,750.00
50,750.00
50,750.00
Johannes Baillou
1
0.00
16,610.96
0.00
750.00
0.00
17,360.96
Frank Binder
1
0.00
16,610.96
0.00
750.00
0.00
17,360.96
Gabriele Eismann
2
47,000.00
30,517.81
3,750.00
3,000.00
50,750.00
33,517.81
Jens Frank
1
0.00
16,610.96
0.00
750.00
0.00
17,360.96
Edeltraud Glänzer
47,000.00
47,000.00
2,250.00
3,000.00
49,250.00
50,000.00
Jürgen Glaser
1
0.00
16,610.96
0.00
750.00
0.00
17,360.96
Michaela Freifrau von Glenck
47,000.00
47,000.00
3,750.00
3,750.00
50,750.00
50,750.00
Siegfried Karjetta
2
47,000.00
30,517.81
3,750.00
3,000.00
50,750.00
33,517.81
Rolf Krebs
1
(Chairman until May 9, 2014)
0.00
33,221.92
0.00
750.00
0.00
33,971.92
Hans-Jürgen Leuchs
1
0.00
16,610.96
0.00
750.00
0.00
17,360.96
Albrecht Merck
47,000.00
47,000.00
3,750.00
3,750.00
50,750.00
50,750.00
Dietmar Oeter
2
47,000.00
30,517.81
3,750.00
3,000.00
50,750.00
33,517.81
Alexander Putz
2
47,000.00
30,517.81
3,750.00
3,000.00
50,750.00
33,517.81
Helga Rübsamen-Schaeff
2
47,000.00
30,517.81
3,750.00
3,000.00
50,750.00
33,517.81
Karl-Heinz Scheider
47,000.00
47,000.00
3,750.00
3,750.00
50,750.00
50,750.00
Gregor Schulz
2
47,000.00
30,517.81
3,750.00
3,000.00
50,750.00
33,517.81
Theo Siegert
47,000.00
47,000.00
3,750.00
3,750.00
50,750.00
50,750.00
Tobias Thelen
2
47,000.00
30,517.81
3,750.00
3,000.00
50,750.00
33,517.81
Heiner Wilhelm
1
(Vice Chairman until May 9, 2014)
0.00
24,916.44
0.00
750.00
0.00
25,666.44
Total
822,500.00
823,594.54
58,500.00
58,500.00
881,000.00
882,094.54
1
Until May 9, 2014.
2
Since May 9, 2014.
As a member of corporate bodies of E. Merck KG, Wolfgang Büchele received an additional payment of € 140,000 for performing this function in 2015 (2014: € 140,000).
As a member of corporate bodies of E. Merck KG, Michaela Freifrau von Glenck received an additional payment of € 80,000 for performing this function in 2015 (2014: € 80,000).
As a member of corporate bodies of E. Merck KG, Siegfried Karjetta received an additional payment of € 140,000 for performing this function in 2015 (2014: € 137,260).
140,000). As a member of corporate bodies of E. Merck KG, Albrecht Merck received an additional payment of € 120,000 for performing this function in 2015 (2014: € 120,000).
As a member of corporate bodies of E. Merck KG, Helga Rübsamen-Schaeff received an additional payment of € 140,000 for performing this function in 2015 (2014: € 139,727).
As a member of corporate bodies of E. Merck KG, Gregor Schulz received an additional payment of € 140,0000 for performing this function in 2015 (2014: € 130,411).
As a member of corporate bodies of E. Merck KG, Theo Siegert received an additional payment of € 150,000 for performing this function in 2015 (2014: € 150,000).
As a member of corporate bodies of E. Merck KG, Tobias Thelen received an additional payment of € 140,000 for performing this function in 2015 (2014: € 135,890).
As a member of corporate bodies of E. Merck KG, Johannes Baillou, who left the Supervisory Board in 2014, received an additional payment of € 9,590 for performing this
function in 2014.
As a member of corporate bodies of E. Merck KG, Frank Binder, who left the Supervisory Board in 2014, received an additional payment of € 8,220 for performing this function in 2014.
As a member of corporate bodies of E. Merck KG, Rolf Krebs, who left the Supervisory Board in 2014, received an additional payment of € 10,274 for performing this function in 2014.
As a member of corporate bodies of E. Merck KG, Hans-Jürgen Leuchs, who left the Supervisory Board in 2014, received an additional payment of € 9,590 for performing this
function in 2014.
Statement on Corporate Governance
Corporate Governance
155
Ownership, purchase or sale of shares in the company by
members of the Executive Board and of the Supervisory
Board
As of December 31, 2015, the members of the Executive
Board and of the Supervisory Board either directly or indirectly
held 81,992 shares of Merck KGaA. Their total ownership rep
resents less than 1% of the issued shares of Merck KGaA.
Transactions executed by members of the Executive Board and
of the Supervisory Board are disclosed on the Merck website at
www.merckgroup.com->Investors->Corporate Governance->
Directors’ Dealings.
Information on corporate governance
practices
Reporting
It is Merck KGaA’s objective to provide the latest information
to all shareholders, media, financial analysts and interested
members of the public, while creating the greatest possible
transparency. For this reason, Merck uses a wide range of
communication platforms to engage in a timely dialogue with
all interested parties about the situation of the company and
business changes. Merck’s principles include providing factu
ally correct, comprehensive and fair information.
Information subject to disclosure requirements, as well
as information that is not, can be accessed worldwide on the
Merck KGaA website (www.merckgroup.com), which is the
company’s most important publication platform. Apart from a
detailed financial calendar, quarterly and half-year financial
reports covering the past three years are available here in
German and English. In addition, in line with the legal require
ments, ad hoc announcements are published on the website.
These contain information on circumstances and facts that
could impact the Merck share price.
Regular press conferences, investor meetings on the occa
sion of investor conferences as well as road shows offer another
platform for dialogue. The company presentations prepared
for this purpose are also available on the Merck KGaA website.
In addition, the Investor Relations team is always available to
private and institutional investors who wish to receive further
information.
To ensure the greatest possible transparency, all docu
ments concerning the General Meeting are available on the
company website. Additionally, some parts of the General
Meeting are webcast live on the Internet.
Dealing with insider information
Dealing properly with insider information is very important to
us. Our insider committee examines the existence of insider
information, ensures compliance with legal obligations and
prepares any necessary measures. The members of the insider
committee are appointed by the Executive Board; at least
two members work in Group Legal & Compliance. The insider
committee meets at regular intervals, yet also meets when
circumstances require. The Chief Financial Officer is vested with
the authority to make the final decision on handling potential
insider information.
In order to ensure a high level of protection for insider infor
mation, in 2011 the Executive Board issued internal insider
guidelines applicable throughout the Merck Group worldwide.
The guidelines inform employees about their responsibilities
under insider trading laws and gives clear instructions for
compliant behavior. In addition, it describes the function of the
insider committee in detail. Moreover, our Code of Conduct,
which is binding on all employees, also contains an explicit,
detailed reference to the ban on using insider information.
Within the scope of obligatory training courses on the Code of
Conduct as well as specific training courses on insider law, all
employees are instructed on the stipulations of insider trading.
Accounting and audits of financial statements
Merck KGaA prepares its consolidated financial statements
and combined management report in accordance with Inter
national Financial Reporting Standards (
IFRS
), as applicable in
the EU, as well as the supplementary rules applicable under
section 315a (1) of the German Commercial Code (
HGB
) and
as stipulated by our Articles of Association. The consolidated
financial statements and the combined management report
are
prepared by the Executive Board and examined by an auditor,
taking into account the generally accepted standards for the
audit of financial statements promulgated by the Institute of
Public Auditors in Germany (Institut der Wirtschaftsprüfer –
IDW
).
The Supervisory Board commissioned
KPMG
AG
Wirtschafts
prüfungsgesellschaft, Berlin, to audit the consolidated finan
cial statements and the combined management report for
2015. Moreover, the Supervisory Board agreed with
KPMG AG
Wirtschaftsprüfungsgesellschaft, Berlin, that the auditor shall
inform the Supervisory Board without delay of any grounds for
bias or disqualification occurring during the audit if these can
not be immediately rectified. Additionally, the auditor shall
immediately report to the Supervisory Board any findings
and
issues which emerge during the audit that have a direct
bearing upon the tasks of the Supervisory Board. The auditor
shall inform the Supervisory Board or note in the audit report
any circumstances determined during the audit that would
render inaccurate the Statement of Compliance made by the
Executive Board and the Supervisory Board. It has also been
agreed with the auditor that in order to assess whether the
Executive Board has fulfilled its obligations in accordance with
section 91 (2) AktG, the audit will also cover the company’s
early warning risk identification system. Moreover, the auditor
is required to examine and evaluate the accounting-relevant
internal control system insofar as this is necessary and appro
priate for assessing the accuracy of financial reporting.
The auditor responsible for auditing the consolidated finan
cial statements changes regularly in accordance with the stat
utory requirements. Bodo Rackwitz is currently leading the
audit engagement and has been the auditor in charge of the
engagement since fiscal 2015. The Supervisory Board had
KPMG AG
Wirtschaftsprüfungsgesellschaft, Berlin, provide a
statement regarding the scope of the business, financial, per
sonal, and other relationships between
KPMG AG
, its bodies
and head auditors, and Merck KGaA, its Group companies and
the members of their bodies. The statement also covers the
scope of the services provided by
KPMG AG
in the previous
156
Corporate Governance
Statement on Corporate Governance
fiscal year as well as the services (other than auditing ser
vices) that are contracted for the upcoming year (especially
consultancy services) for Merck KGaA and its subsidiaries
(independence declaration). Having examined the declaration,
the Supervisory Board has found no grounds to doubt the
independence of
KPMG AG
Wirtschaftsprüfungsgesellschaft,
Berlin. Neither party identified any conflicts of interest.
Values and compliance
Based on a corporate culture that places the fundamental com
pany values – courage, achievement, responsibility, respect,
integrity and transparency – at the center of our entrepre
neurial actions, the Code of Conduct helps those involved in
the business process to implement the values when dealing
with one another on a daily basis.
Merck has created the Code of Conduct as a set of rules
and regulations intended to help our employees to act respon
sibly and to make the right decisions in their daily work.
The Code of Conduct explains the principles for dealings
with business associates, general partners, colleagues and
employees, as well as the communities in which we operate.
Thus, it supports all employees in acting ethically – not only in
their dealings with one another, but also outside the company.
The Code of Conduct is thus the main set of rules of our com
pliance program.
To Merck, compliance means observing legal and company
internal regulations and the basic ethical principles anchored
in the company values. With the Code of Conduct and the
various unit-specific ethical compliance rules, the values are
integrated into daily work and business practice. The Code of
Conduct is binding on all employees, both at headquarters
and in the subsidiaries. The Compliance Office monitors obser
vance of the Code of Conduct with support from corresponding
monitoring and training programs throughout the Group. All
employees are called upon to report compliance violations to
their supervisor, Legal, HR or other relevant departments.
Merck created the position of Group Compliance Officer in
2002. This employee is responsible for setting up, maintaining
and further developing our global compliance program. By
taking appropriate measures, the Group Compliance Officer
and his team, including regional compliance officers, help to
lower the risk of serious legal violations of, for instance, anti
trust law or anticorruption rules. Since 2014 and 2015, com
pliance officers of the business sectors have been providing
specific compliance input. A further focal area of the Compli
ance program is ensuring legally and ethically correct dealings
with medical professionals and adhering to the transparency
requirements. Since October 2013, the Group Compliance
Officer has agreed extensive measures with the affected areas
of the company in order to establish an internal framework of
rules as well as the corresponding approval and documenta
tion processes that ensure truthful publication. The role of the
Group Compliance Officer is reflected in the subsidiaries, which
ensure that compliance measures are implemented in the
countries. Since 2013, Compliance tasks in the countries
and
on a regional basis have largely been performed by full-time
compliance officers. As a result, a higher level of compliance
expertise is based locally and the increasing tasks in all busi
ness sectors are taken into account. At the same time, the
management structure was streamlined and the reporting lines
for the countries were consolidated regionally. Regular regional
compliance meetings are held to promote the exchange of infor
mation within the Compliance organization. Newcomer training
seminars were introduced in 2010 for newly appointed compli
ance officers. These seminars serve to build up compliance
expertise and strengthen cooperation within the Compliance
organization. This Group-wide network is used to steer the
global compliance program.
Within the scope of this program, a high degree of impor
tance is attached to regular compliance seminars of the Merck
Compliance Training Plan, which are conducted as Web-based
training courses and onsite events. By presenting various
training topics, particularly on the Code of Conduct, corrup
tion, antitrust and competition law as well as healthcare com
pliance, they serve to sensitize employees and management
to the consequences of compliance violations and to show
ways of avoiding them. Since Merck set up a central SpeakUp
line, employees have been able to report compliance violations
by telephone or via a Web-based application in their respective
national language. The SpeakUp line is available 24 hours a
day, free of charge. Case numbers enable anonymous, two-way
communication. The reports received are individually reviewed.
If a compliance violation exists, corresponding corrective action
is taken based on concrete action plans. If necessary, discipli
nary measures are taken. These can range from a simple warn
ing
up to the dismissal of the employee who violated a compli
ance rule. In 2010, Merck set up a Compliance Committee to
guide these processes. The Compliance Committee consists of
members from various Group functions; they are involved in
reviewing compliance violations and introducing countermeas
ures. The joint work in the Compliance Committee enables pro
cesses between the various Group functions to be optimally
coordinated and designed efficiently. Further significant
ele
ments of the Compliance program include requirements on
locally identifying and assessing risks and reporting these,
both within the subsidiary abroad and to the Group functions.
Group Compliance regularly reviews and
assesses the imple
mentation status of the Compliance program at the subsidiaries
abroad. In cooperation with Group Internal Auditing, the Com
pliance Office regularly reviews the implementation of Group-
wide compliance measures at the subsidiaries abroad. The
audits regularly focus on the local compliance structure, the
compliance measures taken, as well as the existence of corre
sponding compliance guidelines and processes.
The Compliance Office reports regularly to the Executive
Board and the Supervisory Board, informing them of the sta
tus of compliance activities (including training status), compli
ance risks and serious compliance violations.
The Executive Board informs the supervisory bodies at
least once a year about the key compliance issues.
Statement on Corporate Governance
Corporate Governance
157
Risk and opportunity management
The Executive Board, the Supervisory Board and the Finance
Committee are regularly informed about the current risk port
folio of the Group and the individual companies. More detailed
information can be found in the Report on Risks and Opportu
nities on page 120.
Avoidance of conflicts of interest
Within the framework of their work, all Executive Board and
Supervisory Board members of Merck KGaA are exclusively
committed to the interests of the company and neither pursue
personal interests nor grant unjustified advantages to third
parties.
Before an Executive Board member takes on honorary
offices, board positions or other sideline activities, this must be
approved by the Personnel Committee of the Board of Partners
of E. Merck KG. The Chairman of the Executive Board, Karl
Ludwig Kley, and the Chief Financial Officer, Marcus Kuhnert,
are both members of the Executive Board of E. Merck KG. This
does not, however, lead to conflicts of interest.
In its report to the General Meeting, the Supervisory Board
discloses any conflicts of interest involving its members and
how they were dealt with. Consultancy agreements as well as
other service and work contracts of a Supervisory Board mem
ber with Merck require the approval of the Supervisory Board.
In fiscal 2015, there were neither conflicts of interest nor con
sultancy agreements or other service or work contracts with
Merck KGaA involving Supervisory Board members.
Adherence to environmental and safety standards
At Merck, closed-loop thinking guides the way in which we
address environmental concerns and environmental protection
issues. To this end, we integrate precautionary measures into
our planning processes. Our Environment, Health and Safety
Policy with its principles and strategies implements the guide
lines formulated by the national and international associations
of the chemical industry in the Responsible Care guidelines.
The Responsible Care Global Charter developed by the Inter
national Council of Chemical Associations (
ICCA
) in 2006 puts
even more emphasis than before on overall responsibility for
products, supply chains and the community. Merck signed this
expanded version of Responsible Care for the entire Group in
February 2007. In addition, Merck was one of the first compa
nies in 2014 to sign the new version of the Responsible Care
Global Charter, which is currently being rolled out by Merck
internationally. We report our ecological, economic and social
performance transparently in accordance with the internation
ally recognized principles of the Global Reporting Initiative
(
GRI
)
, taking into account the requirements of the German
Sustainability Code and the principles of the UN Global Com
pact.
One of our major climate protection objectives is to achieve
a 20% reduction in our greenhouse gas emissions by 2020
measured against the 2006 baseline.
Many guidelines specify how the sites and employees of
the Merck Group are to observe the principles in their daily
work. The Group function Environment, Health, Safety, Secu
rity & Quality steers these global activities and ensures com
pliance with regulatory requirements, standards and business
needs throughout the entire Group. In this way, Group-wide
risks are minimized and continuous improvement is promoted in
the areas of Environment, Health, Safety, Security and Quality.
Corporate Responsibility reports are also published at regular
intervals.
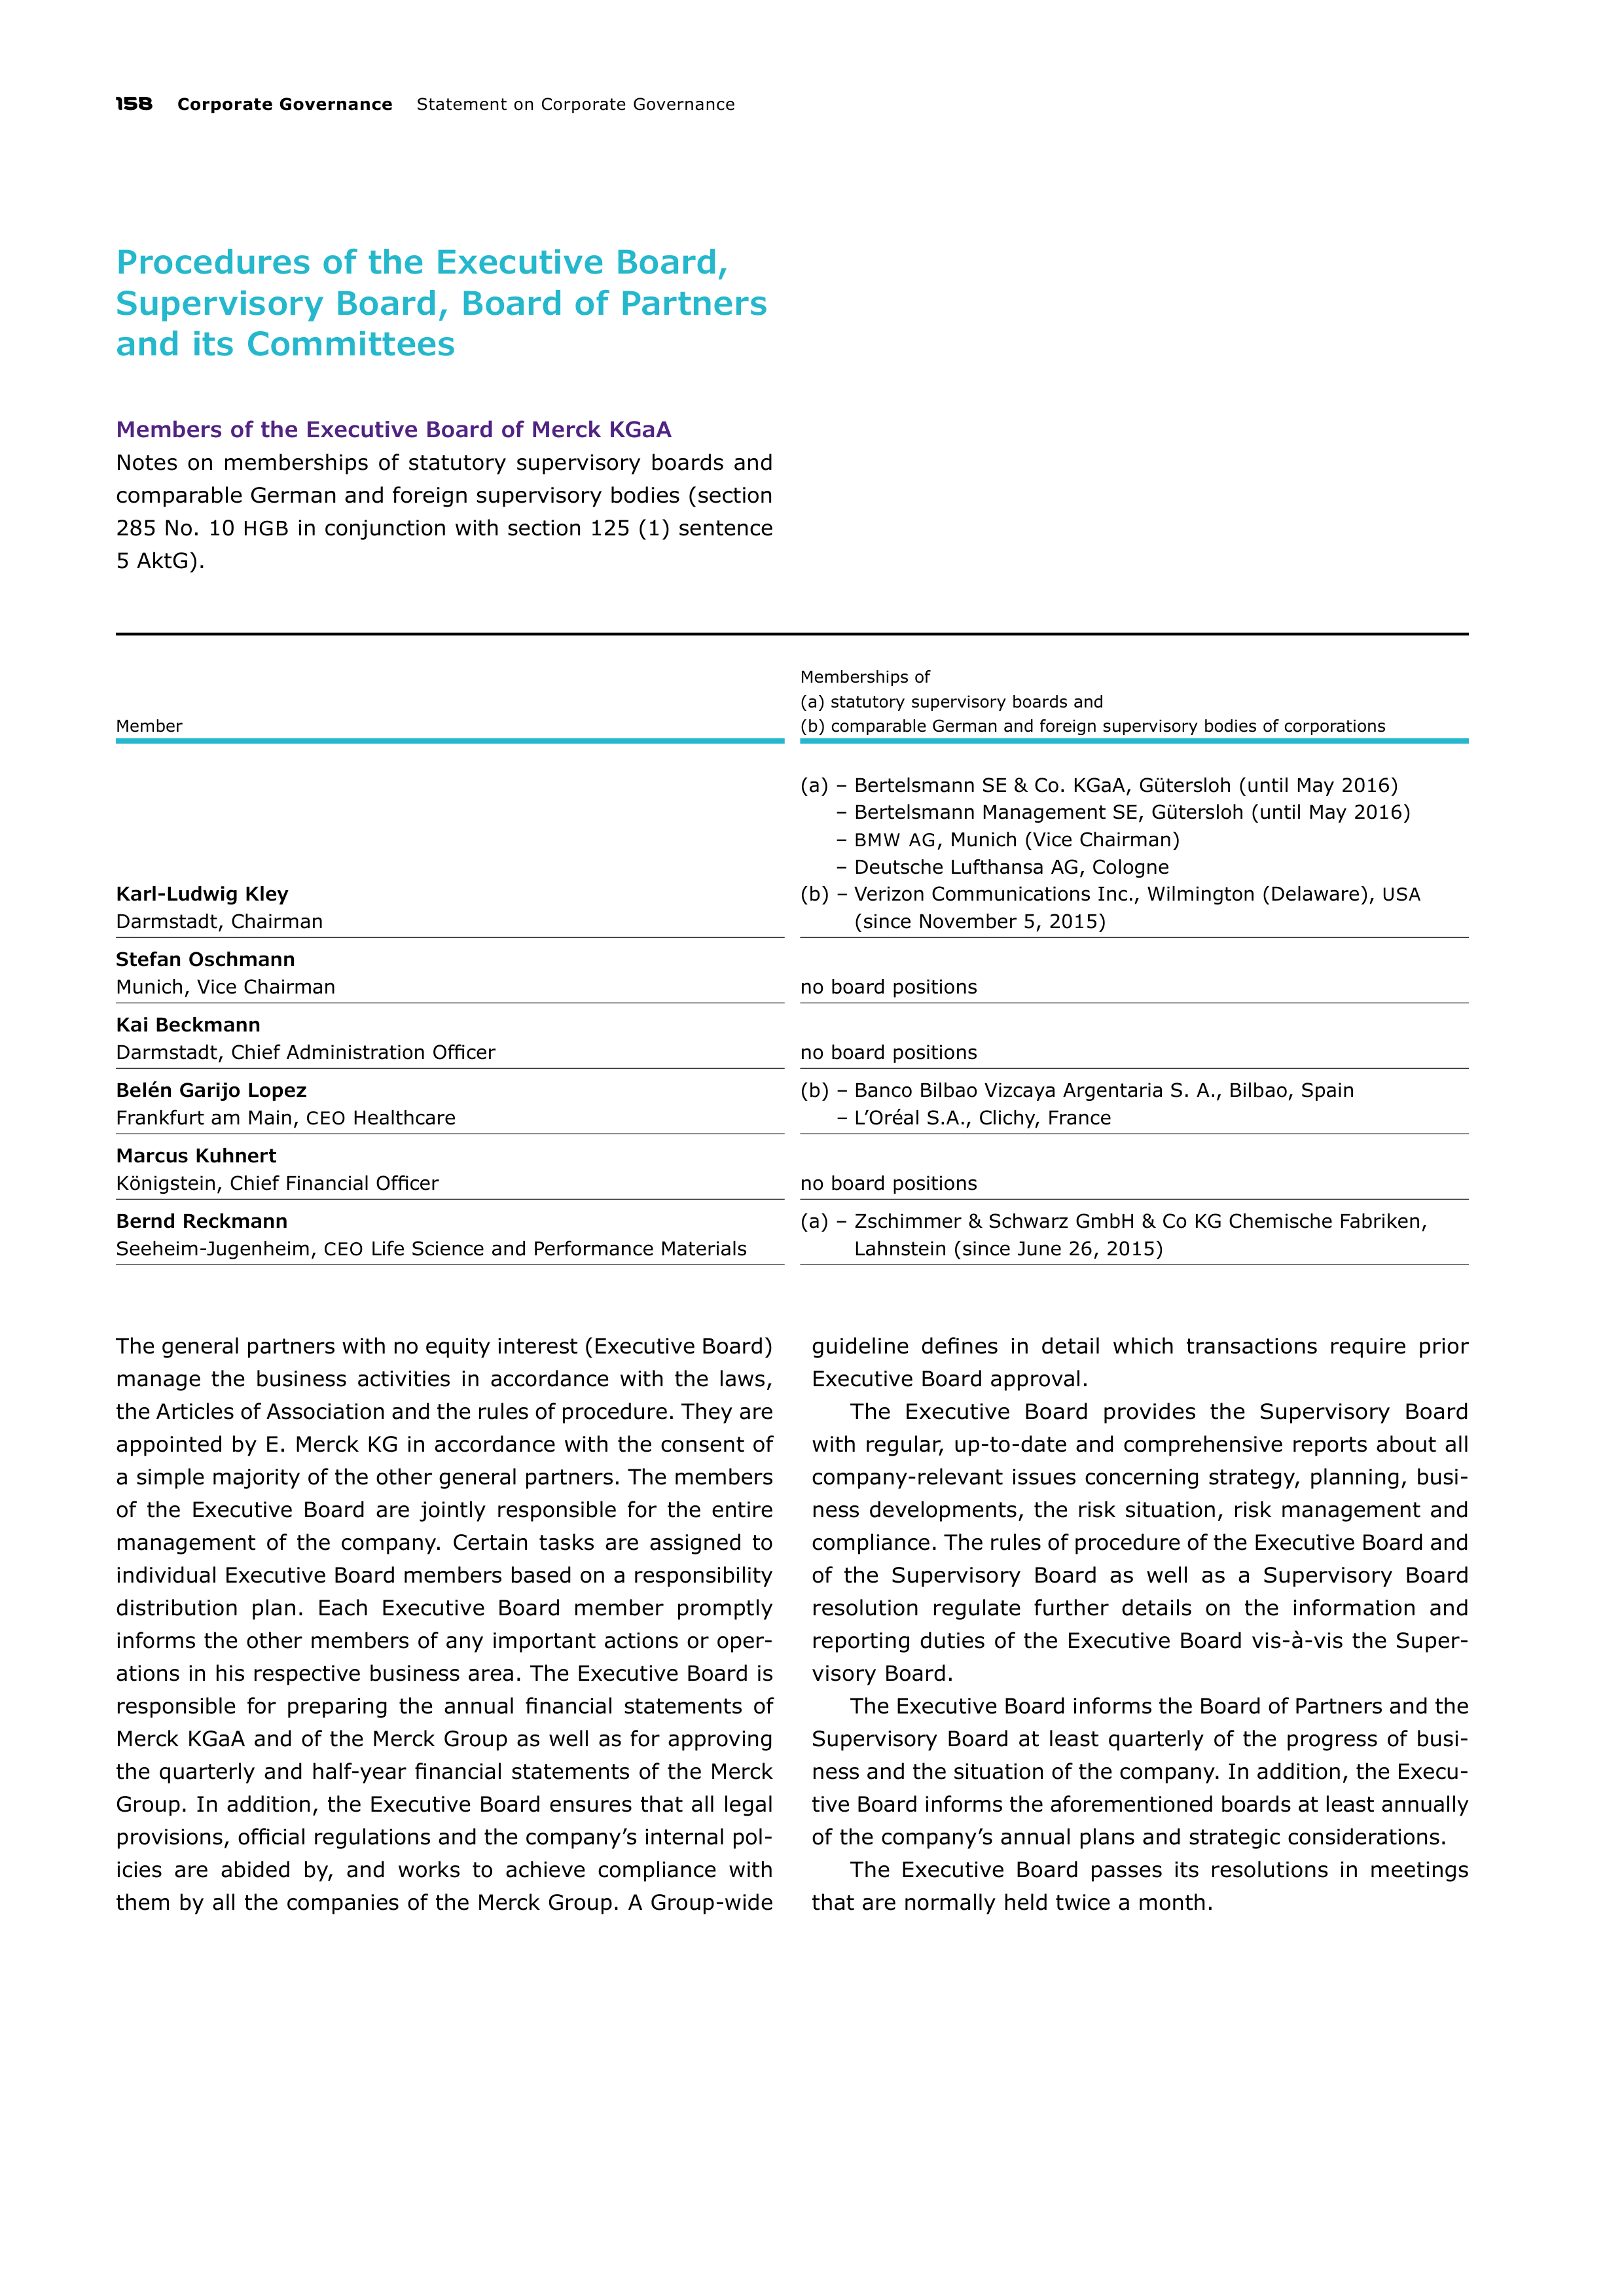
158
Corporate Governance
Statement on Corporate Governance
Procedures of the Executive Board,
Supervisory Board, Board of Partners
and its Committees
Members of the Executive Board of Merck KGaA
Notes on memberships of statutory supervisory boards and
comparable German and foreign supervisory bodies (sec
tion
285 No. 10
HGB
in conjunction with section 125 (1) sentence
5 AktG).
Member
Memberships of
(a) statutory supervisory boards and
(b) comparable German and foreign supervisory bodies of corporations
Karl-Ludwig Kley
Darmstadt, Chairman
(a) – Bertelsmann SE & Co. KGaA, Gütersloh (until May 2016)
– Bertelsmann Management SE, Gütersloh (until May 2016)
–
BMW AG
, Munich (Vice Chairman)
– Deutsche Lufthansa AG, Cologne
(b) – Verizon Communications Inc., Wilmington (Delaware),
USA
(since November 5, 2015)
Stefan Oschmann
Munich, Vice Chairman
no board positions
Kai Beckmann
Darmstadt, Chief Administration Officer
no board positions
Belén Garijo Lopez
Frankfurt am Main,
CEO
Healthcare
(b) – Banco Bilbao Vizcaya Argentaria S. A., Bilbao, Spain
– L’Oréal S.A., Clichy, France
Marcus Kuhnert
Königstein, Chief Financial Officer
no board positions
Bernd Reckmann
Seeheim-Jugenheim,
CEO
Life Science and Performance Materials
(a) – Zschimmer & Schwarz GmbH & Co KG Chemische Fabriken,
Lahnstein (since June 26, 2015)
The general partners with no equity interest (Executive Board)
manage the business activities in accordance with the laws,
the Articles of Association and the rules of procedure. They are
appointed by E. Merck KG in accordance with the consent of
a
simple majority of the other general partners. The members
of the Executive Board are jointly responsible for the entire
management of the company. Certain tasks are assigned to
individual Executive Board members based on a responsibility
distribution plan. Each Executive Board member promptly
informs the other members of any important actions or oper
ations in his respective business area. The Executive Board is
responsible for preparing the annual financial statements of
Merck KGaA and of the Merck Group as well as for approving
the quarterly and half-year financial statements of the Merck
Group. In addition, the Executive Board ensures that all legal
provisions, official regulations and the company’s internal pol
icies are abided by, and works to achieve compliance with
them by all the companies of the Merck Group. A Group-wide
guideline defines in detail which transactions require prior
Executive Board approval.
The Executive Board provides the Supervisory Board
with regular, up-to-date and comprehensive reports about all
company-relevant issues concerning strategy, planning, busi
ness developments, the risk situation, risk management and
compliance. The rules of procedure of the Executive Board and
of
the Supervisory Board as well as a Supervisory Board
reso
lution regulate further details on the information and
reporting duties of the Executive Board vis-à-vis the Super
visory
Board.
The Executive Board informs the Board of Partners and the
Supervisory Board at least quarterly of the progress of busi
ness and the situation of the company. In addition, the Execu
tive Board informs the aforementioned boards at least annually
of the company’s annual plans and strategic considerations.
The Executive Board passes its resolutions in meetings
that are normally held twice a month.
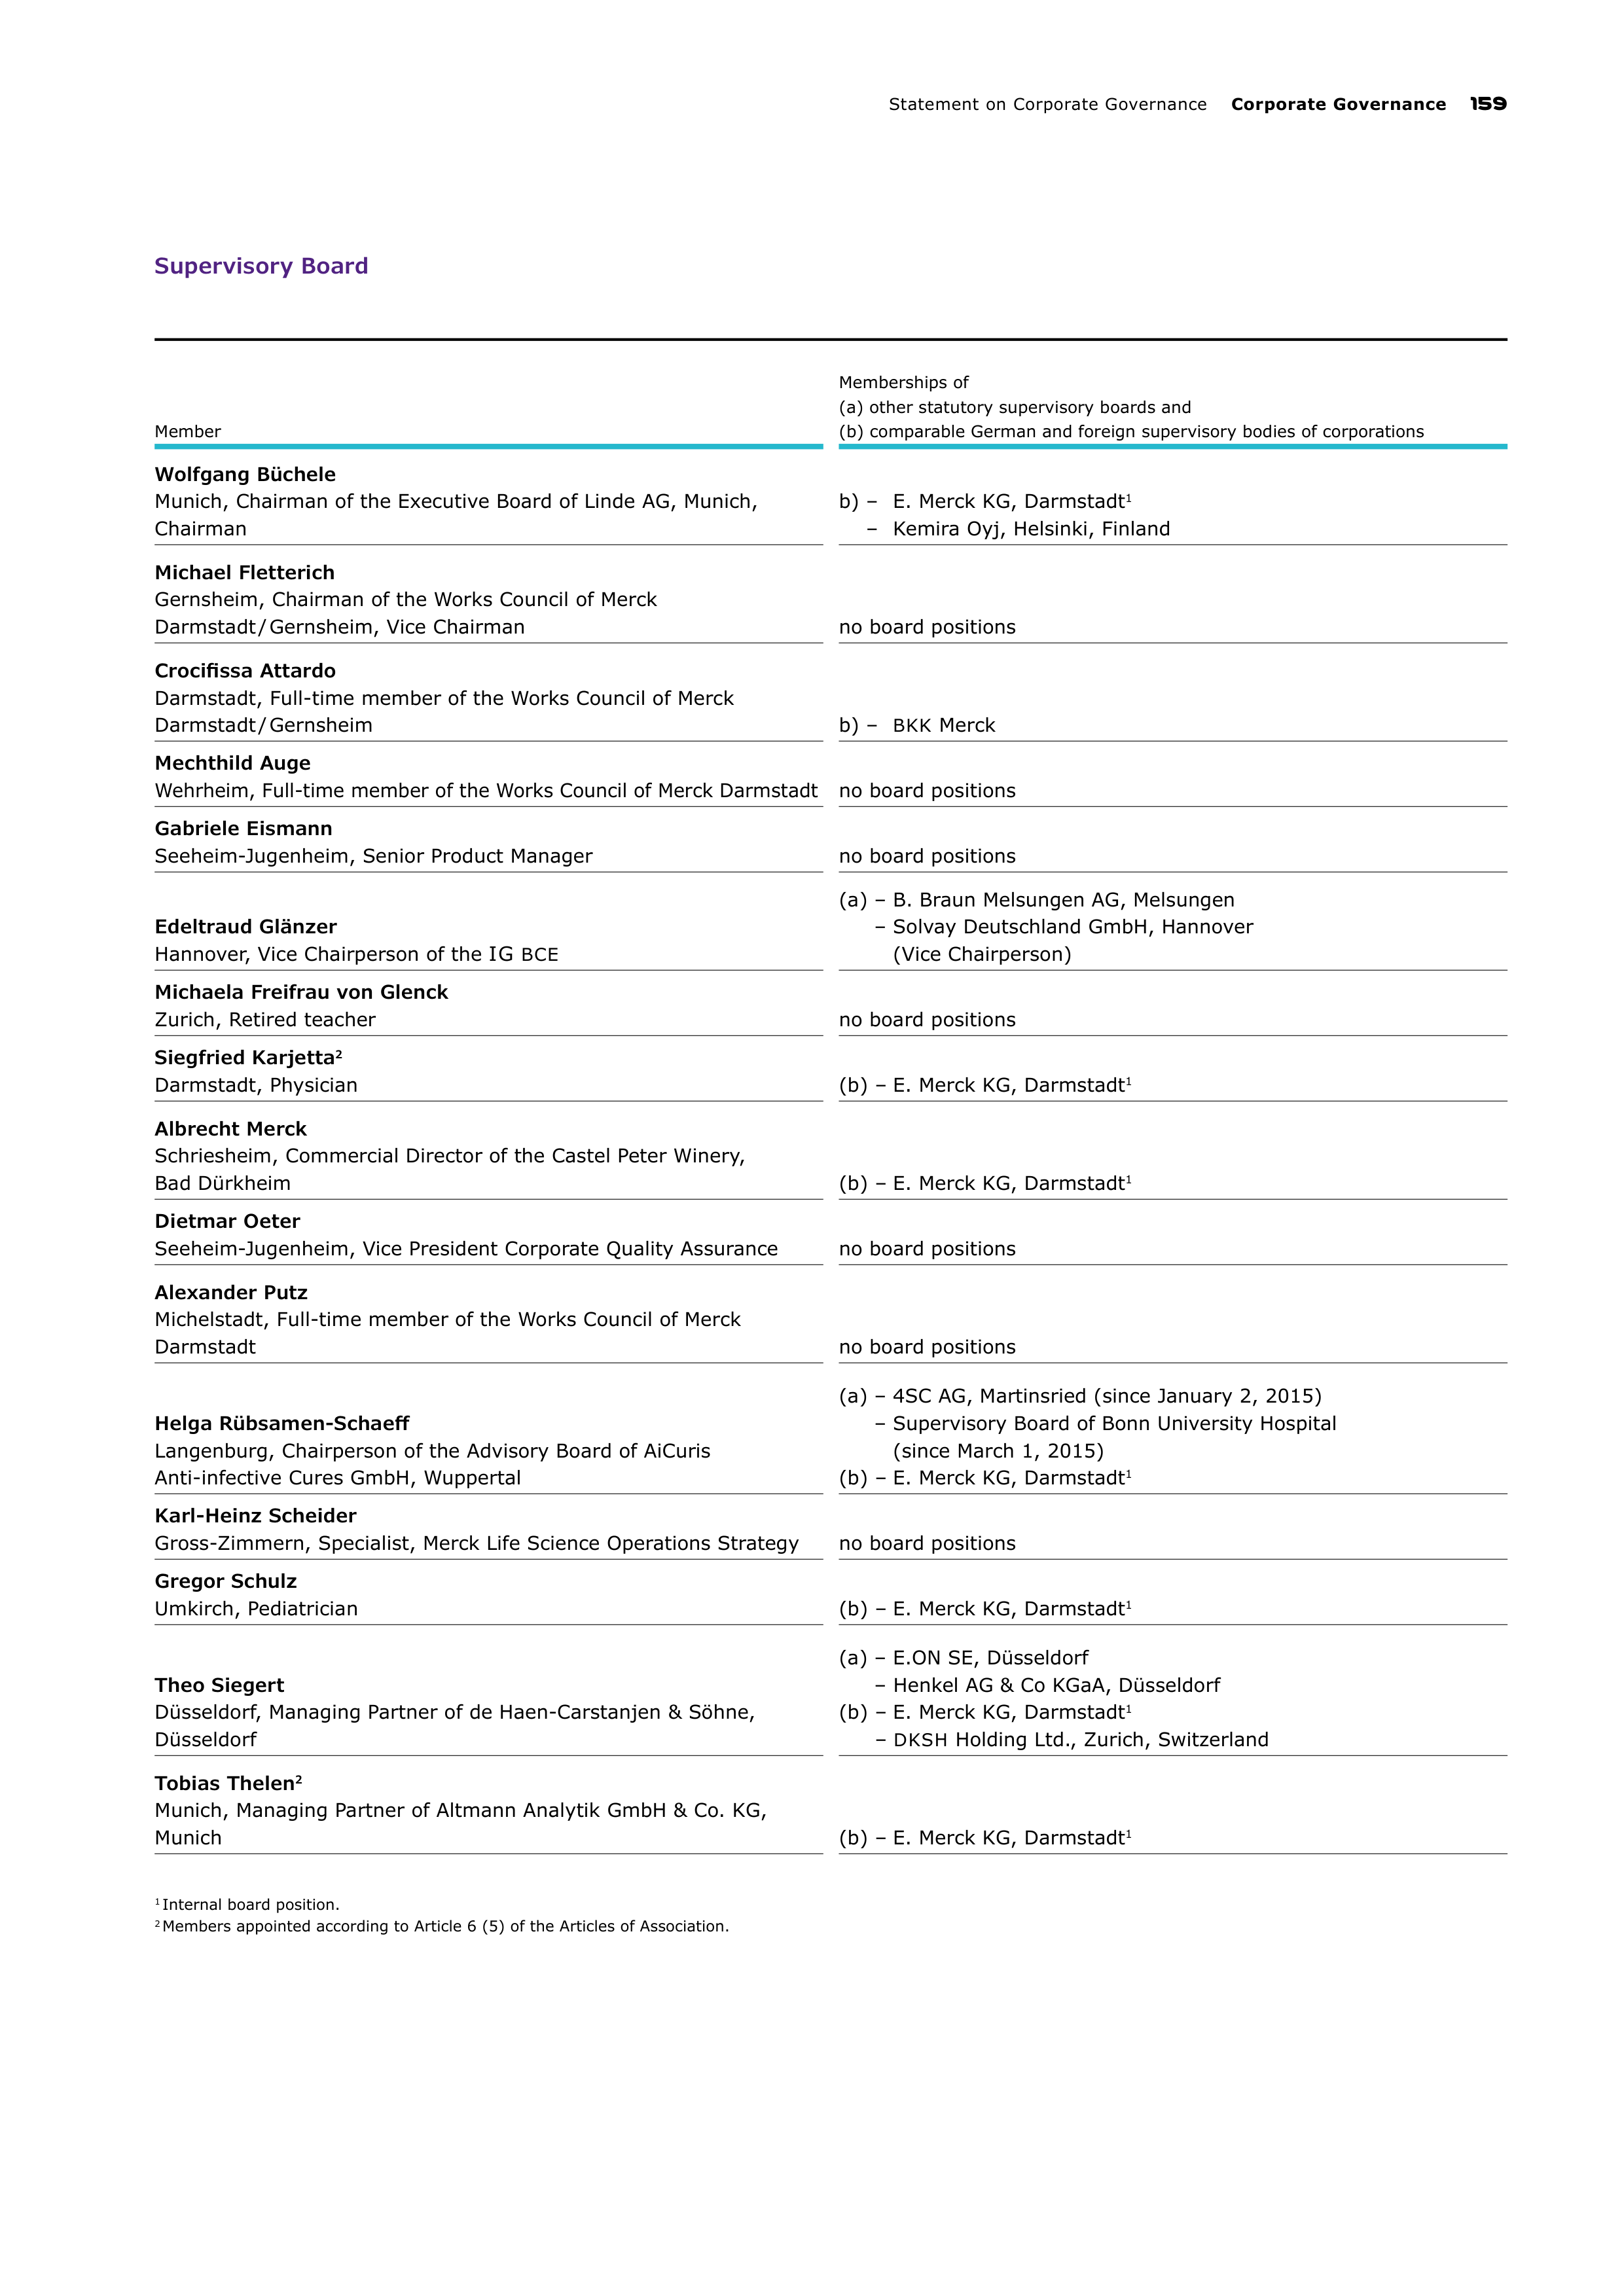
Statement on Corporate Governance
Corporate Governance
159
Supervisory Board
Member
Memberships of
(a) other statutory supervisory boards and
(b) comparable German and foreign supervisory bodies of corporations
Wolfgang Büchele
Munich, Chairman of the Executive Board of Linde AG, Munich,
Chairman
b) –
E. Merck KG, Darmstadt
1
–
Kemira Oyj, Helsinki, Finland
Michael Fletterich
Gernsheim, Chairman of the Works Council of Merck
Darmstadt / Gernsheim, Vice Chairman
no board positions
Crocifissa Attardo
Darmstadt, Full-time member of the Works Council of Merck
Darmstadt / Gernsheim
b) –
BKK
Merck
Mechthild Auge
Wehrheim, Full-time member of the Works Council of Merck Darmstadt
no board positions
Gabriele Eismann
Seeheim-Jugenheim, Senior Product Manager
no board positions
Edeltraud Glänzer
Hannover, Vice Chairperson of the
IG
BCE
(a) – B. Braun Melsungen AG, Melsungen
– Solvay Deutschland GmbH, Hannover
(Vice Chairperson)
Michaela Freifrau von Glenck
Zurich, Retired teacher
no board positions
Siegfried Karjetta
2
Darmstadt, Physician
(b) – E. Merck KG, Darmstadt
1
Albrecht Merck
Schriesheim, Commercial Director of the Castel Peter Winery,
Bad Dürkheim
(b) – E. Merck KG, Darmstadt
1
Dietmar Oeter
Seeheim-Jugenheim, Vice President Corporate Quality Assurance
no board positions
Alexander Putz
Michelstadt, Full-time member of the Works Council of Merck
Darmstadt
no board positions
Helga Rübsamen-Schaeff
Langenburg, Chairperson of the Advisory Board of AiCuris
Anti-infective Cures GmbH, Wuppertal
(a) – 4SC AG, Martinsried (since January 2, 2015)
– Supervisory Board of Bonn University Hospital
(since March 1, 2015)
(b) – E. Merck KG, Darmstadt
1
Karl-Heinz Scheider
Gross-Zimmern, Specialist, Merck Life Science Operations Strategy
no board positions
Gregor Schulz
Umkirch, Pediatrician
(b) – E. Merck KG, Darmstadt
1
Theo Siegert
Düsseldorf, Managing Partner of de Haen-Carstanjen & Söhne,
Düsseldorf
(a) – E.ON SE, Düsseldorf
– Henkel AG & Co KGaA, Düsseldorf
(b) – E. Merck KG, Darmstadt
1
–
DKSH
Holding Ltd., Zurich, Switzerland
Tobias Thelen
2
Munich, Managing Partner of Altmann Analytik GmbH & Co. KG,
Munich
(b) – E. Merck KG, Darmstadt
1
1
Internal board position.
2
Members appointed according to Article 6 (5) of the Articles of Association.
160
Corporate Governance
Statement on Corporate Governance
The Supervisory Board performs a monitoring function. It
supervises the management of the company by the Executive
Board. In comparison with the supervisory board of a German
stock corporation, the role of the supervisory board of a cor
poration with general partners (KGaA) is limited. This is due to
the fact that the members of the Executive Board are person
ally liable partners and therefore are themselves responsible
for the management of the company. In particular, the Super
visory Board is not responsible for appointing and dismissing
general partners or for regulating the terms and conditions of
their contracts. This is the responsibility of E. Merck KG. Nor
does the Supervisory Board have the authority to issue rules
of procedure for the Executive Board or a catalogue of busi
ness transactions requiring approval. This authority likewise
belongs to E. Merck KG (Article 13 (3) sentence 1 and (4) sen
tence 1 of the Articles of Association). However, the fact that
the Supervisory Board has no possibilities to directly influence
the Executive Board restricts neither its information rights nor
audit duties. The Supervisory Board must monitor the Execu
tive Board in terms of legality, regularity, usefulness, and eco
nomic efficiency. In particular, the Supervisory Board has the
duty to examine the reports provided by the Executive Board.
This includes regular reports on the intended business policy,
as well as other fundamental issues pertaining to corporate
planning, especially financial, investment and HR planning;
the profitability of the Merck Group; the progress of business;
the risk situation; risk management (including compliance);
and the internal auditing system. In addition, by means of
consultation with the Executive Board, it creates the basis for
supervision of the management of the company by the Super
visory Board according to section 111 (1) of the German Stock
Corporation Act (AktG).
The Supervisory Board examines the annual financial
statements as well as the consolidated financial statements
and the combined management report, taking into account in
each case the reports of the auditor. Moreover, the Supervi
sory Board discusses the quarterly reports and the half-year
financial report, taking into account in the latter case the
report of the auditor on the audit review of the abridged finan
cial statements and the interim management report of the
Group. The adoption of the annual financial statements is not
the responsibility of the Supervisory Board, but of the General
Meeting. The Supervisory Board normally meets four times a
year. Further meetings may be convened if requested by a
member of either the Supervisory Board or the Executive
Board. As a rule, resolutions of the Supervisory Board are
passed at meetings. At the instruction of the chairman, in
exceptional cases a resolution may be passed by other means,
details of which are given in the rules of procedure.
The members of the Board of Partners of E. Merck KG and
of the Supervisory Board may be convened to a joint meeting
if so agreed by the chairmen of the two boards.
The rules of procedure prescribe that the Supervisory Board
may form committees as and when necessary. The Supervisory
Board has formed a Nomination Committee comprising three
shareholder representatives. Its members are Albrecht Merck,
Wolfgang Büchele and Theo Siegert. The Nomination Commit
tee is responsible for proposing to the Supervisory Board suit
able candidates for its proposal to the Annual General Meet
ing. Apart from legal requirements and the recommendations
of the German Corporate Governance Code, the ‟Objectives of
the Supervisory Board with respect to its composition” are to
be taken into consideration as well. Owing to the aforemen
tioned limited authority, and since a corresponding need has
not yet arisen, the Supervisory Board currently has no further
committees.
The German Stock Corporation Act prescribes that the
Supervisory Board of a publicly listed company must have at
least one independent member who has professional expertise
in accounting or auditing. Theo Siegert satisfies these require
ments and is furthermore the Chairman of the Finance Com
mittee of the Board of Partners of E. Merck KG.
Board of Partners of E. Merck KG
Some of the responsibilities that lie with the supervisory board
of a German stock corporation are fulfilled at Merck by
E. Merck KG. This applies primarily to the Board of Partners of
E. Merck KG. Therefore, the Board of Partners and the compo
sition and procedures of its committees are described in the
following.
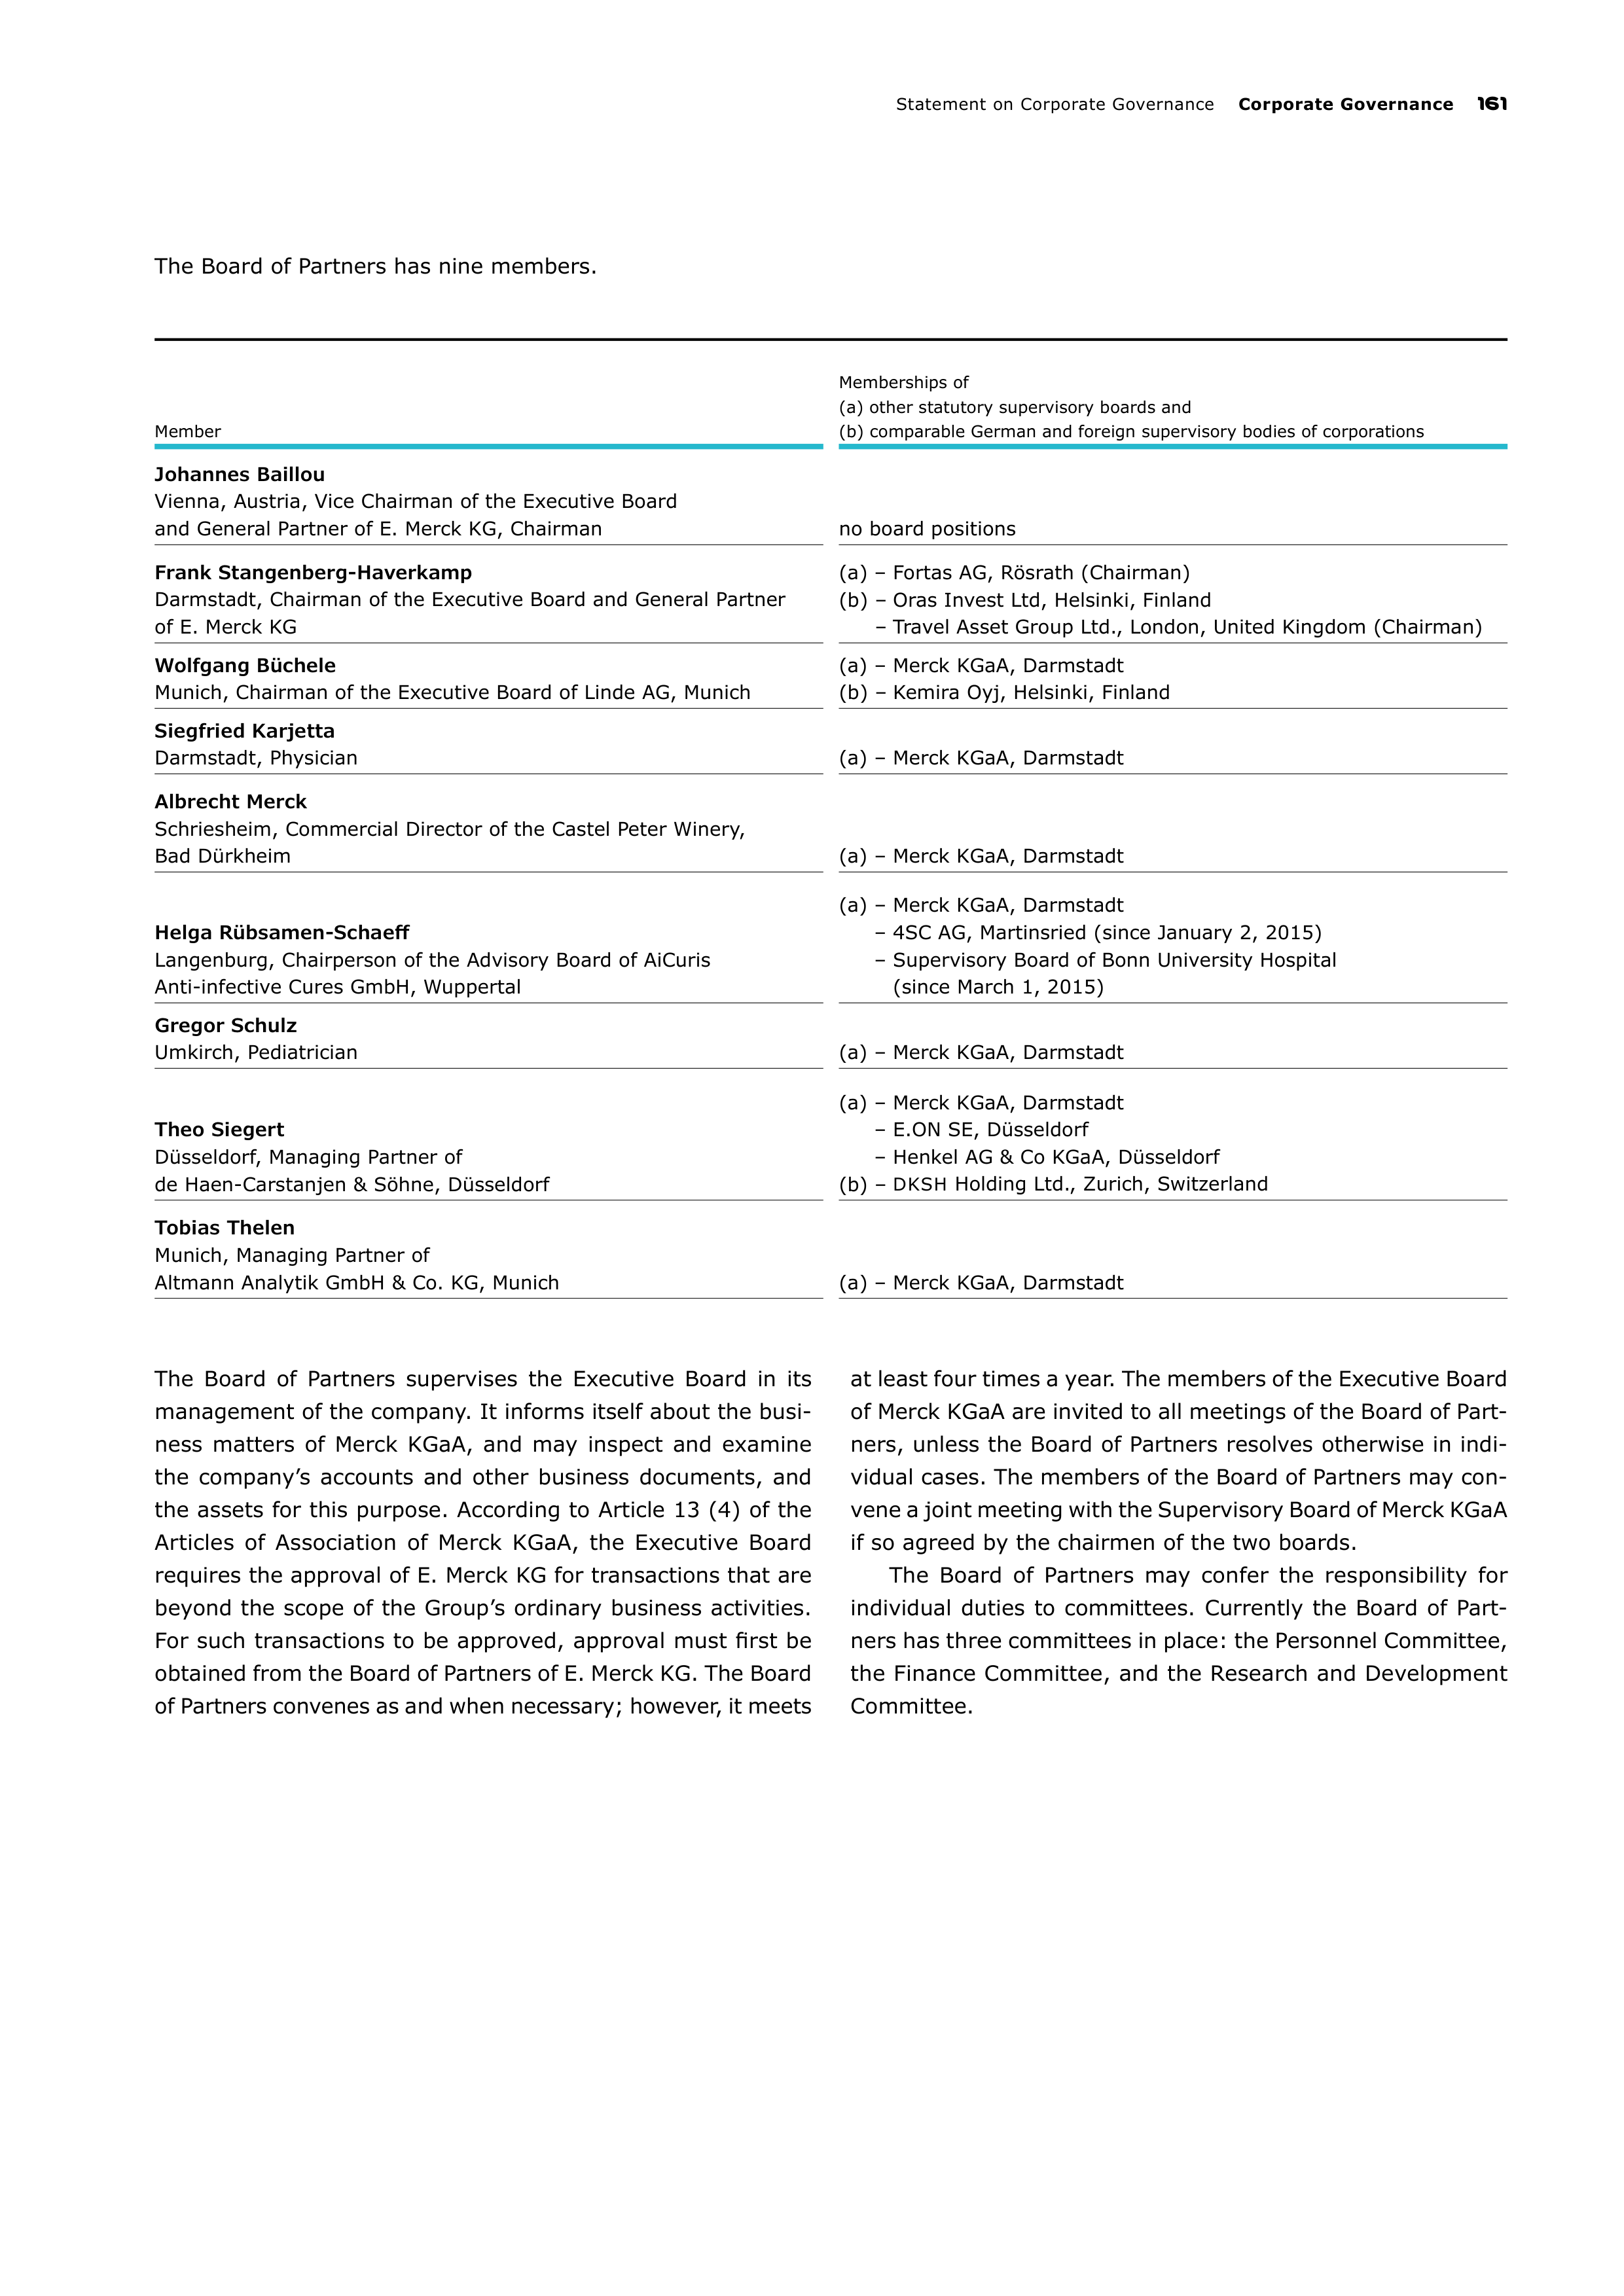
Statement on Corporate Governance
Corporate Governance
161
The Board of Partners has nine members.
Member
Memberships of
(a) other statutory supervisory boards and
(b) comparable German and foreign supervisory bodies of corporations
Johannes Baillou
Vienna, Austria, Vice Chairman of the Executive Board
and General Partner of E. Merck KG, Chairman
no board positions
Frank Stangenberg-Haverkamp
Darmstadt, Chairman of the Executive Board and General Partner
of E. Merck KG
(a) – Fortas AG, Rösrath (Chairman)
(b) – Oras Invest Ltd, Helsinki, Finland
– Travel Asset Group Ltd., London, United Kingdom (Chairman)
Wolfgang Büchele
Munich, Chairman of the Executive Board of Linde AG, Munich
(a) – Merck KGaA, Darmstadt
(b) – Kemira Oyj, Helsinki, Finland
Siegfried Karjetta
Darmstadt, Physician
(a) – Merck KGaA, Darmstadt
Albrecht Merck
Schriesheim, Commercial Director of the Castel Peter Winery,
Bad Dürkheim
(a) – Merck KGaA, Darmstadt
Helga Rübsamen-Schaeff
Langenburg, Chairperson of the Advisory Board of AiCuris
Anti-infective Cures GmbH, Wuppertal
(a) – Merck KGaA, Darmstadt
– 4SC AG, Martinsried (since January 2, 2015)
– Supervisory Board of Bonn University Hospital
(since March 1, 2015)
Gregor Schulz
Umkirch, Pediatrician
(a) – Merck KGaA, Darmstadt
Theo Siegert
Düsseldorf, Managing Partner of
de Haen-Carstanjen & Söhne, Düsseldorf
(a) – Merck KGaA, Darmstadt
– E.ON SE, Düsseldorf
– Henkel AG & Co KGaA, Düsseldorf
(b) –
DKSH
Holding Ltd., Zurich, Switzerland
Tobias Thelen
Munich, Managing Partner of
Altmann Analytik GmbH & Co. KG, Munich
(a) – Merck KGaA, Darmstadt
The Board of Partners supervises the Executive Board in its
management of the company. It informs itself about the busi
ness matters of Merck KGaA, and may inspect and examine
the company’s accounts and other business documents, and
the assets for this purpose. According to Article 13 (4) of the
Articles of Association of Merck KGaA, the Executive Board
requires the approval of E. Merck KG for transactions that are
beyond the scope of the Group’s ordinary business activities.
For such transactions to be approved, approval must first be
obtained from the Board of Partners of E. Merck KG. The Board
of Partners convenes as and when necessary; however, it meets
at least four times a year. The members of the Executive Board
of Merck KGaA are invited to all meetings of the Board of Part
ners, unless the Board of Partners resolves otherwise in indi
vidual cases. The members of the Board of Partners may con
vene a joint meeting with the Supervisory Board of Merck KGaA
if so agreed by the chairmen of the two boards.
The Board of Partners may confer the responsibility for
individual duties to committees. Currently the Board of Part
ners has three committees in place: the Personnel Committee,
the Finance Committee, and the Research and Development
Committee.
162
Corporate Governance
Statement on Corporate Governance
Personnel Committee
The Personnel Committee has four members. These are
Johannes Baillou (Chairman since February 9, 2015), Frank
Stangenberg-Haverkamp (Chairman until February 9, 2015),
Wolfgang Büchele, and Theo Siegert.
The Personnel Committee meets at least twice a year. Fur
ther meetings are convened as and when necessary. Meetings
of the Personnel Committee are attended by the Chairman of
the Executive Board of Merck KGaA unless the Committee
decides otherwise.
The Personnel Committee is responsible for, among other
things, the following decisions concerning members and for
mer members of the Executive Board: contents of and entry
into employment contracts and pension contracts, granting of
loans and advance payments, changes to the compensation
structure and adaptation of compensation, approval for taking
on honorary offices, board positions and other sideline activi
ties, as well as division of responsibilities within the Executive
Board of Merck KGaA. The Personnel Committee passes its
resolutions by a simple majority – in matters concerning the
Chairman of the Executive Board unanimity is required. The
Chairman of the Committee regularly informs the Board of
Partners of its activities.
Finance Committee
The Finance Committee has four members. These are Theo
Siegert (Chairman), Johannes Baillou, Wolfgang Büchele, and
Tobias Thelen.
The Finance Committee holds at least four meetings a
year, at least one of which is a joint meeting with the auditor
of Merck KGaA. Further meetings are convened as and when
necessary. Meetings of the Finance Committee are attended
by the Chief Financial Officer of Merck KGaA. Other members
of the Executive Board of Merck KGaA may attend the meet
ings upon request by the Finance Committee. These meetings
regularly include the Chairman of the Executive Board. The
Finance Committee is responsible for, among other things,
analyzing and discussing the annual financial statements, the
consolidated financial statements and the respective reports
of the auditor, as well as the half-year financial report (includ
ing the report of the auditors for the audit review of the
abridged financial statements and interim management report
contained in the half-year report) and the quarterly reports.
Moreover, the Finance Committee recommends to the Chair
man of the Supervisory Board annual audit focuses for the
auditors of the annual financial statements. It also recom
mends to the Supervisory Board an auditor for the annual
financial statements as well as auditors for the audit review of
the abridged financial statements and interim management
report contained in the half-year financial report for the Super
visory Board’s corresponding suggestion to the General Meet
ing. In addition, the Finance Committee is concerned with the
net assets, financial position, results of operations and liquid
ity of Merck, as well as accounting, internal auditing, risk man
agement and compliance issues. Upon request of the Board of
Partners, the Finance Committee examines investment pro
jects that must be approved by the Board of Partners and
provides recommendations pertaining thereto.
Research and Development Committee
The Research and Development Committee has four members.
These are Helga Rübsamen-Schaeff (Chairperson), Johannes
Baillou, Siegfried Karjetta, and Gregor Schulz.
The Research and Development Committee is convened as
and when necessary, but holds at least two meetings a year.
Meetings of the Research and Development Committee are
attended by members of the Executive Board of Merck KGaA
upon request of the Committee. These meetings regularly
include the Chairman of the Executive Board as well as the
CEO
Healthcare and the
CEO
Life Science / Performance Materials.
The Research and Development Committee is responsible,
among other things, for reviewing and discussing the research
activities of Healthcare and/or Life Science / Performance
Materials business sectors. The Chairperson of the Committee
reports to the Board of Partners on the insights gained from
the meetings held.
Statement on Corporate Governance
Corporate Governance
163
Stipulations to promote the percent-
age of management positions held
by women pursuant to section 76 (4)
and section 111 (5) AktG (German
Stock Corporation Act)
Stipulations pursuant to section 76 (4) AktG (target
for
the percentage of positions held by women on the two
upper management levels below the Executive Board)
We foster diversity within the company, which also includes
ensuring a balance of genders in management. To this end, we
pursue both voluntary and statutory objectives, and we work
continuously and sustainably on achieving them.
Pursuant to section 76 (4) AktG, the management body of
companies that are listed or subject to co-determination are
required to set binding targets for the percentage of positions
held by women on the two management levels below the man
agement body.
In September 2015, the Executive Board of Merck KGaA
set the following targets for the percentage of positions held
by women on the two management levels below the Executive
Board:
•
First management level below the Executive Board: 21% of
positions held by women
•
Second management level below the Executive Board: 21%
of positions held by women
The targets relate to the percentage of positions held by
women on the respective management level as of Septem
ber 30, 2015 and correspond to the current status. This natu
rally does not exclude an increase in the percentage of positions
held by women on these management levels. The deadline set
by the Executive Board of Merck KGaA for reaching this target
ends on December 31, 2016.
In addition, as a global company with correspondingly
aligned global (management) structures, Merck is continuing
to pursue the (voluntary) target of 25% to 30% of manage
ment positions held by women (Global Grade 14 and up; see
page 83 ‟Diversity enriches our management team”.
Stipulations pursuant to section 111 (5) AktG (target
for the percentage of positions on the Supervisory
Board held by women)
Pursuant to section 111 (5) AktG, the Supervisory Board of
companies that are listed or subject to co-determination stip
ulates binding targets for the percentage of positions on the
Supervisory Board and on the Management Board held by
women. However, for Merck KGaA, stipulations pursuant to
section 111 (5) AktG need not be set for the following reasons:
The statutory target of 30% pursuant to section 96 (2) AktG
is already applied on the Supervisory Board of Merck KGaA.
This eliminates the obligation to stipulate a further target for
the percentage of positions held by women on the Supervisory
Board (see section 111 (5) sentence 5 AktG).
The obligation to stipulate a target for the percentage of
positions held by women on the Management Board pursuant
to section 111 (5) AktG is not applicable to the legal form of a
corporation with general partners (Kommanditgesellschaft auf
Aktien) as a corporation with general partners does not have a
management board comparable to that of a stock corporation
with personnel authority of the supervisory board, but has an
executive board consisting of personally liable partners (see
also pages 159/160 for the description of Supervisory Board
procedures).
164
Corporate Governance
Report of the Supervisory Board
REPORT OF THE SUPERVISORY BOARD
The Supervisory Board again properly executed its duties in
2015 in accordance with the law as well as the company’s
Articles of Association and rules of procedure. In particular,
the Supervisory Board monitored the work of the Executive
Board diligently and regularly.
Cooperation with the Executive Board
The cooperation with the Executive Board was characterized
by intensive, trustworthy exchange. During fiscal 2015, the
Executive Board provided the Supervisory Board with regular
written and verbal reports on the business development of
Merck KGaA and the Merck Group. In particular, the Supervi
sory Board was informed about the market and sales situation
of the company against the background of macroeconomic
development, the financial position of the company and its
subsidiaries, along with their earnings development, as well as
corporate planning. Within the scope of quarterly reporting,
the sales and operating results were presented for the Merck
Group as a whole, and broken down by business sector. Aside
from the Supervisory Board meetings, the Chairman of the
Supervisory Board also maintained and continues to maintain
a regular exchange of information with the Chairman of the
Executive Board.
Key topics of the Supervisory Board meetings
Four Supervisory Board meetings were held in fiscal 2015. At
these meetings, the Supervisory Board discussed the reports of
the Executive Board in detail and discussed company develop
ments and strategic issues together with the Executive Board.
At the meeting held on February 27, 2015, the Executive
Board first reported on business performance during 2014.
In
addition, the Supervisory Board intensively addressed the
annual financial statements and consolidated financial state
ments for 2014 and the corresponding management reports.
The auditor explained the audit report. The Executive Board
reported on the financial statements. Furthermore, the Super
visory Board resolved upon the Statement of Compliance with
the German Corporate Governance Code as well as the State
ment on Corporate Governance, which simultaneously includes
the joint report on Corporate Governance of the Executive
Board and Supervisory Board. The Supervisory Board also
approved the proposals to be made to the General Meeting.
The Executive Board presented the plans for fiscal 2015. Fur
ther topics were the report of Group Internal Auditing and the
status of the Sigma-Aldrich acquisition.
The meeting held on May 13, 2015 focused on current
business developments in the first quarter of 2015. The report
of the Research and Development Committee Life Science /
Performance Materials of the Board of Partners of E. Merck KG
was a further focus of the meeting. The Supervisory Board
also dealt with the report of the Group Compliance Officer, the
report of the Group Data Privacy Officer and a report on
ERP
strategy.
At its meeting on July 29, 2015, the Supervisory Board
focused intensively on the report of the Executive Board on
business performance in the second quarter of 2015. In addi
tion,
KPMG
explained the half-year financial report. Risk man
agement within the company was a further topic. The Head of
Risk Management presented the status report for the first half
of 2015. No risks that threaten the continued existence of the
company were identified.
At its fourth meeting on November 10, 2015, the Supervi
sory Board discussed the results of the efficiency examination
that took place in 2015. Furthermore, the Supervisory Board
dealt with the report of the Executive Board on the third quar
ter of 2015. Additional topics of focus were the 2015 status
reports of Group Internal Auditing and on compliance and data
protection as well as the report of the Research and Develop
ment Committee Healthcare. Furthermore, the Group Execu
tive
Conference and Merck’s current strategic direction were
reported on and discussed.
In addition, on October 13, 2015, the Supervisory Board
members were informed by telephone of Mr. Oschmann’s
appointment as successor to Mr. Kley as Chairman of the Execu
tive Board on April 30, 2016 as well as the launch of the new
Merck branding.
Annual financial statements
The annual financial statements of Merck KGaA, the consoli
dated financial statements of the Merck Group, and the com
bined management report for Merck KGaA and the Merck
Group, including the accounts, were audited by
KPMG AG
Wirtschaftsprüfungsgesellschaft, Berlin. The auditors issued
an unqualified audit opinion on the annual financial state
ments of Merck KGaA in accordance with German Auditing
Standards. For the consolidated financial statements prepared
in accordance with International Financial Reporting Stand
ards, as well as the combined management report, the audi
tors issued the unqualified auditor’s report reproduced in the
Annual Report of the Merck Group. In addition, the auditor
audited the calculation of Merck KGaA’s participation in the
profits of E. Merck KG in accordance with Art. 27 (2) of the
Articles of Association. The annual financial statements of
Merck KGaA, the consolidated financial statements of the
Report of the Supervisory Board
Corporate Governance
165
Merck Group, the combined management report for Merck KGaA
and the Merck Group, and the proposal by the Executive Board
for the appropriation of the net retained profit were presented
and distributed to the Supervisory Board, together with the
auditor’s reports.
In accordance with Art. 14 (2) of the Articles of Association,
the Supervisory Board also examined the annual financial
statements of Merck KGaA, the proposal for the appropriation
of net retained profit and the auditor’s report presented in
accordance with Article 27 (2) of the Articles of Association.
It also examined the consolidated financial statements of
the
Merck Group as well as the combined management report
for Merck KGaA and the Merck Group, and took note of the
auditor’s report of
KPMG
AG
Wirtschaftsprüfungsgesellschaft,
Berlin.
The discussion of the relevant agenda item at the Super
vi
sory Board’s meeting on March 4, 2016 to approve the finan
cial statements was also attended by the auditors who sign the
audit opinion on the annual financial statements of Merck KGaA
and the consolidated financial statements of the Merck Group.
These auditors furthermore reported on their audit at this
meeting.
The Supervisory Board took note of and approved the
results of the audit. On completion of its examination, the
Supervisory Board raised no objections and thus approved the
annual financial statements for Merck KGaA, the consolidated
financial statements of the Merck Group and the combined
management report of Merck KGaA and the Merck Group pre
pared by the Executive Board, as well as the report presented
by the auditor in accordance with Article 27 (2) of the Articles
of Association. Following its own examination of the situation,
the Supervisory Board gave its consent to the proposal of the
Executive Board for the appropriation of net retained profit.
Corporate governance and Statement of Compliance
Corporate governance is a topic of high priority for the Super
visory Board. In its own estimation, the Supervisory Board
has an adequate number of independent members. There
were no conflicts of interest, as defined by the German Corpo
rate Governance Code, involving Supervisory Board members
during 2015. After addressing corporate governance topics in
detail, the Executive Board and Supervisory Board resolved
to
adopt and issue the updated Statement of Compliance on
February 18, 2016 (Executive Board) and on March 4, 2016
(Supervisory Board) and jointly issued it on March 4, 2016 in
accordance with section 161 of the German Stock Corporation
Act. The statement is permanently available on the website of
Merck KGaA (www.merckgroup.com-> Investors ->Corporate
Governance). More information about corporate governance
at Merck KGaA, including the compensation of the Executive
Board and Supervisory Board, is given in the Statement of
Compliance on pages 148 et seq. of the Annual Report.
Committees
Apart from the Nomination Committee, the Supervisory Board
of Merck KGaA currently has no further committees on account
of the special features that apply to the Supervisory Board of
a corporation with general partners (KGaA) under German
company law and because a corresponding need for this has
not emerged to date. The members of the Nomination Com
mittee newly elected on November 11, 2014 did not convene
in fiscal 2015. No report is given on the work of further com
mittees.
Personnel matters
With the exception of Edeltraud Glänzer, who was absent from
the meeting on November 10, 2015, all the Supervisory Board
members attended all the Supervisory Board meetings. There
were no changes in the composition of the Supervisory Board
in 2015.
Darmstadt, March 4, 2016
The Supervisory Board of Merck KGaA
Wolfgang Büchele
Chairman
166
Corporate Governance
Objectives of the Supervisory Board with respect to its composition
OBJECTIVES OF THE SUPERVISORY BOARD
WITH RESPECT TO ITS COMPOSITION
Initial situation
According to section 5.4.1 (2) and (3) of the German Corpo
rate Governance Code, the Supervisory Board shall specify
concrete objectives regarding its composition which, while
considering the specifics of the enterprise, take into account
the international activities of the enterprise, potential conflicts
of interest, the number of independent Supervisory Board
members, an age limit to be specified for Supervisory Board
members and a regular limit on the length of Supervisory
Board membership to be specified, as well as diversity.
General notes on the composition of the Supervisory
Board
The Supervisory Board of Merck KGaA currently consists of
16 members, eight of whom represent the shareholders and
a further eight who represent the employees. The eight
employee representative members are elected by employee
delegates pursuant to the provisions of the German Codeter
mination Act (Mitbestimmungsgesetz ‟MitbestG”). These con
sist of six company employees, including a senior executive,
as well as two union representatives. The Supervisory Board
has no statutory proposal right with respect to electing the
delegates or employee representatives. Owing to a delegation
right of E. Merck Beteiligungen KG, two of the eight share
holder representatives are specified. The Supervisory Board
likewise has no statutory proposal right with respect to exer
cising this delegation right. The remaining six shareholder
representatives are elected by the General Meeting. In accord
ance with section 124 (3) sentence 1 AktG, the Supervisory
Board shall propose to the General Meeting Supervisory Board
members for election. These proposals require a majority of
the votes of the shareholder representative members of the
Supervisory Board. The next scheduled election to the Super
visory Board shall take place at the 2019 General Meeting. The
General Meeting is not required to follow the election propos
als. The appointment objectives that the Supervisory Board
sets forth below therefore do not represent requirements to be
met by those eligible to elect or to delegate members. Instead,
they are intended to express the objectives pursued by the
Supervisory Board in office with regard to its advisory and
monitoring functions.
Objectives of the Supervisory Board with respect to its
composition
In accordance with section 5.4.1 (2) of the German Corporate
Governance Code, the Supervisory Board has specified the fol
lowing objectives with respect to its composition and reports
on the status of their implementation below.
Expertise and diversity
Professional qualifications and personal expertise are the two
most important prerequisites for appointments to seats on the
Supervisory Board. When proposing Supervisory Board candi
dates for election or delegation, the Supervisory Board will
always give top priority to these prerequisites, which are
essential for fulfilling its legal duties.
Overall, the Supervisory Board’s policy is to optimally meet
its monitoring and advisory duties by having diversity among
its members. Diversity includes, in particular, internationality
as well as different experience backgrounds and career paths.
The proportion of women on the Supervisory Board is also
considered to be an aspect of diversity. When preparing pro
posals for election or delegation, due consideration shall be
given in individual cases to the extent to which different, yet
complementary professional profiles, career and life experi
ences, as well as appropriate representation of both genders
can benefit the work of the Supervisory Board. Additionally,
the Supervisory Board shall support the Executive Board in its
efforts to increase diversity within the company.
In-depth knowledge of the fields relevant to the company
The Supervisory Board shall have at least four members with
in-depth knowledge and experience of fields that are impor
tant to the company, including at least one expert for the
Healthcare and Life Science / Performance Materials sectors,
respectively.
Merck is currently meeting this objective for the composi
tion of the Supervisory Board. At present, the Supervisory
Board has more than four members who have in-depth knowl
edge and experience of the Healthcare and Life Science /
Performance Materials sectors. More than four Supervisory
Board members also have executive experience in companies
that also or specifically operate in the Healthcare and Life
Science / Performance Materials sectors.
Objectives of the Supervisory Board with respect to its composition
Corporate Governance
167
Management experience
The Supervisory Board shall have at least three members
who
have experience in managing or supervising a medium-
or
large-sized company.
The Supervisory Board has more than three members who
have the corresponding experience. This includes both Super
visory Board members who were or still are management
board members or directors in such companies, as well as
Supervisory Board members who have gained experience in
supervisory bodies of German and / or foreign companies of
this size.
Family-owned company
The Supervisory Board shall have at least one member who
has experience in managing medium- or large-sized family
owned companies.
The Supervisory Board currently has multiple members
who have the appropriate management experience in family
owned companies of this size.
Internationality
The Supervisory Board shall have at least three members with
business experience in the main sales markets of Merck KGaA.
Currently, the main sales markets of Merck KGaA are Europe,
North and Latin America, and Asia-Pacific.
The present composition of the Supervisory Board satisfies
this objective. More than three Supervisory Board members
have entrepreneurial experience in Europe, covering a wide
range of countries. More than three Supervisory Board mem
bers have experience in management positions in companies
that operate globally.
Women on the Supervisory Board
Six women are currently members of the Supervisory Board
of
Merck KGaA. This corresponds to 37.5% of the Supervisory
Board. When nominating candidates for election to the Super
visory Board or making proposals for delegation, the Supervi
sory Board shall examine whether the percentage of women
can be increased by suitable candidates.
The Supervisory Board currently consists of 37.5% women,
which it considers a satisfactory percentage. This is based on
both the percentage of women in management positions at
Merck, as well as the fact that the supervisory boards of other
companies have a comparable percentage of women.
Number of independent members / no material conflicts
of interest
The Supervisory Board shall have an adequate number of
independent members. Assuming that the status of being an
employee representative per se does not justify doubts with
respect to the independence criteria within the meaning of
section 5.4.2 of the German Corporate Governance Code,
nor
mally all employee representatives should be independent
within the meaning of the Code. In any case, at least four of
the shareholder representatives on the Supervisory Board
should be independent. According to the Articles of Associa
tion of Merck KGaA, six members representing the share
holders are to be elected by the General Meeting and two
members are to be delegated. Taking this into account, the
Supervisory Board considers four shareholder representatives
to be an appropriate number of independent members. In the
Supervisory Board’s estimation, the objectives concerning
independent members are currently met. In particular, the
Supervisory Board does not believe that membership of the
Board of Partners of E. Merck KG conflicts with independence.
The Board of Partners exists complementary to the competen
cies and the activities of the Supervisory Board. It is not to be
expected that this will lead to material and not merely tempo
rary conflicts of interest. It should also be taken into account
that due to its substantial capital investment and unlimited
personal liability, E. Merck KG has a strong interest in the busi
nesses of Merck KGaA operating efficiently and in compliance
with procedures, counteracting from the outset conflicts of
interest between E. Merck KG and Merck KGaA and thus also
corresponding conflicts of interest between the members of the
respective corporate bodies.
Moreover, no one shall be proposed for election to the
Supervisory Board who simultaneously serves on a body of
or advises a major competitor of the company, or owing to
another function, e.g. advisor to major contract partners of
the company, could potentially become involved in a conflict
of interest. No Supervisory Board member serves on a body
of or advises a major competitor. No Supervisory Board mem
ber performs a function that could lead to a lasting conflict of
interest.
168
Corporate Governance
Objectives of the Supervisory Board with respect to its composition
No age limit or maximum length of membership
An age limit or a regular limit on the length of membership for
Supervisory Board members is not specified since age and
length of membership are not criteria for qualifications and
expertise. Moreover, we do not wish to forego the many years
of experience of Supervisory Board members. Crucial to the
successful work of the Supervisory Board is a good balance
among Supervisory Board members in terms of age and length
of membership.
The achievement of the aforementioned objectives shall be
pursued initially until 2017, taking into account applicable law
within the scope of elections and re-elections, delegations as
well as court appointments of replacement members if these
become necessary. All Supervisory Board members will corre
spondingly influence those eligible to elect or delegate. Taking
into consideration the aforementioned criteria and in accor
d
ance with its duties under German stock corporation law, the
Supervisory Board proposes to the General Meeting the candi
dates it believes to be best suited in each case and will con
tinue to do so in the future.
Every year, the Supervisory Board will provide information in
the Annual Report on the status of implementing its objectives.
04
Consolidated
Financial
Statements
pages 169 – 257
172
Consolidated Income Statement
173
Consolidated Statement of Comprehensive Income
174
Consolidated Balance Sheet
175
Consolidated Cash Flow Statement
176
Consolidated Statement of Changes in Net Equity
178
Notes to the Group Accounts
Consolidated
Financial
Statements
pages 169 – 257

To download the tables in the consolidated
financial statements as Excel files, please
use the following link:
ar2015.merckgroup.com/downloads
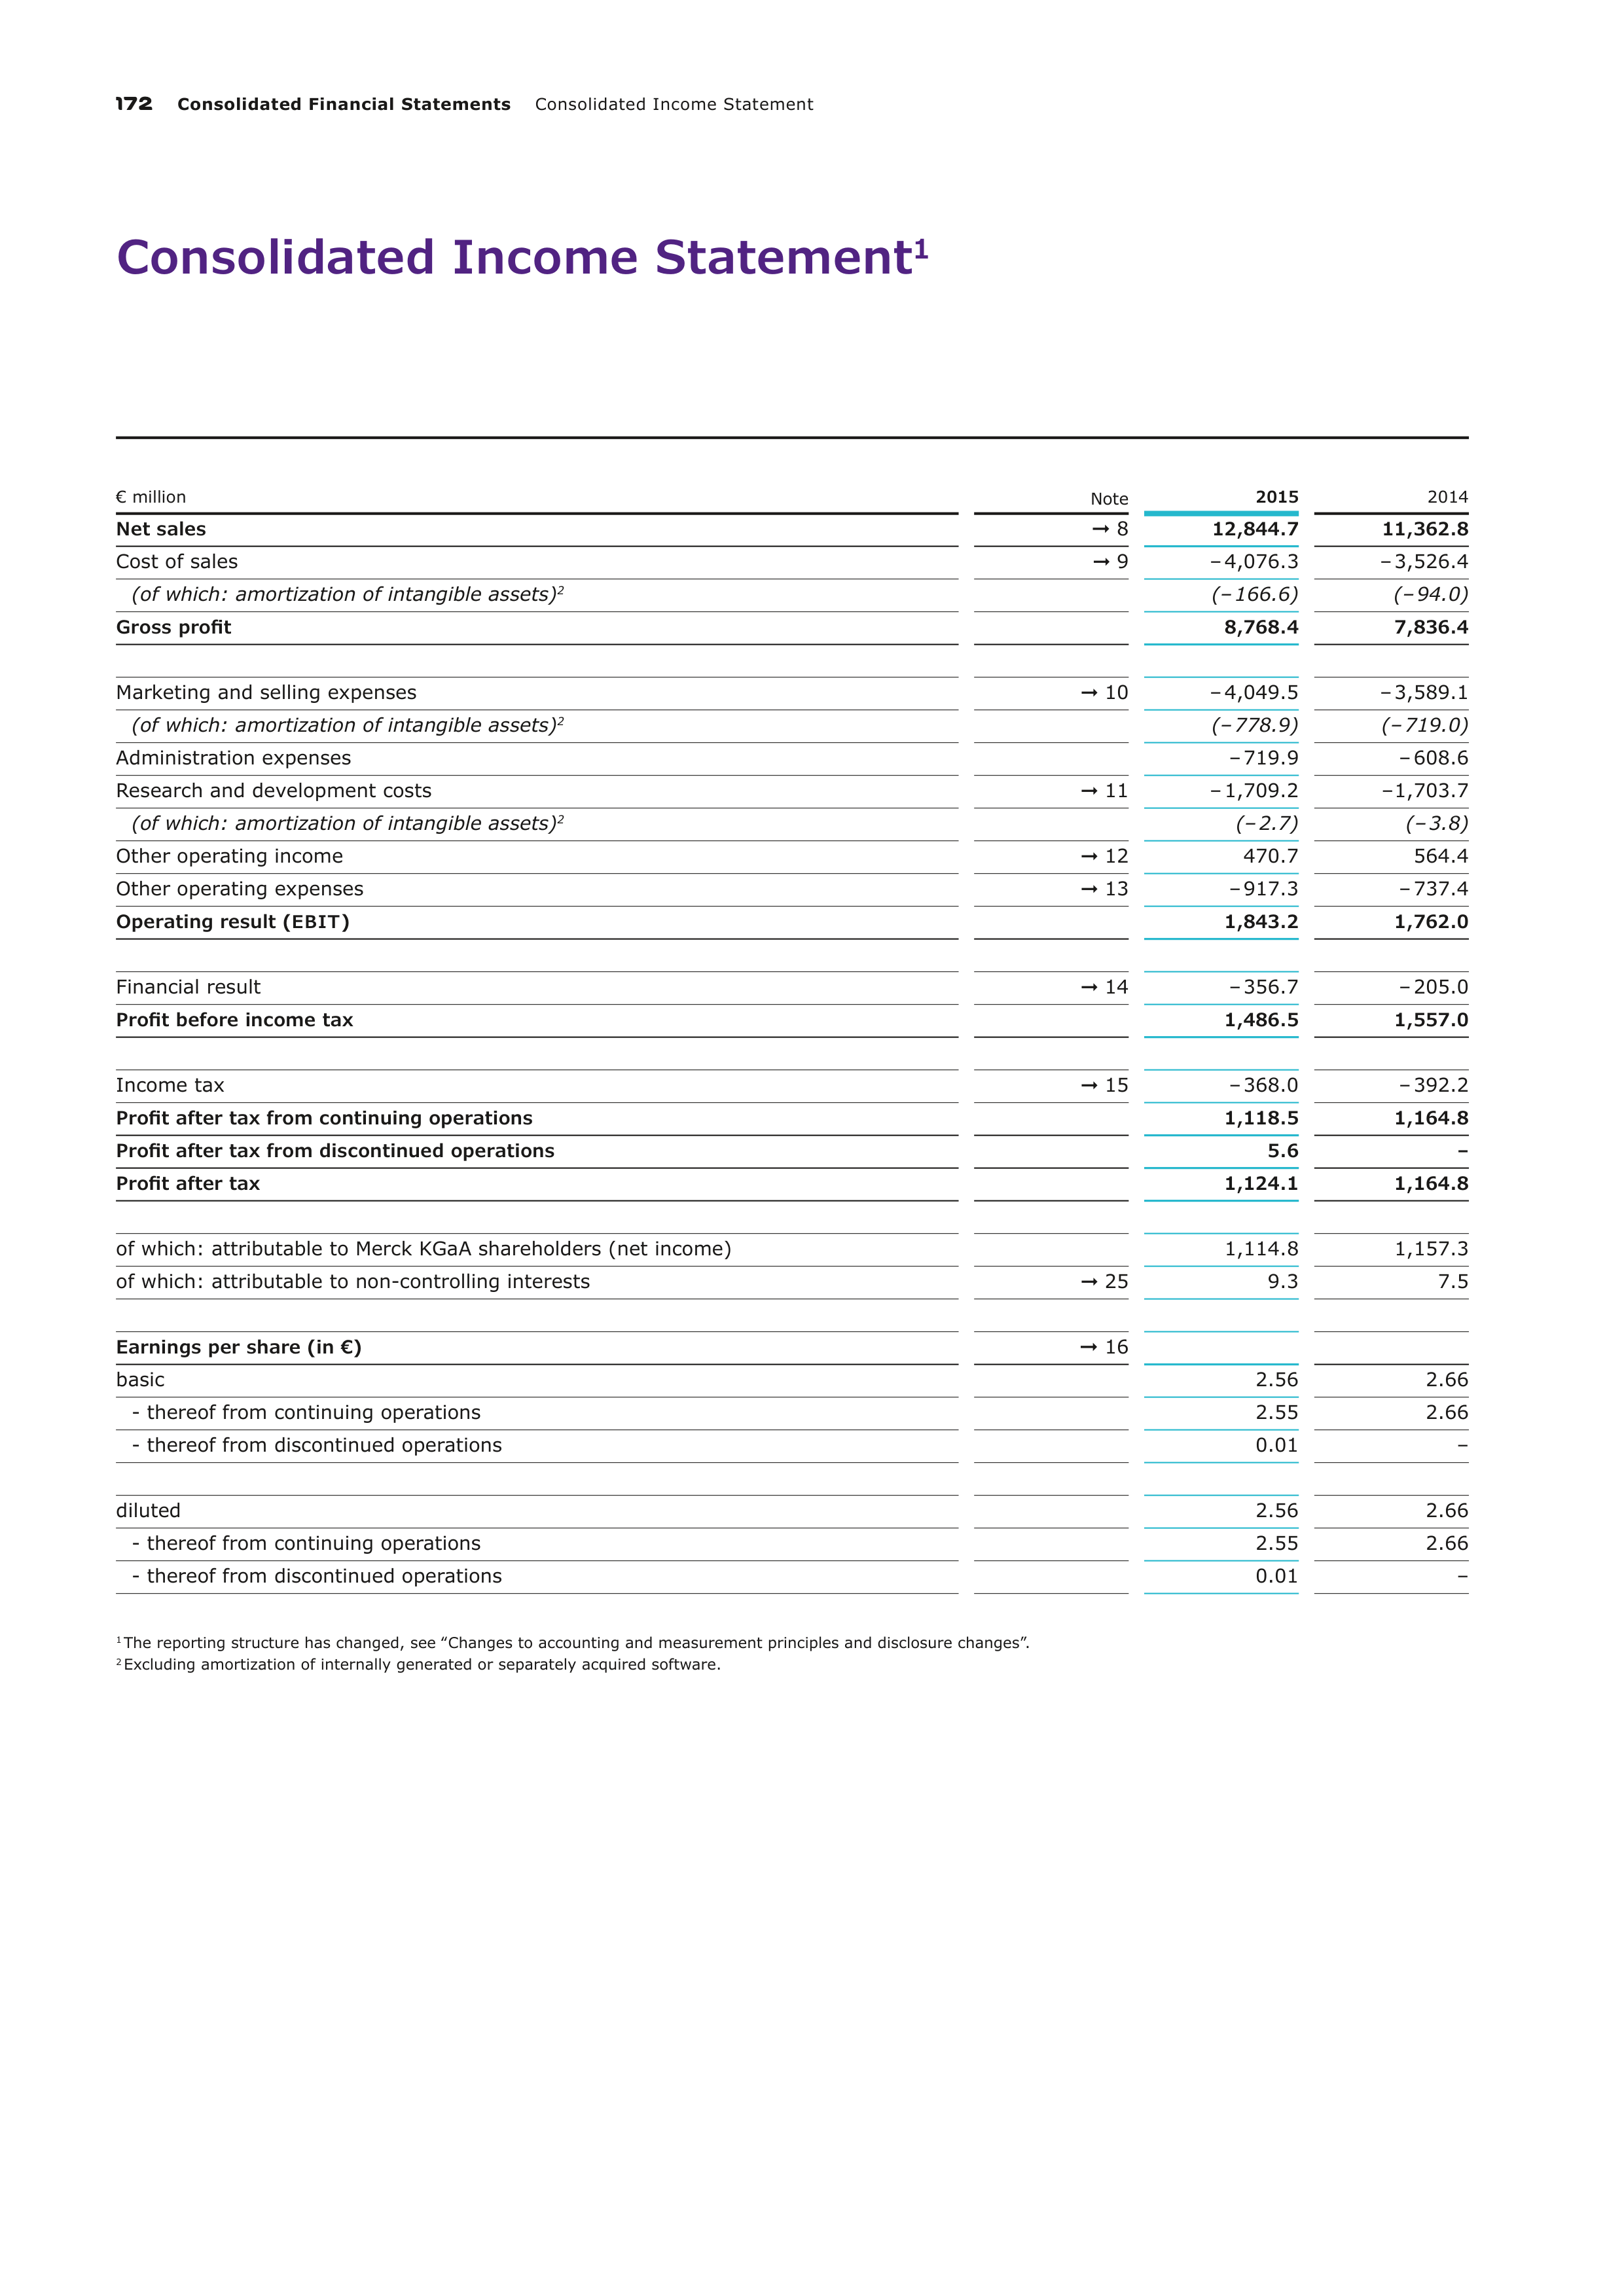
172
Consolidated Financial Statements
Consolidated Income Statement
Consolidated Income Statement
1
€ million
Note
2015
2014
Net sales
➞
8
12,844.7
11,362.8
Cost of sales
➞
9
– 4,076.3
– 3,526.4
(of which: amortization of intangible assets)
2
(– 166.6)
(– 94.0)
Gross profit
8,768.4
7,836.4
Marketing and selling expenses
➞
10
– 4,049.5
– 3,589.1
(of which: amortization of intangible assets)
2
(– 778.9)
(– 719.0)
Administration expenses
– 719.9
– 608.6
Research and development costs
➞
11
– 1,709.2
– 1,703.7
(of which: amortization of intangible assets)
2
(– 2.7)
(– 3.8)
Other operating income
➞
12
470.7
564.4
Other operating expenses
➞
13
– 917.3
– 737.4
Operating result (
EBIT
)
1,843.2
1,762.0
Financial result
➞
14
– 356.7
– 205.0
Profit before income tax
1,486.5
1,557.0
Income tax
➞
15
– 368.0
– 392.2
Profit after tax from continuing operations
1,118.5
1,164.8
Profit after tax from discontinued operations
5.6
–
Profit after tax
1,124.1
1,164.8
of which: attributable to Merck KGaA shareholders (net income)
1,114.8
1,157.3
of which: attributable to non-controlling interests
➞
25
9.3
7.5
Earnings per share (in €)
➞
16
basic
2.56
2.66
- thereof from continuing operations
2.55
2.66
- thereof from discontinued operations
0.01
–
diluted
2.56
2.66
- thereof from continuing operations
2.55
2.66
- thereof from discontinued operations
0.01
–
1
The reporting structure has changed, see ‟Changes to accounting and measurement principles and disclosure changes”.
2
Excluding amortization of internally generated or separately acquired software.
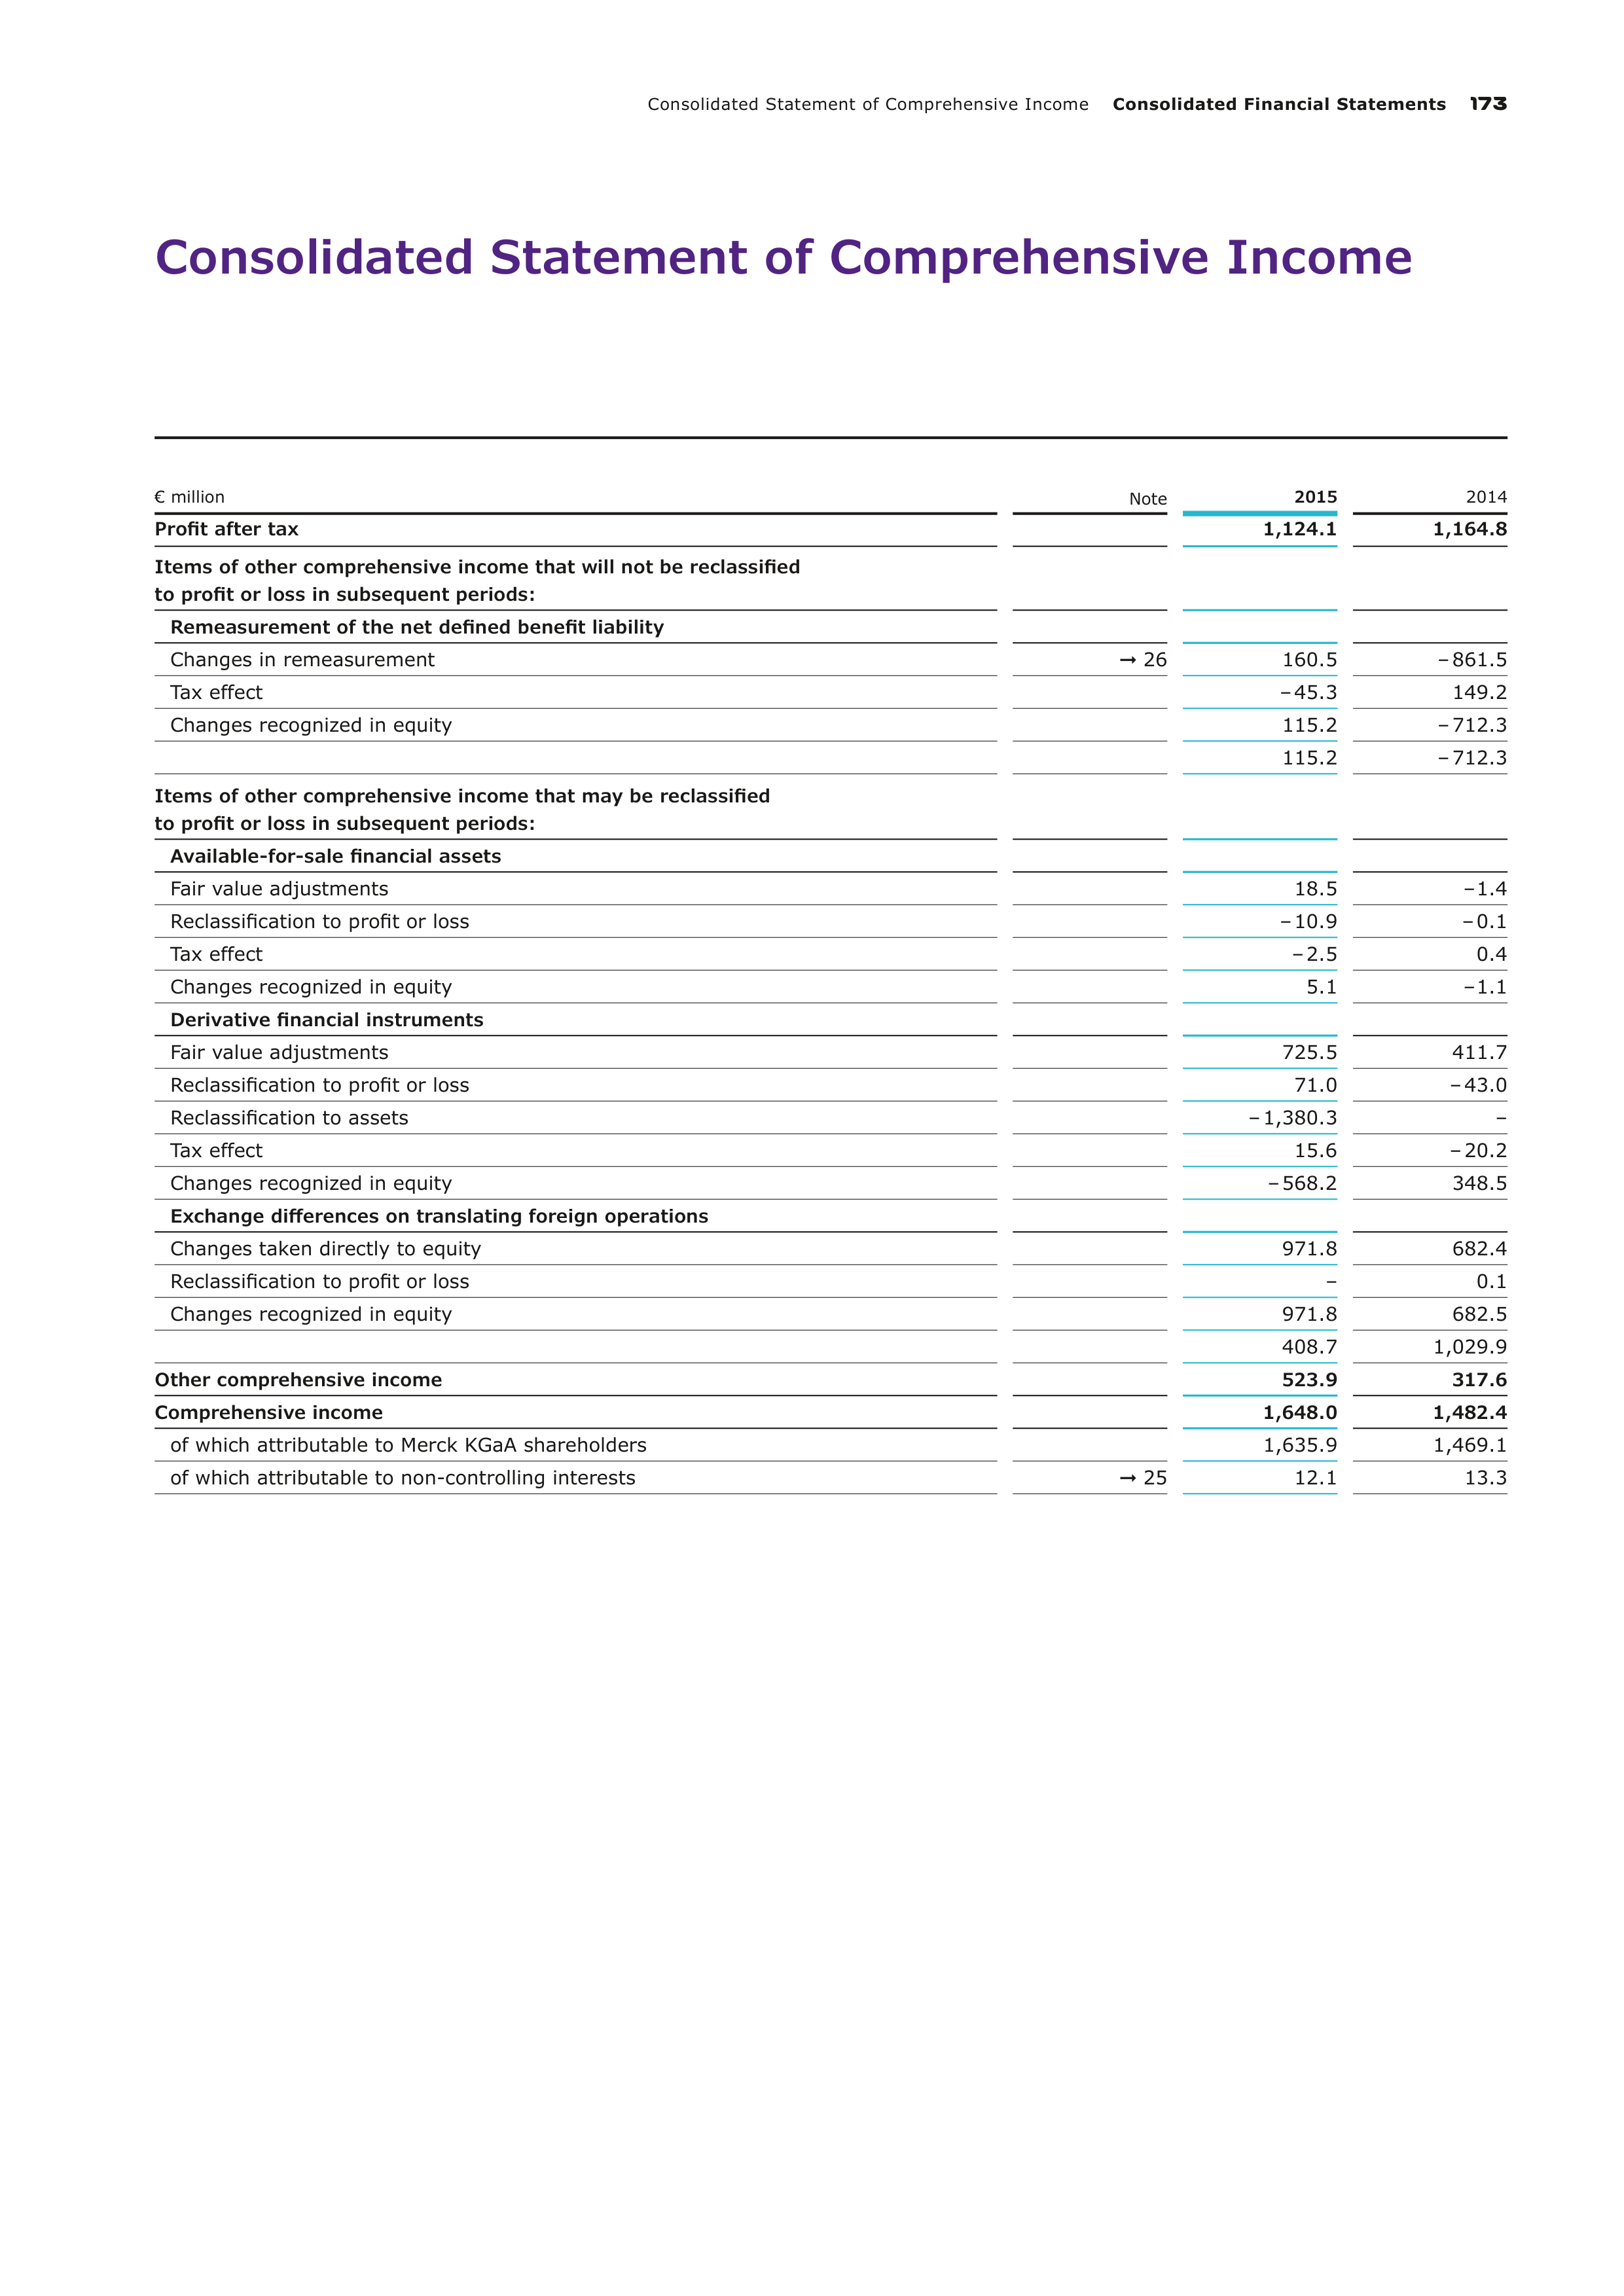
Consolidated Statement of Comprehensive Income
Consolidated Financial Statements
173
Consolidated Statement of Comprehensive Income
€ million
Note
2015
2014
Profit after tax
1,124.1
1,164.8
Items of other comprehensive income that will not be reclassified
to profit or loss in subsequent periods:
Remeasurement of the net defined benefit liability
Changes in remeasurement
➞
26
160.5
– 861.5
Tax effect
– 45.3
149.2
Changes recognized in equity
115.2
– 712.3
115.2
– 712.3
Items of other comprehensive income that may be reclassified
to profit or loss in subsequent periods:
Available-for-sale financial assets
Fair value adjustments
18.5
– 1.4
Reclassification to profit or loss
– 10.9
– 0.1
Tax effect
– 2.5
0.4
Changes recognized in equity
5.1
– 1.1
Derivative financial instruments
Fair value adjustments
725.5
411.7
Reclassification to profit or loss
71.0
– 43.0
Reclassification to assets
– 1,380.3
–
Tax effect
15.6
– 20.2
Changes recognized in equity
– 568.2
348.5
Exchange differences on translating foreign operations
Changes taken directly to equity
971.8
682.4
Reclassification to profit or loss
–
0.1
Changes recognized in equity
971.8
682.5
408.7
1,029.9
Other comprehensive income
523.9
317.6
Comprehensive income
1,648.0
1,482.4
of which attributable to Merck KGaA shareholders
1,635.9
1,469.1
of which attributable to non-controlling interests
➞
25
12.1
13.3
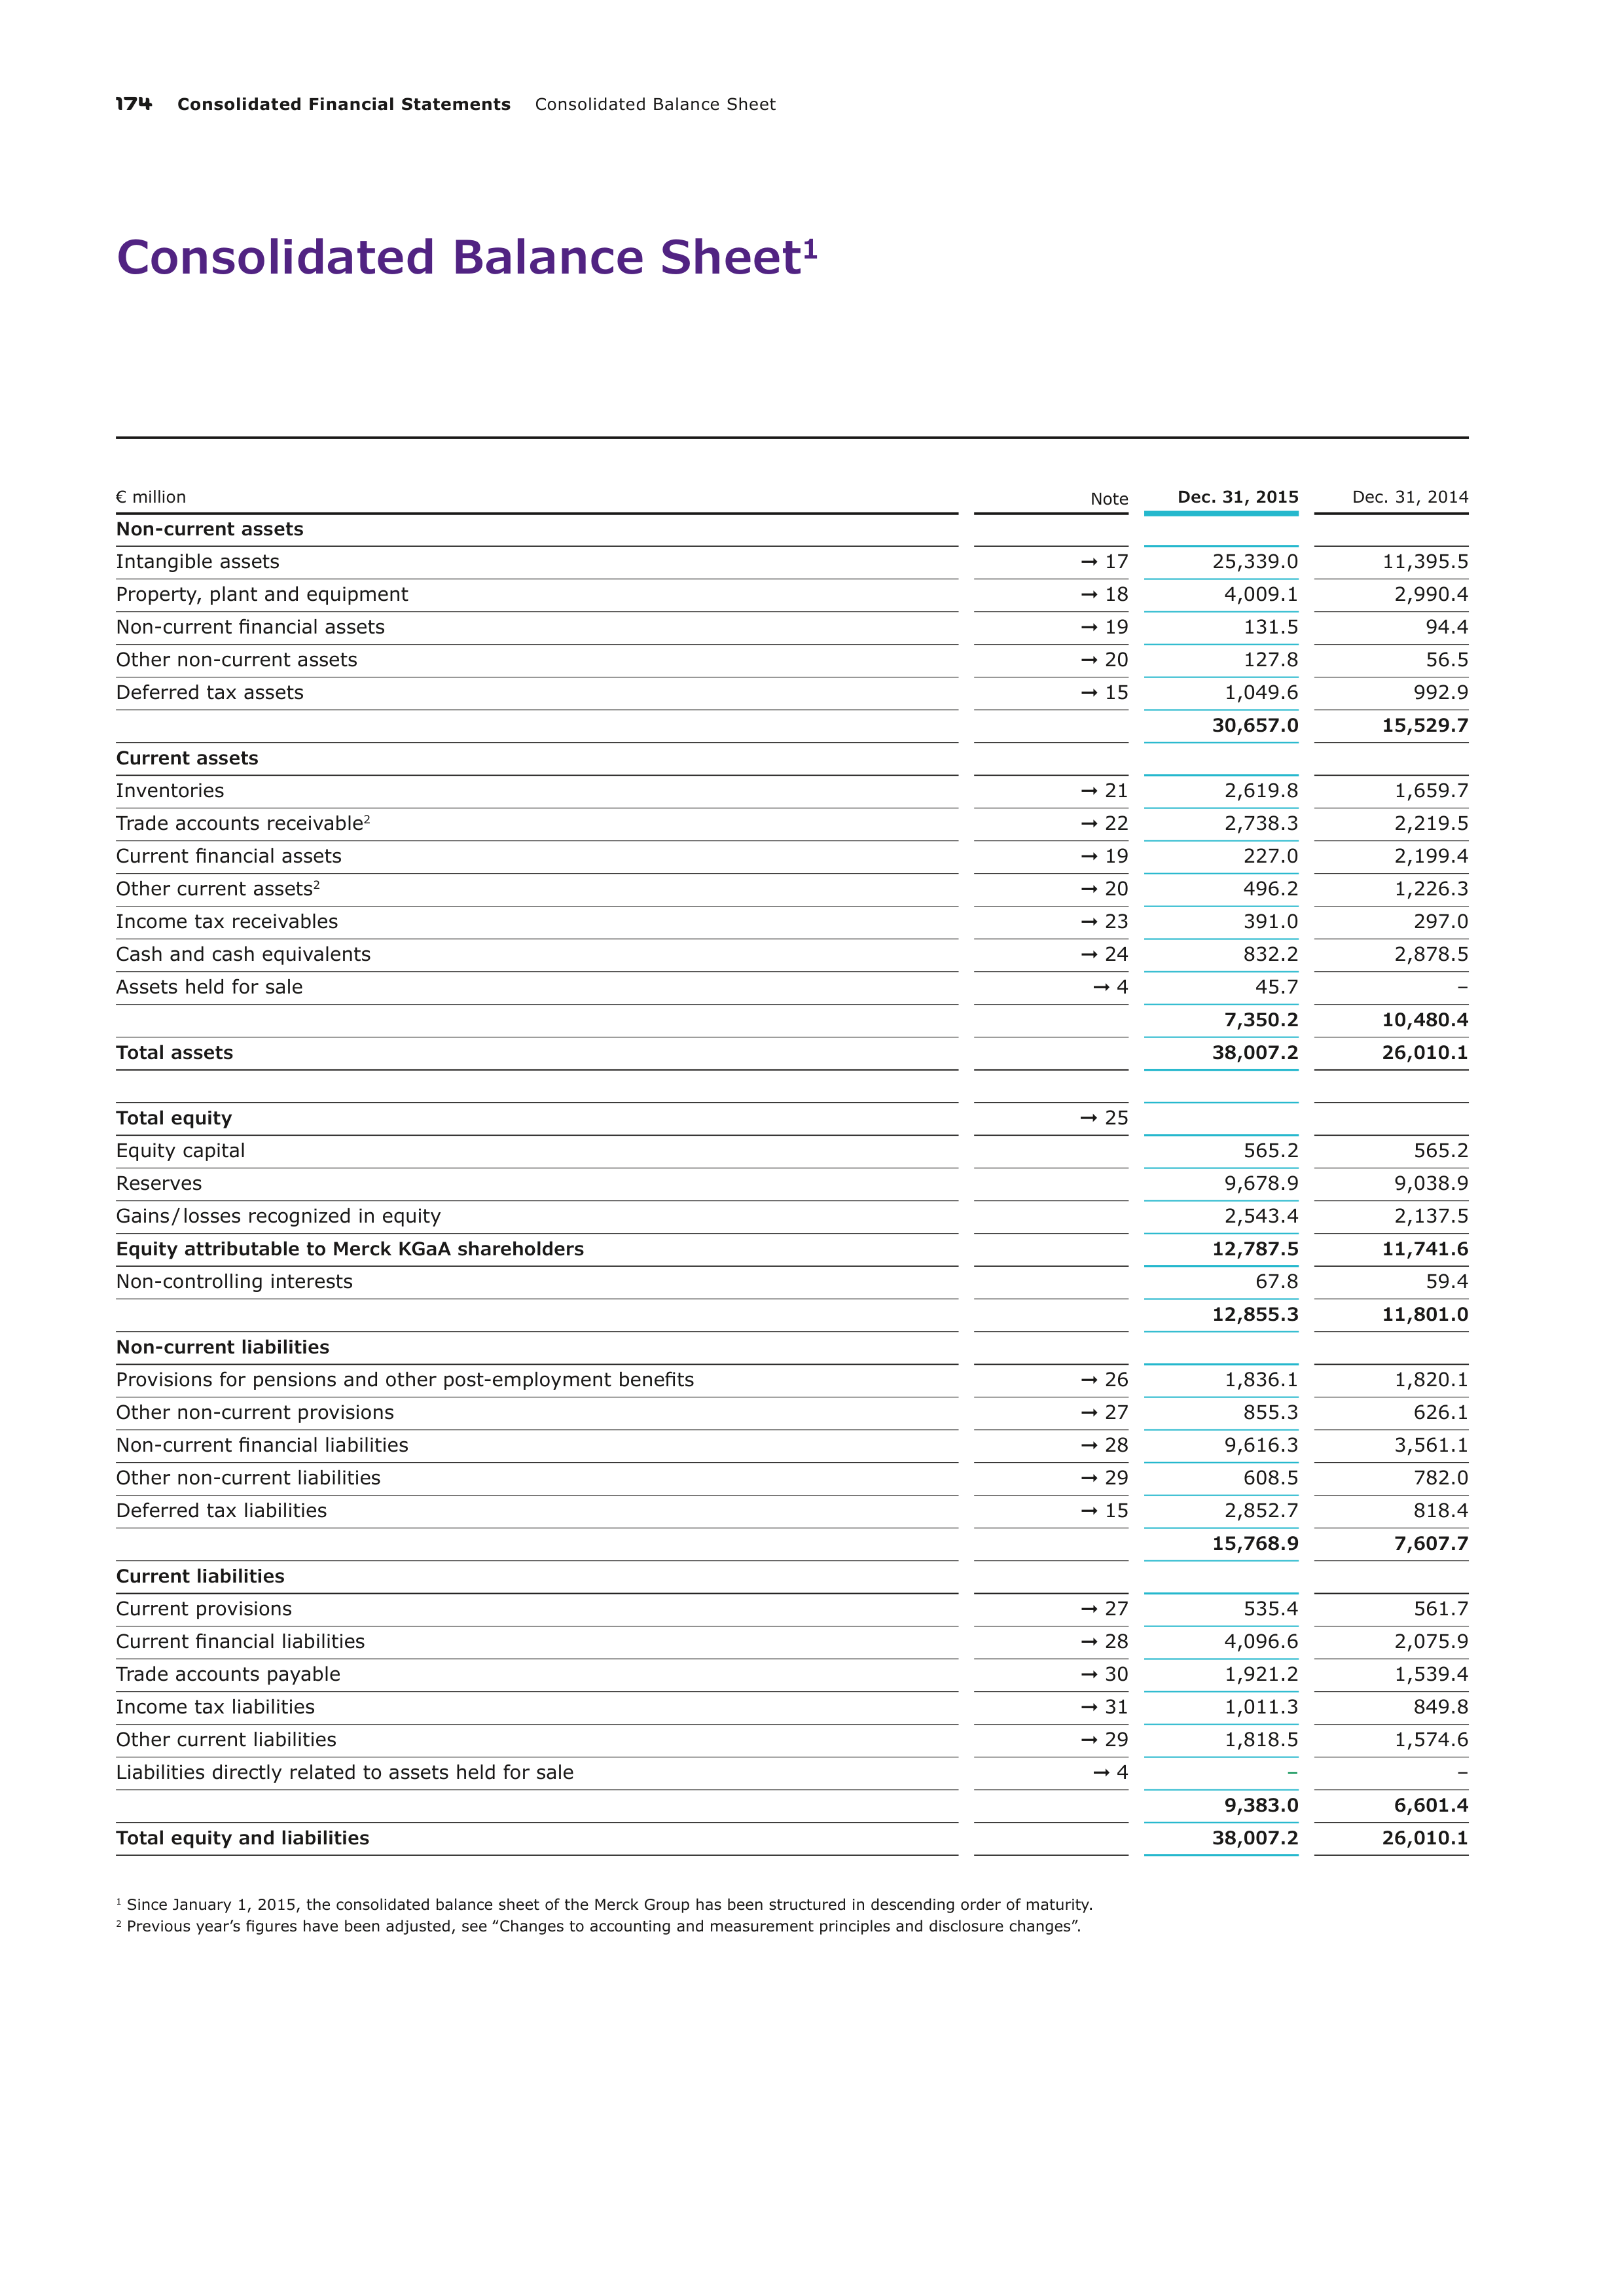
174
Consolidated Financial Statements
Consolidated Balance Sheet
Consolidated Balance Sheet
1
€ million
Note
Dec. 31, 2015
Dec. 31, 2014
Non-current assets
Intangible assets
➞
17
25,339.0
11,395.5
Property, plant and equipment
➞
18
4,009.1
2,990.4
Non-current financial assets
➞
19
131.5
94.4
Other non-current assets
➞
20
127.8
56.5
Deferred tax assets
➞
15
1,049.6
992.9
30,657.0
15,529.7
Current assets
Inventories
➞
21
2,619.8
1,659.7
Trade accounts receivable
2
➞
22
2,738.3
2,219.5
Current financial assets
➞
19
227.0
2,199.4
Other current assets
2
➞
20
496.2
1,226.3
Income tax receivables
➞
23
391.0
297.0
Cash and cash equivalents
➞
24
832.2
2,878.5
Assets held for sale
➞
4
45.7
–
7,350.2
10,480.4
Total assets
38,007.2
26,010.1
Total equity
➞
25
Equity capital
565.2
565.2
Reserves
9,678.9
9,038.9
Gains / losses recognized in equity
2,543.4
2,137.5
Equity attributable to Merck KGaA shareholders
12,787.5
11,741.6
Non-controlling interests
67.8
59.4
12,855.3
11,801.0
Non-current liabilities
Provisions for pensions and other post-employment benefits
➞
26
1,836.1
1,820.1
Other non-current provisions
➞
27
855.3
626.1
Non-current financial liabilities
➞
28
9,616.3
3,561.1
Other non-current liabilities
➞
29
608.5
782.0
Deferred tax liabilities
➞
15
2,852.7
818.4
15,768.9
7,607.7
Current liabilities
Current provisions
➞
27
535.4
561.7
Current financial liabilities
➞
28
4,096.6
2,075.9
Trade accounts payable
➞
30
1,921.2
1,539.4
Income tax liabilities
➞
31
1,011.3
849.8
Other current liabilities
➞
29
1,818.5
1,574.6
Liabilities directly related to assets held for sale
➞
4
–
–
9,383.0
6,601.4
Total equity and liabilities
38,007.2
26,010.1
1
Since January 1, 2015, the consolidated balance sheet of the Merck Group has been structured in descending order of maturity.
2
Previous year’s figures have been adjusted, see ‟Changes to accounting and measurement principles and disclosure changes”.
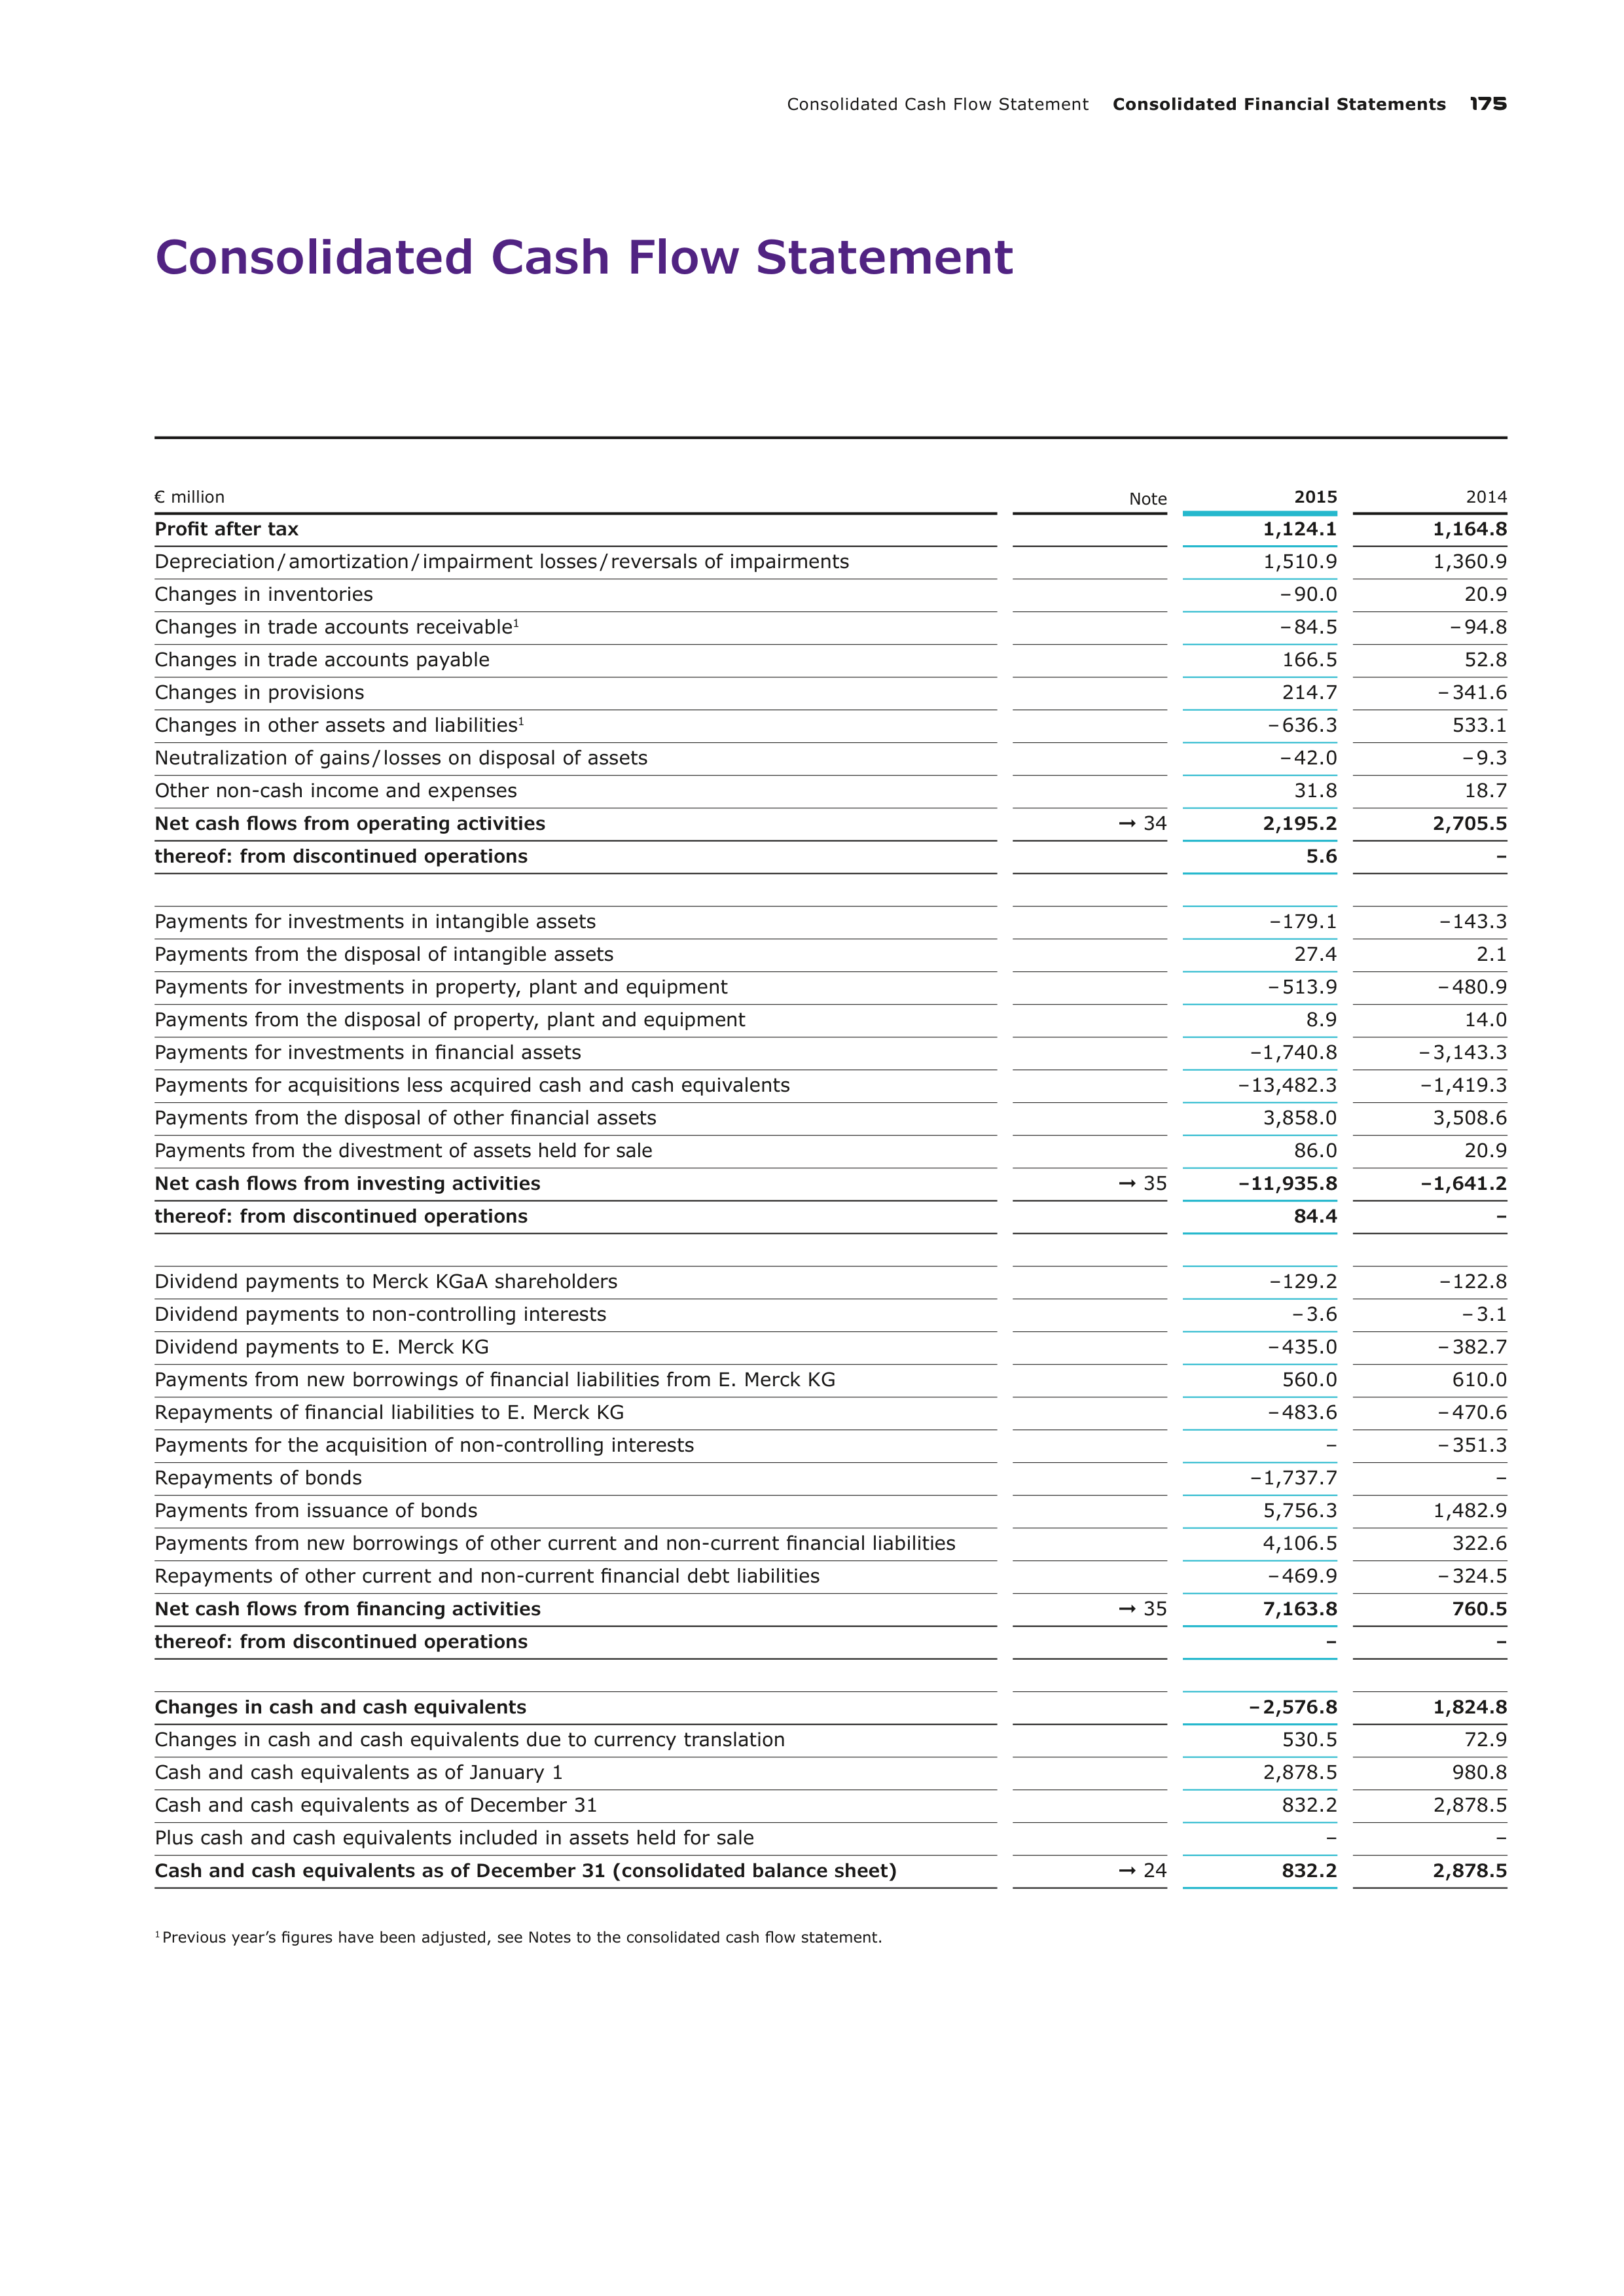
Consolidated Cash Flow Statement
Consolidated Financial Statements
175
Consolidated Cash Flow Statement
€ million
Note
2015
2014
Profit after tax
1,124.1
1,164.8
Depreciation / amortization / impairment losses / reversals of impairments
1,510.9
1,360.9
Changes in inventories
– 90.0
20.9
Changes in trade accounts receivable
1
– 84.5
– 94.8
Changes in trade accounts payable
166.5
52.8
Changes in provisions
214.7
– 341.6
Changes in other assets and liabilities
1
– 636.3
533.1
Neutralization of gains / losses on disposal of assets
– 42.0
– 9.3
Other non-cash income and expenses
31.8
18.7
Net cash flows from operating activities
➞
34
2,195.2
2,705.5
thereof: from discontinued operations
5.6
–
Payments for investments in intangible assets
– 179.1
– 143.3
Payments from the disposal of intangible assets
27.4
2.1
Payments for investments in property, plant and equipment
– 513.9
– 480.9
Payments from the disposal of property, plant and equipment
8.9
14.0
Payments for investments in financial assets
–1 ,740.8
– 3,143.3
Payments for acquisitions less acquired cash and cash equivalents
– 13,482.3
– 1,419.3
Payments from the disposal of other financial assets
3,858.0
3,508.6
Payments from the divestment of assets held for sale
86.0
20.9
Net cash flows from investing activities
➞
35
– 11,935.8
– 1,641.2
thereof: from discontinued operations
84.4
–
Dividend payments to Merck KGaA shareholders
– 129.2
– 122.8
Dividend payments to non-controlling interests
– 3.6
– 3.1
Dividend payments to E. Merck KG
– 435.0
– 382.7
Payments from new borrowings of financial liabilities from E. Merck KG
560.0
610.0
Repayments of financial liabilities to E. Merck KG
– 483.6
– 470.6
Payments for the acquisition of non-controlling interests
–
– 351.3
Repayments of bonds
– 1,737.7
–
Payments from issuance of bonds
5,756.3
1,482.9
Payments from new borrowings of other current and non-current financial liabilities
4,106.5
322.6
Repayments of other current and non-current financial debt liabilities
– 469.9
– 324.5
Net cash flows from financing activities
➞
35
7,163.8
760.5
thereof: from discontinued operations
–
–
Changes in cash and cash equivalents
– 2,576.8
1,824.8
Changes in cash and cash equivalents due to currency translation
530.5
72.9
Cash and cash equivalents as of January 1
2,878.5
980.8
Cash and cash equivalents as of December 31
832.2
2,878.5
Plus cash and cash equivalents included in assets held for sale
–
–
Cash and cash equivalents as of December 31 (consolidated balance sheet)
➞
24
832.2
2,878.5
1
Previous year’s figures have been adjusted, see Notes to the consolidated cash flow statement.
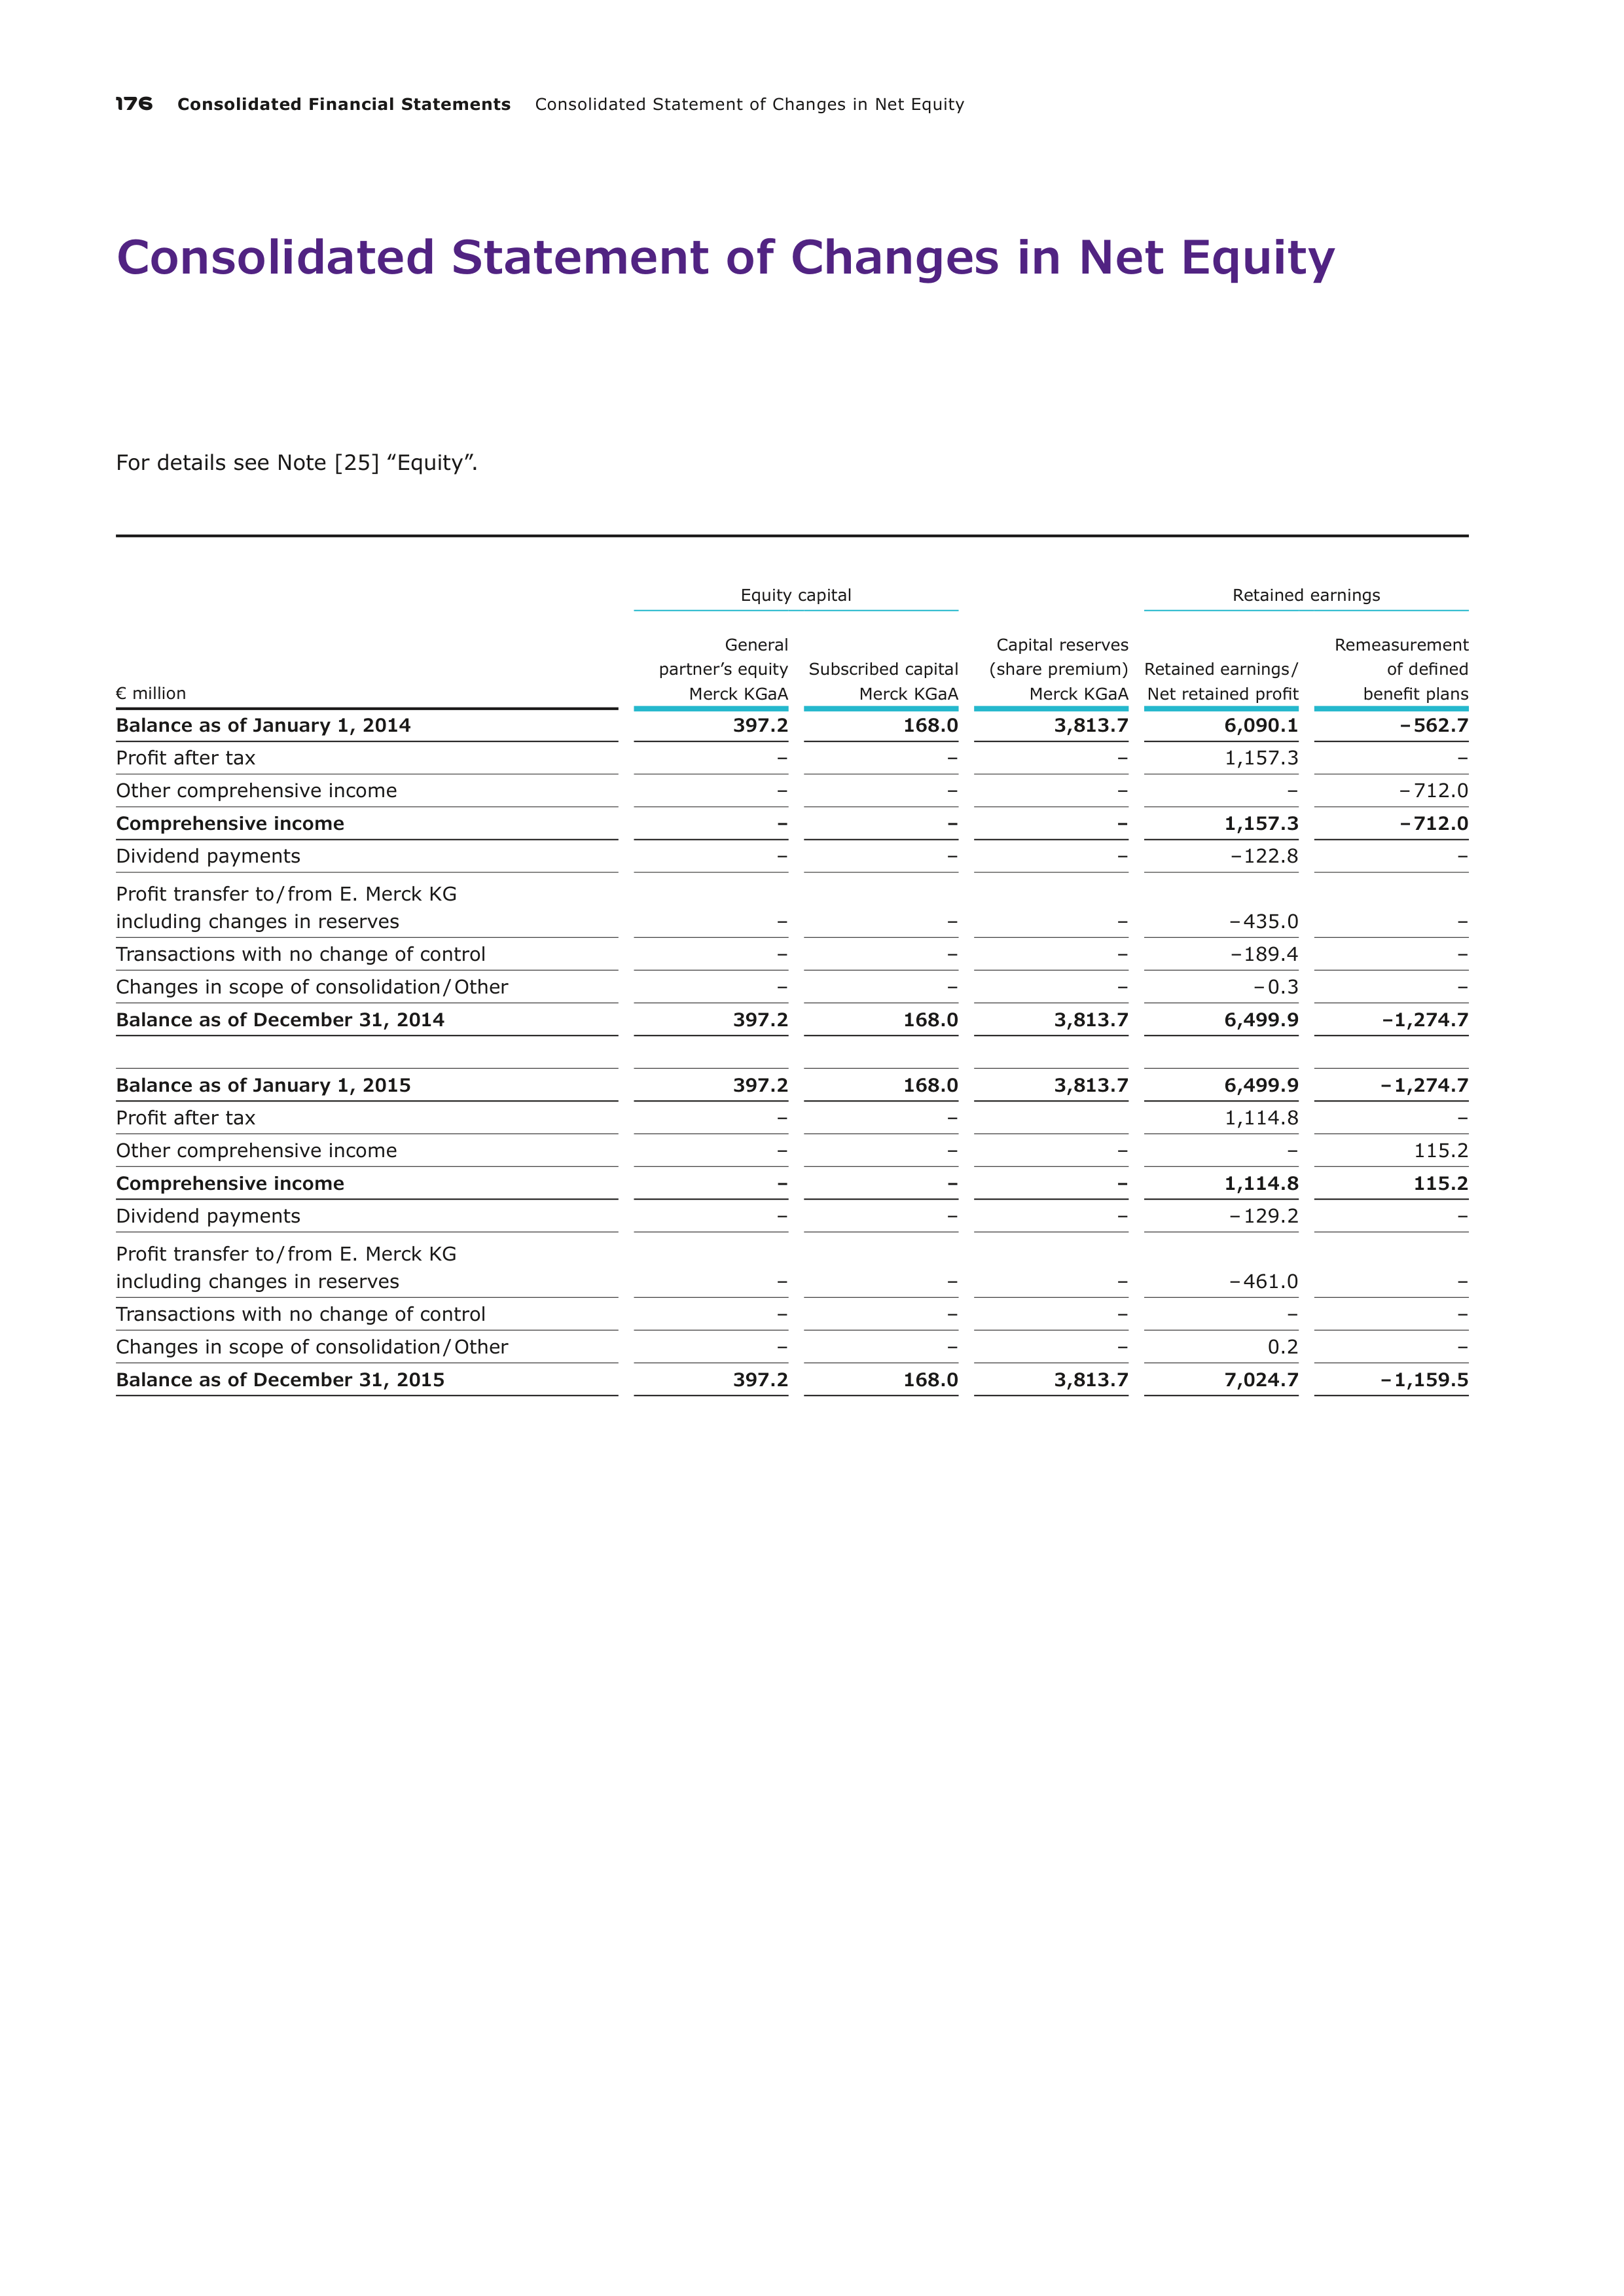
176
Consolidated Financial Statements
Consolidated Statement of Changes in Net Equity
Equity capital
Retained earnings
€ million
General
partner’s equity
Merck KGaA
Subscribed capital
Merck KGaA
Capital reserves
(share premium)
Merck KGaA
Retained earnings
/
Net retained profit
Remeasurement
of defined
benefit plans
Balance as of January 1, 2014
397.2
168.0
3,813.7
6,090.1
– 562.7
Profit after tax
–
–
–
1,157.3
–
Other comprehensive income
–
–
–
–
– 712.0
Comprehensive income
–
–
–
1,157.3
– 712.0
Dividend payments
–
–
–
– 122.8
–
Profit transfer to / from E. Merck KG
including changes in reserves
–
–
–
– 435.0
–
Transactions with no change of control
–
–
–
– 189.4
–
Changes in scope of consolidation / Other
–
–
–
– 0.3
–
Balance as of December 31, 2014
397.2
168.0
3,813.7
6,499.9
– 1,274.7
Balance as of January 1, 2015
397.2
168.0
3,813.7
6,499.9
– 1,274.7
Profit after tax
–
–
1,114.8
–
Other comprehensive income
–
–
–
–
115.2
Comprehensive income
–
–
–
1,114.8
115.2
Dividend payments
–
–
–
– 129.2
–
Profit transfer to / from E. Merck KG
including changes in reserves
–
–
–
– 461.0
–
Transactions with no change of control
–
–
–
–
–
Changes in scope of consolidation / Other
–
–
–
0.2
–
Balance as of December 31, 2015
397.2
168.0
3,813.7
7,024.7
– 1,159.5
Consolidated Statement of Changes in Net Equity
For details see Note [25] ‟Equity”.
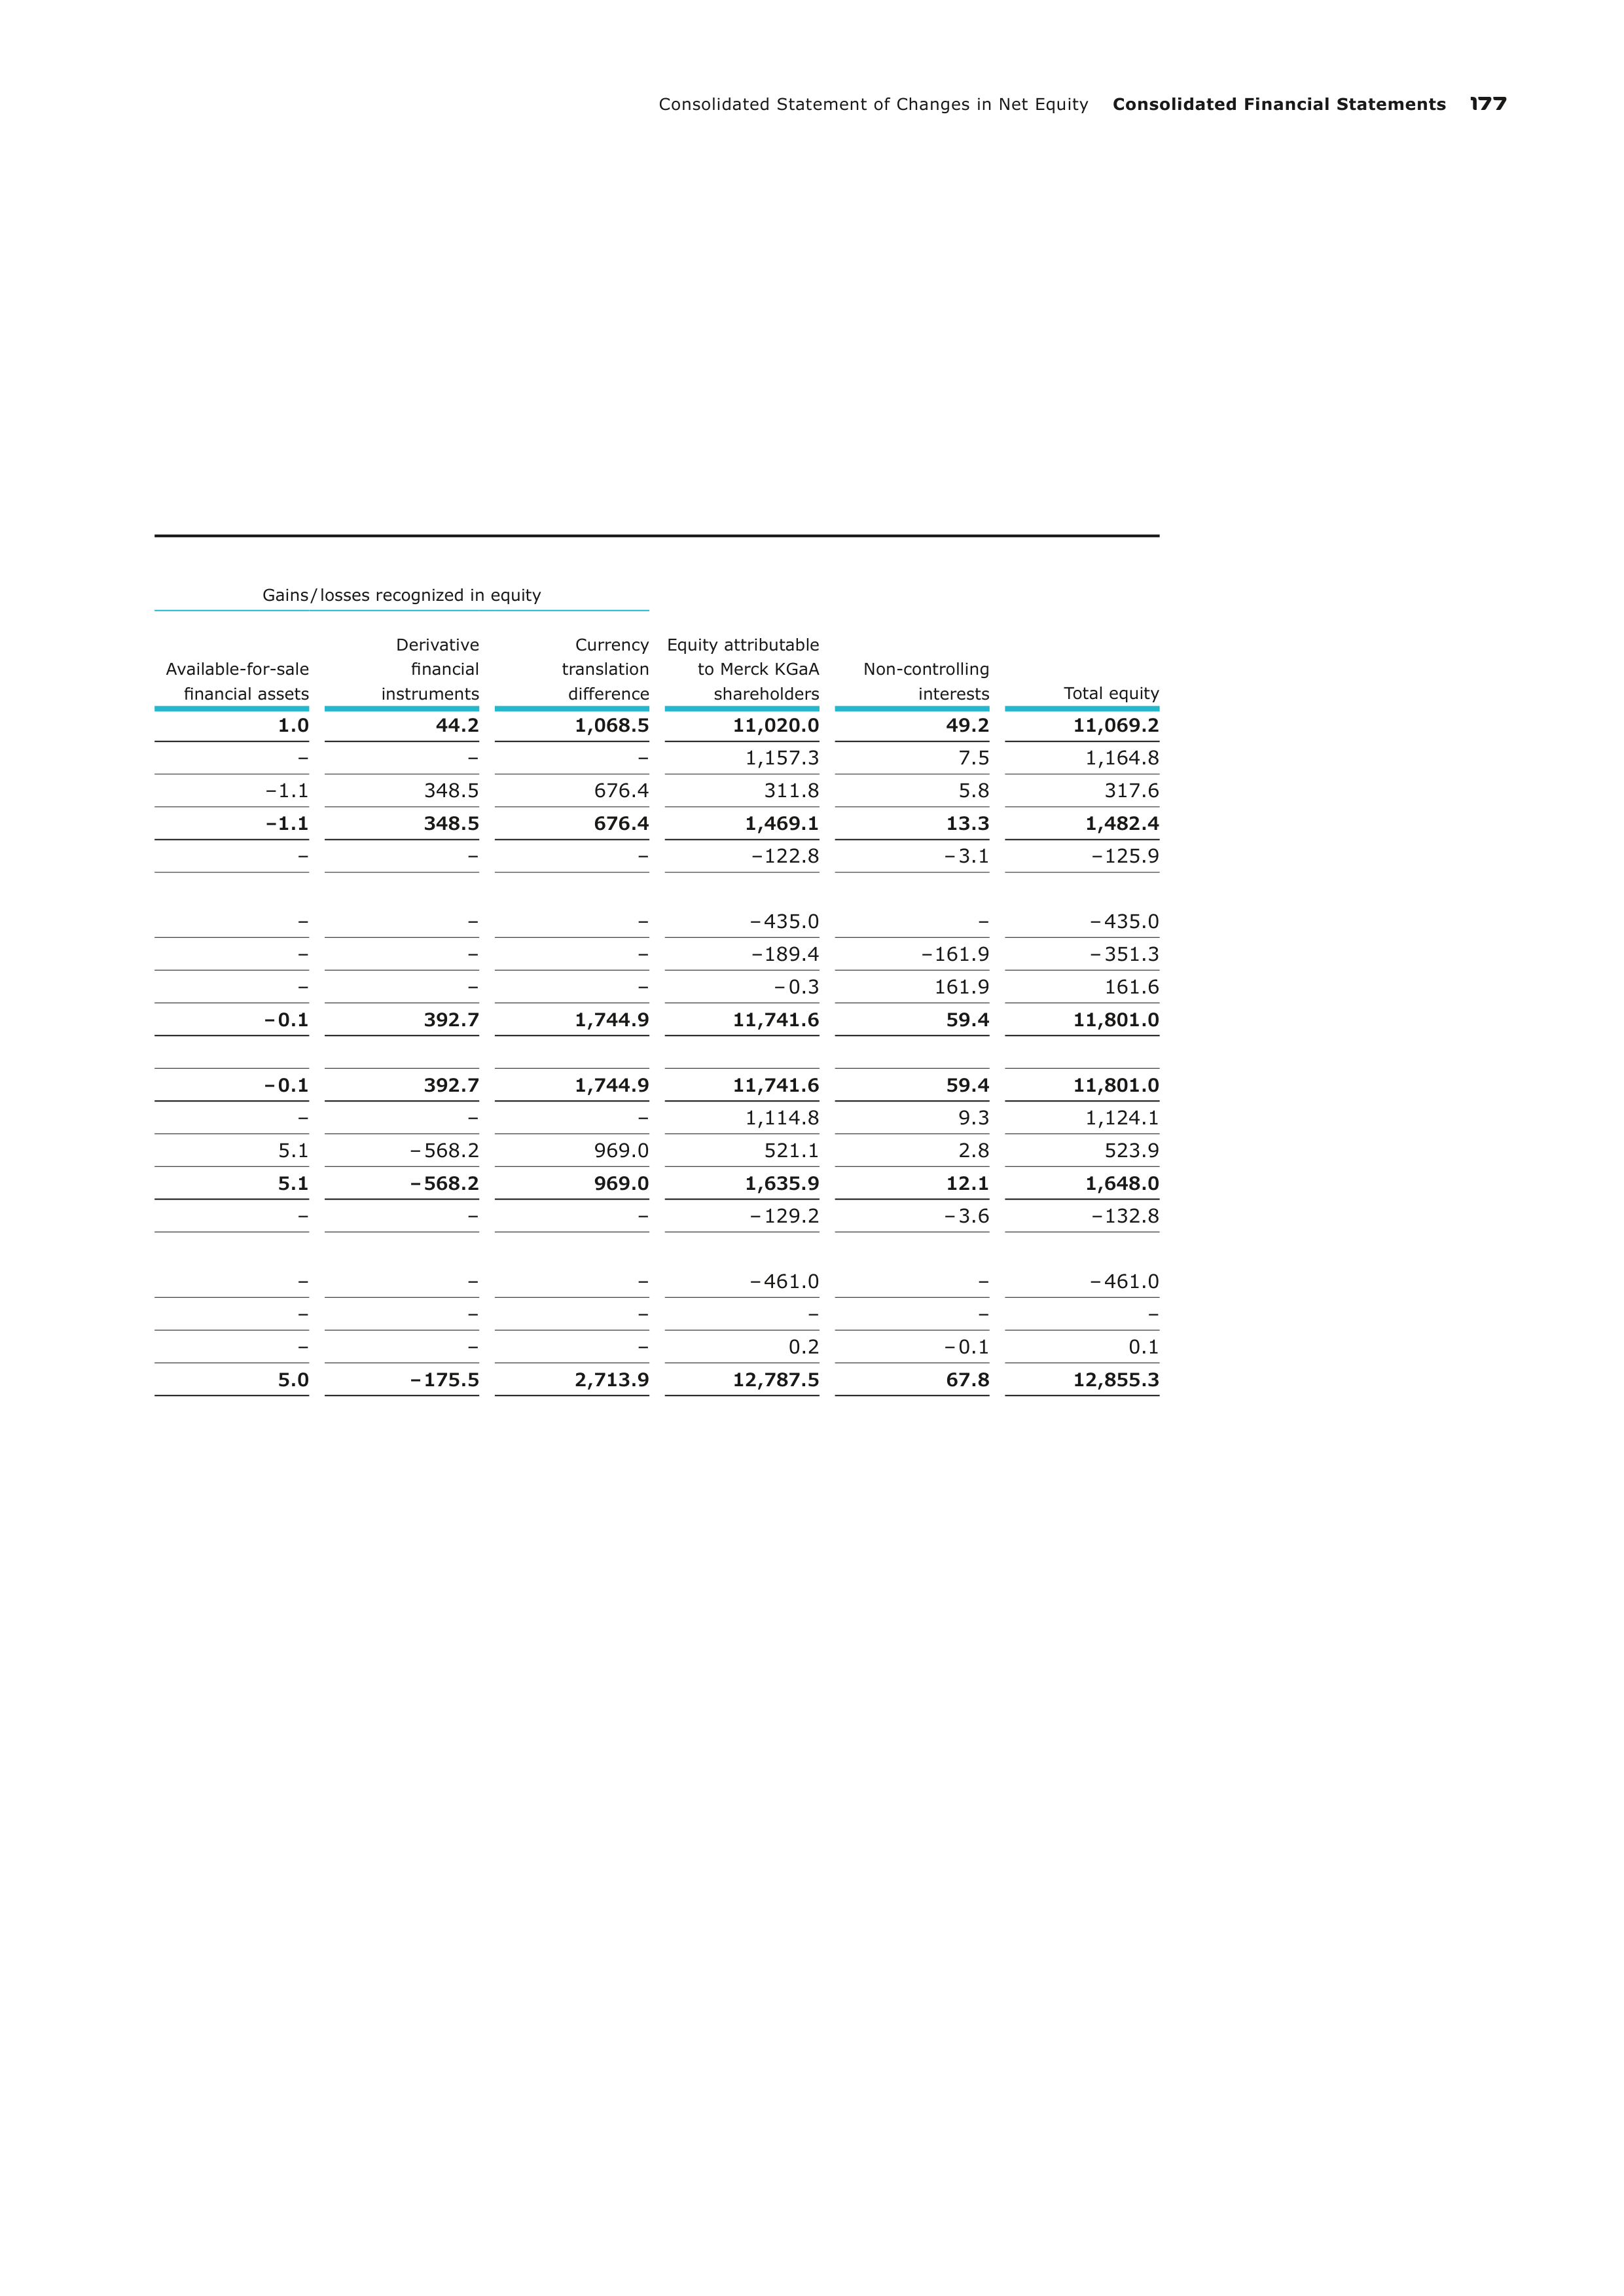
Consolidated Statement of Changes in Net Equity
Consolidated Financial Statements
177
Gains / losses recognized in equity
Available-for-sale
financial assets
Derivative
financial
instruments
Currency
translation
difference
Equity attributable
to Merck KGaA
shareholders
Non-controlling
interests
Total equity
1.0
44.2
1,068.5
11,020.0
49.2
11,069.2
–
–
–
1,157.3
7.5
1,164.8
– 1.1
348.5
676.4
311.8
5.8
317.6
– 1.1
348.5
676.4
1,469.1
13.3
1,482.4
–
–
–
– 122.8
– 3.1
– 125.9
–
–
–
– 435.0
–
– 435.0
–
–
–
– 189.4
– 161.9
– 351.3
–
–
–
– 0.3
161.9
161.6
– 0.1
392.7
1,744.9
11,741.6
59.4
11,801.0
– 0.1
392.7
1,744.9
11,741.6
59.4
11,801.0
–
–
–
1,114.8
9.3
1,124.1
5.1
– 568.2
969.0
521.1
2.8
523.9
5.1
– 568.2
969.0
1,635.9
12.1
1,648.0
–
–
–
– 129.2
– 3.6
– 132.8
–
–
–
– 461.0
–
– 461.0
–
–
–
–
–
–
–
–
–
0.2
– 0.1
0.1
5.0
– 175.5
2,713.9
12,787.5
67.8
12,855.3
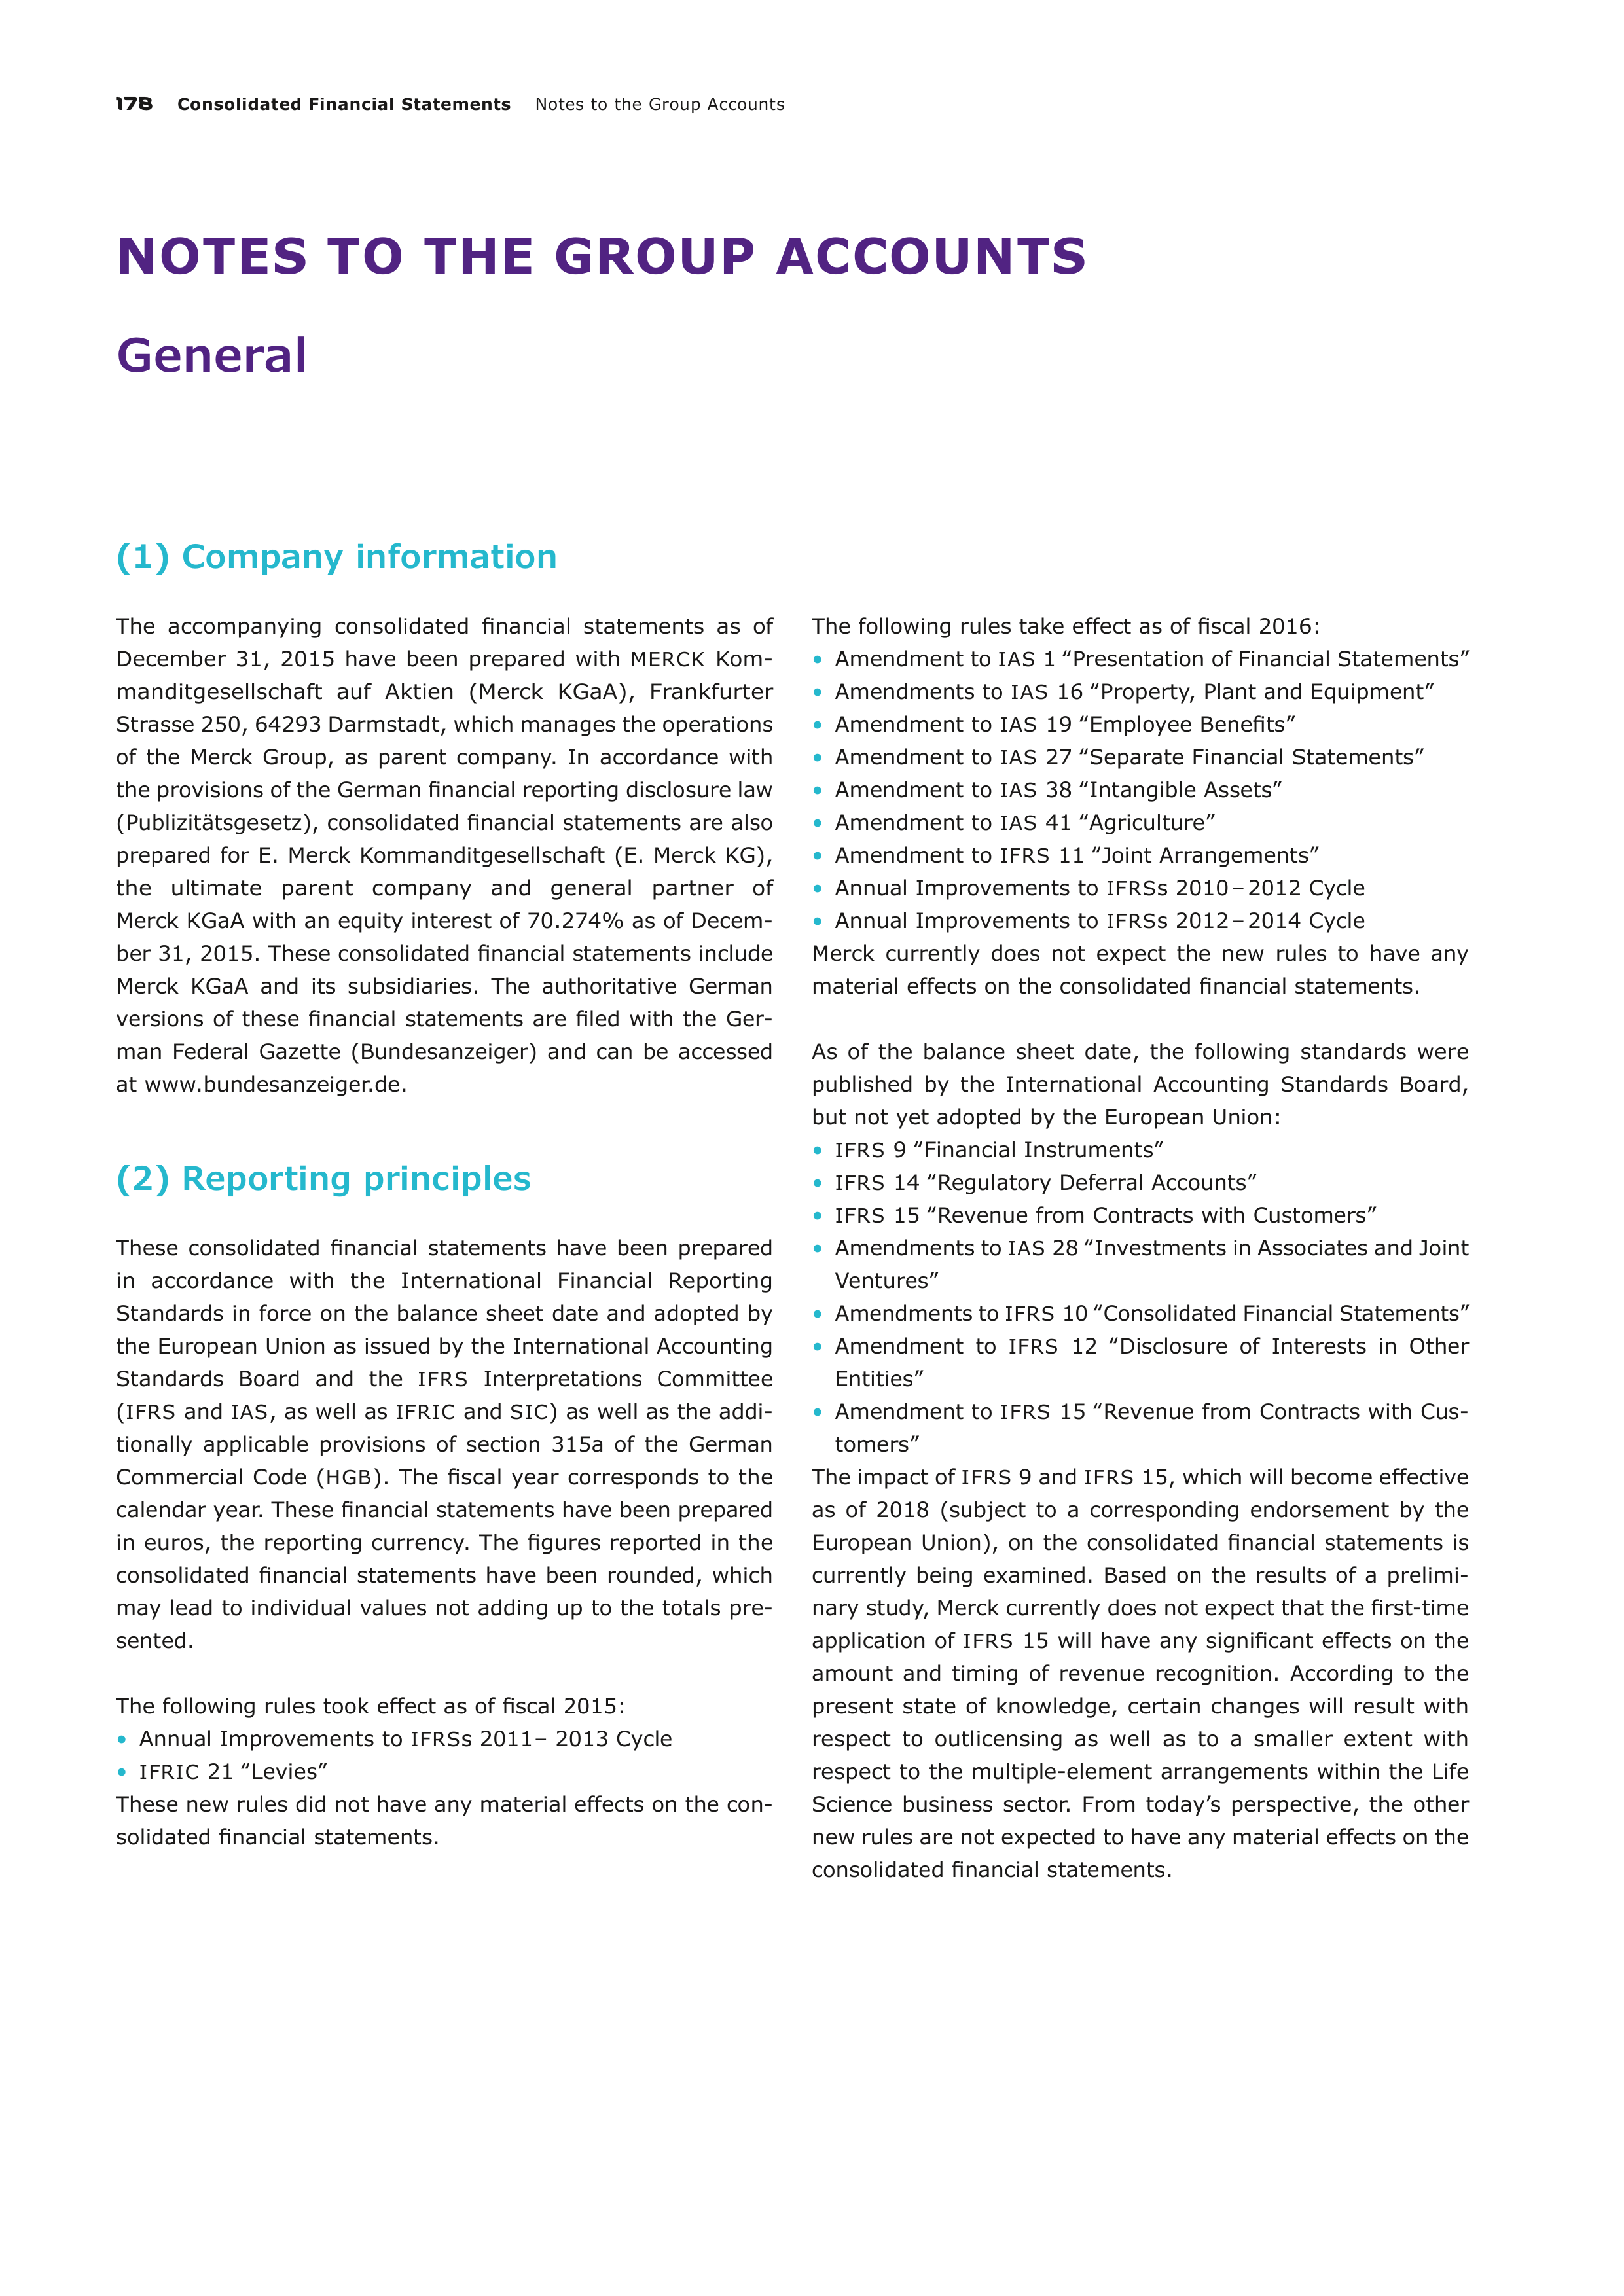
178
Consolidated Financial Statements
Notes to the Group Accounts
NOTES TO THE GROUP ACCOUNTS
General
(1) Company information
The accompanying consolidated financial statements as of
December 31, 2015 have been prepared with
MERCK
Kom-
manditgesellschaft auf Aktien (Merck KGaA), Frankfurter
Strasse 250, 64293 Darmstadt, which manages the operations
of the Merck Group, as parent company. In accordance with
the provisions of the German financial reporting disclosure law
(Publizitätsgesetz), consolidated financial statements are also
prepared for E. Merck Kommanditgesellschaft (E. Merck KG),
the ultimate parent company and general partner of
Merck KGaA with an equity interest of 70.274% as of Decem-
ber 31, 2015. These consolidated financial statements include
Merck KGaA and its subsidiaries. The authoritative German
versions of these financial statements are filed with the Ger-
man Federal Gazette (Bundesanzeiger) and can be accessed
at www.bundesanzeiger.de.
(2) Reporting principles
These consolidated financial statements have been prepared
in accordance with the International Financial Reporting
Standards in force on the balance sheet date and adopted by
the European Union as issued by the International Accounting
Standards Board and the
IFRS
Interpretations Committee
(
IFRS
and
IAS
, as well as
IFRIC
and
SIC
) as well as the addi-
tionally applicable provisions of section 315a of the German
Commercial Code (
HGB
). The fiscal year corresponds to the
calendar year. These financial statements have been prepared
in euros, the reporting currency. The figures reported in the
consolidated financial statements have been rounded, which
may lead to individual values not adding up to the totals pre-
sented.
The following rules took effect as of fiscal 2015:
•
Annual Improvements to
IFRS
s 2011 – 2013 Cycle
•
IFRIC
21 ‟Levies”
These new rules did not have any material effects on the con-
solidated financial statements.
The following rules take effect as of fiscal 2016:
•
Amendment to
IAS
1 ‟Presentation of Financial Statements”
•
Amendments to
IAS
16 ‟Property, Plant and Equipment”
•
Amendment to
IAS
19 ‟Employee Benefits”
•
Amendment to
IAS
27 ‟Separate Financial Statements”
•
Amendment to
IAS
38 ‟Intangible Assets”
•
Amendment to
IAS
41 ‟Agriculture”
•
Amendment to
IFRS
11 ‟Joint Arrangements”
•
Annual Improvements to
IFRS
s 2010 – 2012 Cycle
•
Annual Improvements to
IFRS
s 2012 – 2014 Cycle
Merck currently does not expect the new rules to have any
material effects on the consolidated financial statements.
As of the balance sheet date, the following standards were
published by the International Accounting Standards Board,
but not yet adopted by the European Union:
•
IFRS
9 ‟Financial Instruments”
•
IFRS
14 ‟Regulatory Deferral Accounts”
•
IFRS
15 ‟Revenue from Contracts with Customers”
•
Amendments to
IAS
28 ‟Investments in Associates and Joint
Ventures”
•
Amendments to
IFRS
10 ‟Consolidated Financial Statements”
•
Amendment to
IFRS
12 ‟Disclosure of Interests in Other
Entities”
•
Amendment to
IFRS
15 ‟Revenue from Contracts with Cus-
tomers”
The impact of
IFRS
9 and
IFRS
15, which will become effective
as of 2018 (subject to a corresponding endorsement by the
European Union), on the consolidated financial statements is
currently being examined. Based on the results of a prelimi-
nary study, Merck currently does not expect that the first-time
application of
IFRS
15 will have any significant effects on the
amount and timing of revenue recognition. According to the
present state of knowledge, certain changes will result with
respect to outlicensing as well as to a smaller extent with
respect
to the multiple-element arrangements within the Life
Science business sector. From today’s perspective, the other
new rules are not expected to have any material effects on the
consolidated financial statements.
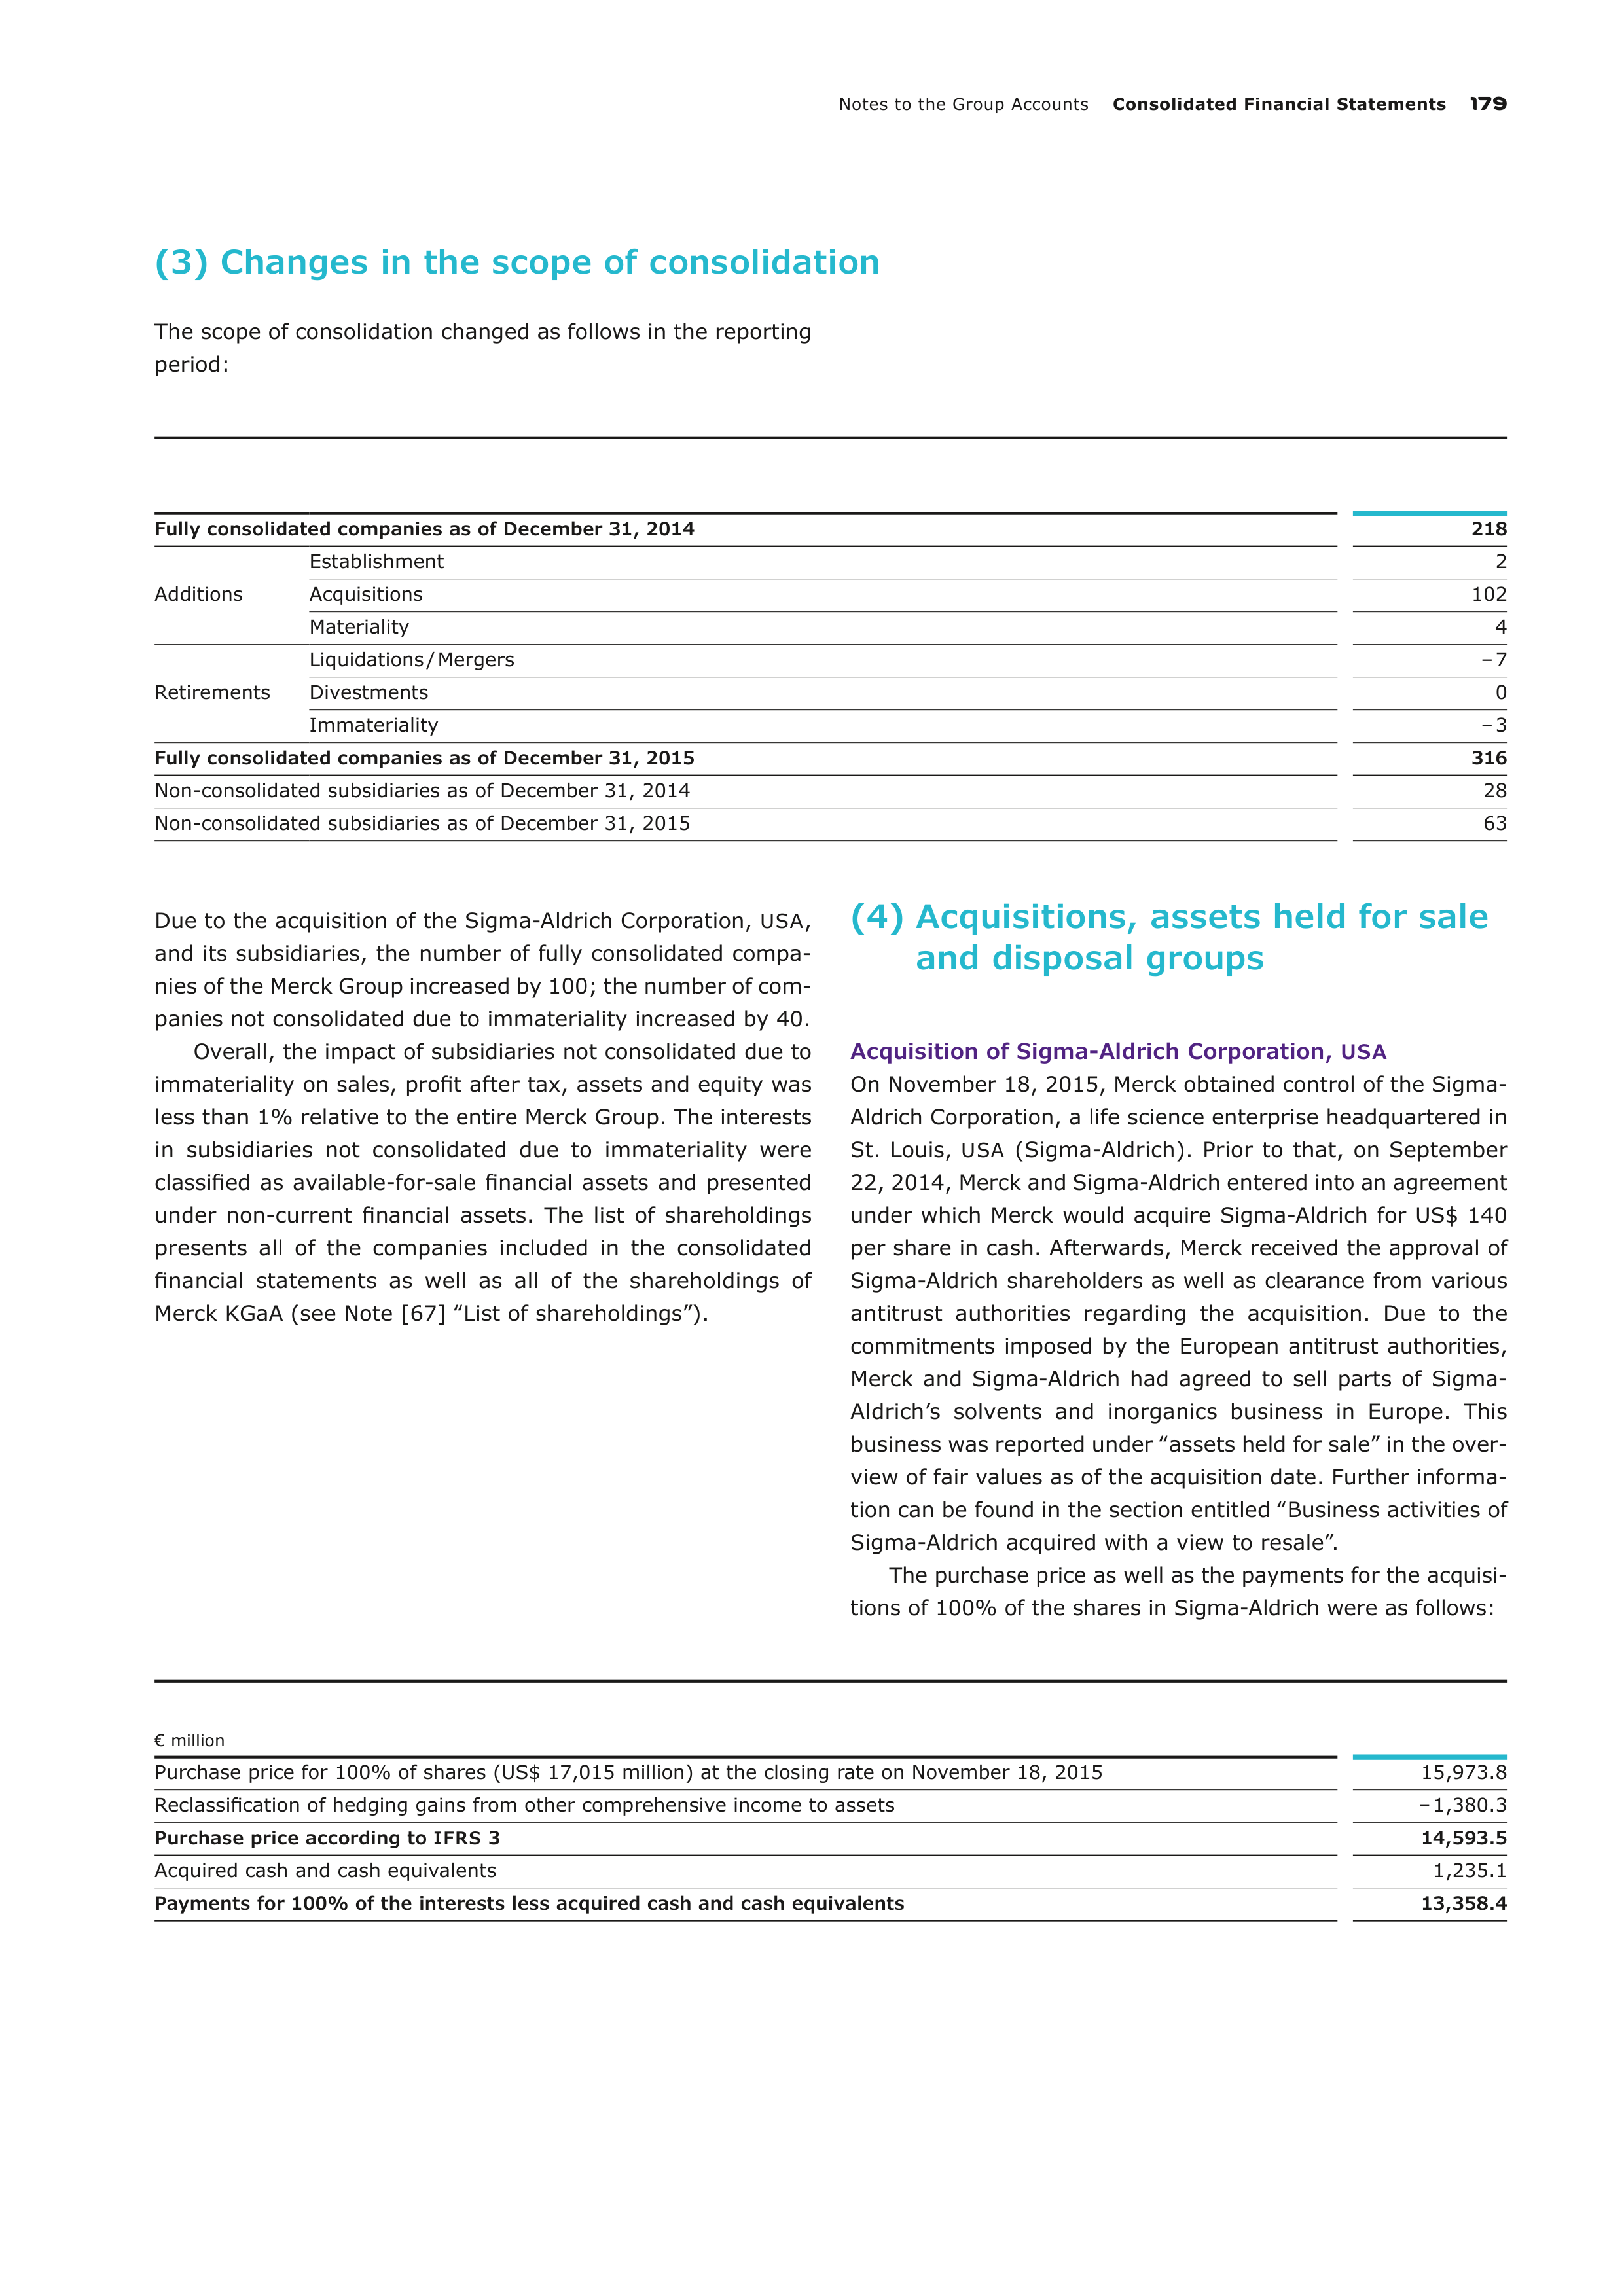
Notes to the Group Accounts
Consolidated Financial Statements
179
(3) Changes in the scope of consolidation
The scope of consolidation changed as follows in the reporting
period:
Fully consolidated companies as of December 31, 2014
218
Additions
Establishment
2
Acquisitions
102
Materiality
4
Retirements
Liquidations / Mergers
– 7
Divestments
0
Immateriality
– 3
Fully consolidated companies as of December 31, 2015
316
Non-consolidated subsidiaries as of December 31, 2014
28
Non-consolidated subsidiaries as of December 31, 2015
63
Due to the acquisition of the Sigma-Aldrich Corporation,
USA
,
and its subsidiaries, the number of fully consolidated compa-
nies of the Merck Group increased by 100; the number of com-
panies not consolidated due to immateriality increased by 40.
Overall, the impact of subsidiaries not consolidated due to
immateriality on sales, profit after tax, assets and equity was
less than 1% relative to the entire Merck Group. The interests
in subsidiaries not consolidated due to immateriality were
classified as available-for-sale financial assets and presented
under non-current financial assets. The list of shareholdings
presents all of the companies included in the consolidated
financial statements as well as all of the shareholdings of
Merck KGaA (see Note [67] ‟List of shareholdings”).
(4) Acquisitions, assets held for sale
and disposal groups
Acquisition of Sigma-Aldrich Corporation,
USA
On November 18, 2015, Merck obtained control of the Sigma-
Aldrich Corporation, a life science enterprise headquartered in
St. Louis,
USA
(Sigma-Aldrich). Prior to that, on September
22, 2014, Merck and Sigma-Aldrich entered into an agreement
under which Merck would acquire Sigma-Aldrich for US$ 140
per share in cash. Afterwards, Merck received the approval of
Sigma-Aldrich shareholders as well as clearance from various
antitrust authorities regarding the acquisition. Due to the
commitments imposed by the European antitrust authorities,
Merck and Sigma-Aldrich had agreed to sell parts of Sigma-
Aldrich’s solvents and inorganics business in Europe. This
business was reported under ‟assets held for sale” in the over-
view of fair values as of the acquisition date. Further informa-
tion can be found in the section entitled ‟Business activities of
Sigma-Aldrich acquired with a view to resale”.
The purchase price as well as the payments for the acquisi-
tions of 100% of the shares in Sigma-Aldrich were as follows:
€ million
Purchase price for 100% of shares (US$ 17,015 million) at the closing rate on November 18, 2015
15,973.8
Reclassification of hedging gains from other comprehensive income to assets
– 1,380.3
Purchase price according to
IFRS
3
14,593.5
Acquired cash and cash equivalents
1,235.1
Payments for 100% of the interests less acquired cash and cash equivalents
13,358.4
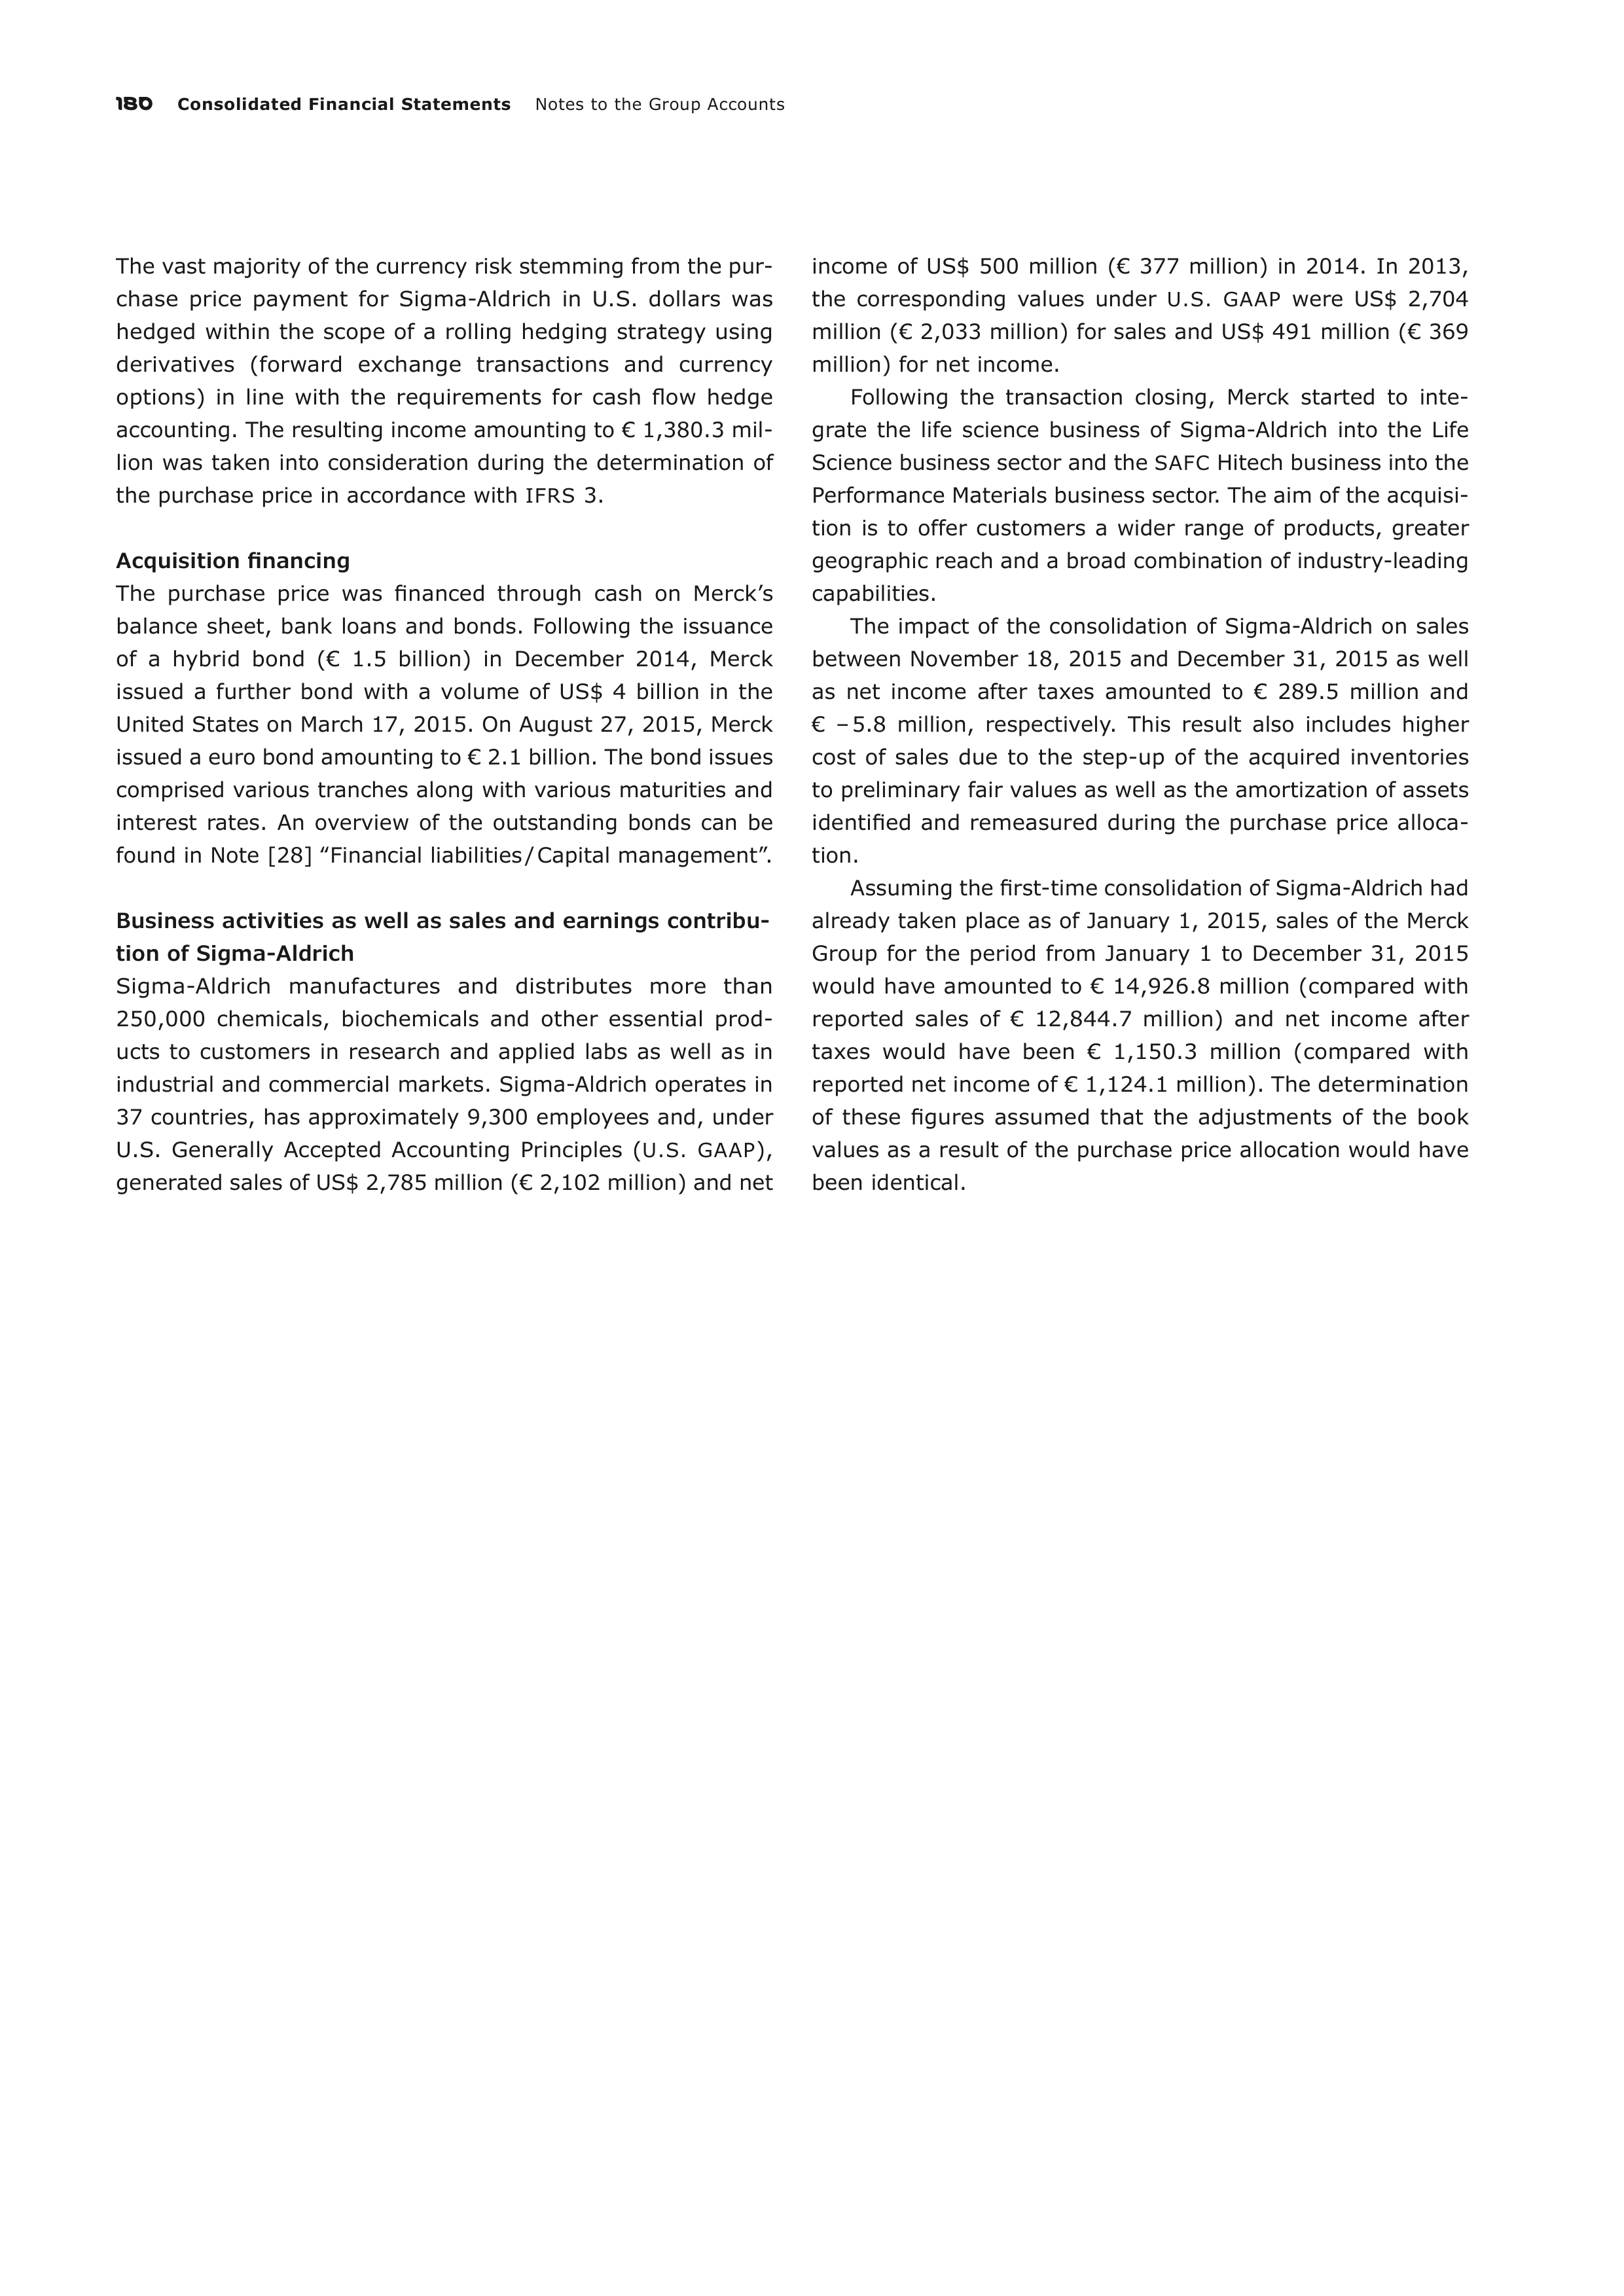
180
Consolidated Financial Statements
Notes to the Group Accounts
The vast majority of the currency risk stemming from the pur-
chase price payment for Sigma-Aldrich in U.S. dollars was
hedged within the scope of a rolling hedging strategy using
derivatives (forward exchange transactions and currency
options) in line with the requirements for cash flow hedge
accounting. The resulting income amounting to € 1,380.3 mil-
lion was taken into consideration during the determination of
the purchase price in accordance with
IFRS
3.
Acquisition financing
The purchase price was financed through cash on Merck’s
bal
ance sheet, bank loans and bonds. Following the issuance
of a hybrid bond (€ 1.5 billion) in December 2014, Merck
issued a further bond with a volume of US$ 4 billion in the
United States on March 17, 2015. On August 27, 2015, Merck
issued a euro bond amounting to € 2.1 billion. The bond issues
comprised various tranches along with various maturities and
interest rates. An overview of the outstanding bonds can be
found in Note [28] ‟Financial liabilities / Capital management”.
Business activities as well as sales and earnings contribu-
tion of Sigma-Aldrich
Sigma-Aldrich manufactures and distributes more than
250,000 chemicals, biochemicals and other essential prod-
ucts to customers in research and applied labs as well as in
industrial and commercial markets. Sigma-Aldrich operates in
37 countries, has approximately 9,300 employees and, under
U.S. Generally Accepted Accounting Principles (
U.S.
GAAP
),
generated sales of US$ 2,785 million (€ 2,102 million) and net
income of US$ 500 million (€ 377 million) in 2014. In 2013,
the corresponding values under
U.S.
GAAP
were US$ 2,704
million (€ 2,033 million) for sales and US$ 491 million (€ 369
million) for net income.
Following the transaction closing, Merck started to inte-
grate the life science business of Sigma-Aldrich into the Life
Science business sector and the
SAFC
Hitech business into the
Performance Materials business sector. The aim of the acquisi-
tion is to offer customers a wider range of products, greater
geographic reach and a broad combination of industry-leading
capabilities.
The impact of the consolidation of Sigma-Aldrich on sales
between November 18, 2015 and December 31, 2015 as well
as net income after taxes amounted to € 289.5 million and
€ – 5.8 million, respectively. This result also includes higher
cost of sales due to the step-up of the acquired inventories
to
preliminary fair values as well as the amortization of assets
identified and remeasured during the purchase price alloca-
tion.
Assuming the first-time consolidation of Sigma-Aldrich had
already taken place as of January 1, 2015, sales of the Merck
Group for the period from January 1 to December 31, 2015
would have amounted to € 14,926.8 million (compared with
reported sales of € 12,844.7 million) and net income after
taxes would have been € 1,150.3 million (compared with
reported net income of € 1,124.1 million). The determination
of these figures assumed that the adjustments of the book
values as a result of the purchase price allocation would have
been identical.
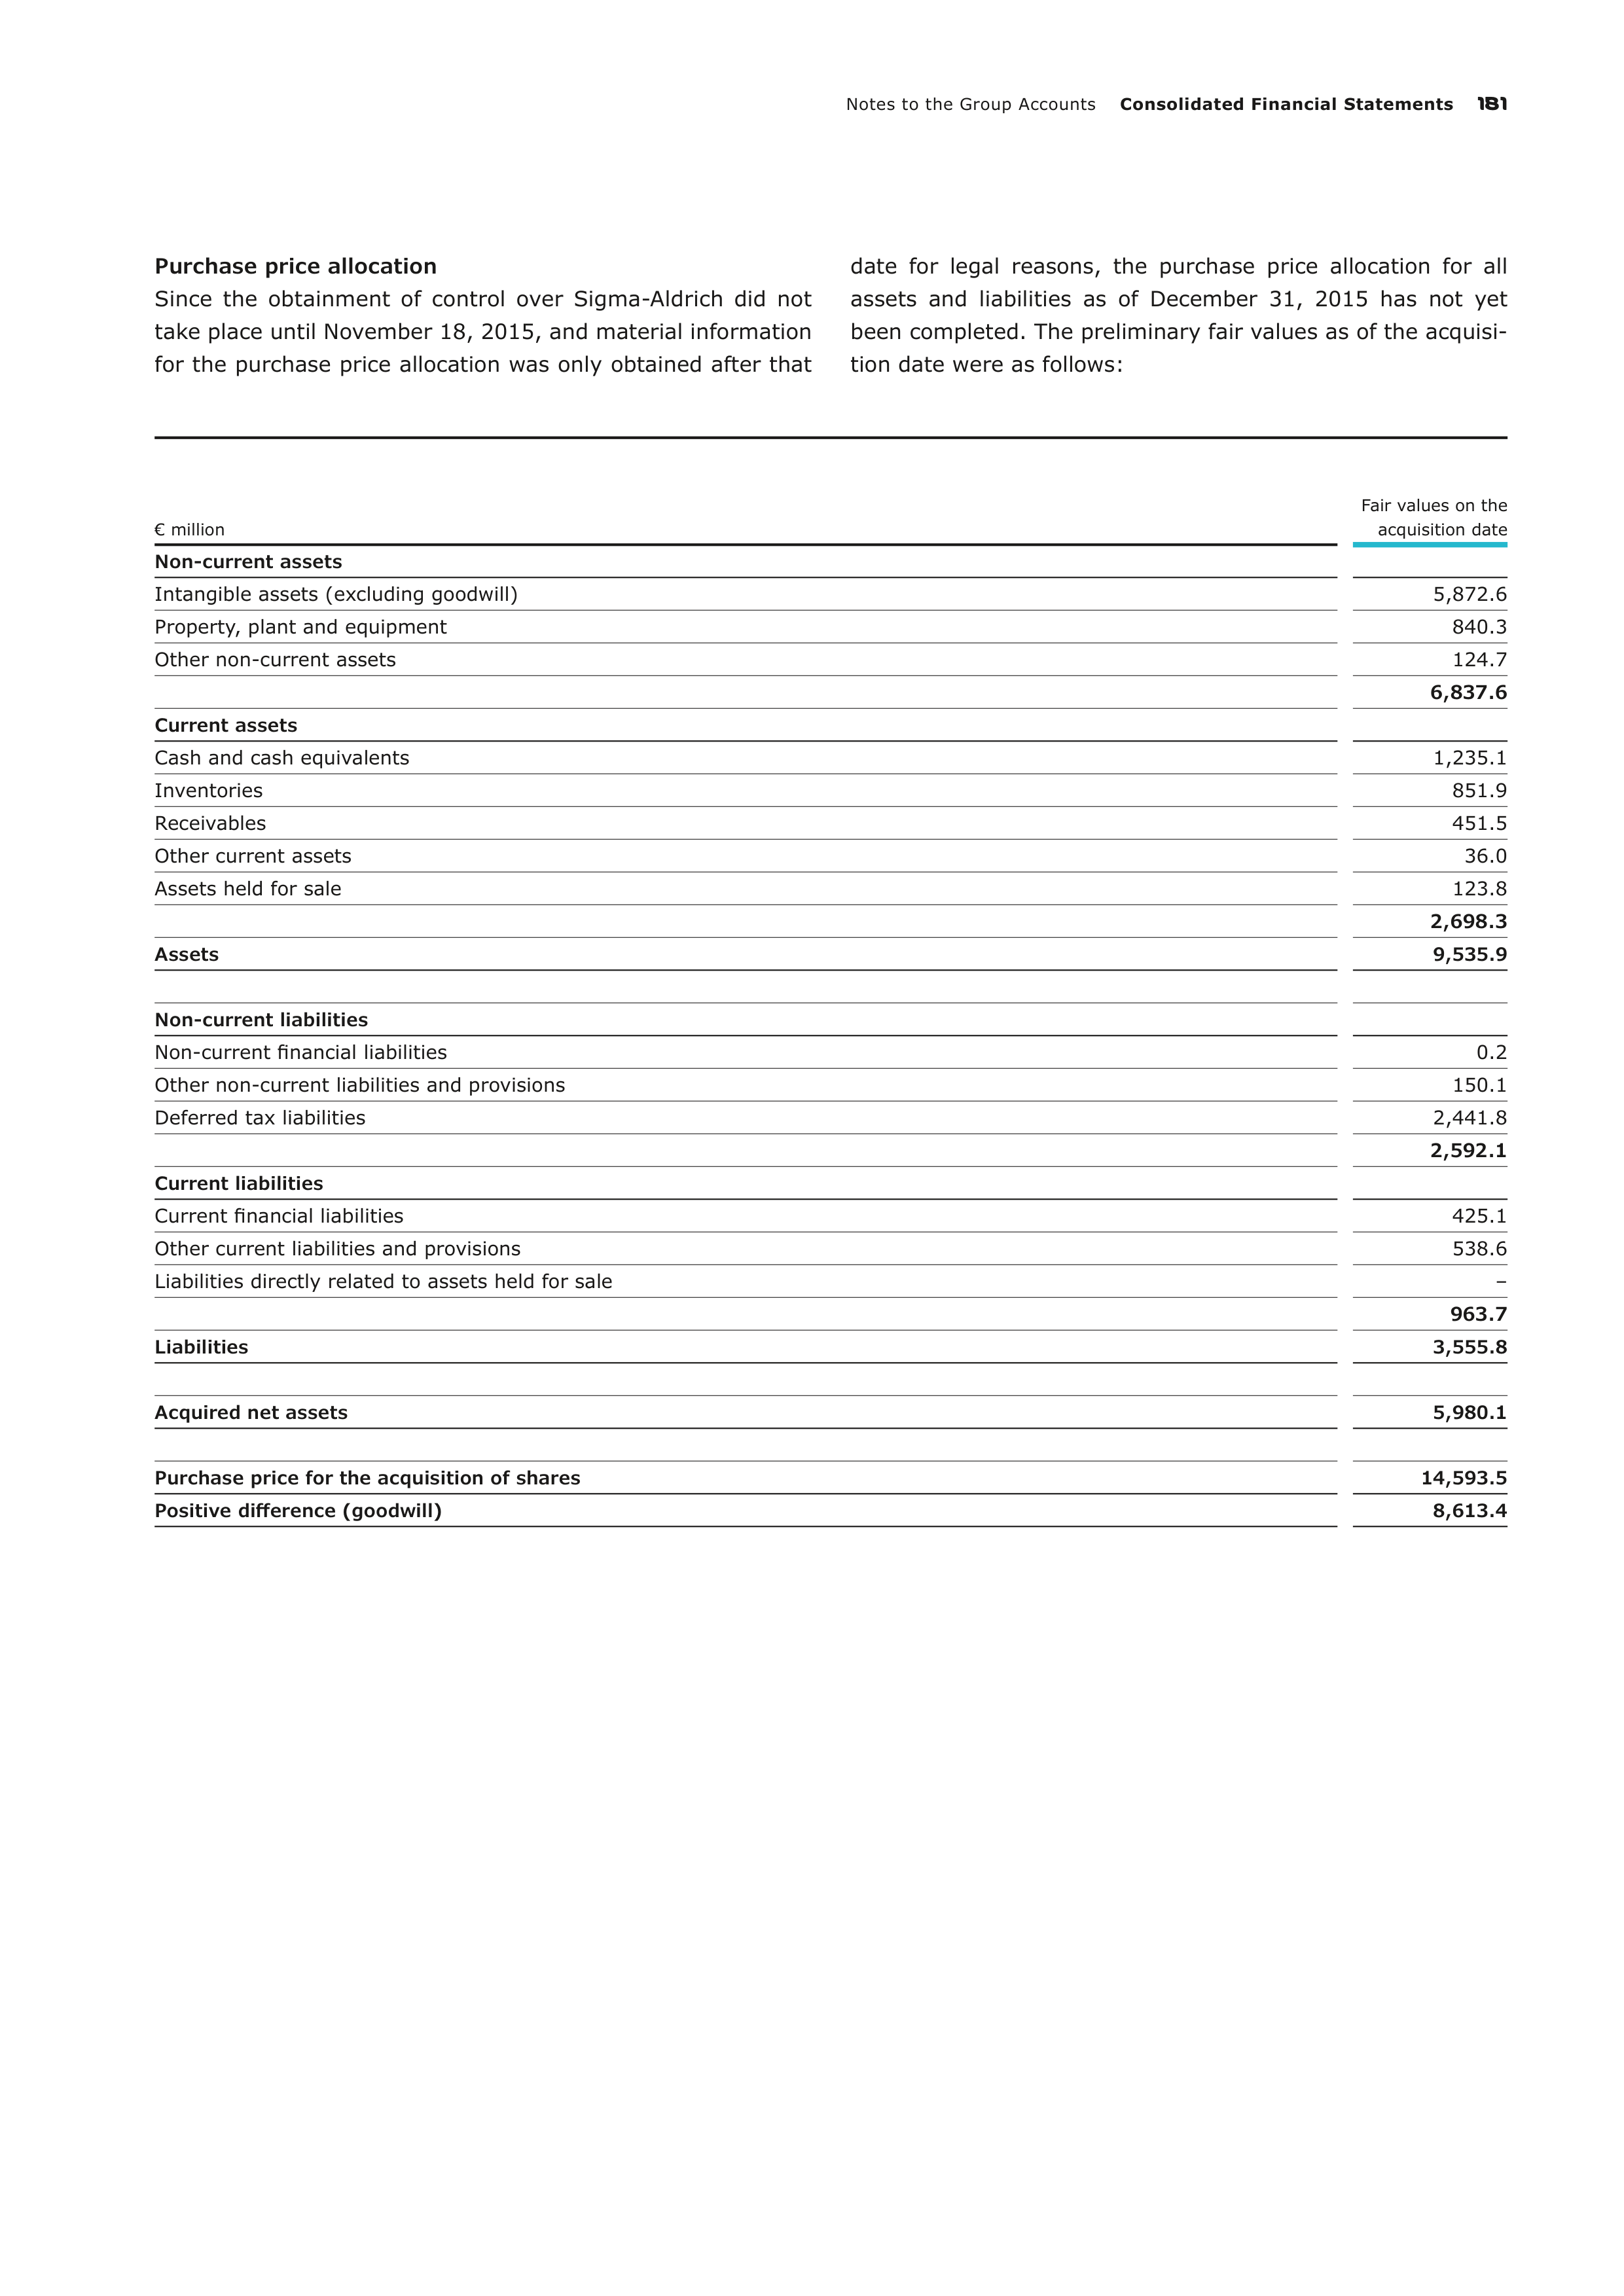
Notes to the Group Accounts
Consolidated Financial Statements
181
Purchase price allocation
Since the obtainment of control over Sigma-Aldrich did not
take place until November 18, 2015, and material information
for the purchase price allocation was only obtained after that
date for legal reasons, the purchase price allocation for all
assets and liabilities as of December 31, 2015 has not yet
been completed. The preliminary fair values as of the acquisi-
tion date were as follows:
€ million
Fair values on the
acquisition date
Non-current assets
Intangible assets (excluding goodwill)
5,872.6
Property, plant and equipment
840.3
Other non-current assets
124.7
6,837.6
Current assets
Cash and cash equivalents
1,235.1
Inventories
851.9
Receivables
451.5
Other current assets
36.0
Assets held for sale
123.8
2,698.3
Assets
9,535.9
Non-current liabilities
Non-current financial liabilities
0.2
Other non-current liabilities and provisions
150.1
Deferred tax liabilities
2,441.8
2,592.1
Current liabilities
Current financial liabilities
425.1
Other current liabilities and provisions
538.6
Liabilities directly related to assets held for sale
–
963.7
Liabilities
3,555.8
Acquired net assets
5,980.1
Purchase price for the acquisition of shares
14,593.5
Positive difference (goodwill)
8,613.4
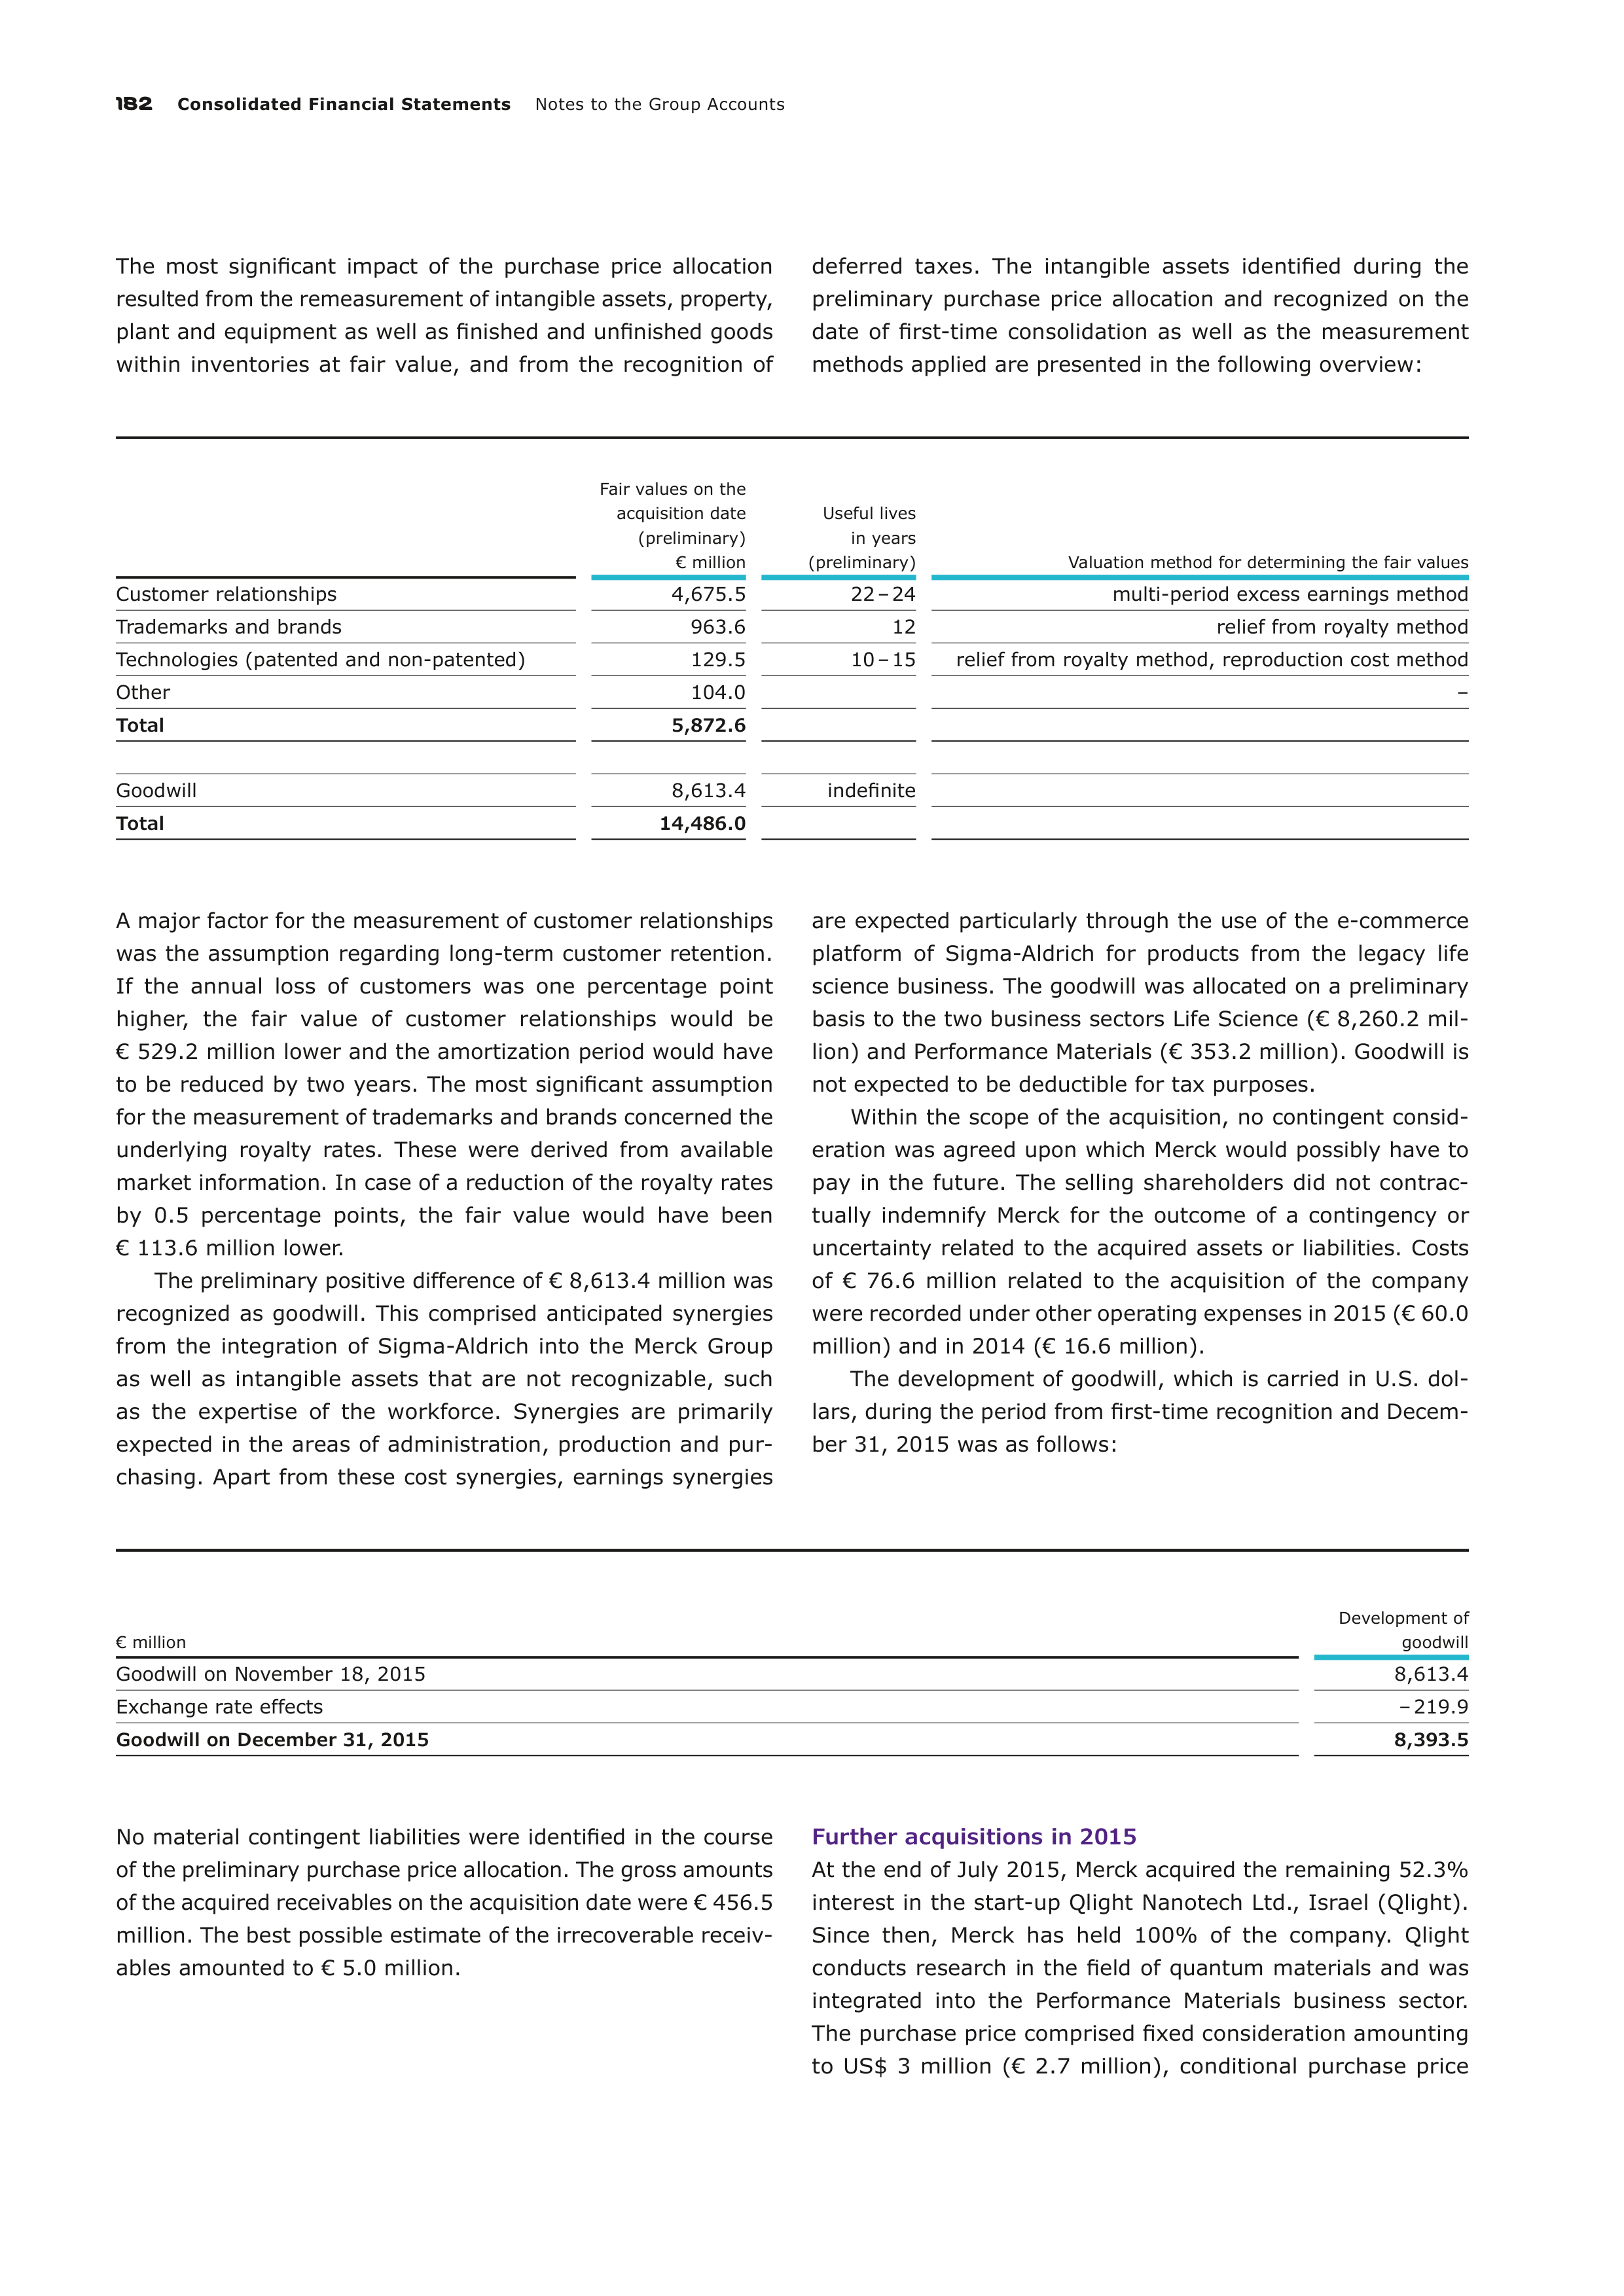
182
Consolidated Financial Statements
Notes to the Group Accounts
The most significant impact of the purchase price allocation
resulted from the remeasurement of intangible assets, property,
plant and equipment as well as finished and unfinished goods
within inventories at fair value, and from the recognition of
deferred taxes. The intangible assets identified during the
preliminary purchase price allocation and recognized on the
date of first-time consolidation as well as the measurement
methods applied are presented in the following overview:
Fair values on the
acquisition date
(preliminary)
€ million
Useful lives
in years
(preliminary)
Valuation method for determining the fair values
Customer relationships
4,675.5
22 – 24
multi-period excess earnings method
Trademarks and brands
963.6
12
relief from royalty method
Technologies (patented and non-patented)
129.5
10 – 15
relief from royalty method, reproduction cost method
Other
104.0
–
Total
5,872.6
Goodwill
8,613.4
indefinite
Total
14,486.0
A major factor for the measurement of customer relationships
was the assumption regarding long-term customer retention.
If the annual loss of customers was one percentage point
higher, the fair value of customer relationships would be
€ 529.2 million lower and the amortization period would have
to be reduced by two years. The most significant assumption
for the measurement of trademarks and brands concerned the
underlying royalty rates. These were derived from available
market information. In case of a reduction of the royalty rates
by 0.5 percentage points, the fair value would have been
€ 113.6 million lower.
The preliminary positive difference of € 8,613.4 million was
recognized as goodwill. This comprised anticipated synergies
from the integration of Sigma-Aldrich into the Merck Group
as well as intangible assets that are not recognizable, such
as the expertise of the workforce. Synergies are primarily
expected in the areas of administration, production and pur-
chasing. Apart from these cost synergies, earnings synergies
are expected particularly through the use of the e-commerce
platform of Sigma-Aldrich for products from the legacy life
science business. The goodwill was allocated on a preliminary
basis to the two business sectors Life Science (€ 8,260.2 mil-
lion) and Performance Materials (€ 353.2 million). Goodwill is
not expected to be deductible for tax purposes.
Within the scope of the acquisition, no contingent consid-
eration was agreed upon which Merck would possibly have to
pay in the future. The selling shareholders did not contrac-
tu
ally indemnify Merck for the outcome of a contingency or
uncertainty related to the acquired assets or liabilities. Costs
of € 76.6 million related to the acquisition of the company
were recorded under other operating expenses in 2015 (€ 60.0
million) and in 2014 (€ 16.6 million).
The development of goodwill, which is carried in U.S. dol-
lars, during the period from first-time recognition and Decem-
ber 31, 2015 was as follows:
€ million
Development of
goodwill
Goodwill on November 18, 2015
8,613.4
Exchange rate effects
– 219.9
Goodwill on December 31, 2015
8,393.5
No material contingent liabilities were identified in the course
of the preliminary purchase price allocation. The gross amounts
of the acquired receivables on the acquisition date were € 456.5
million. The best possible estimate of the irrecoverable receiv-
ables amounted to € 5.0 million.
Further acquisitions in 2015
At the end of July 2015, Merck acquired the remaining 52.3%
interest in the start-up Qlight Nanotech Ltd., Israel (Qlight).
Since then, Merck has held 100% of the company. Qlight
con
ducts research in the field of quantum materials and was
integrated into the Performance Materials business sector.
The purchase price comprised fixed consideration amounting
to US$ 3 million (€ 2.7 million), conditional purchase price
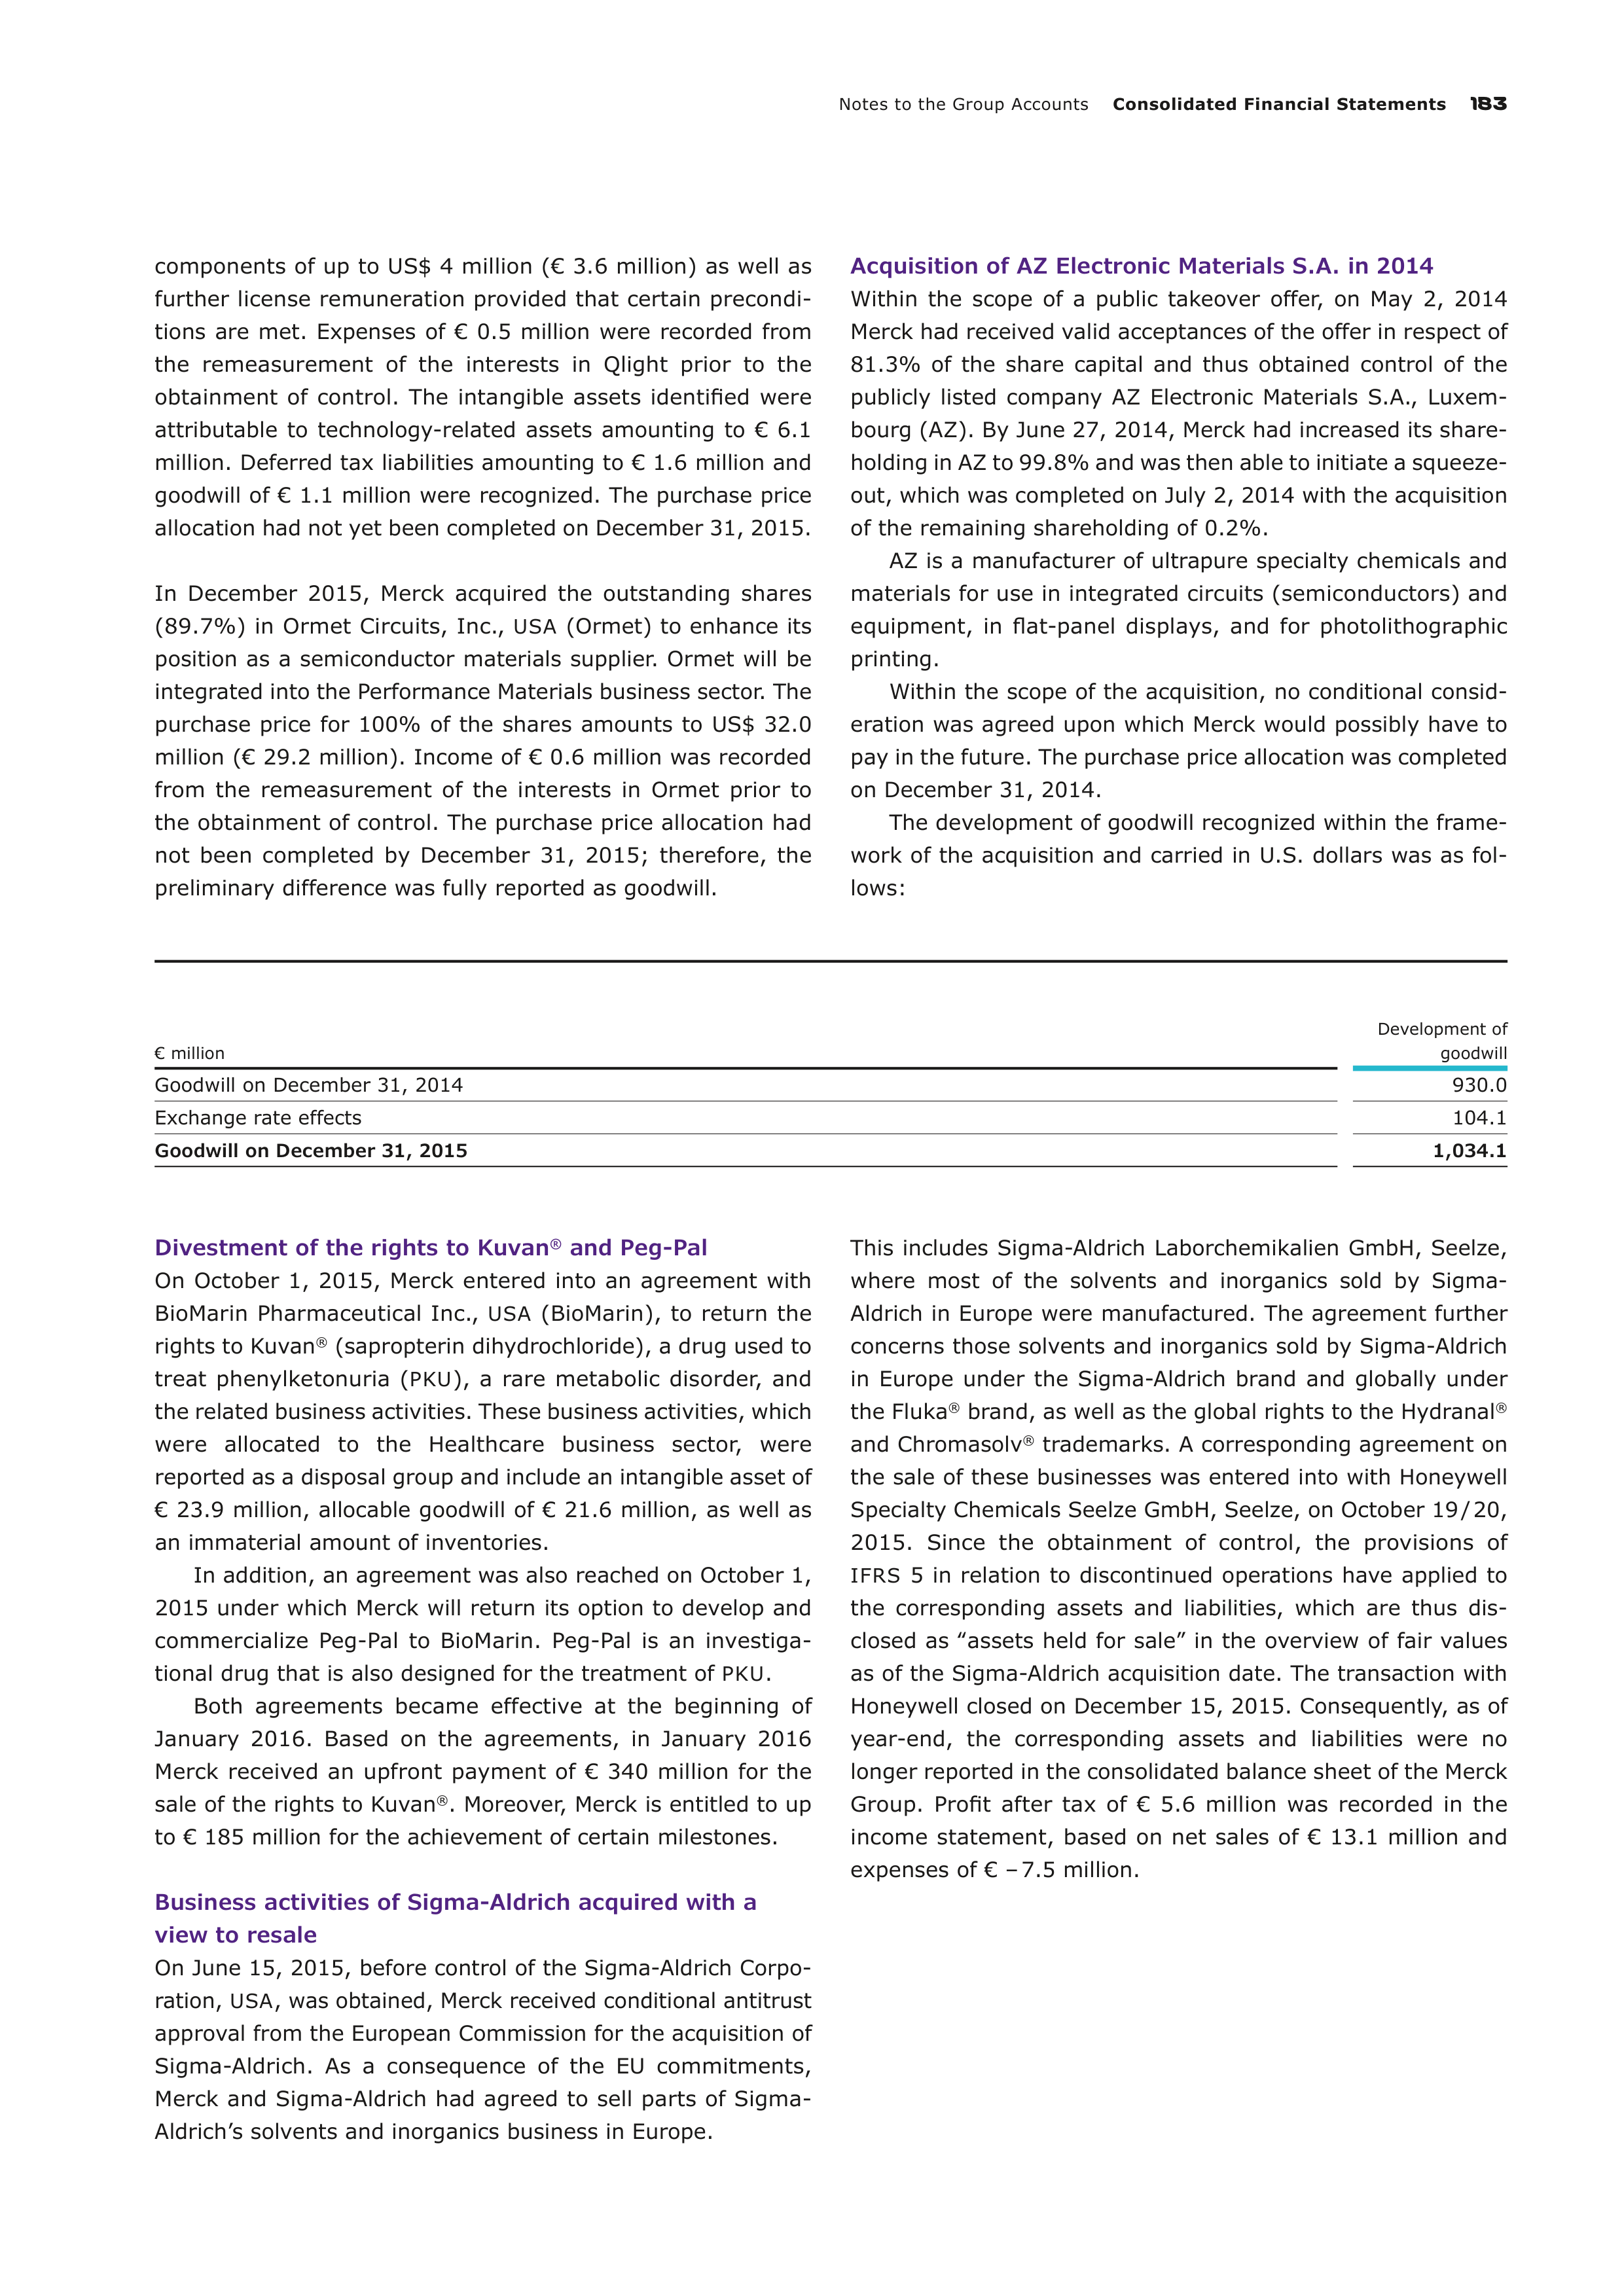
Notes to the Group Accounts
Consolidated Financial Statements
183
components of up to US$ 4 million (€ 3.6 million) as well as
further license remuneration provided that certain precondi-
tions are met. Expenses of € 0.5 million were recorded from
the remeasurement of the interests in Qlight prior to the
obtainment of control. The intangible assets identified were
attributable to technology-related assets amounting to € 6.1
million. Deferred tax liabilities amounting to € 1.6 million and
goodwill of € 1.1 million were recognized. The purchase price
allocation had not yet been completed on December 31, 2015.
In December 2015, Merck acquired the outstanding shares
(89.7%) in Ormet Circuits, Inc.,
USA
(Ormet) to enhance its
position as a semiconductor materials supplier. Ormet will be
integrated into the Performance Materials business sector. The
purchase price for 100% of the shares amounts to US$ 32.0
million (€ 29.2 million). Income of € 0.6 million was recorded
from the remeasurement of the interests in Ormet prior to
the obtainment of control. The purchase price allocation had
not been completed by December 31, 2015; therefore, the
preliminary difference was fully reported as goodwill.
Acquisition of AZ Electronic Materials S.A. in 2014
Within the scope of a public takeover offer, on May 2, 2014
Merck had received valid acceptances of the offer in respect of
81.3% of the share capital and thus obtained control of the
publicly listed company AZ Electronic Materials S.A., Luxem-
bourg (AZ). By June 27, 2014, Merck had increased its share-
holding in AZ to 99.8% and was then able to initiate a squeeze-
out, which was completed on July 2, 2014 with the acquisition
of the remaining shareholding of 0.2%.
AZ is a manufacturer of ultrapure specialty chemicals and
materials for use in integrated circuits (semiconductors) and
equipment, in flat-panel displays, and for photolithographic
printing.
Within the scope of the acquisition, no conditional consid-
eration was agreed upon which Merck would possibly have to
pay in the future. The purchase price allocation was completed
on December 31, 2014.
The development of goodwill recognized within the frame-
work of the acquisition and carried in U.S. dollars was as fol-
lows:
€ million
Development of
goodwill
Goodwill on December 31, 2014
930.0
Exchange rate effects
104.1
Goodwill on December 31, 2015
1,034.1
Divestment of the rights to Kuvan
®
and Peg-Pal
On October 1, 2015, Merck entered into an agreement with
BioMarin Pharmaceutical Inc.,
USA
(BioMarin), to return the
rights to Kuvan
®
(sapropterin dihydrochloride), a drug used to
treat phenylketonuria (
PKU
), a rare metabolic disorder, and
the related business activities. These business activities, which
were allocated to the Healthcare business sector, were
reported as a disposal group and include an intangible asset of
€ 23.9 million, allocable goodwill of € 21.6 million, as well as
an immaterial amount of inventories.
In addition, an agreement was also reached on October 1,
2015 under which Merck will return its option to develop and
commercialize Peg-Pal to BioMarin. Peg-Pal is an investiga-
tional drug that is also designed for the treatment of
PKU
.
Both agreements became effective at the beginning of
January 2016. Based on the agreements, in January 2016
Merck received an upfront payment of € 340 million for the
sale of the rights to Kuvan
®
. Moreover, Merck is entitled to up
to € 185 million for the achievement of certain milestones.
Business activities of Sigma-Aldrich acquired with a
view to resale
On June 15, 2015, before control of the Sigma-Aldrich Corpo-
ration,
USA
, was obtained, Merck received conditional antitrust
approval from the European Commission for the acquisition of
Sigma-Aldrich. As a consequence of the EU commitments,
Merck and Sigma-Aldrich had agreed to sell parts of Sigma-
Aldrich’s solvents and inorganics business in Europe.
This includes Sigma-Aldrich Laborchemikalien GmbH, Seelze,
where most of the solvents and inorganics sold by Sigma-
Aldrich in Europe were manufactured. The agreement further
concerns those solvents and inorganics sold by Sigma-Aldrich
in Europe under the Sigma-Aldrich brand and globally under
the Fluka
®
brand, as well as the global rights to the Hydranal
®
and Chromasolv
®
trademarks. A corresponding agreement on
the sale of these businesses was entered into with Honeywell
Specialty Chemicals Seelze GmbH, Seelze, on October 19 / 20,
2015. Since the obtainment of control, the provisions of
IFRS
5 in relation to discontinued operations have applied to
the corresponding assets and liabilities, which are thus dis-
closed as ‟assets held for sale” in the overview of fair values
as of the Sigma-Aldrich acquisition date. The transaction with
Honeywell closed on December 15, 2015. Consequently, as of
year-end, the corresponding assets and liabilities were no
longer reported in the consolidated balance sheet of the Merck
Group. Profit after tax of € 5.6 million was recorded in the
income statement, based on net sales of € 13.1 million and
expenses of € – 7.5 million.
184
Consolidated Financial Statements
Notes to the Group Accounts
(5) Joint arrangements of material
significance
Strategic alliance with Pfizer Inc.,
USA
, to co-develop and
co-commercialize active ingredients in immunooncology
On November 17, 2014 Merck formed a global strategic alli-
ance with Pfizer Inc.,
USA
, (Pfizer) to co-develop and co-
commercialize the anti-PD-L1 antibody avelumab (also known
as
MSB
0010718C). This antibody is currently being studied in
multiple clinical trials as a potential treatment for further
tumor types. The active ingredient is to be developed as a
single agent as well as in various combinations with Pfizer’s
and Merck’s broad portfolio of approved and investigational
pipeline candidates. As part of the strategic alliance, the two
companies will combine resources and expertise to also co-
develop and co-market Pfizer’s anti-PD-1 antibody. The over-
riding objective of the strategic alliance is share the risks of
development and to accelerate the two companies’ presence
in immuno-oncology.
According to the collaboration agreement, during the
development period each partner will bear one-half of the
development expenses. In a potentially later commercializa-
tion phase, Merck will realize the vast majority of sales from
the commercialization of avelumab while Merck and Pfizer will
split defined income and expense components.
The execution of the collaboration agreement is not being
structured through a separate vehicle. This means that the
assets and liabilities attributable to the contractual arrange-
ment are owned by the two contract partners. Decisions about
the relevant activities require unanimous consent in accordance
with the collaboration agreement. Therefore, the accounting
rules governing joint operations pursuant to
IFRS
11 are
applied and Merck records the assets, liabilities, revenues and
expenses attributable to the collaboration in accordance with
the respectively valid
IFRS
.
Under the terms of the agreement, in 2014 Pfizer made an
upfront cash payment of US$ 850 million (€ 678.3 million) to
Merck after the closing. Pfizer also committed to make further
payments of up to US$ 2 billion to Merck subject to the
achievement of defined regulatory and commercial mile-
stones. Based on the collaboration agreement, Merck addi-
tionally received the right to co-market for multiple years
Xalkori
®
(crizotinib), a drug for the treatment of non-small-cell
lung cancer, in the United States and certain other major mar-
kets. During co-commercialization of the product, Merck will
receive from Pfizer compensation for marketing activities and
a share of the profits. The fair value of the right was deter-
mined by an independent external expert using the multi-
period excess earnings method. The entitlement to the right
was capitalized when it was granted and will be amortized over
the term of the agreement. The residual book value of these
assets as of December 31, 2015 was € 261.7 million (2014:
€ 294.4 million).
On the date of the closing of the collaboration agreement,
both the upfront payment received and the value of the right
to co-market Xalkori
®
were recognized in the balance sheet as
deferred revenues under other liabilities. Both amounts are
being recognized over the expected period during which Merck
is to meet certain obligations and will be disclosed under other
operating income. More information on the exercise of man-
agement judgments and estimation uncertainties in this regard
can be found in Note [7] ‟Management judgments and sources
of estimation uncertainty.”
Agreement with Threshold Pharmaceuticals, Inc.,
USA
,
to co-develop and co-market evofosfamide
In February 2012, Merck entered into a global agreement
with
Threshold Pharmaceuticals, Inc.,
USA
(Threshold), to co-
develop and co-commercialize evofosfamide (also known as
TH-302), a chemical molecule for use in cancer treatment.
Under the terms of the agreement, Merck received co-
development rights as well as exclusive global commerciali-
za
tion rights. Threshold had the option to co-commercialize
the therapeutic in the United States.
On December 7, 2015, Merck announced that it will not
submit evofosfamide for approval in locally advanced inoper-
able or metastatic soft-tissue sarcoma as well as advanced
pancreatic cancer after two Phase
III
studies had failed to meet
their primary endpoints in these indications. Consequently,
the upfront and milestone payments that had been capitalized
as intangible assets with indefinite useful lives as well as cap-
italized borrowing costs amounting to € 84.4 million were
impaired in full in December 2015.
Agreement with Eli Lilly and Company,
USA
and
Bristol-Myers Squibb Company,
USA
for the
co-commercialization of Erbitux
®
in Japan
Until its termination, which took effect on May 1, 2015, an
agreement was in place between Merck, ImClone Systems Inc.,
USA
(which has now merged into Eli Lilly and Company,
USA
)
and Bristol-Myers Squibb Company,
USA
, for the co-
develop-
ment and co-commercialization of Erbitux
®
(cetuximab), a drug
indicated for the treatment of metastatic colorectal cancer, as
well as for other cancers, in Japan. Since the collaboration
ended, Merck has been marketing the aforementioned activities
itself in Japan, bearing exclusive overall responsibility.
Up until the end of the agreement, Merck recorded sales of
€ 36.7 million from the commercialization of Erbitux
®
in Japan
(2014 in full: € 113.2 million).
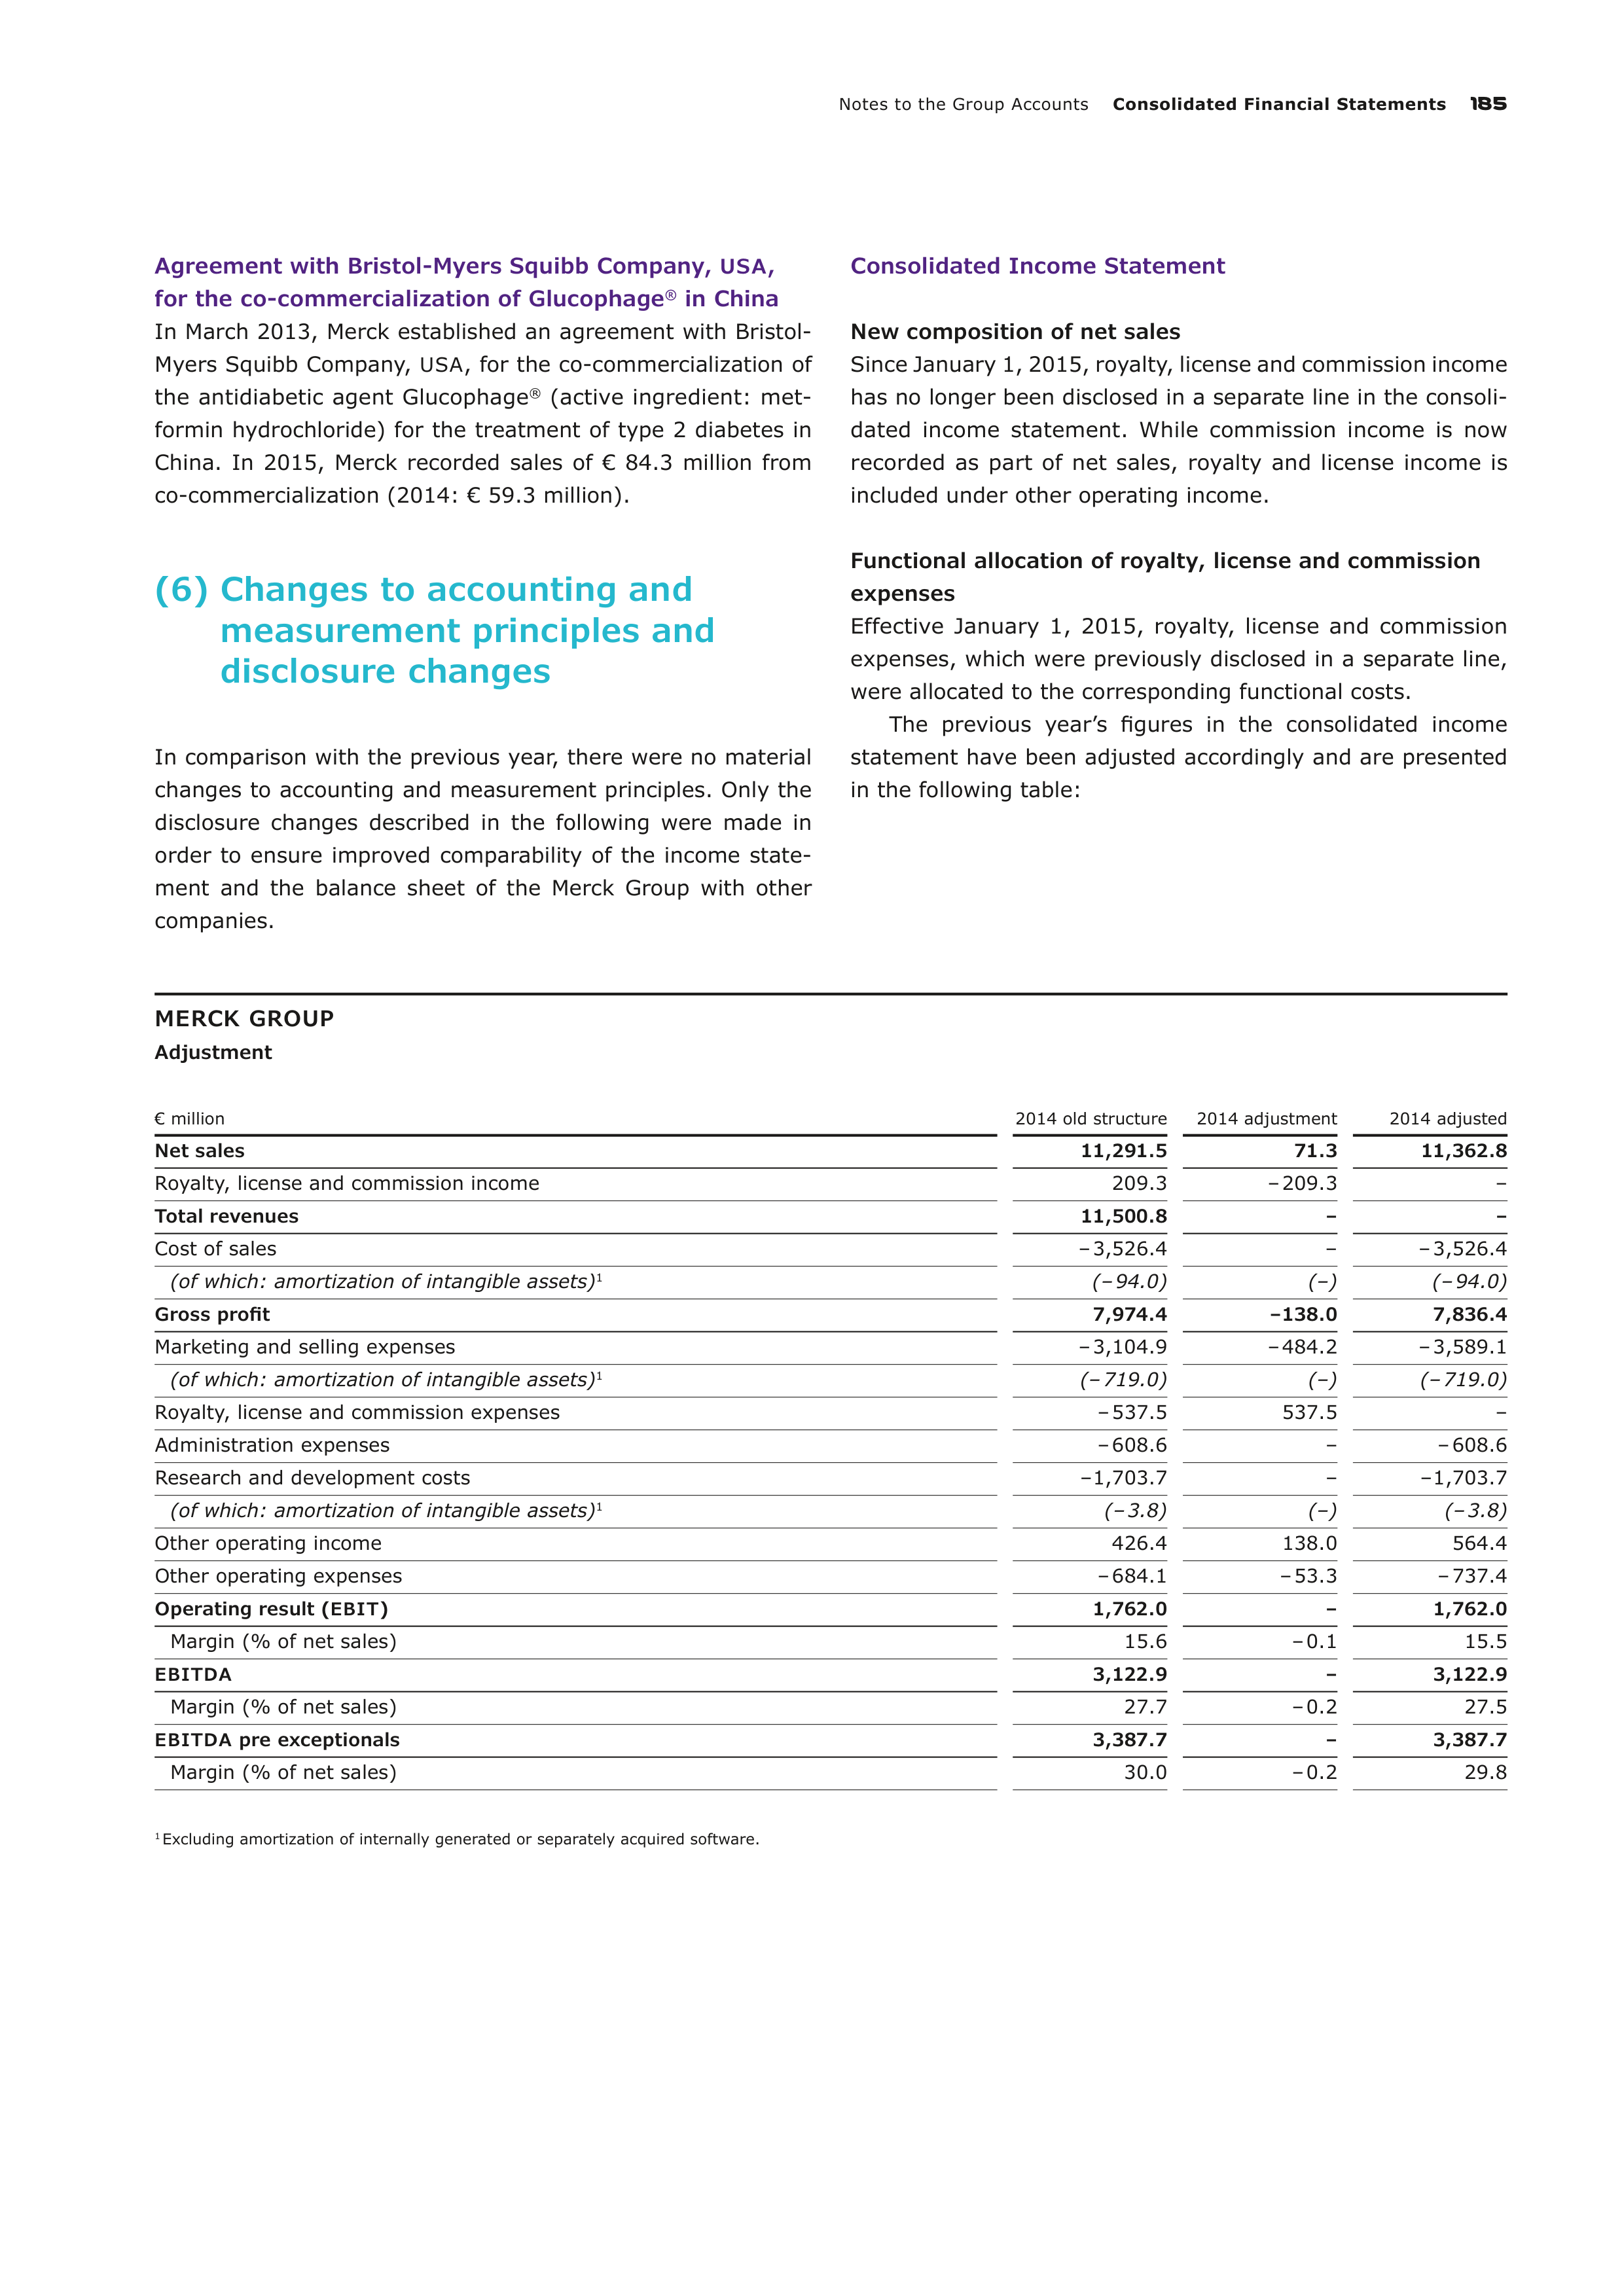
Notes to the Group Accounts
Consolidated Financial Statements
185
Agreement with Bristol-Myers Squibb Company,
USA
,
for the co-commercialization of Glucophage
®
in China
In March 2013, Merck established an agreement with Bristol-
Myers Squibb Company,
USA
, for the co-commercialization of
the antidiabetic agent Glucophage
®
(active ingredient: met-
formin hydrochloride) for the treatment of type 2 diabetes in
China. In 2015, Merck recorded sales of € 84.3 million from
co-commercialization (2014: € 59.3 million).
(6) Changes to accounting and
measurement principles and
disclosure changes
In comparison with the previous year, there were no material
changes to accounting and measurement principles. Only the
disclosure changes described in the following were made in
order to ensure improved comparability of the income state-
ment and the balance sheet of the Merck Group with other
companies.
Consolidated Income Statement
New composition of net sales
Since January 1, 2015, royalty, license and commission income
has no longer been disclosed in a separate line in the consoli-
dated income statement. While commission income is now
recorded as part of net sales, royalty and license income is
included under other operating income.
Functional allocation of royalty, license and commission
expenses
Effective January 1, 2015, royalty, license and commission
expenses, which were previously disclosed in a separate line,
were allocated to the corresponding functional costs.
The previous year’s figures in the consolidated income
statement have been adjusted accordingly and are presented
in the following table:
MERCK GROUP
Adjustment
€ million
2014 old structure
2014 adjustment
2014 adjusted
Net sales
11,291.5
71.3
11,362.8
Royalty, license and commission income
209.3
– 209.3
–
Total revenues
11,500.8
–
–
Cost of sales
– 3,526.4
–
– 3,526.4
(of which: amortization of intangible assets)
1
(– 94.0)
(–)
(– 94.0)
Gross profit
7,974.4
– 138.0
7,836.4
Marketing and selling expenses
– 3,104.9
– 484.2
– 3,589.1
(of which: amortization of intangible assets)
1
(– 719.0)
(–)
(– 719.0)
Royalty, license and commission expenses
– 537.5
537.5
–
Administration expenses
– 608.6
–
– 608.6
Research and development costs
– 1,703.7
–
– 1,703.7
(of which: amortization of intangible assets)
1
(– 3.8)
(–)
(– 3.8)
Other operating income
426.4
138.0
564.4
Other operating expenses
– 684.1
– 53.3
– 737.4
Operating result (
EBIT
)
1,762.0
–
1,762.0
Margin (% of net sales)
15.6
– 0.1
15.5
EBITDA
3,122.9
–
3,122.9
Margin (% of net sales)
27.7
– 0.2
27.5
EBITDA
pre exceptionals
3,387.7
–
3,387.7
Margin (% of net sales)
30.0
– 0.2
29.8
1
Excluding amortization of internally generated or separately acquired software.
186
Consolidated Financial Statements
Notes to the Group Accounts
Consolidated Balance Sheet
Balance sheet structure
Since January 1, 2015, the consolidated balance sheet of the
Merck Group has been structured in descending order of
maturity. The previous year’s figures have been adjusted
accordingly.
Disclosure of receivables from royalties and licenses
As a result of the disclosure of royalty and license income
under other operating income, in the consolidated balance
sheet dated December 31, 2014, receivables from royalties
and licenses, which amounted to € 16.1 million and were pre-
viously included under trade accounts receivable, were reclas-
sified to other current assets.
Segment Reporting
On January 1, 2015, the Merck Group changed its segment
reporting structure to report on the three segments Health-
care, Life Science and Performance Materials. The Healthcare
business sector comprises the businesses that were reported
separately as the Merck Serono and Consumer Health seg-
ments in the previous year. The Life Science business sector
comprises the Merck Millipore business as well as the acquired
life science business of the Sigma-Aldrich Corporation,
USA
.
The Performance Materials business sector corresponds to the
segment of the same name in the previous year as well as the
acquired
SAFC
Hitech business of Sigma-Aldrich. More infor-
mation on the new segmentation as well as reconciliation of
the previous year’s figures by business sector can be found in
Note [33] ‟Information on segment reporting”.
As regards segment reporting by country and region, the
composition of regions was adjusted and the corresponding
comparative year-earlier figures are presented. The regional
reporting structure now comprises five regions: Europe, North
America, Asia-Pacific, Latin America as well as Middle East and
Africa.
(7) Management judgments and
sources of estimation uncertainty
The preparation of the consolidated financial statements
requires management to make discretionary decisions and
assumptions as well as estimates to a certain extent. The dis-
cretionary decisions, assumptions relating to the future and
sources of estimation uncertainty described below are associ-
ated with the greatest potential effects on these consolidated
financial statements.
Recognition and measurement of assets, liabilities and
contingent liabilities acquired in the context of business
combinations
The recognition and measurement of assets, liabilities and
contingent liabilities at fair value during purchase price alloca-
tions involve the use of estimates. The expertise of external
valuation experts is obtained here. The fair values of the
assets and liabilities recognized as part of the purchase price
allocation of the Sigma-Aldrich Corporation and further infor-
mation on this acquisition, which closed in the reporting period,
can be found in Note [4] ‟Acquisitions, assets held for sale and
disposal groups”.
Sales deductions
Merck grants its customers various kinds of rebates and dis-
counts. In addition, expected returns, state compulsory
charges and rebates from health plans and programs are also
deducted from sales.
The most significant portion of these deductions from sales
is attributable to the Healthcare business sector. The most
substantial sales deductions in this business sector relate to
government rebate programs in North America such as the
‟U.S. Federal Medicare Program” and the ‟U.S. Medicaid Drug
Rebate Program”. Other significant sales deductions in the
business sector result from compulsory government rebate
programs in individual European countries.
Insofar as sales deductions were not already made on pay-
ments received, Merck determines the level of sales deduc-
tions on the basis of current experience and recognizes them
as a liability. The sales deductions reduce gross sales revenues.
Adjustments of liabilities can lead to increases or reductions of
income in later periods.
Impairment tests of goodwill and other intangible assets
with indefinite useful lives
The goodwill (carrying amount as of December 31, 2015:
€ 14,370.1 million / 2014: € 5,693.9 million) and other intan-
gible assets with indefinite useful lives (carrying amount as of
December 31, 2015: € 183.6 million / 2014: € 168.7 million)
reported in the consolidated financial statements are tested
for impairment at least once a year or when a triggering event
arises. The carrying amounts of goodwill are allocated to the
following cash-generating units or groups of cash-generating
units on which level the impairment tests were performed:
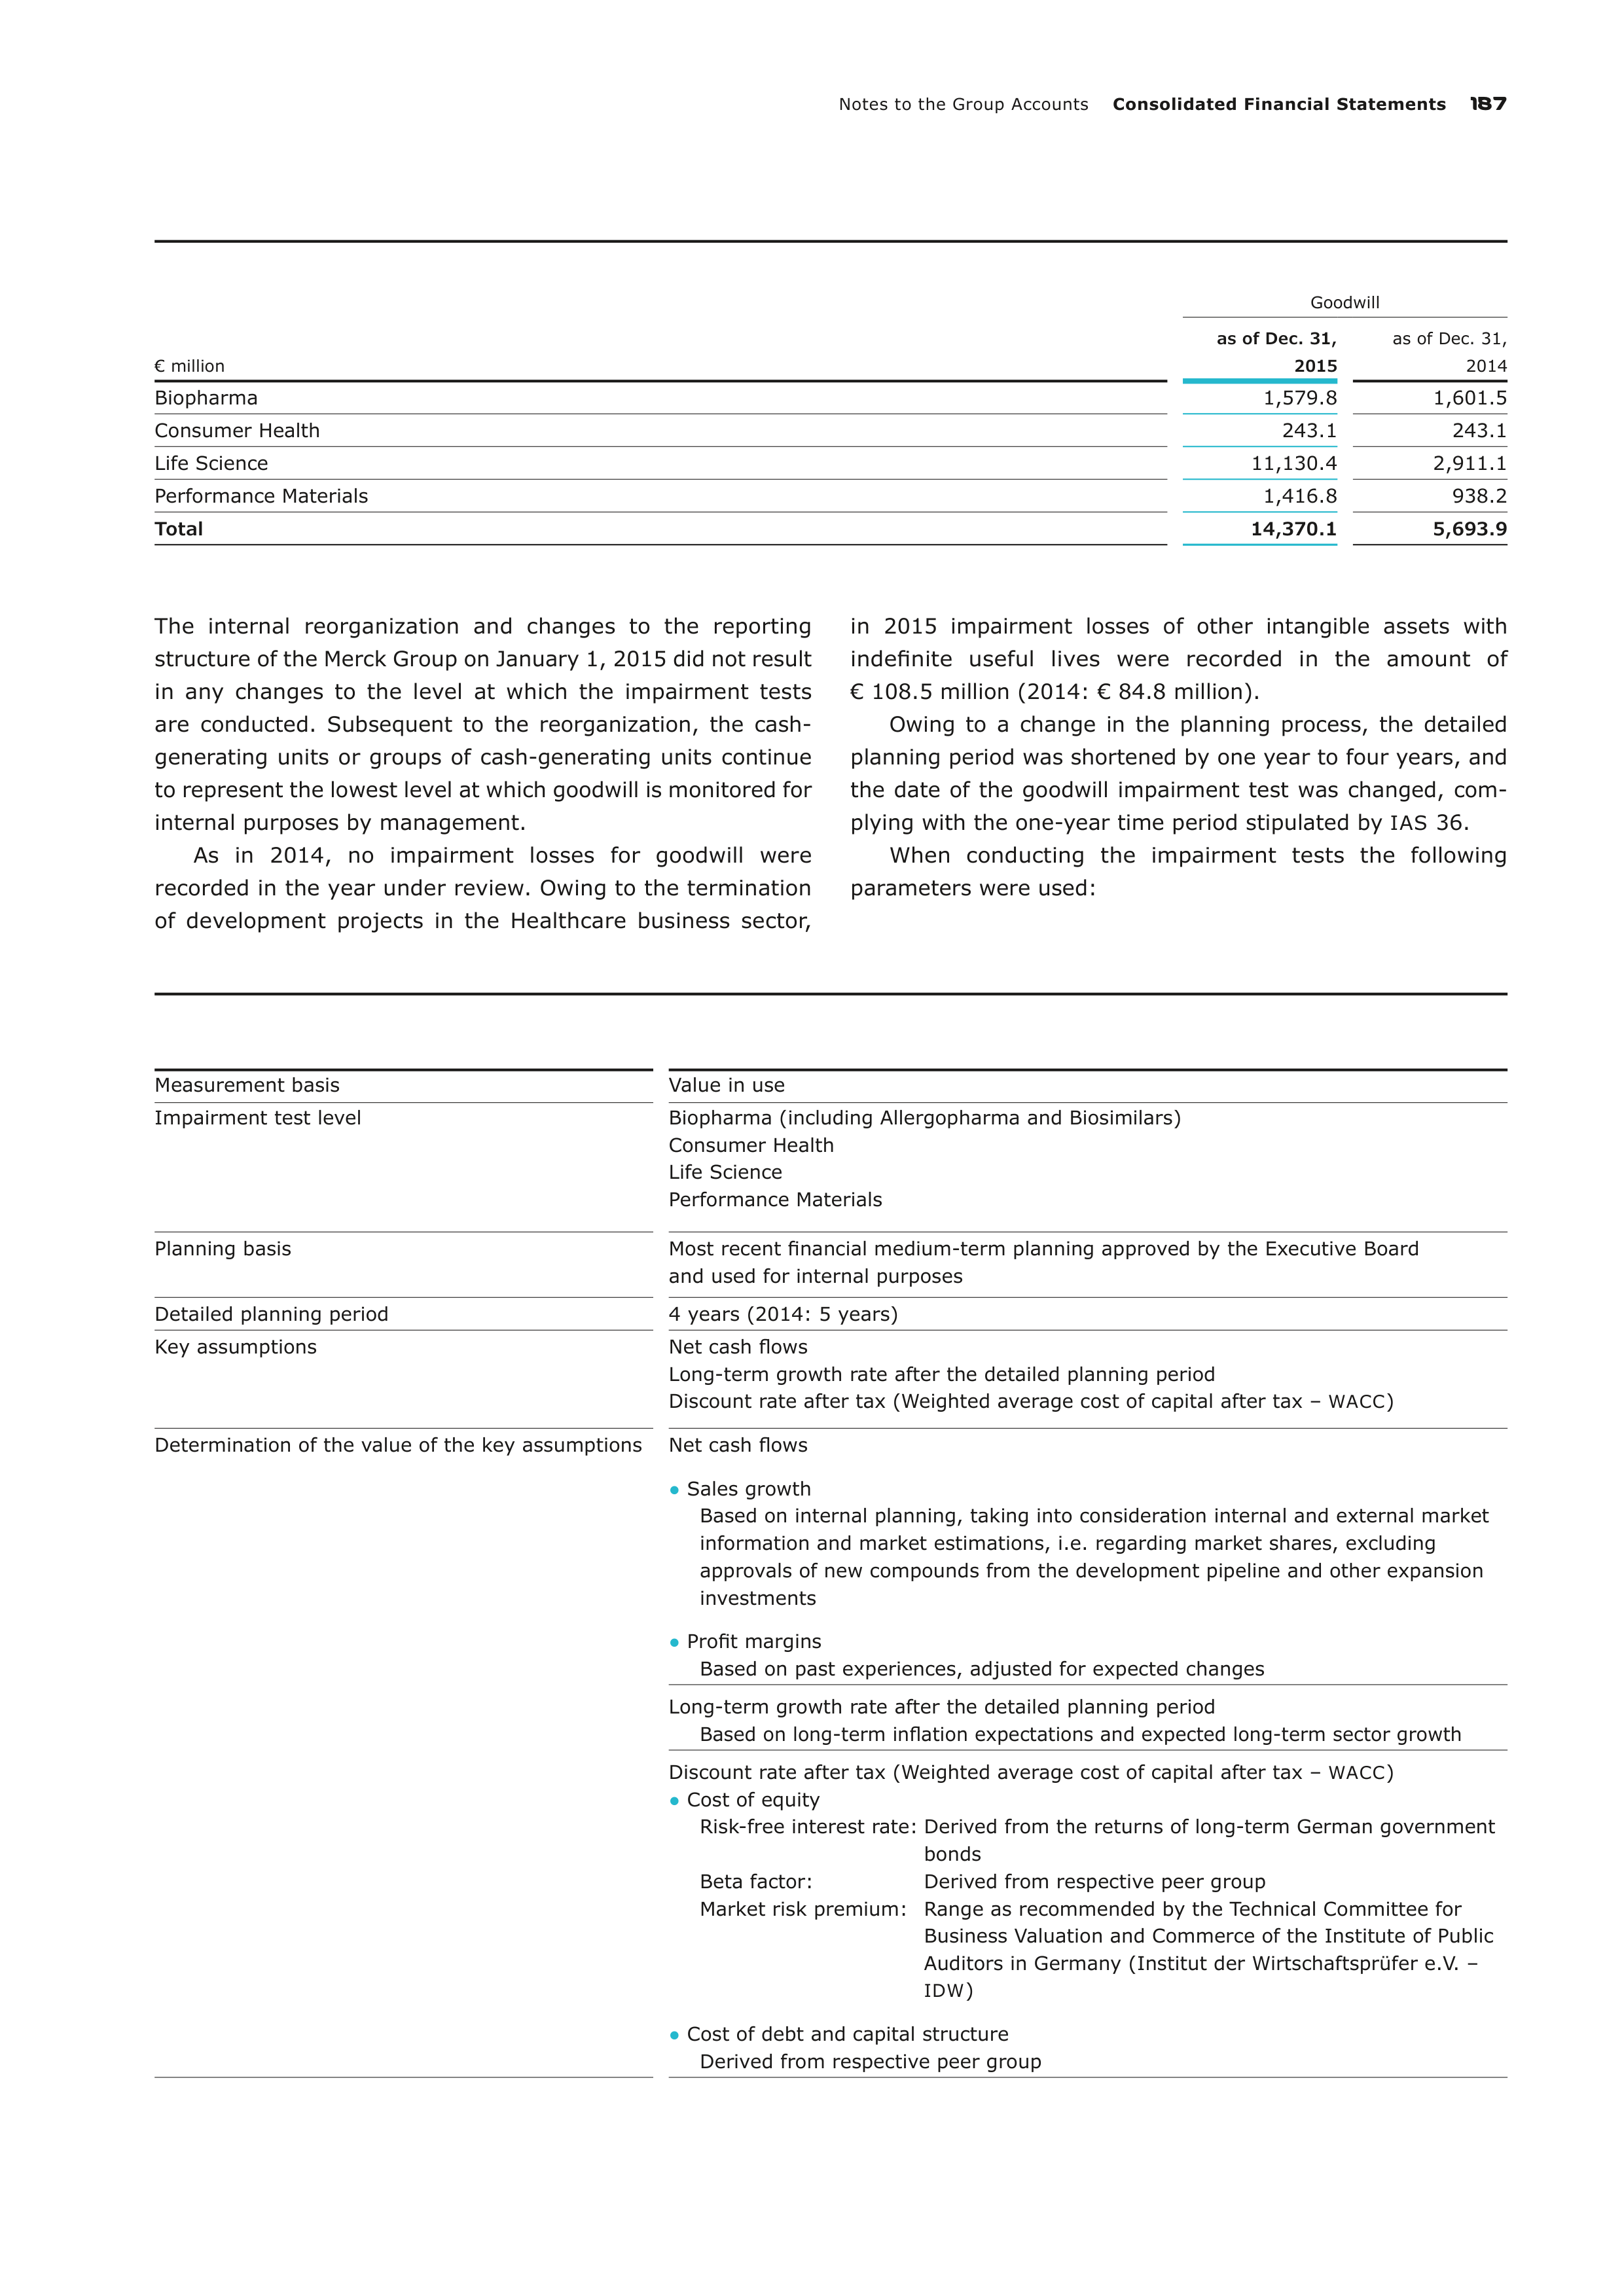
Notes to the Group Accounts
Consolidated Financial Statements
187
Goodwill
€ million
as of Dec. 31,
2015
as of Dec. 31,
2014
Biopharma
1,579.8
1,601.5
Consumer Health
243.1
243.1
Life Science
11,130.4
2,911.1
Performance Materials
1,416.8
938.2
Total
14,370.1
5,693.9
The internal reorganization and changes to the reporting
structure of the Merck Group on January 1, 2015 did not result
in any changes to the level at which the impairment tests
are
conducted. Subsequent to the reorganization, the cash-
generating units or groups of cash-generating units continue
to represent the lowest level at which goodwill is monitored for
internal purposes by management.
As in 2014, no impairment losses for goodwill were
recorded in the year under review. Owing to the termination
of development projects in the Healthcare business sector,
in
2015 impairment losses of other intangible assets with
indefinite useful lives were recorded in the amount of
€ 108.5 million (2014: € 84.8 million).
Owing to a change in the planning process, the detailed
planning period was shortened by one year to four years, and
the date of the goodwill impairment test was changed, com-
plying with the one-year time period stipulated by
IAS
36.
When conducting the impairment tests the following
parameters were used:
Measurement basis
Value in use
Impairment test level
Biopharma (including Allergopharma and Biosimilars)
Consumer Health
Life Science
Performance Materials
Planning basis
Most recent financial medium-term planning approved by the Executive Board
and used for internal purposes
Detailed planning period
4 years (2014: 5 years)
Key assumptions
Net cash flows
Long-term growth rate after the detailed planning period
Discount rate after tax (Weighted average cost of capital after tax –
WACC
)
Determination of the value of the key assumptions
Net cash flows
●
Sales growth
Based on internal planning, taking into consideration internal and external market
information and market estimations, i.e. regarding market shares, excluding
approvals of new compounds from the development pipeline and other expansion
investments
●
Profit margins
Based on past experiences, adjusted for expected changes
Long-term growth rate after the detailed planning period
Based on long-term inflation expectations and expected long-term sector growth
Discount rate after tax (Weighted average cost of capital after tax –
WACC
)
●
Cost of equity
Risk-free interest rate: Derived from the returns of long-term German government
bonds
Beta factor:
Derived from respective peer group
Market risk premium: Range as recommended by the Technical Committee for
Business Valuation and Commerce of the Institute of Public
Auditors in Germany (Institut der Wirtschaftsprüfer e.V. –
IDW
)
●
Cost of debt and capital structure
Derived from respective peer group
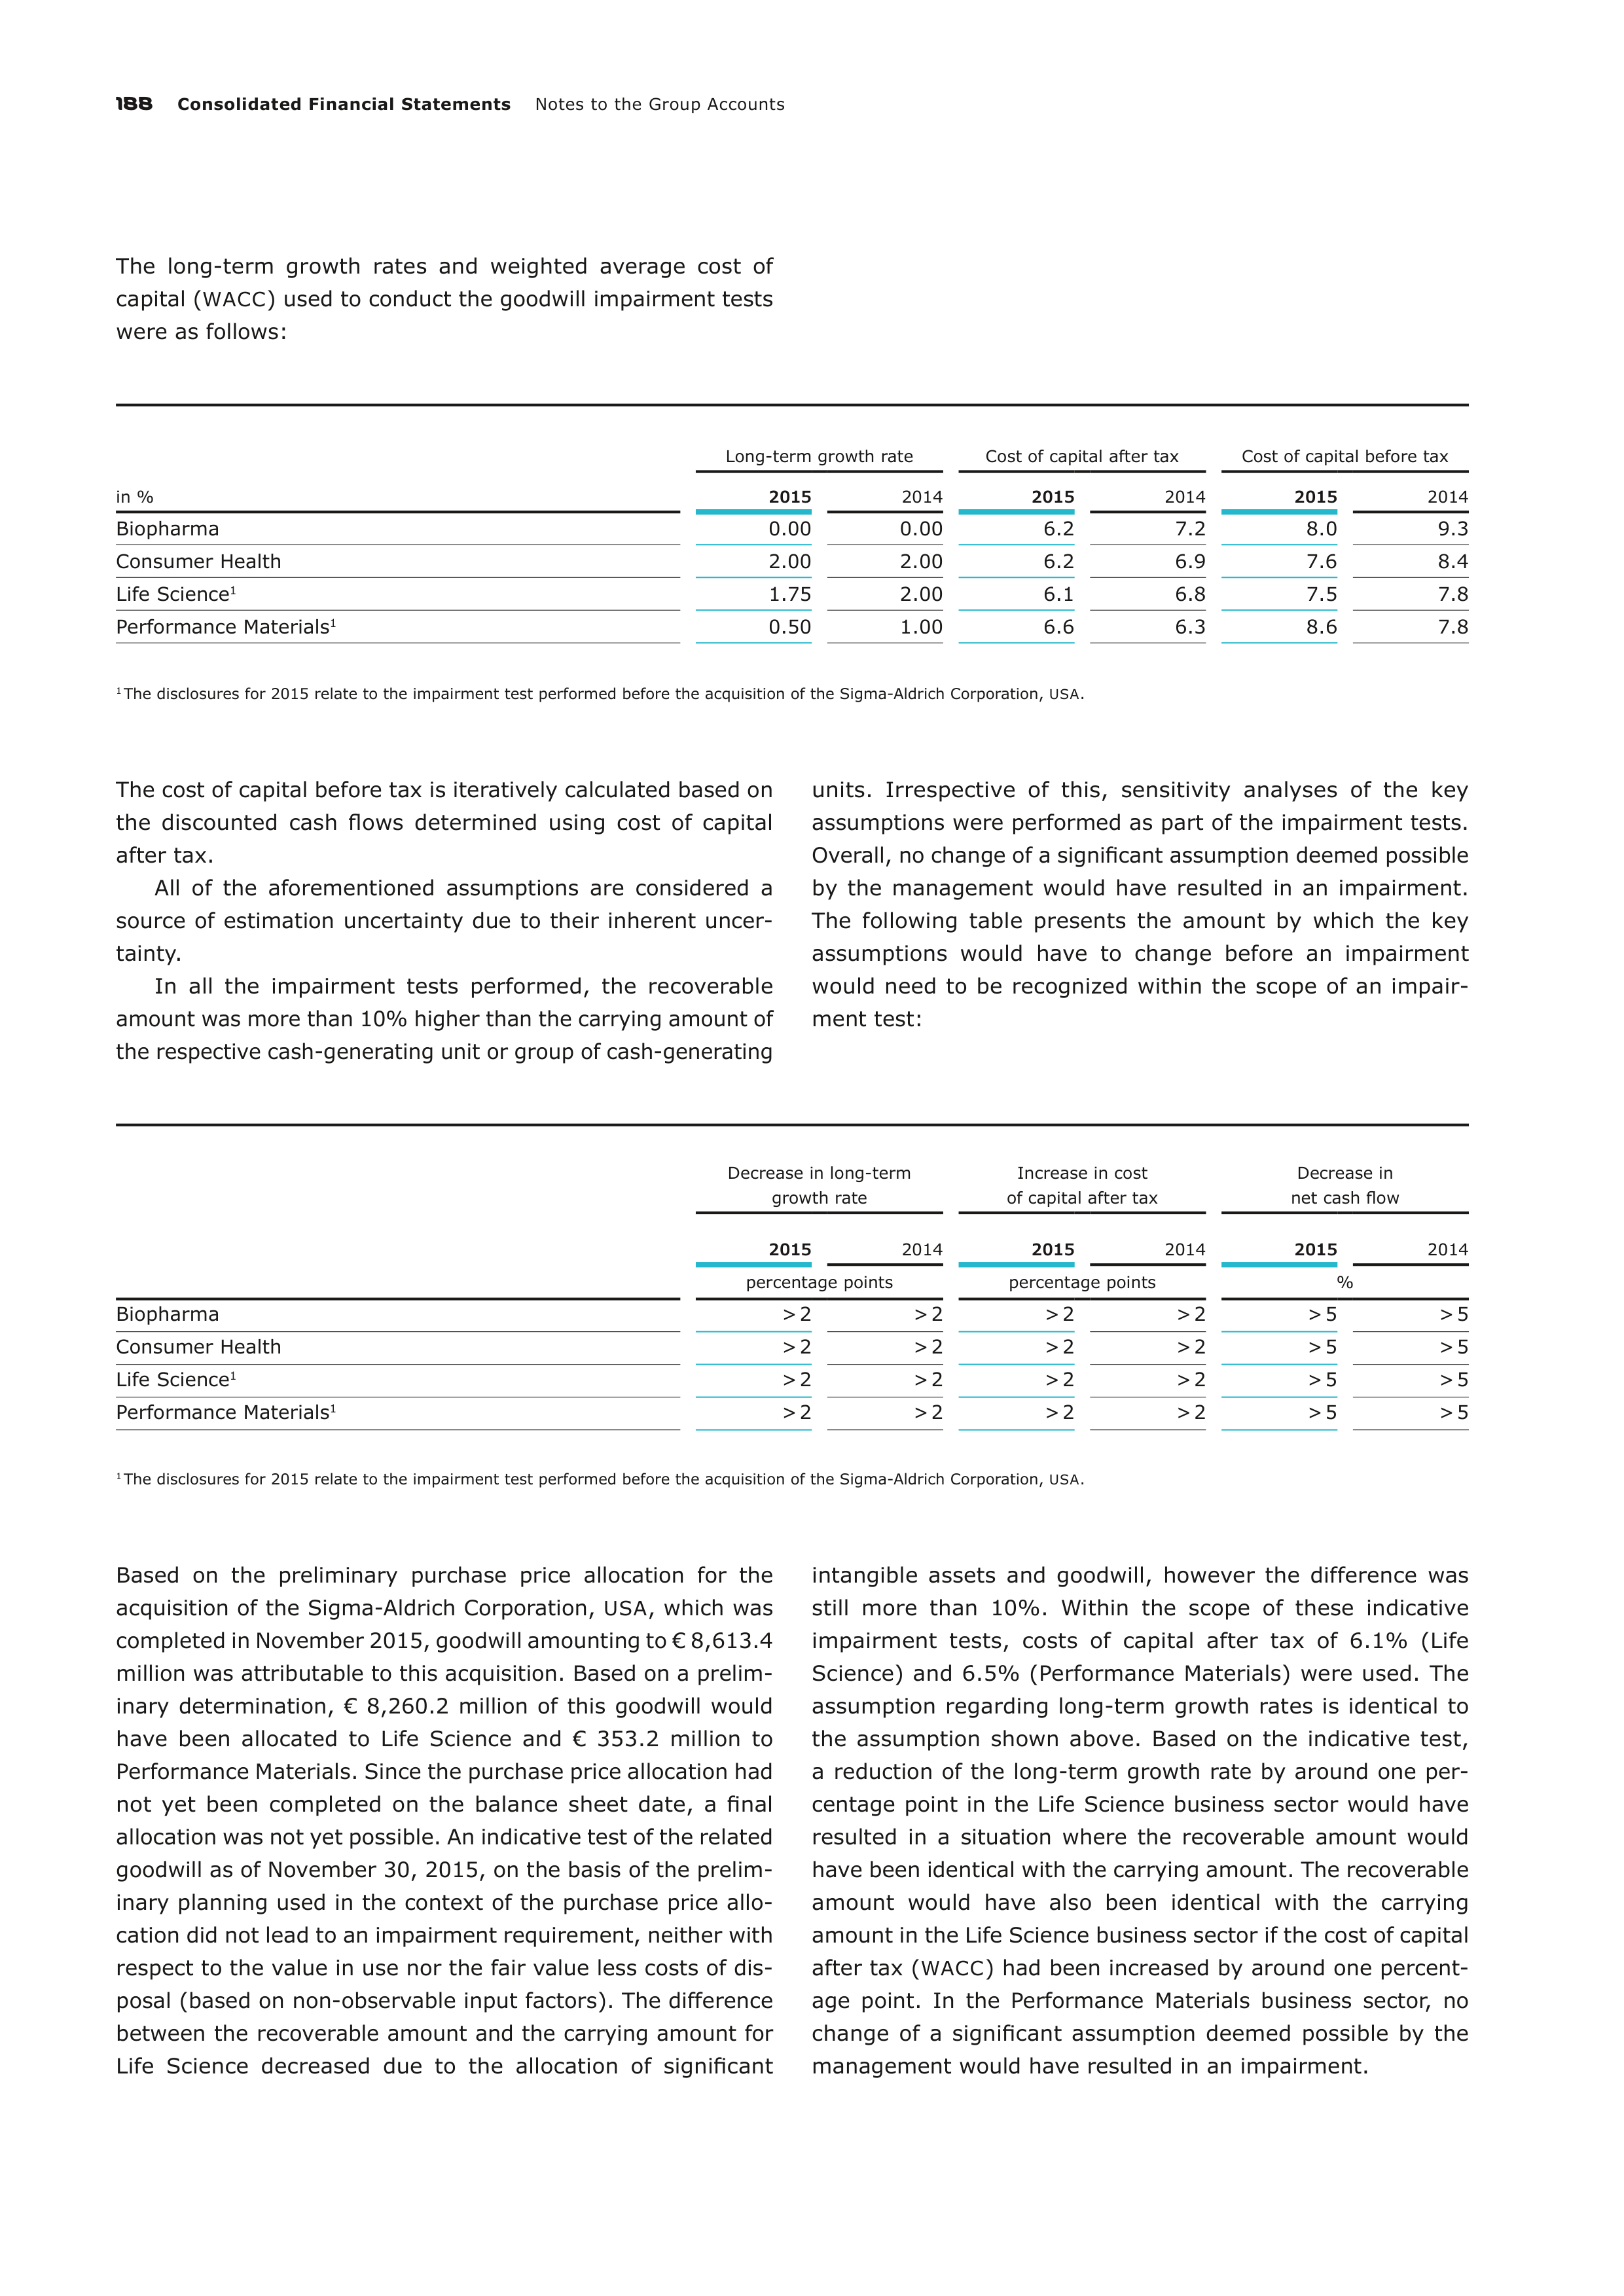
188
Consolidated Financial Statements
Notes to the Group Accounts
The long-term growth rates and weighted average cost of
cap
ital (
WACC
) used to conduct the goodwill impairment tests
were as follows:
in %
Long-term growth rate
Cost of capital after tax
Cost of capital before tax
2015
2014
2015
2014
2015
2014
Biopharma
0.00
0.00
6.2
7.2
8.0
9.3
Consumer Health
2.00
2.00
6.2
6.9
7.6
8.4
Life Science
1
1.75
2.00
6.1
6.8
7.5
7.8
Performance Materials
1
0.50
1.00
6.6
6.3
8.6
7.8
1
The disclosures for 2015 relate to the impairment test performed before the acquisition of the Sigma-Aldrich Corporation,
USA
.
The cost of capital before tax is iteratively calculated based on
the discounted cash flows determined using cost of capital
after tax.
All of the aforementioned assumptions are considered a
source of estimation uncertainty due to their inherent uncer-
tainty.
In all the impairment tests performed, the recoverable
amount was more than 10% higher than the carrying amount of
the respective cash-generating unit or group of cash-generating
units. Irrespective of this, sensitivity analyses of the key
assumptions were performed as part of the impairment tests.
Overall, no change of a significant assumption deemed possible
by the management would have resulted in an impairment.
The following table presents the amount by which the key
assumptions would have to change before an impairment
would need to be recognized within the scope of an impair-
ment test:
Decrease in long-term
growth rate
Increase in cost
of capital after tax
Decrease in
net cash flow
2015
2014
2015
2014
2015
2014
percentage points
percentage points
%
Biopharma
> 2
> 2
> 2
> 2
> 5
> 5
Consumer Health
> 2
> 2
> 2
> 2
> 5
> 5
Life Science
1
> 2
> 2
> 2
> 2
> 5
> 5
Performance Materials
1
> 2
> 2
> 2
> 2
> 5
> 5
1
The disclosures for 2015 relate to the impairment test performed before the acquisition of the Sigma-Aldrich Corporation,
USA
.
Based on the preliminary purchase price allocation for the
acquisition of the Sigma-Aldrich Corporation,
USA
, which was
completed in November 2015, goodwill amounting to € 8,613.4
million was attributable to this acquisition. Based on a prelim-
inary determination, € 8,260.2 million of this goodwill would
have been allocated to Life Science and € 353.2 million to
Performance Materials. Since the purchase price allocation had
not yet been completed on the balance sheet date, a final
allocation was not yet possible. An indicative test of the related
goodwill as of November 30, 2015, on the basis of the prelim-
inary planning used in the context of the purchase price allo-
cation did not lead to an impairment requirement, neither with
respect to the value in use nor the fair value less costs of dis-
posal (based on non-observable input factors). The difference
between the recover
able amount and the carrying amount for
Life Science decreased due to the allocation of significant
intangible assets and goodwill, however the difference was
still more than 10%. Within the scope of these indicative
impairment tests, costs of capital after tax of 6.1% (Life
Science) and 6.5% (Performance Materials) were used. The
assumption regarding long-term growth rates is identical to
the assumption shown above. Based on the indicative test,
a
reduction of the long-term growth rate by around one per-
centage point in the Life Science business sector would have
resulted in a situation where the recoverable amount would
have been identical with the carrying amount. The recoverable
amount would have also been identical with the carrying
amount in the Life Science business sector if the cost of capital
after tax (
WACC
) had been increased by around one percent-
age point. In the Performance Materials business sector, no
change of a significant assumption deemed possible by the
management would have resulted in an impairment.
Notes to the Group Accounts
Consolidated Financial Statements
189
Determination of the amortization of intangible assets
with finite useful lives
In addition to goodwill and other intangible assets with indefi-
nite useful lives, Merck has a significant amount of intangi-
ble assets with finite useful lives (carrying amount as of
December 31, 2015: € 10,674.9 million / December 31, 2014:
€ 5,496.1 million). Substantial assumptions and estimates are
required to determine the appropriate level of amortization of
these intangible assets. This relates in particular to the deter-
mination of the underlying remaining useful life. The para
meter is reviewed regularly by Merck and adjusted if neces-
sary. Merck considers factors including the typical product life
cycles for each asset and publicly available information about
the estimated useful lives of similar assets.
If the amortization of intangible assets from customer
relationships, market authorizations, patents, licenses and
similar rights, capitalized brand names and trademarks had
been 10% higher, for example due to shortened remaining
useful lives, earnings before taxes would have been € 94.8
million lower in fiscal 2015 (2014: reduction of € 84.2 million).
In fiscal 2015, a reduction of the useful lives of the intangible
asset reported in connection with the drug Rebif
®
by one year
would have lowered earnings before taxes by € 92.0 million
(2014: € 73.6 million).
Research and development collaborations as well as
in- and out-licensing of intangible assets
Merck is regularly a partner of research and development col-
laborations with research institutions, biotechnology compa-
nies and other contract parties. These collaborations are
aimed
at developing marketable products. Merck also enters into in-
licensing agreements regarding intellectual property of contract
partners. Such agreements typically involve making upfront
payments and payments for the achievement of certain mile-
stones related to development and marketing progress. In this
context, Merck has to judge to what extent upfront or mile-
stone payments represent remuneration for services received
(research and development expense) or whether such pay-
ments result in an in-licensing of an intangible asset that has
to be capitalized. This assessment is normally subject to judg-
ment.
Merck regularly receives upfront and milestone payments
as part of research and development collaborations or out-
licensing agreements. In this context, income may only be
recognized if Merck has transferred all material risks and
rewards of an intangible asset to the acquirer, has no interest
in the remaining business activities and has no material con-
tinuing commitment. If these criteria are not deemed to be
met, the received payments are deferred and recognized over
the period in which Merck is expected to fulfill its performance
obligations. Both the assessment of the revenue recognition
criteria and the determination of the appropriate period during
which revenue is recognized are subject to judgment.
If the consideration that was received as part of the strate
gic
alliance with Pfizer Inc.,
USA
, in November 2014 and deferred
as a liability had been recognized in the income statement
over a shorter period reduced by one year, in 2015 this would
have increased other operating income and thus profit before
income tax would have increased by € 47.8 million (2014:
€ 3.9 million). Recognition over a period extended by one year
would have lowered other operating income and profit before
tax by € 31.9 million (2014: € 2.6 million).
Identification of impairment of non-financial assets
Discretionary decisions are required in the identification of
existing indications of impairment of intangible assets and
property, plant and equipment. As of December 31, 2015, the
carrying amounts of these assets totaled € 29,348.1 million
(December 31, 2014: € 14,385.9 million). External and inter-
nal information is used to identify indications of impairment.
For example, the approval of a competing product in the
Healthcare business sector or the closure of a site can be
an indicator of impairment. Nevertheless, Merck’s analysis
of indications of impairment can prove too optimistic or too
pessimistic in hindsight due to the high degree of uncertainty.
In October 2015, Merck relaunched its branding and fun
da-
mentally revamped its visual appearance. Outside the United
States and Canada, the Group will operate uniformly as
‟Merck” in the future and has eliminated the previously inde-
pendent divisional brands ‟Merck Serono” and ‟Merck Millipore”.
Owing to this, the ‟Millipore” brand, which is recognized as an
intangible asset in the balance sheet, was subjected to an
impairment test. As a result of this impairment test, a need to
record an impairment loss was not identified since the value
added from the continued use of the brand for Merck filtration
products and as part of the name the Life Science business
operates under in the U.S. and Canadian markets exceeded
the residual book value of the brand. The intangible assets for
the ‟Serono” brand recognized within the scope of the purchase
price allocation for Serono SA had already been fully amortized
when the new branding was launched.
Impairment of financial assets
On every balance sheet date, Merck reviews whether there is
any objective evidence that a financial asset is impaired and,
if this is the case, carries out the impairment to the extent
estimated as necessary. Particularly important in this context
are impairment losses on trade accounts receivable whose
carrying amount was € 2,738.3 million as of December 31,
2015 (2014: € 2,219.5 million).
Significant indicators for the identification of impaired
receivables and the subsequent impairment tests are, in par-
ticular, payment default or delay in the payment of interest or
principal, negative changes in economic or regional economic
framework conditions as well as considerable financial difficul-
ties of a debtor. These estimates are discretionary.
190
Consolidated Financial Statements
Notes to the Group Accounts
Other provisions and contingent liabilities
As a global company for high-tech products, Merck is exposed
to a multitude of litigation risks. In particular, these include
risks from product liability, competition and antitrust law,
pharmaceutical law, patent law, tax law and environmental
protection. Merck is engaged in legal proceedings and official
investigations, the outcomes of which are uncertain. A detailed
description of the most important legal matters as of the bal-
ance sheet date can be found in Notes [27] ‟Provisions” and
[
39] ‟Contingent liabilities”. The provisions recognized for
legal disputes mainly relate to the Healthcare business sector
and amounted to € 490.6 million as of the balance sheet date
(2014: € 393.1 million).
To assess the existence of a reporting obligation in relation
to provisions and to quantify pending outflows of resources,
Merck draws on the knowledge of the legal department as well
as any other outside counsel. In spite of this, both the assess-
ment of the existence of a present obligation and the estimate
of the probability of a future outflow of resources are highly
subject to uncertainty. Equally, the evaluation of a possible
payment obligation is to be considered a major source of esti-
mation uncertainty. Accordingly, the date of utilization may be
determined reliably not earlier than after an out-of-court set
tle-
ment is reached or upon the termination of judicial proceed-
ings.
To a certain extent, Merck is obliged to take measures to
protect the environment and reported provisions for environ-
mental protection of € 126.9 million as of December 31, 2015
(2014: €
123.7 million). The underlying obligations were
located mainly in Germany, Latin America and the United
States. Provisions were recognized primarily for obligations
from soil remediation and groundwater protection in connec-
tion with the discontinued crop protection business.
The calculation of the present value of the future settle-
ment amount requires, among other things, estimates of the
future settlement date, the actual severity of the identified
contamination, the applicable remediation methods, the asso-
ciated future costs, and the discount rate. The measurement
is carried out regularly in consultation with independent
experts. In spite of this, the determination of the future settle-
ment amount of the provisions for environmental protection
measures is subject to a considerable degree of uncertainty.
In the event of the discontinuation of clinical development
projects, Merck is regularly required to bear unavoidable sub-
sequent costs for a certain future period of time. The meas-
urement of these provisions requires estimates regarding the
length of time and the amount of the subsequent costs.
Apart from provisions, contingent liabilities are also sub-
ject to estimation uncertainties and discretionary judgment.
Accordingly, contingent liabilities from legal and tax disputes
are subject to the same estimation uncertainties and discre-
tionary judgment as provisions for litigation. Therefore, the
existence and the amount of the outflow of resources, which is
not unlikely, is subject to estimation uncertainties similarly to
the date on which a potential obligation arises.
Provisions for pensions and other post-employment
benefits
Merck maintains several defined benefit pension plans, par-
ticularly in Germany, Switzerland and the United Kingdom.
The determination of the present value of the obligation from
these defined benefit pension plans primarily requires esti-
mates of the discount rate, future salary increases, future
pension increases and future cost increases for medical care.
Detailed information on the existing pension obligations
and a sensitivity analysis of the parameters named above are
provided in Note [26] ‟Provisions for pensions and other
post-employment benefits” and under ‟Accounting and meas-
urement principles” in Note [64] ‟Provisions for pensions and
other post-employment benefits”. As of the balance sheet
date, the amount recorded in the consolidated balance sheet
for provisions for pensions and other post-employment bene-
fits was € 1,836.1 million (2014: € 1,820.1 million). The
present value of the defined benefit pension obligation was
€ 4,152.7 million as of December 31, 2015 (2014: € 3,812.7
million).
Income taxes
The calculation of the reported assets and liabilities from
current and deferred income taxes requires extensive discre-
tionary judgments, assumptions and estimates. Income tax
liabilities were € 1,011.3 million as of December 31, 2015
(2014: € 849.8 million). The carrying amounts of deferred tax
assets and liabilities amounted to € 1,049.6 million and
€ 2,852.7 million, respectively, as of the balance sheet date
(2014: € 992.9 million and € 818.4 million, respectively).
The recognized income tax liabilities and provisions are
partially based on estimates and interpretations of tax laws
and ordinances in different jurisdictions.
With regard to deferred tax items, there are degrees of
uncertainty concerning the date on which an asset is realized
or a liability settled and concerning the tax rate applicable on
this date. This particularly relates to deferred tax liabilities
recognized in the context of the acquisitions of the Sigma-
Aldrich Corporation, the Millipore Corporation, Serono SA,
and AZ Electronic Materials S.A. The recognition of deferred
tax assets from loss carryforwards requires an estimate of
the
probability of the future realizability of loss carryforwards.
Factors considered in this estimate are results history, results
planning and any tax planning strategy of the respective Group
company.
Assets held for sale, disposal groups and discontinued
operations
The assessment as to when a non-current asset, disposal group
or discontinued operation meets the prerequisites for a classi-
fication as ‟held for sale” is subject to significant discretionary
judgment. Even in the case of an existing management decision
to review a disposal, an assessment subject to uncertainties
has to be made as to the probability that a corresponding dis-
posal will occur during the year or not.
Notes to the Group Accounts
Consolidated Financial Statements
191
Applicable foreign exchange mechanism in Venezuela
Through subsidiaries, the Merck Group imports and distributes
products in Venezuela. The translation of the local financial
statements from Venezuelan bolivars as the functional currency
to euros as the reporting currency must proceed in analogous
application of
IAS
21.26 using the exchange rate at which the
future cash flows represented by the transaction or balance
could have been settled if those cash flows had occurred at the
measurement date.
The Venezuelan bolivar is not a freely convertible currency,
meaning that its exchange into other currencies requires
authorization and must take place at official exchange rates
set by the government. As of December 31, 2015, the three
following exchange rate mechanisms were in place:
•
‟
CENCOEX
” (6.3 bolivars per U.S. dollar): Official privileged
exchange rate mechanism allowed only for imports of high-
priority essential goods such as food and medicines;
•
‟
SICAD
” (13.5 bolivars per U.S. dollar): Official exchange rate
mechanism whereby exchange rates are set based on the
conducted auctions.
•
‟
SIMADI
” (Marginal Currency System) (198.7 bolivars per
U.S. dollar): Official exchange rate mechanism that permits
individuals and entities to buy and sell foreign currency with
fewer restrictions than other exchange rate mechanisms in
Venezuela.
In the past, Merck applied the privileged exchange rate mech-
anism
CENCOEX
for the translation of local financial state-
ments prepared in Venezuelan bolivars, the functional currency,
into euros, the reporting currency. In 2015, the Venezuelan
authorities have been increasingly limiting authorizations to
pay for imports using the privileged exchange rate. Against
this background and owing to the development of payments
received as well as the growing uncertainty since the last bal-
ance sheet date regarding the extent to which the privileged
CENCOEX
exchange rate mechanism will be available in the
future, the Executive Board of Merck came to the conclusion
that for the translation as of July 1, 2015 of local financial
statements reported in Venezuelan bolivars, the functional cur-
rency,
into euros as the reporting currency, it will be necessary
to apply the
SIMADI
exchange rate mechanism.
This estimate is discretionary. Merck continues to closely
monitor the development of payments received and the
exchange rate mechanism. Should the payment rates improve
or if it can no longer be assumed that the
SIMADI
exchange
rate is the relevant exchange rate for the translation from local
currency into the reporting currency, euros, this could lead to
an amended estimate, which in turn could trigger an amended
currency translation.
On this basis, in fiscal 2015 Merck generated sales of
€ 175.1 million, € 168.3 million of which was attributable to
the first half of 2015. Net sales using the
CENCOEX
exchange
rate amounted to € 221.1 million in 2014. Cash and cash equiv-
alents in Venezuela, translated using the
SIMADI
exchange rate
as of December 31, 2015, amounted to € 8.2 million. They were
classified as restricted.
Other judgments, assumptions and sources of estimation
uncertainty
Merck makes other judgments, assumptions and estimates in
the following areas:
•
Classification of financial assets and financial liabilities
•
Cash flow hedging for highly probable forecast transactions
•
Determination of the fair value of financial instruments clas-
sified as available-for-sale and of derivative financial instru-
ments
•
Determination of the fair value of the liability for share-
based compensation
•
Determination of the fair value of plan assets
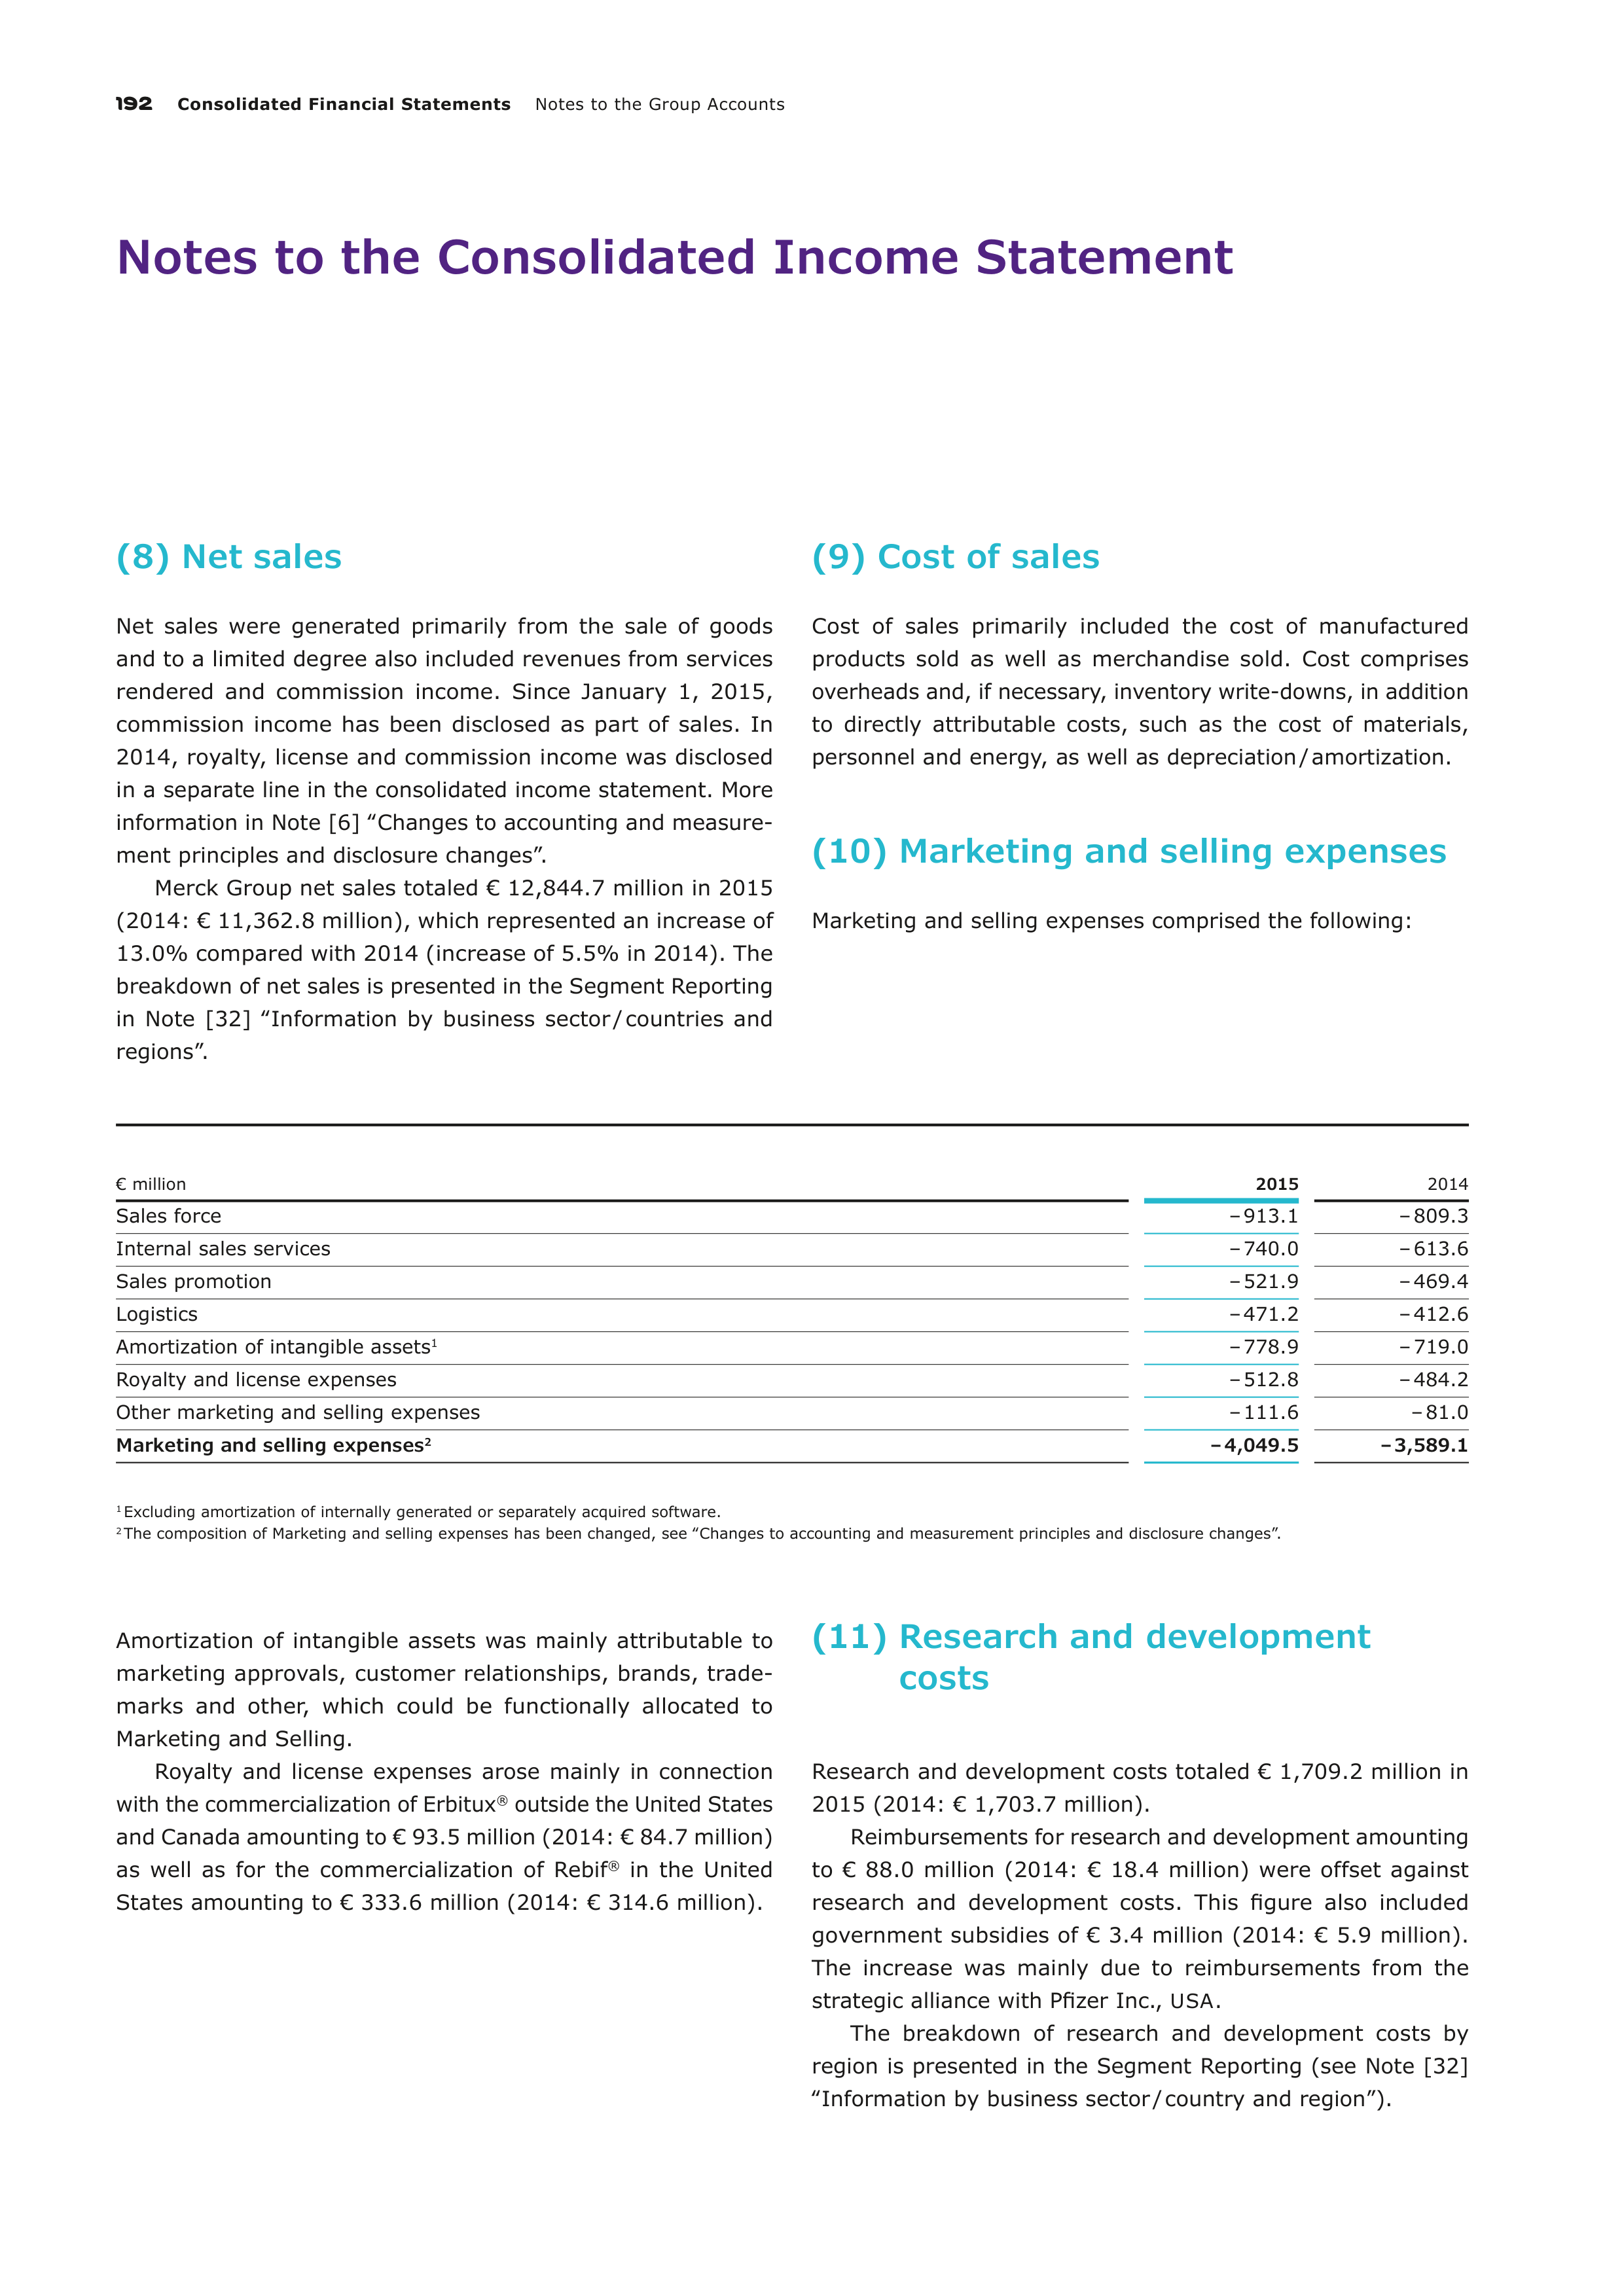
192
Consolidated Financial Statements
Notes to the Group Accounts
Notes to the Consolidated Income Statement
(8) Net sales
Net sales were generated primarily from the sale of goods
and to a limited degree also included revenues from services
rendered and commission income. Since January 1, 2015,
commission income has been disclosed as part of sales. In
2014, royalty, license and commission income was disclosed
in
a separate line in the consolidated income statement. More
information in Note [6] ‟Changes to accounting and measure-
ment principles and disclosure changes”.
Merck Group net sales totaled € 12,844.7 million in 2015
(2014: € 11,362.8 million), which represented an increase of
13.0% compared with 2014 (increase of 5.5% in 2014). The
breakdown of net sales is presented in the Segment Reporting
in Note [32] ‟Information by business sector / countries and
regions”.
(9) Cost of sales
Cost of sales primarily included the cost of manufactured
products sold as well as merchandise sold. Cost comprises
overheads and, if necessary, inventory write-downs, in addition
to directly attributable costs, such as the cost of materials,
personnel and energy, as well as depreciation / amortization.
(10) Marketing and selling expenses
Marketing and selling expenses comprised the following:
€ million
2015
2014
Sales force
– 913.1
– 809.3
Internal sales services
– 740.0
– 613.6
Sales promotion
– 521.9
– 469.4
Logistics
– 471.2
– 412.6
Amortization of intangible assets
1
– 778.9
– 719.0
Royalty and license expenses
– 512.8
– 484.2
Other marketing and selling expenses
– 111.6
– 81.0
Marketing and selling expenses
2
– 4,049.5
– 3,589.1
1
Excluding amortization of internally generated or separately acquired software.
2
The composition of Marketing and selling expenses has been changed, see ‟Changes to accounting and measurement principles and disclosure changes”.
Amortization of intangible assets was mainly attributable to
marketing approvals, customer relationships, brands, trade-
marks and other, which could be functionally allocated to
Marketing and Selling.
Royalty and license expenses arose mainly in connection
with the commercialization of Erbitux
®
outside the United States
and Canada amounting to € 93.5 million (2014: € 84.7 million)
as well as for the commercialization of Rebif
®
in the United
States amounting to € 333.6 million (2014: € 314.6 million).
(11) Research and development
costs
Research and development costs totaled € 1,709.2 million in
2015 (2014: € 1,703.7 million).
Reimbursements for research and development amounting
to € 88.0 million (2014: € 18.4 million) were offset against
research and development costs. This figure also included
government subsidies of € 3.4 million (2014: € 5.9 million).
The increase was mainly due to reimbursements from the
strategic alliance with Pfizer Inc.,
USA
.
The breakdown of research and development costs by
region is presented in the Segment Reporting (see Note [32]
‟Information by business sector / country and region”).
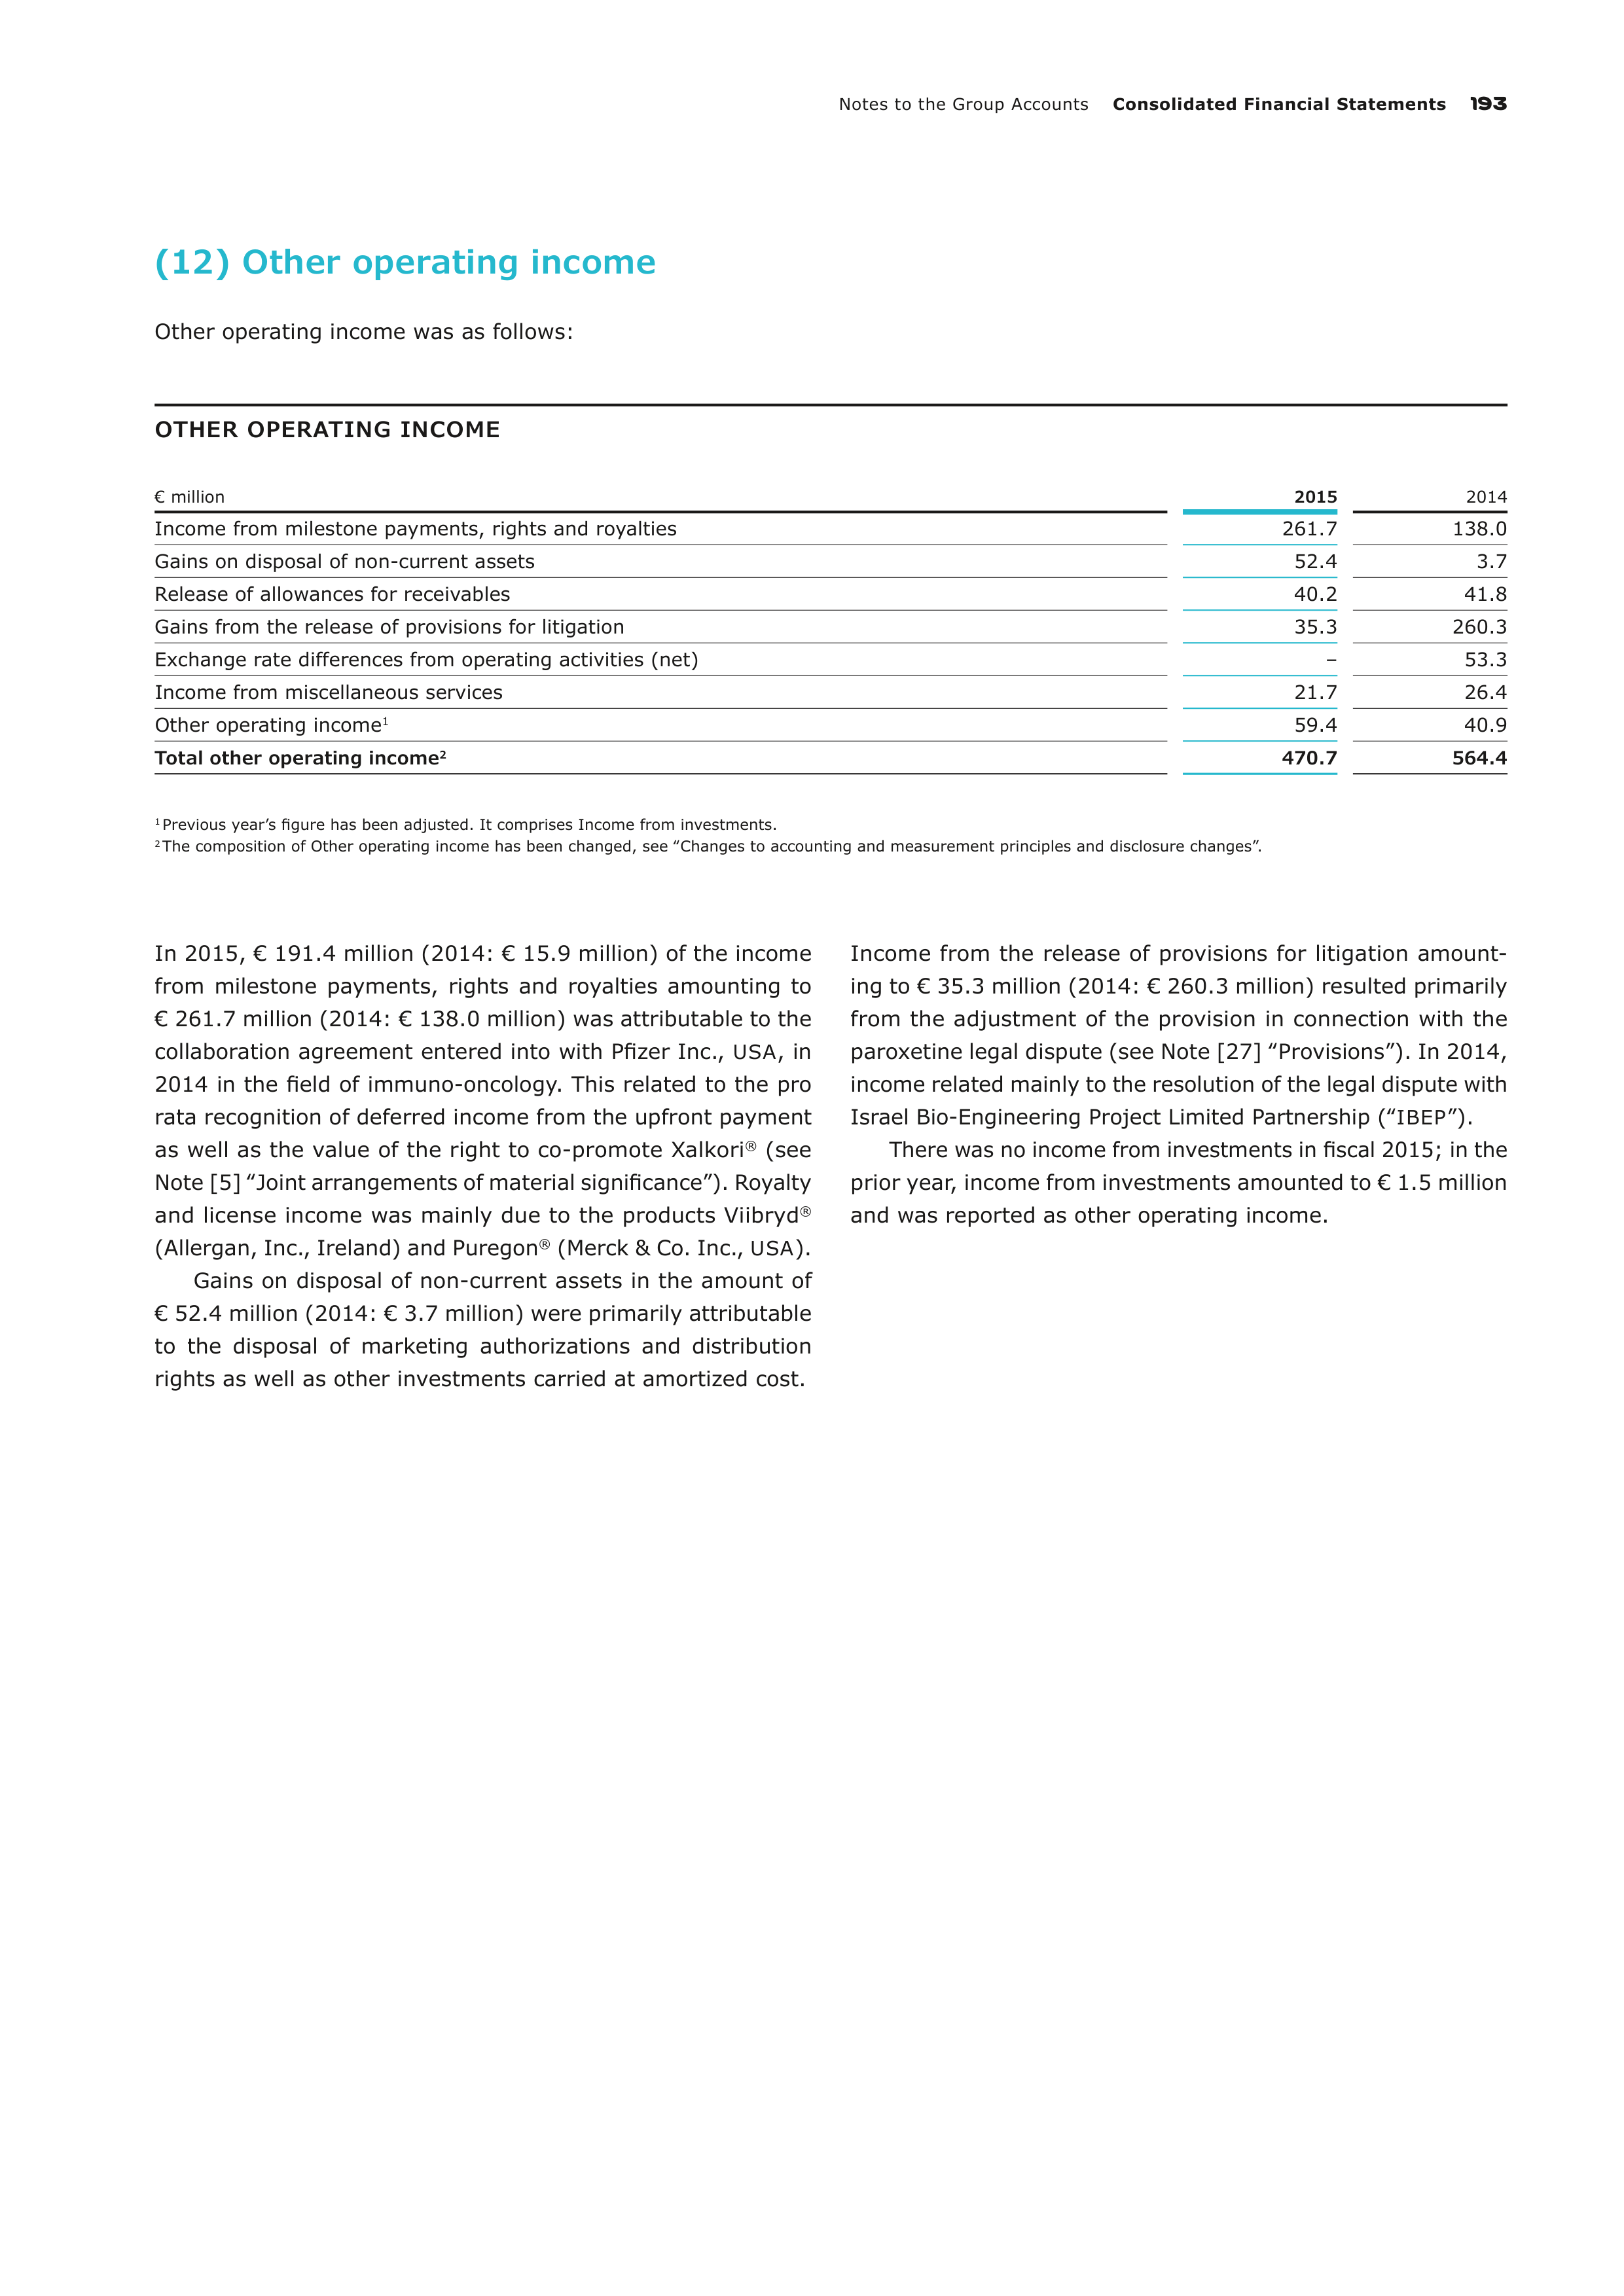
Notes to the Group Accounts
Consolidated Financial Statements
193
(12) Other operating income
Other operating income was as follows:
OTHER OPERATING INCOME
€ million
2015
2014
Income from milestone payments, rights and royalties
261.7
138.0
Gains on disposal of non-current assets
52.4
3.7
Release of allowances for receivables
40.2
41.8
Gains from the release of provisions for litigation
35.3
260.3
Exchange rate differences from operating activities (net)
–
53.3
Income from miscellaneous services
21.7
26.4
Other operating income
1
59.4
40.9
Total other operating income
2
470.7
564.4
1
Previous year’s figure has been adjusted. It comprises Income from investments.
2
The composition of Other operating income has been changed, see ‟Changes to accounting and measurement principles and disclosure changes”.
In 2015, € 191.4 million (2014: € 15.9 million) of the income
from milestone payments, rights and royalties amounting to
€ 261.7 million (2014: € 138.0 million) was attributable to the
collaboration agreement entered into with Pfizer Inc.,
USA
, in
2014 in the field of immuno-oncology. This related to the pro
rata recognition of deferred income from the upfront payment
as well as the value of the right to co-promote Xalkori
®
(see
Note [5] ‟Joint arrangements of material significance”). Royalty
and license income was mainly due to the products Viibryd
®
(Allergan, Inc., Ireland) and Puregon
®
(Merck & Co. Inc.,
USA
).
Gains on disposal of non-current assets in the amount of
€ 52.4 million (2014: € 3.7 million) were primarily attributable
to the disposal of marketing authorizations and distribution
rights as well as other investments carried at amortized cost.
Income from the release of provisions for litigation
amount-
ing to € 35.3 million (2014: € 260.3 million) resulted primarily
from the adjustment of the provision in connection with the
paroxetine legal dispute (see Note [27] ‟Provisions”). In 2014,
income related mainly to the resolution of the legal dispute with
Israel Bio-Engineering Project Limited Partnership
(‟
IBEP
”).
There was no income from investments in fiscal 2015; in the
prior year, income from investments amounted to € 1.5 million
and was reported as other operating income.
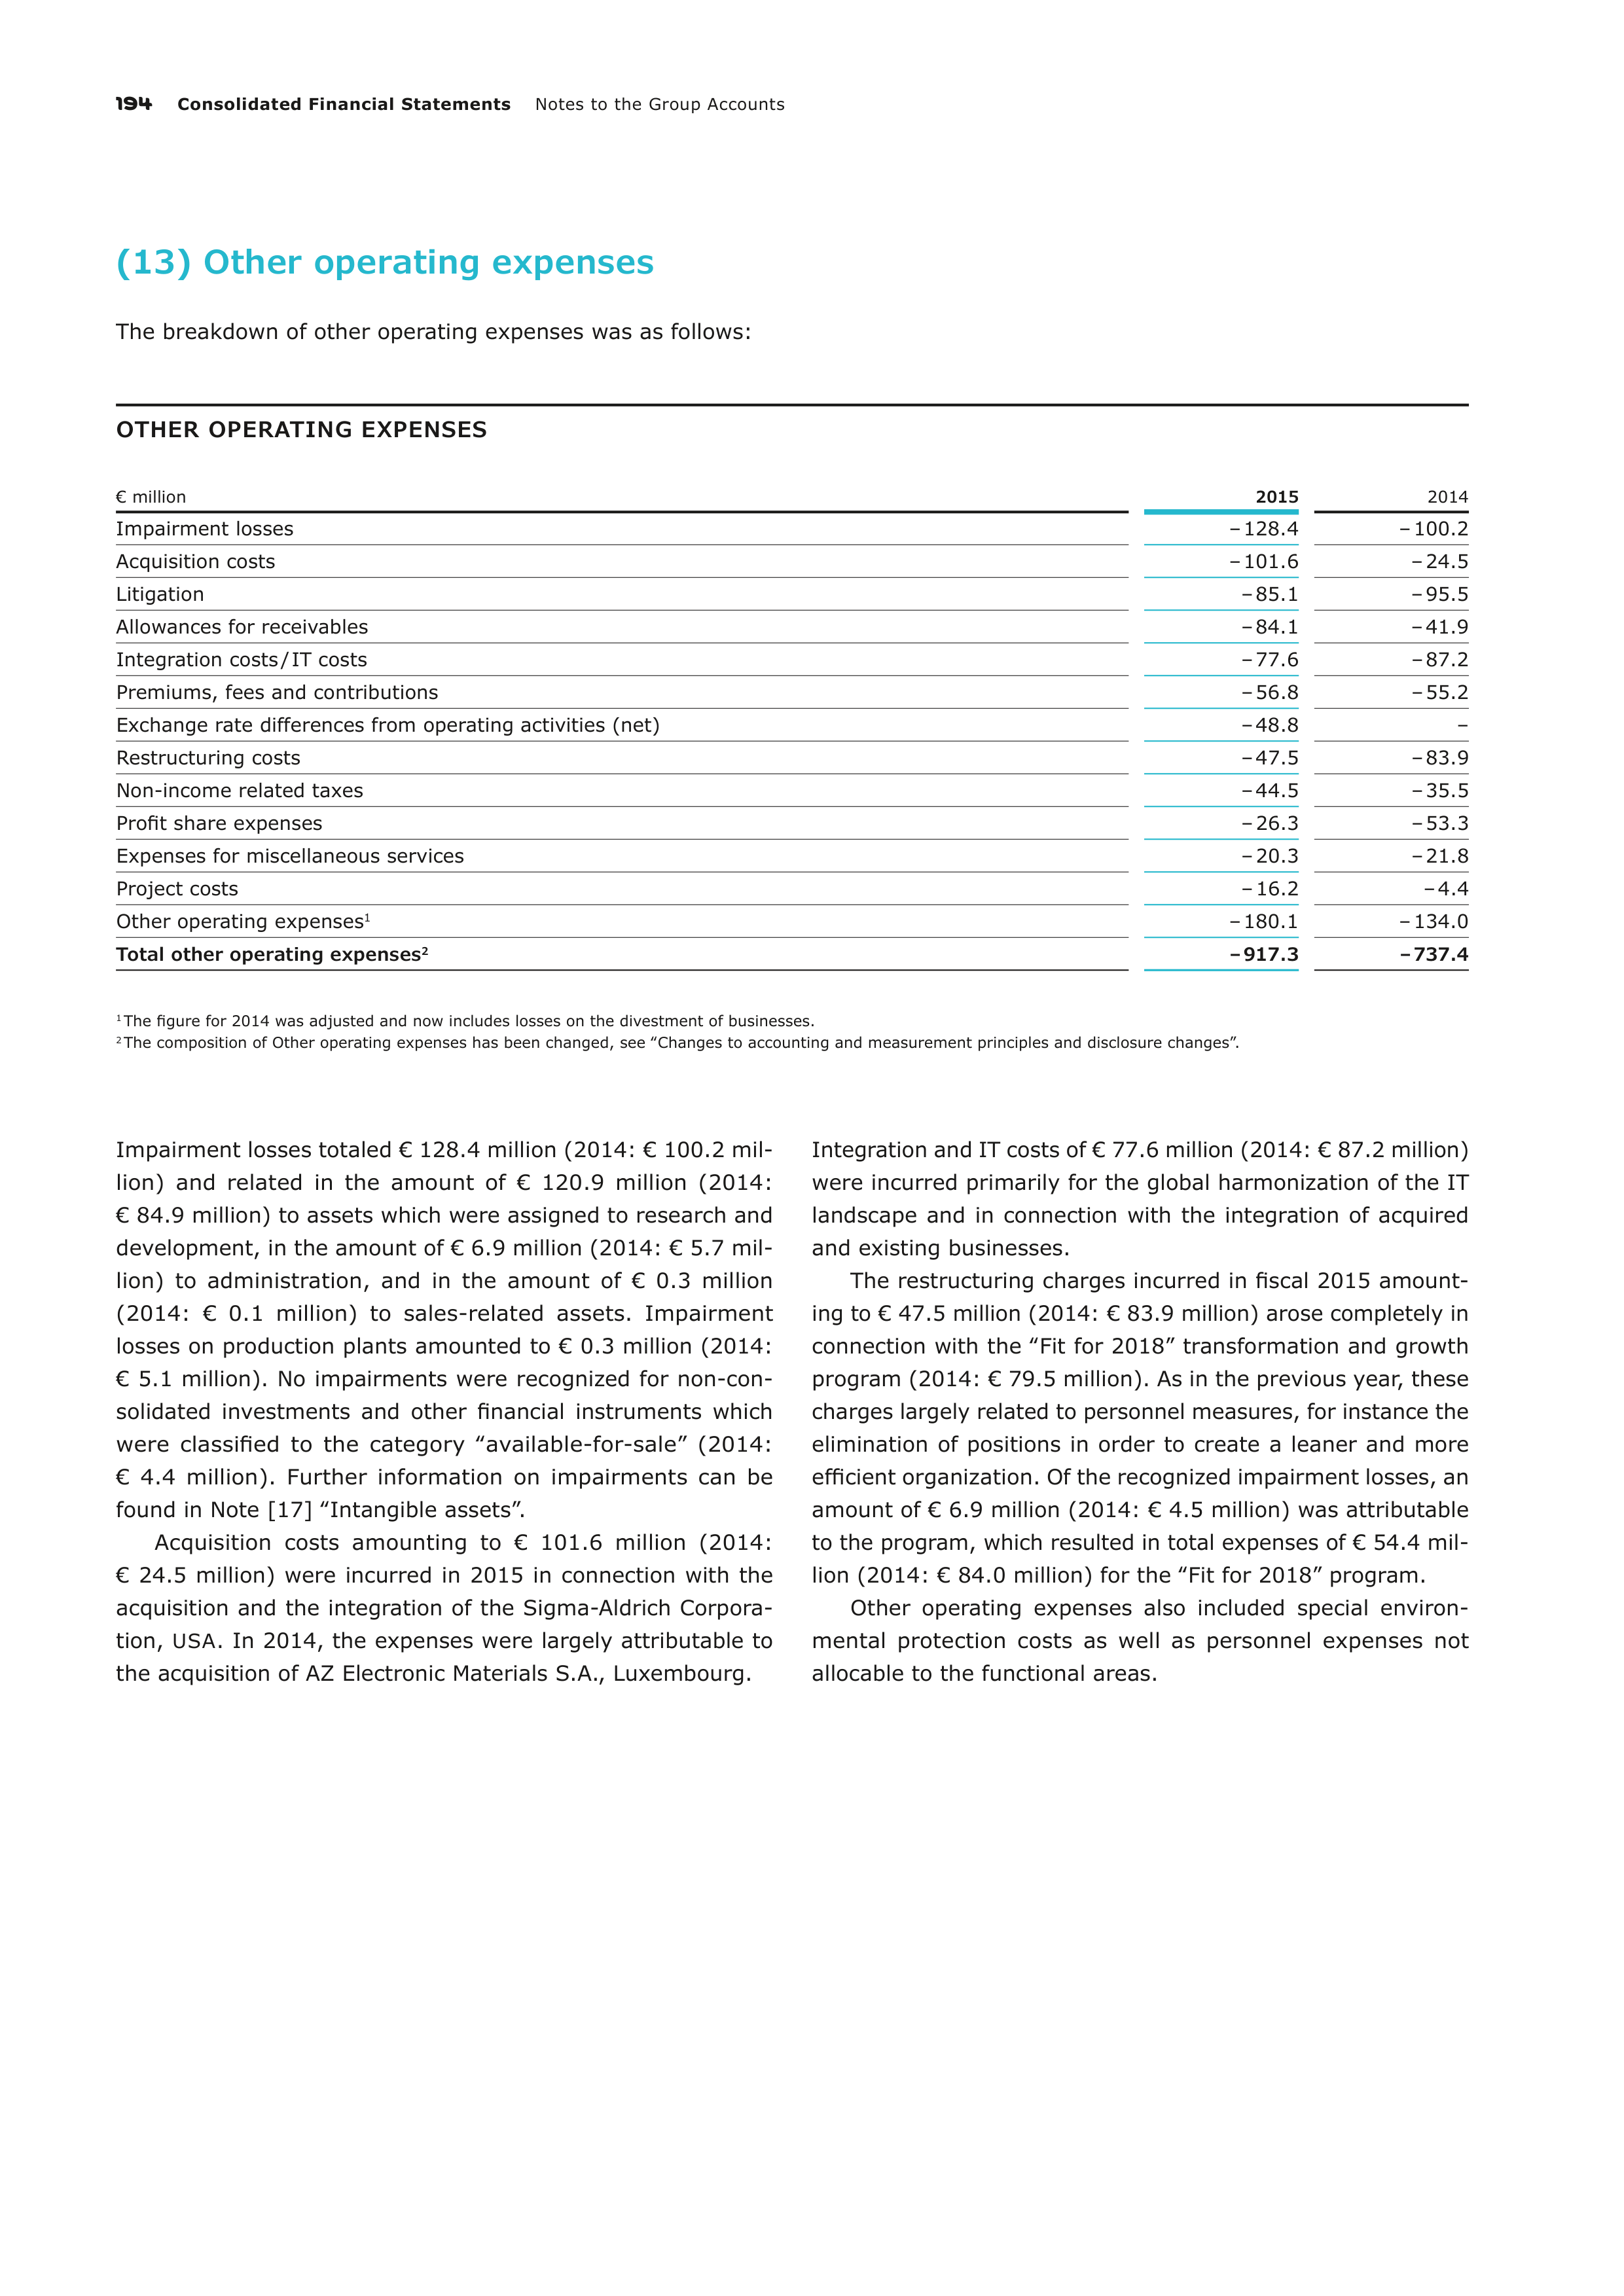
194
Consolidated Financial Statements
Notes to the Group Accounts
(13) Other operating expenses
The breakdown of other operating expenses was as follows:
OTHER OPERATING EXPENSES
€ million
2015
2014
Impairment losses
– 128.4
– 100.2
Acquisition costs
– 101.6
– 24.5
Litigation
– 85.1
– 95.5
Allowances for receivables
– 84.1
– 41.9
Integration costs / IT costs
– 77.6
– 87.2
Premiums, fees and contributions
– 56.8
– 55.2
Exchange rate differences from operating activities (net)
– 48.8
–
Restructuring costs
– 47.5
– 83.9
Non-income related taxes
– 44.5
– 35.5
Profit share expenses
– 26.3
– 53.3
Expenses for miscellaneous services
– 20.3
– 21.8
Project costs
– 16.2
– 4.4
Other operating expenses
1
– 180.1
– 134.0
Total other operating expenses
2
– 917.3
– 737.4
1
The figure for 2014 was adjusted and now includes losses on the divestment of businesses.
2
The composition of Other operating expenses has been changed, see ‟Changes to accounting and measurement principles and disclosure changes”.
Impairment losses totaled € 128.4 million (2014: € 100.2 mil-
lion) and related in the amount of € 120.9 million (2014:
€ 84.9 million) to assets which were assigned to research and
development, in the amount of € 6.9 million (2014: € 5.7 mil-
lion) to administration, and in the amount of € 0.3 million
(2014: € 0.1 million) to sales-related assets. Impairment
losses on production plants amounted to € 0.3 million (2014:
€ 5.1 million). No impairments were recognized for non-con-
solidated investments and other financial instruments which
were classified to the category ‟available-for-sale” (2014:
€ 4.4 million). Further information on impairments can be
found in Note [17] ‟Intangible assets”.
Acquisition costs amounting to € 101.6 million (2014:
€ 24.5 million) were incurred in 2015 in connection with the
acquisition and the integration of the Sigma-Aldrich Corpora-
tion,
USA
. In 2014, the expenses were largely attributable to
the acquisition of AZ Electronic Materials S.A., Luxembourg.
Integration and IT costs of € 77.6 million (2014: € 87.2 million)
were incurred primarily for the global harmonization of the IT
landscape and in connection with the integration of acquired
and existing businesses.
The restructuring charges incurred in fiscal 2015 amount-
ing to € 47.5 million (2014: € 83.9 million) arose completely in
connection with the ‟Fit for 2018” transformation and growth
program (2014: € 79.5 million). As in the previous year, these
charges largely related to personnel measures, for instance the
elimination of positions in order to create a leaner and more
efficient organization. Of the recognized impairment losses, an
amount of € 6.9 million (2014: € 4.5 million) was attributable
to the program, which resulted in total expenses of € 54.4
mil-
lion (2014: € 84.0 million) for the ‟Fit for 2018” program.
Other operating expenses also included special environ-
mental protection costs as well as personnel expenses not
allocable to the functional areas.
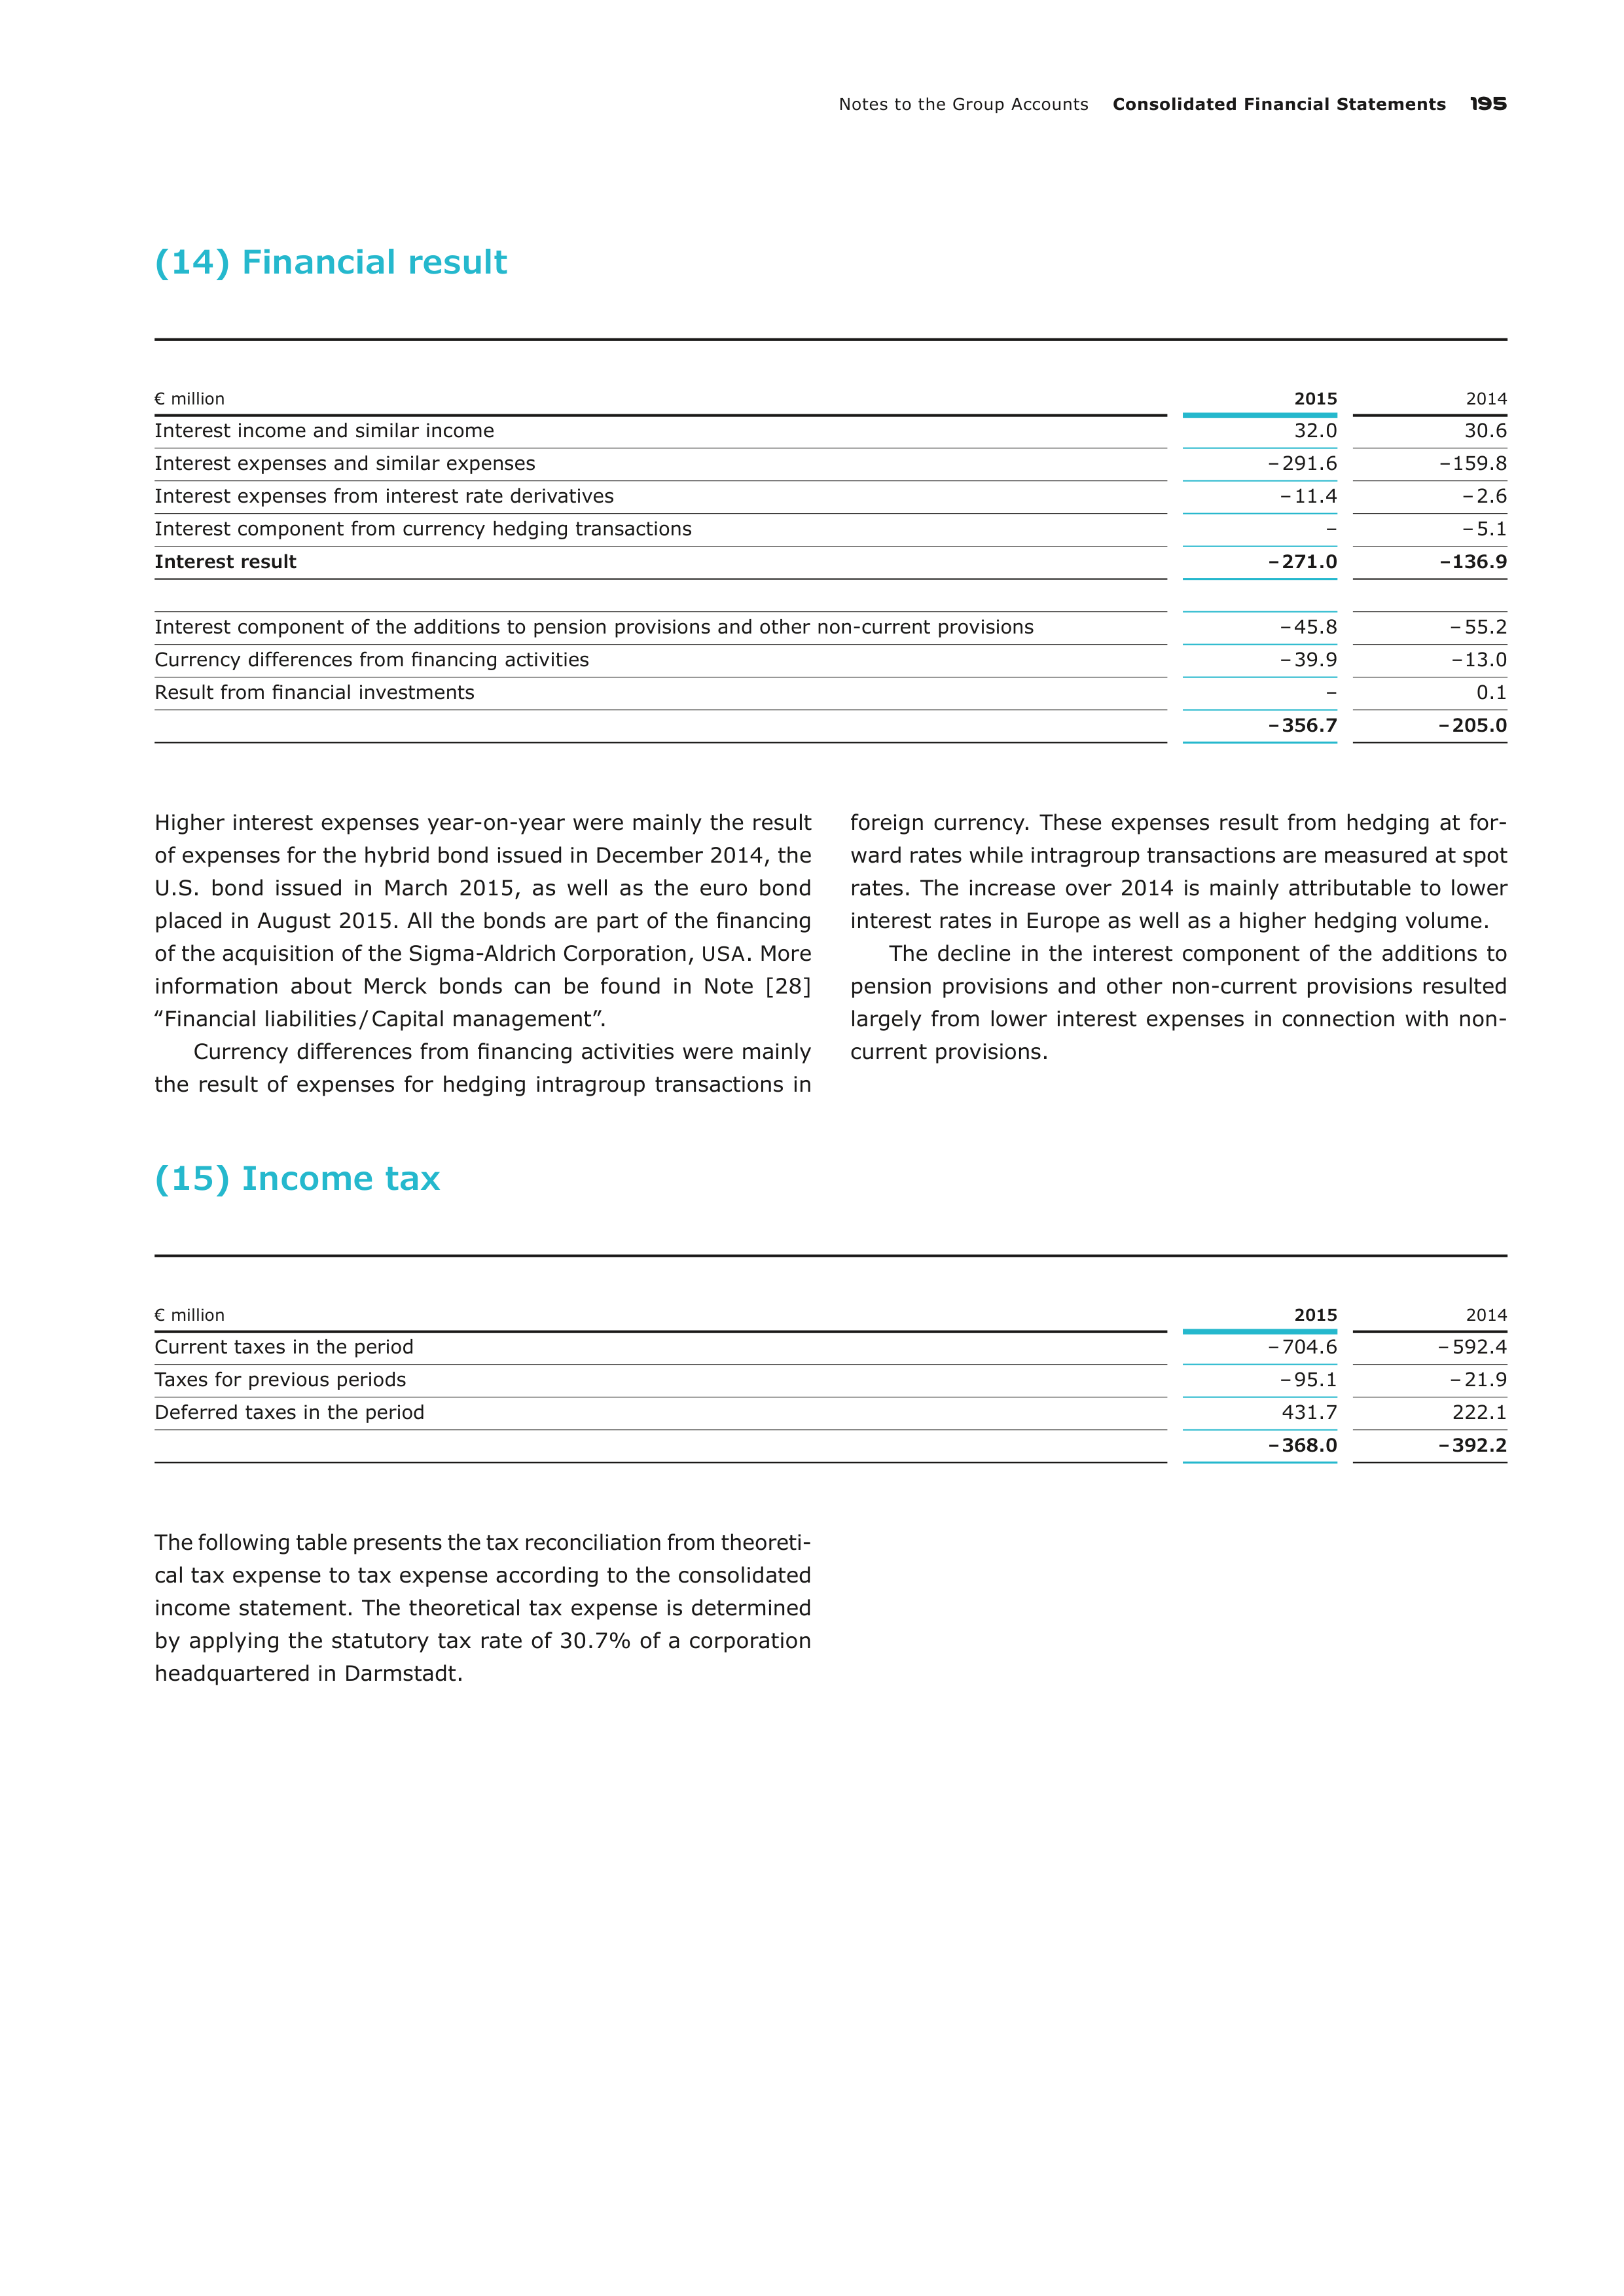
Notes to the Group Accounts
Consolidated Financial Statements
195
(14) Financial result
€ million
2015
2014
Interest income and similar income
32.0
30.6
Interest expenses and similar expenses
– 291.6
– 159.8
Interest expenses from interest rate derivatives
– 11.4
– 2.6
Interest component from currency hedging transactions
–
– 5.1
Interest result
– 271.0
– 136.9
Interest component of the additions to pension provisions and other non-current provisions
– 45.8
– 55.2
Currency differences from financing activities
– 39.9
– 13.0
Result from financial investments
–
0.1
– 356.7
– 205.0
Higher interest expenses year-on-year were mainly the result
of expenses for the hybrid bond issued in December 2014, the
U.S. bond issued in March 2015, as well as the euro bond
placed in August 2015. All the bonds are part of the financing
of the acquisition of the Sigma-Aldrich Corporation,
USA
. More
information about Merck bonds can be found in Note [28]
‟Financial liabilities / Capital management”.
Currency differences from financing activities were mainly
the result of expenses for hedging intragroup transactions in
foreign currency. These expenses result from hedging at for-
ward rates while intragroup transactions are measured at spot
rates. The increase over 2014 is mainly attributable to lower
interest rates in Europe as well as a higher hedging volume.
The decline in the interest component of the additions to
pension provisions and other non-current provisions resulted
largely from lower interest expenses in connection with non-
current provisions.
(15) Income tax
€ million
2015
2014
Current taxes in the period
– 704.6
– 592.4
Taxes for previous periods
– 95.1
– 21.9
Deferred taxes in the period
431.7
222.1
– 368.0
– 392.2
The following table presents the tax reconciliation from theoreti
cal
tax expense to tax expense according to the consoli
dated
income statement. The theoretical tax expense is determined
by applying the statutory tax rate of 30.7% of a corporation
headquartered in Darmstadt.
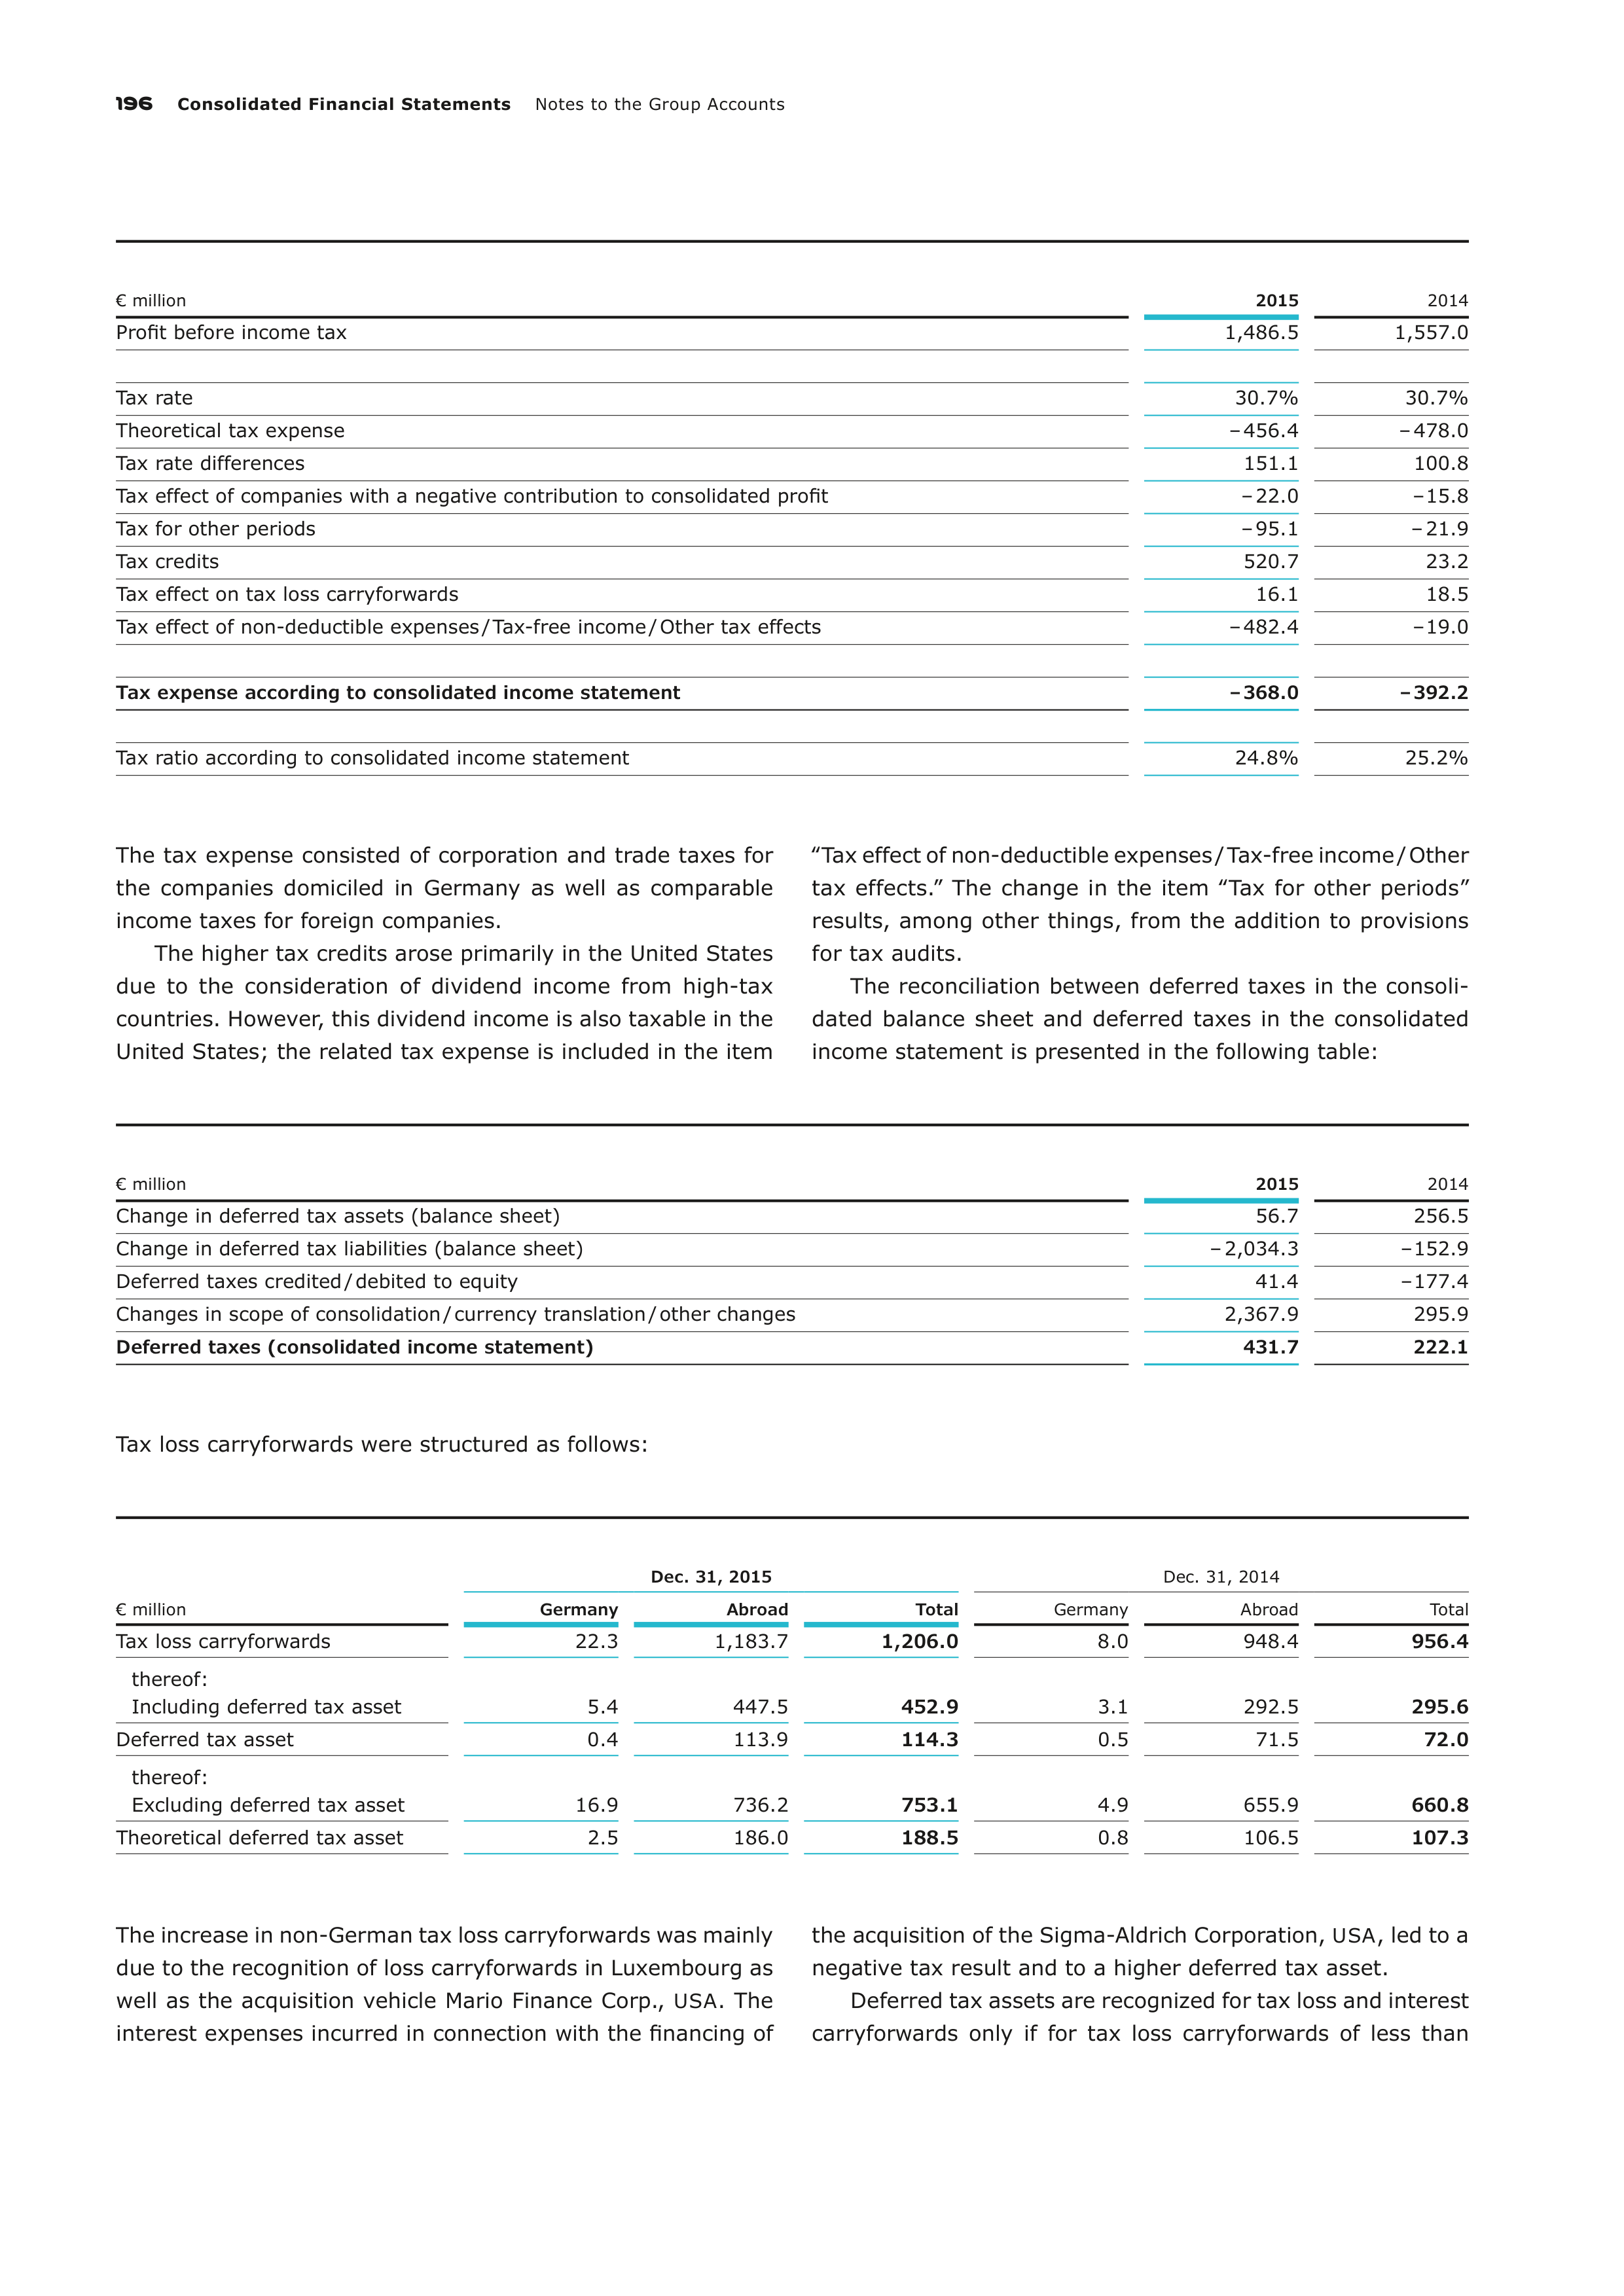
196
Consolidated Financial Statements
Notes to the Group Accounts
€ million
2015
2014
Profit before income tax
1,486.5
1,557.0
Tax rate
30.7%
30.7%
Theoretical tax expense
– 456.4
– 478.0
Tax rate differences
151.1
100.8
Tax effect of companies with a negative contribution to consolidated profit
– 22.0
– 15.8
Tax for other periods
– 95.1
– 21.9
Tax credits
520.7
23.2
Tax effect on tax loss carryforwards
16.1
18.5
Tax effect of non-deductible expenses / Tax-free income / Other tax effects
– 482.4
– 19.0
Tax expense according to consolidated income statement
– 368.0
– 392.2
Tax ratio according to consolidated income statement
24.8%
25.2%
The tax expense consisted of corporation and trade taxes for
the companies domiciled in Germany as well as comparable
income taxes for foreign companies.
The higher tax credits arose primarily in the United States
due to the consideration of dividend income from high-tax
countries. However, this dividend income is also taxable in the
United States; the related tax expense is included in the item
‟Tax effect of non-deductible expenses / Tax-free income / Other
tax effects.” The change in the item ‟Tax for other periods”
results,
among other things, from the addition to provisions
for tax
audits.
The reconciliation between deferred taxes in the consoli-
dated balance sheet and deferred taxes in the consolidated
income statement is presented in the following table:
€ million
2015
2014
Change in deferred tax assets (balance sheet)
56.7
256.5
Change in deferred tax liabilities (balance sheet)
– 2,034.3
– 152.9
Deferred taxes credited / debited to equity
41.4
– 177.4
Changes in scope of consolidation / currency translation / other changes
2,367.9
295.9
Deferred taxes (consolidated income statement)
431.7
222.1
Tax loss carryforwards were structured as follows:
€ million
Dec. 31, 2015
Dec. 31, 2014
Germany
Abroad
Total
Germany
Abroad
Total
Tax loss carryforwards
22.3
1,183.7
1,206.0
8.0
948.4
956.4
thereof:
Including deferred tax asset
5.4
447.5
452.9
3.1
292.5
295.6
Deferred tax asset
0.4
113.9
114.3
0.5
71.5
72.0
thereof:
Excluding deferred tax asset
16.9
736.2
753.1
4.9
655.9
660.8
Theoretical deferred tax asset
2.5
186.0
188.5
0.8
106.5
107.3
The increase in non-German tax loss carryforwards was mainly
due to the recognition of loss carryforwards in Luxembourg as
well as the acquisition vehicle Mario Finance Corp.,
USA
. The
interest expenses incurred in connection with the financing of
the acquisition of the Sigma-Aldrich Corporation,
USA
, led to a
negative tax result and to a higher deferred tax asset.
Deferred tax assets are recognized for tax loss and interest
carryforwards only if for tax loss carryforwards of less than
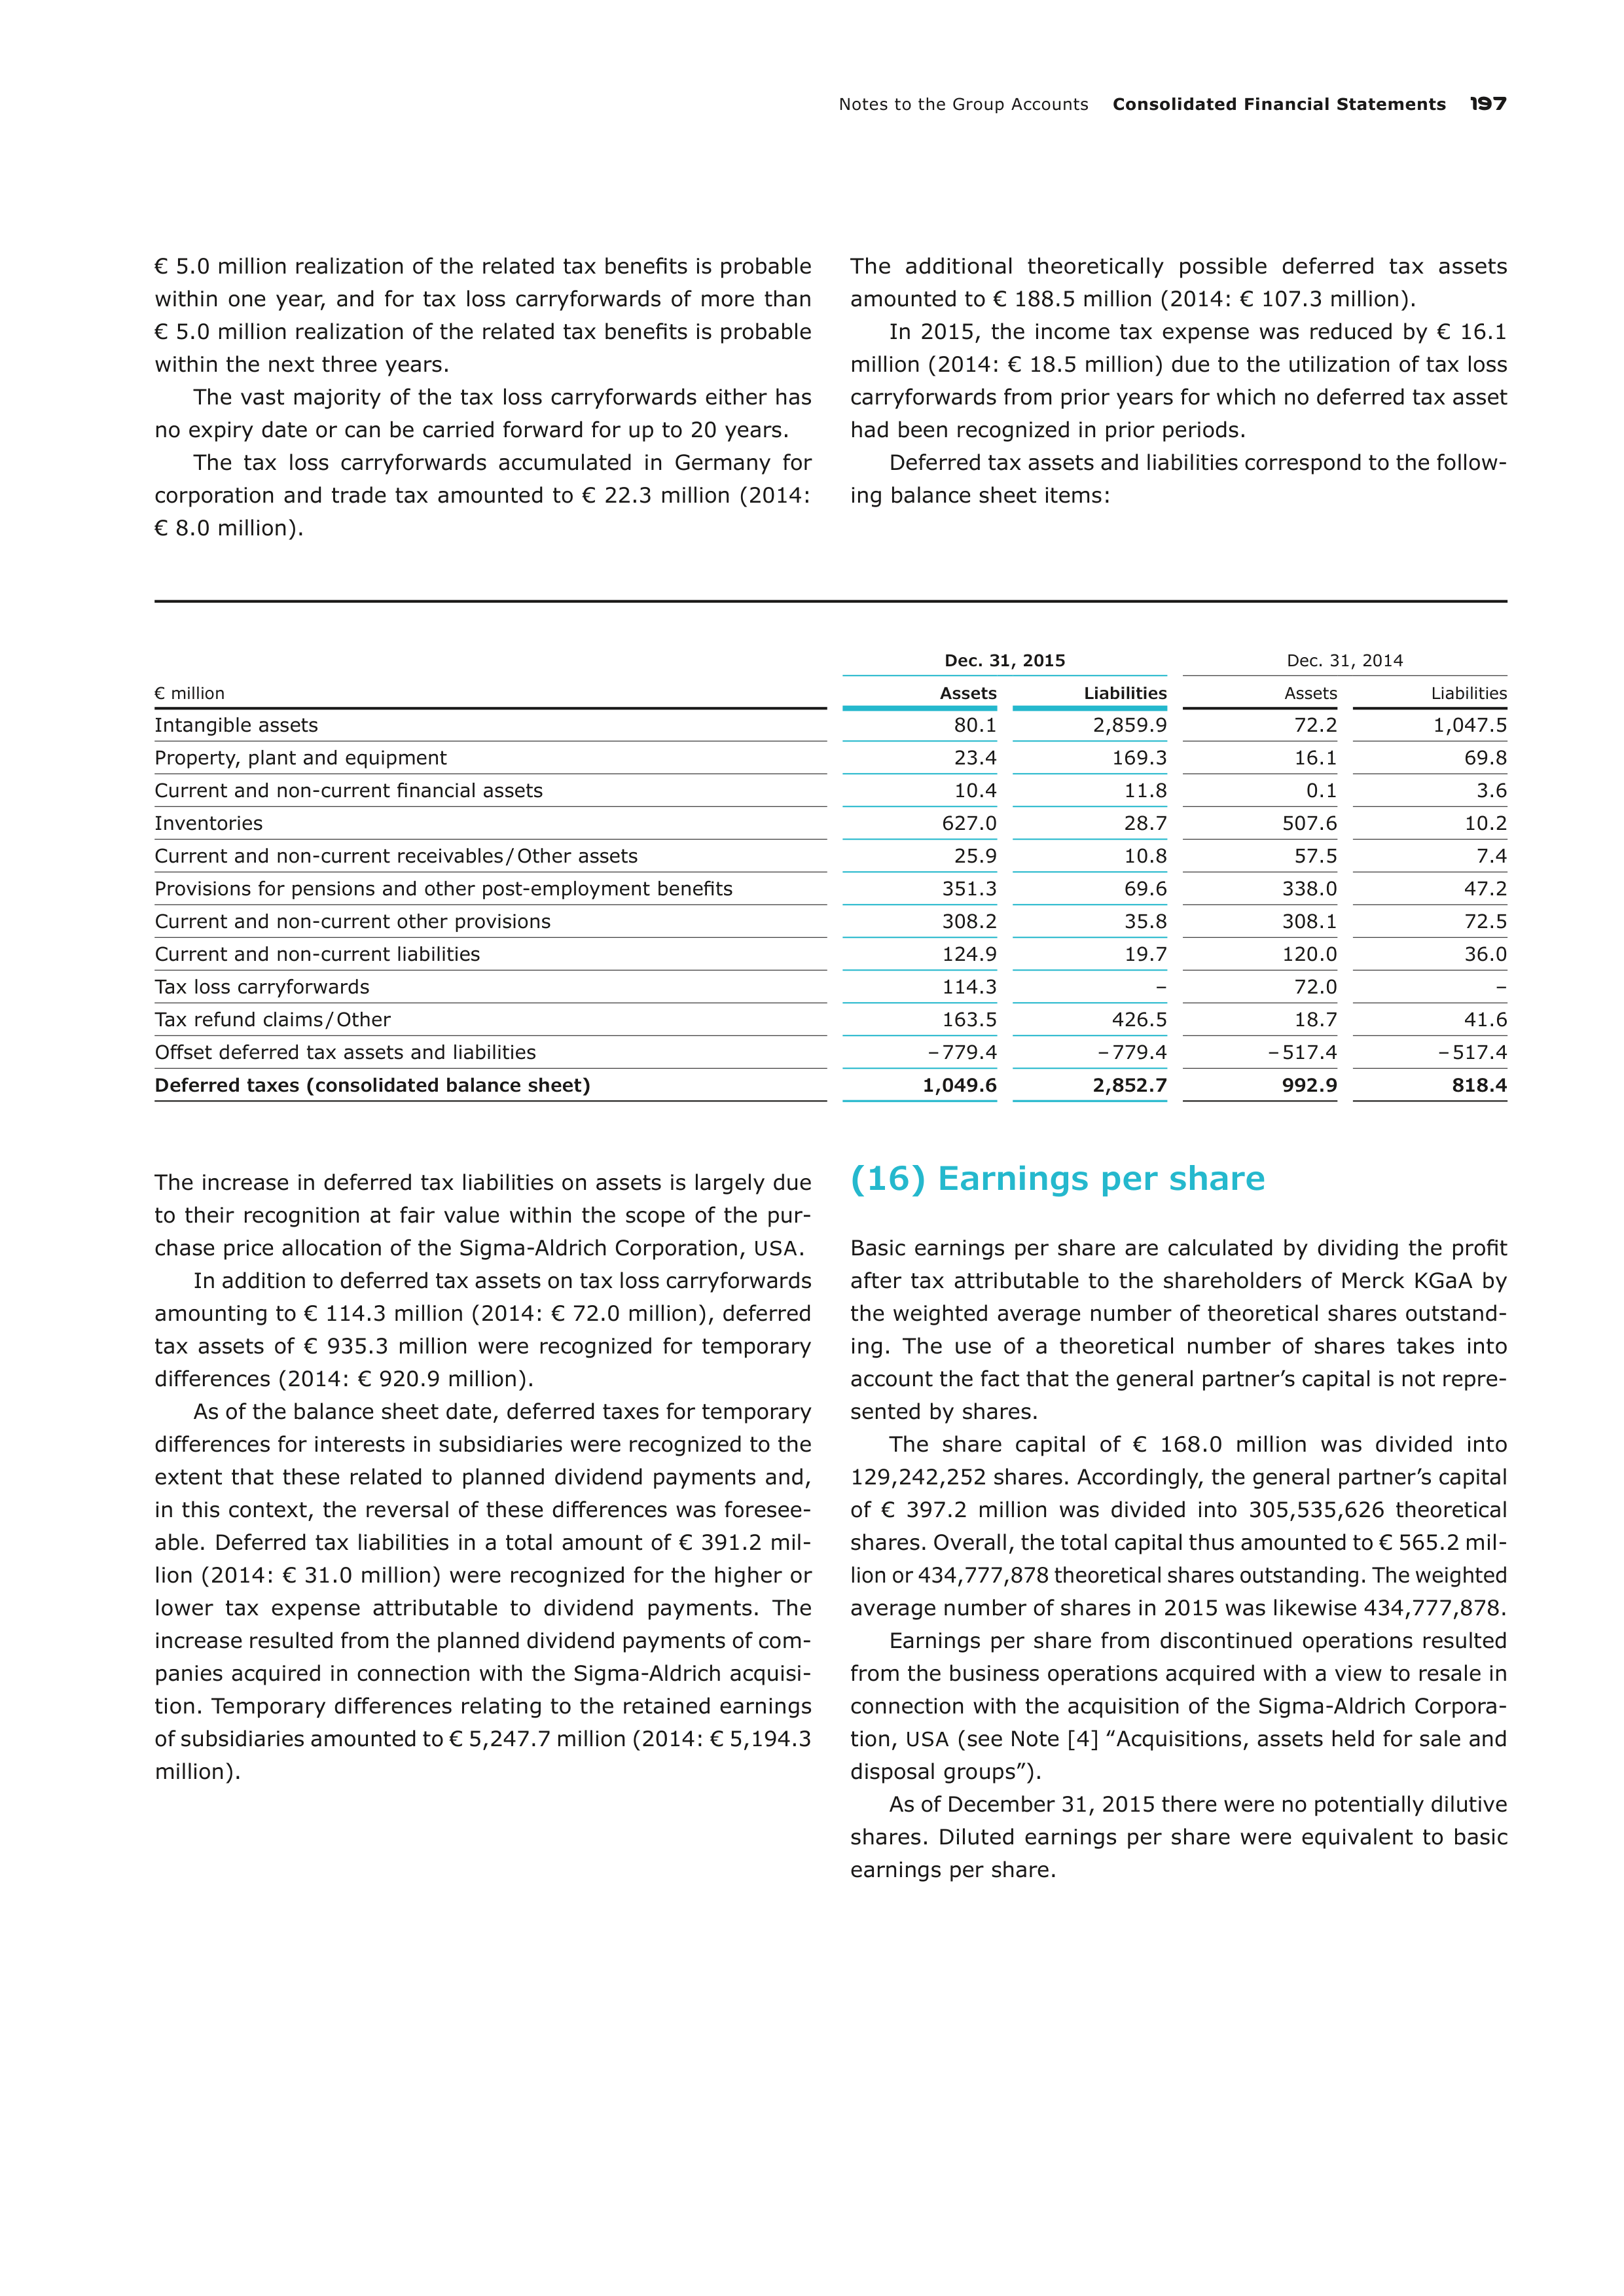
Notes to the Group Accounts
Consolidated Financial Statements
197
€ 5.0 million realization of the related tax benefits is probable
within one year, and for tax loss carryforwards of more than
€ 5.0 million realization of the related tax benefits is probable
within the next three years.
The vast majority of the tax loss carryforwards either has
no expiry date or can be carried forward for up to 20 years.
The tax loss carryforwards accumulated in Germany for
corporation and trade tax amounted to € 22.3 million (2014:
€ 8.0 million).
The additional theoretically possible deferred tax assets
amounted to € 188.5 million (2014: € 107.3 million).
In 2015, the income tax expense was reduced by € 16.1
million (2014: € 18.5 million) due to the utilization of tax loss
carryforwards from prior years for which no deferred tax asset
had been recognized in prior periods.
Deferred tax assets and liabilities correspond to the follow-
ing balance sheet items:
€ million
Dec. 31, 2015
Dec. 31, 2014
Assets
Liabilities
Assets
Liabilities
Intangible assets
80.1
2,859.9
72.2
1,047.5
Property, plant and equipment
23.4
169.3
16.1
69.8
Current and non-current financial assets
10.4
11.8
0.1
3.6
Inventories
627.0
28.7
507.6
10.2
Current and non-current receivables / Other assets
25.9
10.8
57.5
7.4
Provisions for pensions and other post-employment benefits
351.3
69.6
338.0
47.2
Current and non-current other provisions
308.2
35.8
308.1
72.5
Current and non-current liabilities
124.9
19.7
120.0
36.0
Tax loss carryforwards
114.3
–
72.0
–
Tax refund claims / Other
163.5
426.5
18.7
41.6
Offset deferred tax assets and liabilities
– 779.4
– 779.4
– 517.4
– 517.4
Deferred taxes (consolidated balance sheet)
1,049.6
2,852.7
992.9
818.4
The increase in deferred tax liabilities on assets is largely due
to their recognition at fair value within the scope of the pur-
chase price allocation of the Sigma-Aldrich Corporation,
USA
.
In addition to deferred tax assets on tax loss carryforwards
amounting to € 114.3 million (2014: € 72.0 million), deferred
tax assets of € 935.3 million were recognized for temporary
differences (2014: € 920.9 million).
As of the balance sheet date, deferred taxes for temporary
differences for interests in subsidiaries were recognized to the
extent that these related to planned dividend payments and,
in this context, the reversal of these differences was foresee-
able. Deferred tax liabilities in a total amount of € 391.2 mil-
lion (2014: € 31.0 million) were recognized for the higher or
lower tax expense attributable to dividend payments. The
increase resulted from the planned dividend payments of com-
panies acquired in connection with the Sigma-Aldrich acquisi-
tion. Temporary differences relating to the retained earnings
of subsidiaries amounted to € 5,247.7 million (2014: € 5,194.3
million).
(16) Earnings per share
Basic earnings per share are calculated by dividing the profit
after tax attributable to the shareholders of Merck KGaA by
the weighted average number of theoretical shares outstand-
ing. The use of a theoretical number of shares takes into
account the fact that the general partner’s capital is not repre-
sented by shares.
The share capital of € 168.0 million was divided into
129,242,252 shares. Accordingly, the general partner’s capital
of € 397.2 million was divided into 305,535,626 theoretical
shares. Overall, the total capital thus amounted to € 565.2
mil-
lion or 434,777,878 theoretical shares outstanding. The weighted
average number of shares in 2015 was likewise
434,777,878.
Earnings per share from discontinued operations resulted
from the business operations acquired with a view to resale in
connection with the acquisition of the Sigma-Aldrich Corpora-
tion,
USA
(see Note [4] ‟Acquisitions, assets held for sale and
disposal groups”).
As of December 31, 2015 there were no potentially dilutive
shares. Diluted earnings per share were equivalent to basic
earnings per share.
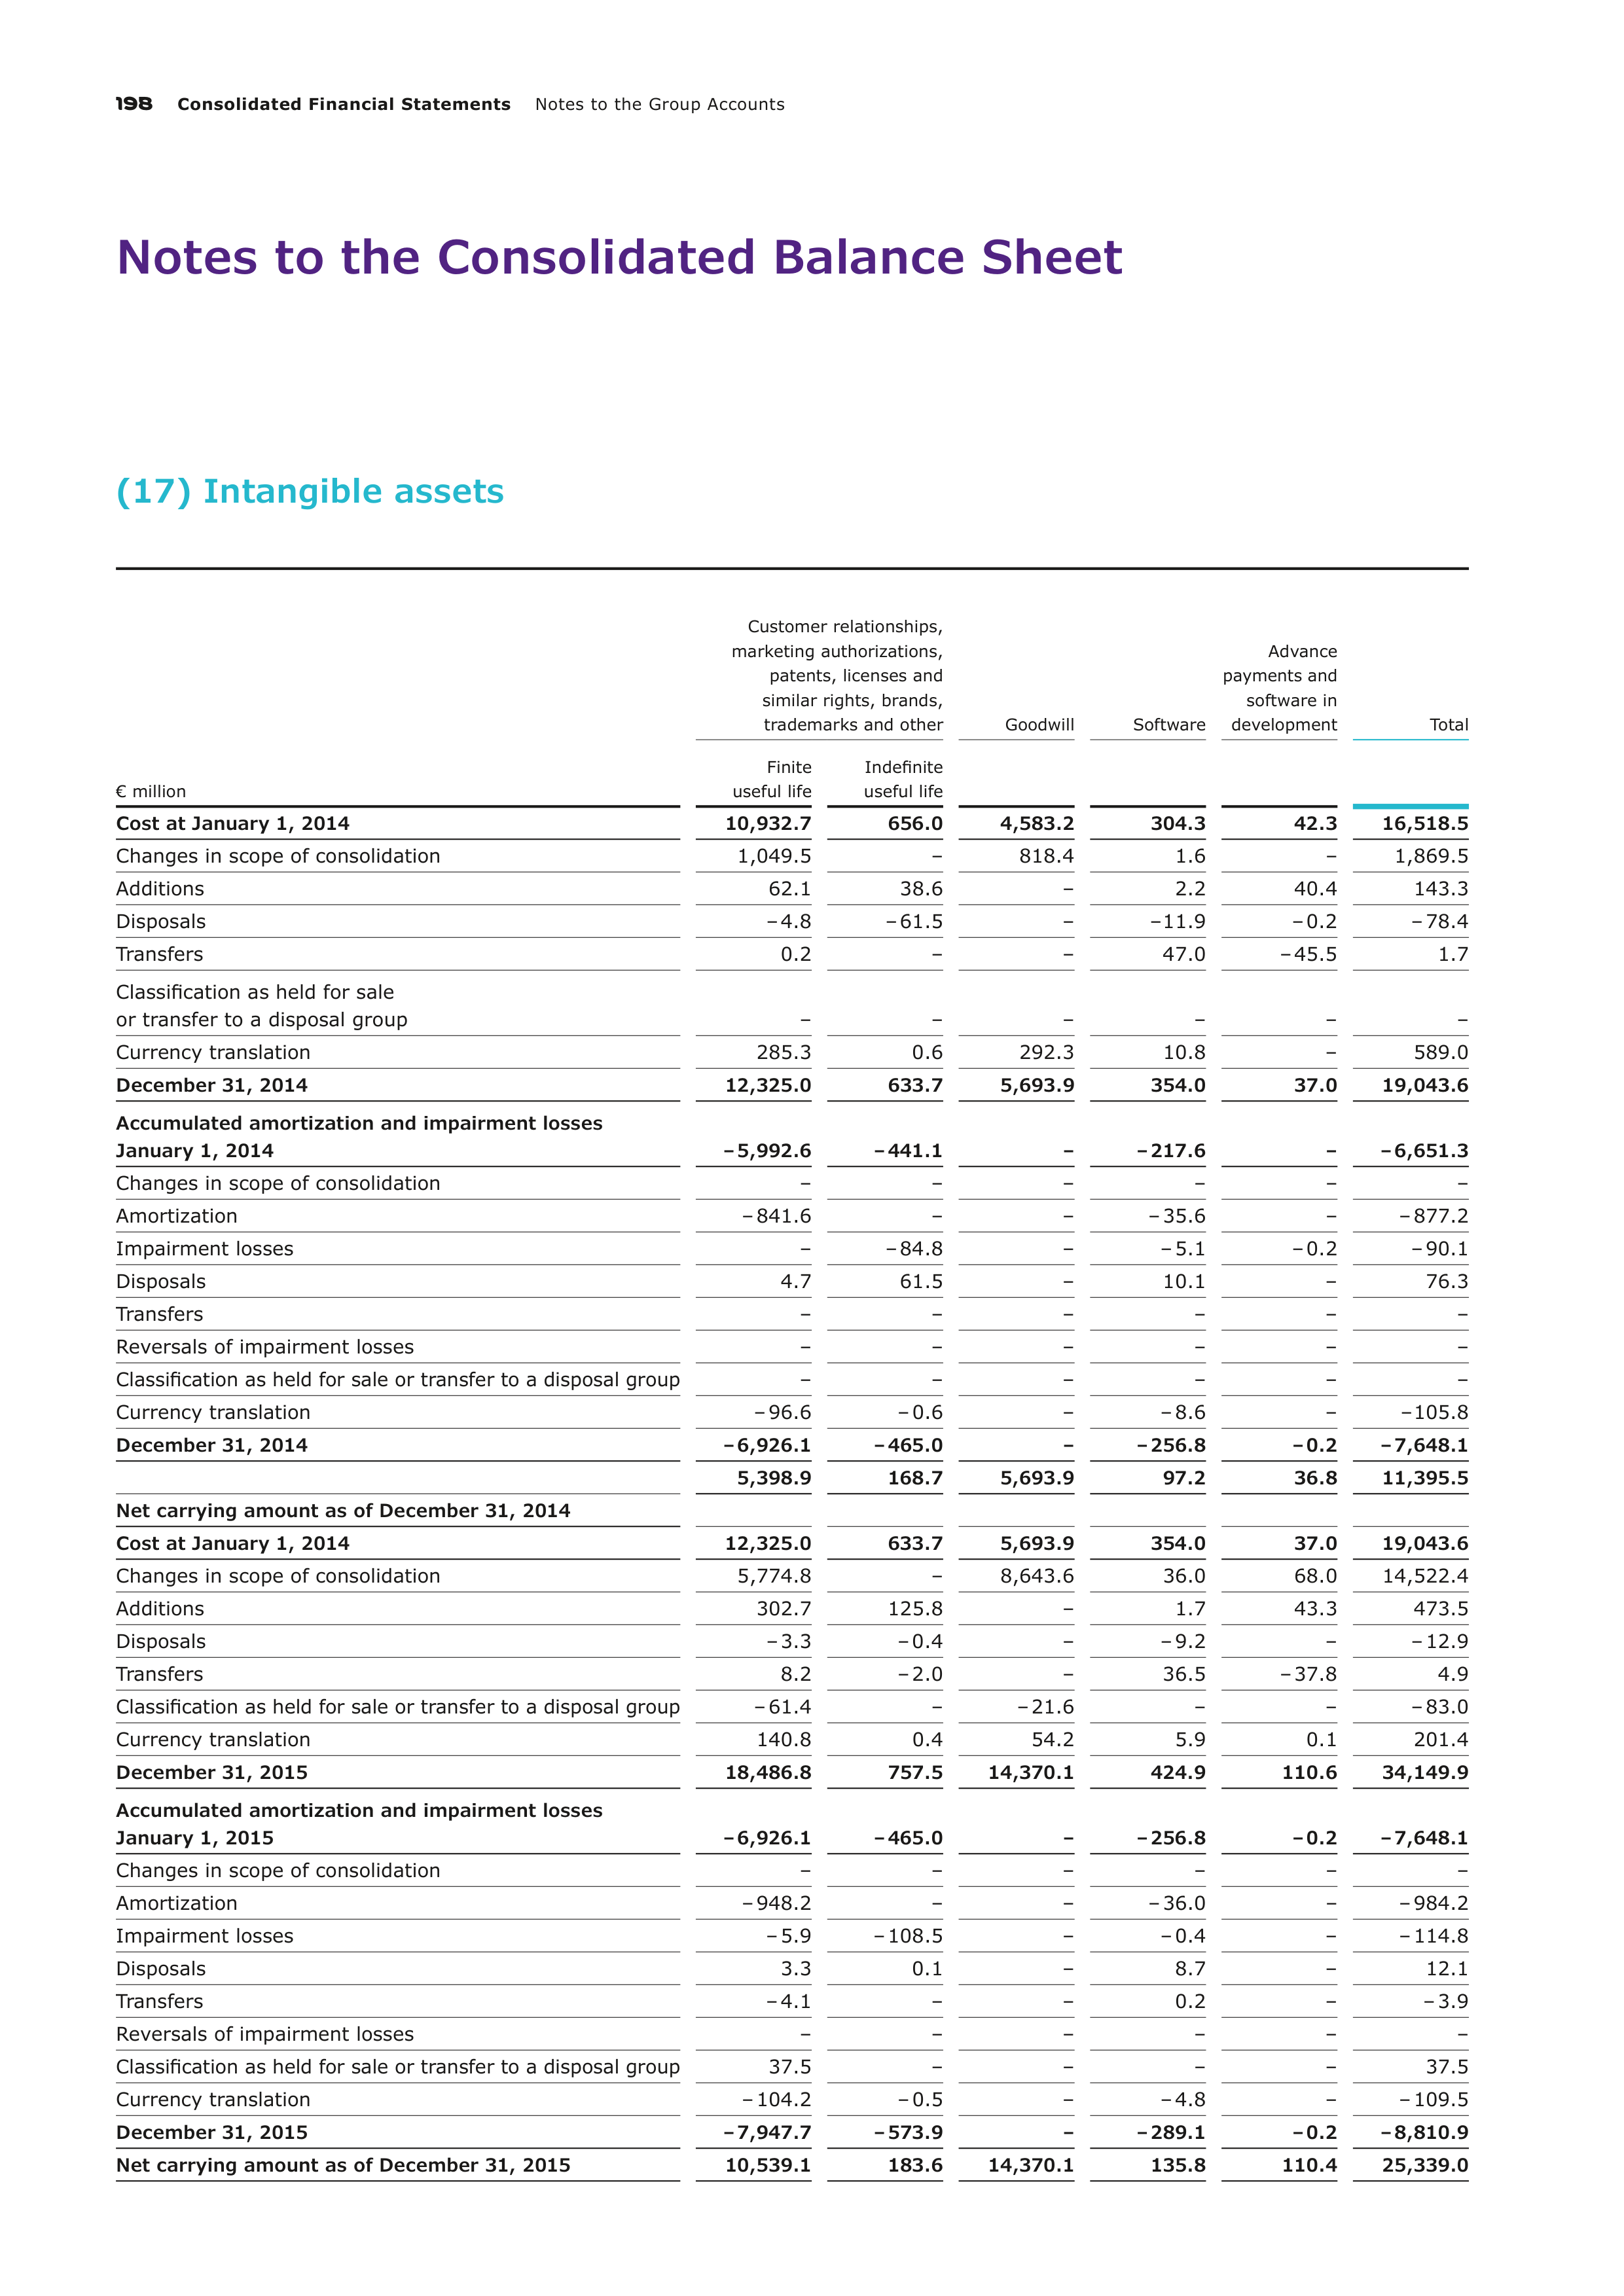
198
Consolidated Financial Statements
Notes to the Group Accounts
Notes to the Consolidated Balance Sheet
(17) Intangible assets
Customer relationships,
marketing authorizations,
patents, licenses and
similar rights, brands,
trademarks and other
Goodwill
Software
Advance
payments and
software in
development
Total
€ million
Finite
useful life
Indefinite
useful life
Cost at January 1, 2014
10,932.7
656.0
4,583.2
304.3
42.3
16,518.5
Changes in scope of consolidation
1,049.5
–
818.4
1.6
–
1,869.5
Additions
62.1
38.6
–
2.2
40.4
143.3
Disposals
– 4.8
– 61.5
–
– 11.9
– 0.2
– 78.4
Transfers
0.2
–
–
47.0
– 45.5
1.7
Classification as held for sale
or transfer to a disposal group
–
–
–
–
–
–
Currency translation
285.3
0.6
292.3
10.8
–
589.0
December 31, 2014
12,325.0
633.7
5,693.9
354.0
37.0
19,043.6
Accumulated amortization and impairment losses
January 1, 2014
– 5,992.6
– 441.1
–
– 217.6
–
– 6,651.3
Changes in scope of consolidation
–
–
–
–
–
–
Amortization
– 841.6
–
–
– 35.6
–
– 877.2
Impairment losses
–
– 84.8
–
– 5.1
– 0.2
– 90.1
Disposals
4.7
61.5
–
10.1
–
76.3
Transfers
–
–
–
–
–
–
Reversals of impairment losses
–
–
–
–
–
–
Classification as held for sale or transfer to a disposal group
–
–
–
–
–
–
Currency translation
– 96.6
– 0.6
–
– 8.6
–
– 105.8
December 31, 2014
– 6,926.1
– 465.0
–
– 256.8
– 0.2
– 7,648.1
5,398.9
168.7
5,693.9
97.2
36.8
11,395.5
Net carrying amount as of December 31, 2014
Cost at January 1, 2014
12,325.0
633.7
5,693.9
354.0
37.0
19,043.6
Changes in scope of consolidation
5,774.8
–
8,643.6
36.0
68.0
14,522.4
Additions
302.7
125.8
–
1.7
43.3
473.5
Disposals
– 3.3
– 0.4
–
– 9.2
–
– 12.9
Transfers
8.2
– 2.0
–
36.5
– 37.8
4.9
Classification as held for sale or transfer to a disposal group
– 61.4
–
– 21.6
–
–
– 83.0
Currency translation
140.8
0.4
54.2
5.9
0.1
201.4
December 31, 2015
18,486.8
757.5
14,370.1
424.9
110.6
34,149.9
Accumulated amortization and impairment losses
January 1, 2015
– 6,926.1
– 465.0
–
– 256.8
– 0.2
– 7,648.1
Changes in scope of consolidation
–
–
–
–
–
–
Amortization
– 948.2
–
–
– 36.0
–
– 984.2
Impairment losses
– 5.9
– 108.5
–
– 0.4
–
– 114.8
Disposals
3.3
0.1
–
8.7
–
12.1
Transfers
– 4.1
–
–
0.2
–
– 3.9
Reversals of impairment losses
–
–
–
–
–
–
Classification as held for sale or transfer to a disposal group
37.5
–
–
–
–
37.5
Currency translation
– 104.2
– 0.5
–
– 4.8
–
– 109.5
December 31, 2015
– 7,947.7
– 573.9
–
– 289.1
– 0.2
– 8,810.9
Net carrying amount as of December 31, 2015
10,539.1
183.6
14,370.1
135.8
110.4
25,339.0
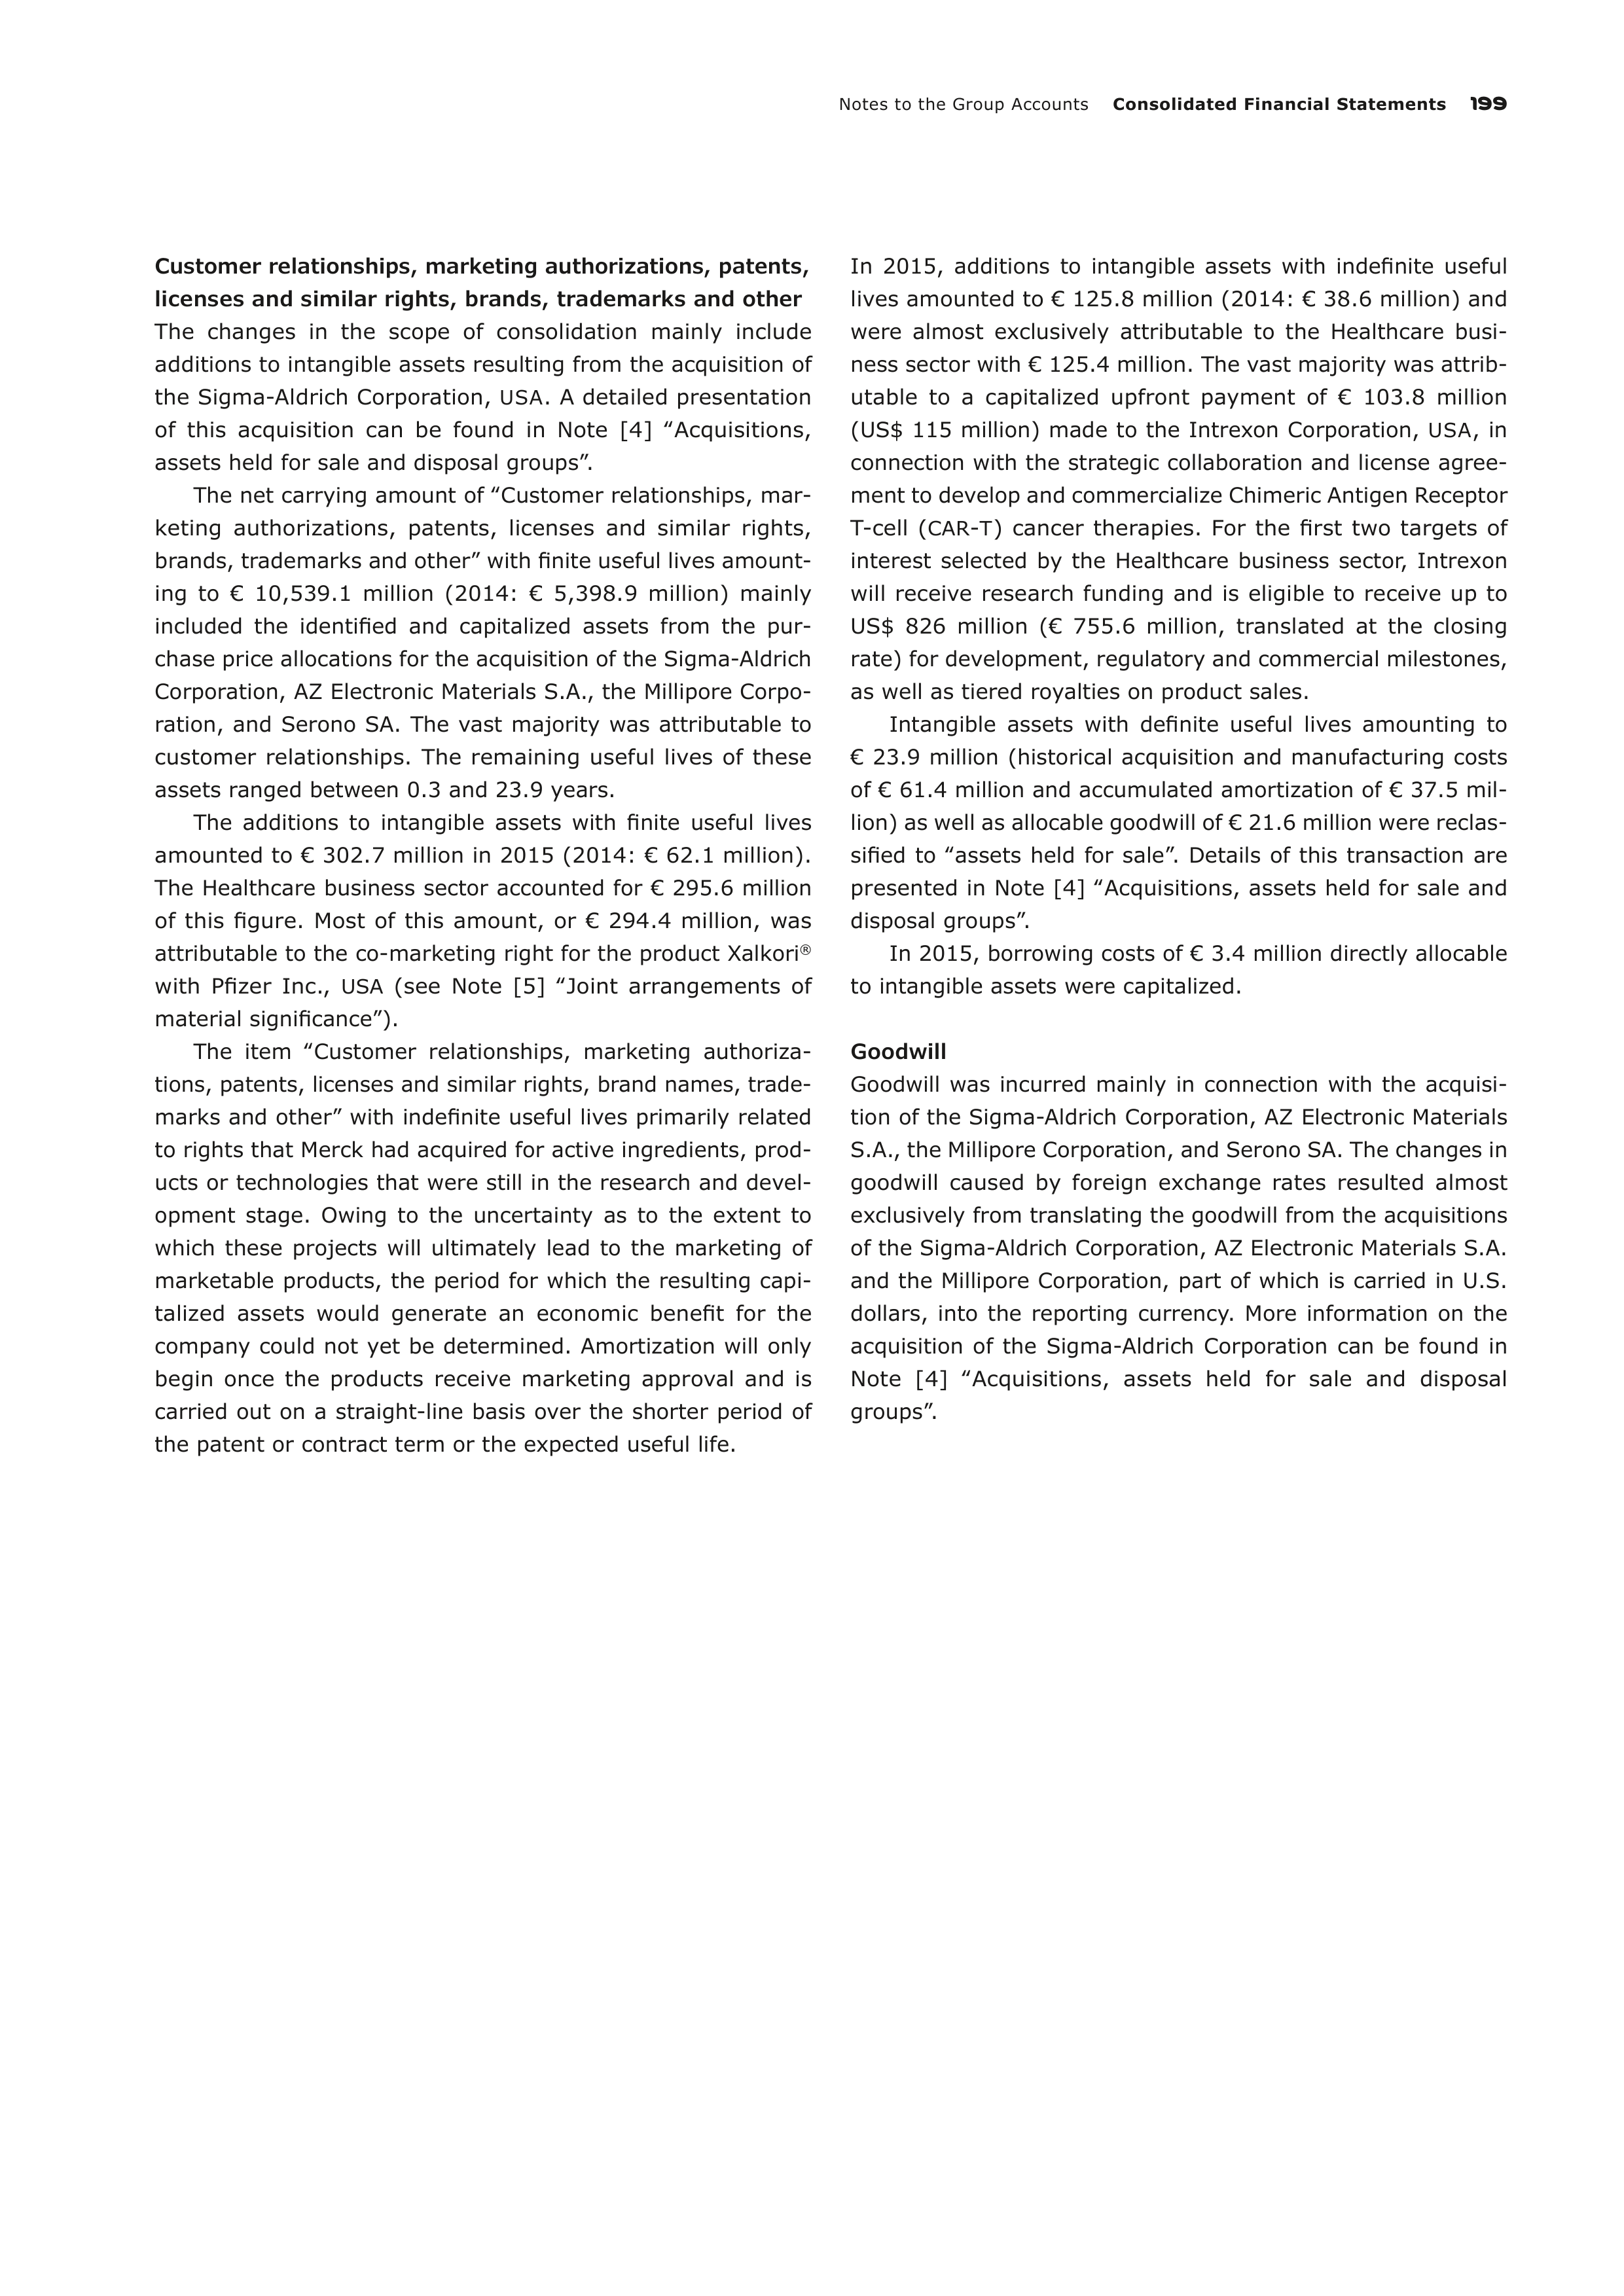
Notes to the Group Accounts
Consolidated Financial Statements
199
Customer relationships, marketing authorizations, patents
,
licenses and similar rights, brands, trademarks and other
The changes in the scope of consolidation mainly include
addi
tions to intangible assets resulting from the acquisition of
the Sigma-Aldrich Corporation,
USA
. A detailed presentation
of this acquisition can be found in Note [4] ‟Acquisitions,
assets held for sale and disposal groups”.
The net carrying amount of ‟Customer relationships, mar-
keting authorizations, patents, licenses and similar rights,
brands, trademarks and other” with finite useful lives amount-
ing to € 10,539.1 million (2014: € 5,398.9 million) mainly
included the identified and capitalized assets from the pur-
chase price allocations for the acquisition of the Sigma-Aldrich
Corporation, AZ Electronic Materials S.A., the Millipore Corpo-
ration, and Serono SA. The vast majority was attributable to
customer relationships. The remaining useful lives of these
assets ranged between 0.3 and 23.9 years.
The additions to intangible assets with finite useful lives
amounted to € 302.7 million in 2015 (2014: € 62.1 million).
The Healthcare business sector accounted for € 295.6 million
of this figure. Most of this amount, or € 294.4 million, was
attributable to the co-marketing right for the product Xalkori
®
with Pfizer Inc.,
USA
(see Note [5] ‟Joint arrangements of
material significance”).
The item ‟Customer relationships, marketing authoriza-
tions, patents, licenses and similar rights, brand names, trade-
marks and other” with indefinite useful lives primarily related
to rights that Merck had acquired for active ingredients, prod-
ucts or technologies that were still in the research and devel-
opment stage. Owing to the uncertainty as to the extent to
which these projects will ultimately lead to the marketing of
marketable products, the period for which the resulting capi-
talized assets would generate an economic benefit for the
company could not yet be determined. Amortization will only
begin once the products receive marketing approval and is
carried out on a straight-line basis over the shorter period of
the patent or contract term or the expected useful life.
In 2015, additions to intangible assets with indefinite useful
lives amounted to € 125.8 million (2014: € 38.6 million) and
were almost exclusively attributable to the Healthcare busi-
ness sector with € 125.4 million. The vast majority was attrib-
utable to a capitalized upfront payment of € 103.8 million
(US$ 115 million) made to the Intrexon Corporation,
USA
, in
connection with the strategic collaboration and license agree-
ment to develop and commercialize Chimeric Antigen Receptor
T-cell (
CAR
-
T
) cancer therapies. For the first two targets of
interest selected by the Healthcare business sector, Intrexon
will receive research funding and is eligible to receive up to
US$ 826 million (€ 755.6 million, translated at the closing
rate) for development, regulatory and commercial milestones,
as well as tiered royalties on product sales.
Intangible assets with definite useful lives amounting to
€ 23.9 million (historical acquisition and manufacturing costs
of € 61.4 million and accumulated amortization of € 37.5 mil-
lion) as well as allocable goodwill of € 21.6 million were reclas-
sified to ‟assets held for sale”. Details of this transaction are
presented in Note [4] ‟Acquisitions, assets held for sale and
disposal groups”.
In 2015, borrowing costs of € 3.4 million directly allocable
to intangible assets were capitalized.
Goodwill
Goodwill was incurred mainly in connection with the acquisi-
tion of the Sigma-Aldrich Corporation, AZ Electronic Materials
S.A., the Millipore Corporation, and Serono SA. The changes in
goodwill caused by foreign exchange rates resulted almost
exclusively from translating the goodwill from the acquisitions
of the Sigma-Aldrich Corporation, AZ Electronic Materials S.A.
and the Millipore Corporation, part of which is carried in U.S.
dollars, into the reporting currency. More information on the
acquisition of the Sigma-Aldrich Corporation can be found in
Note [4] ‟Acquisitions, assets held for sale and disposal
groups”.
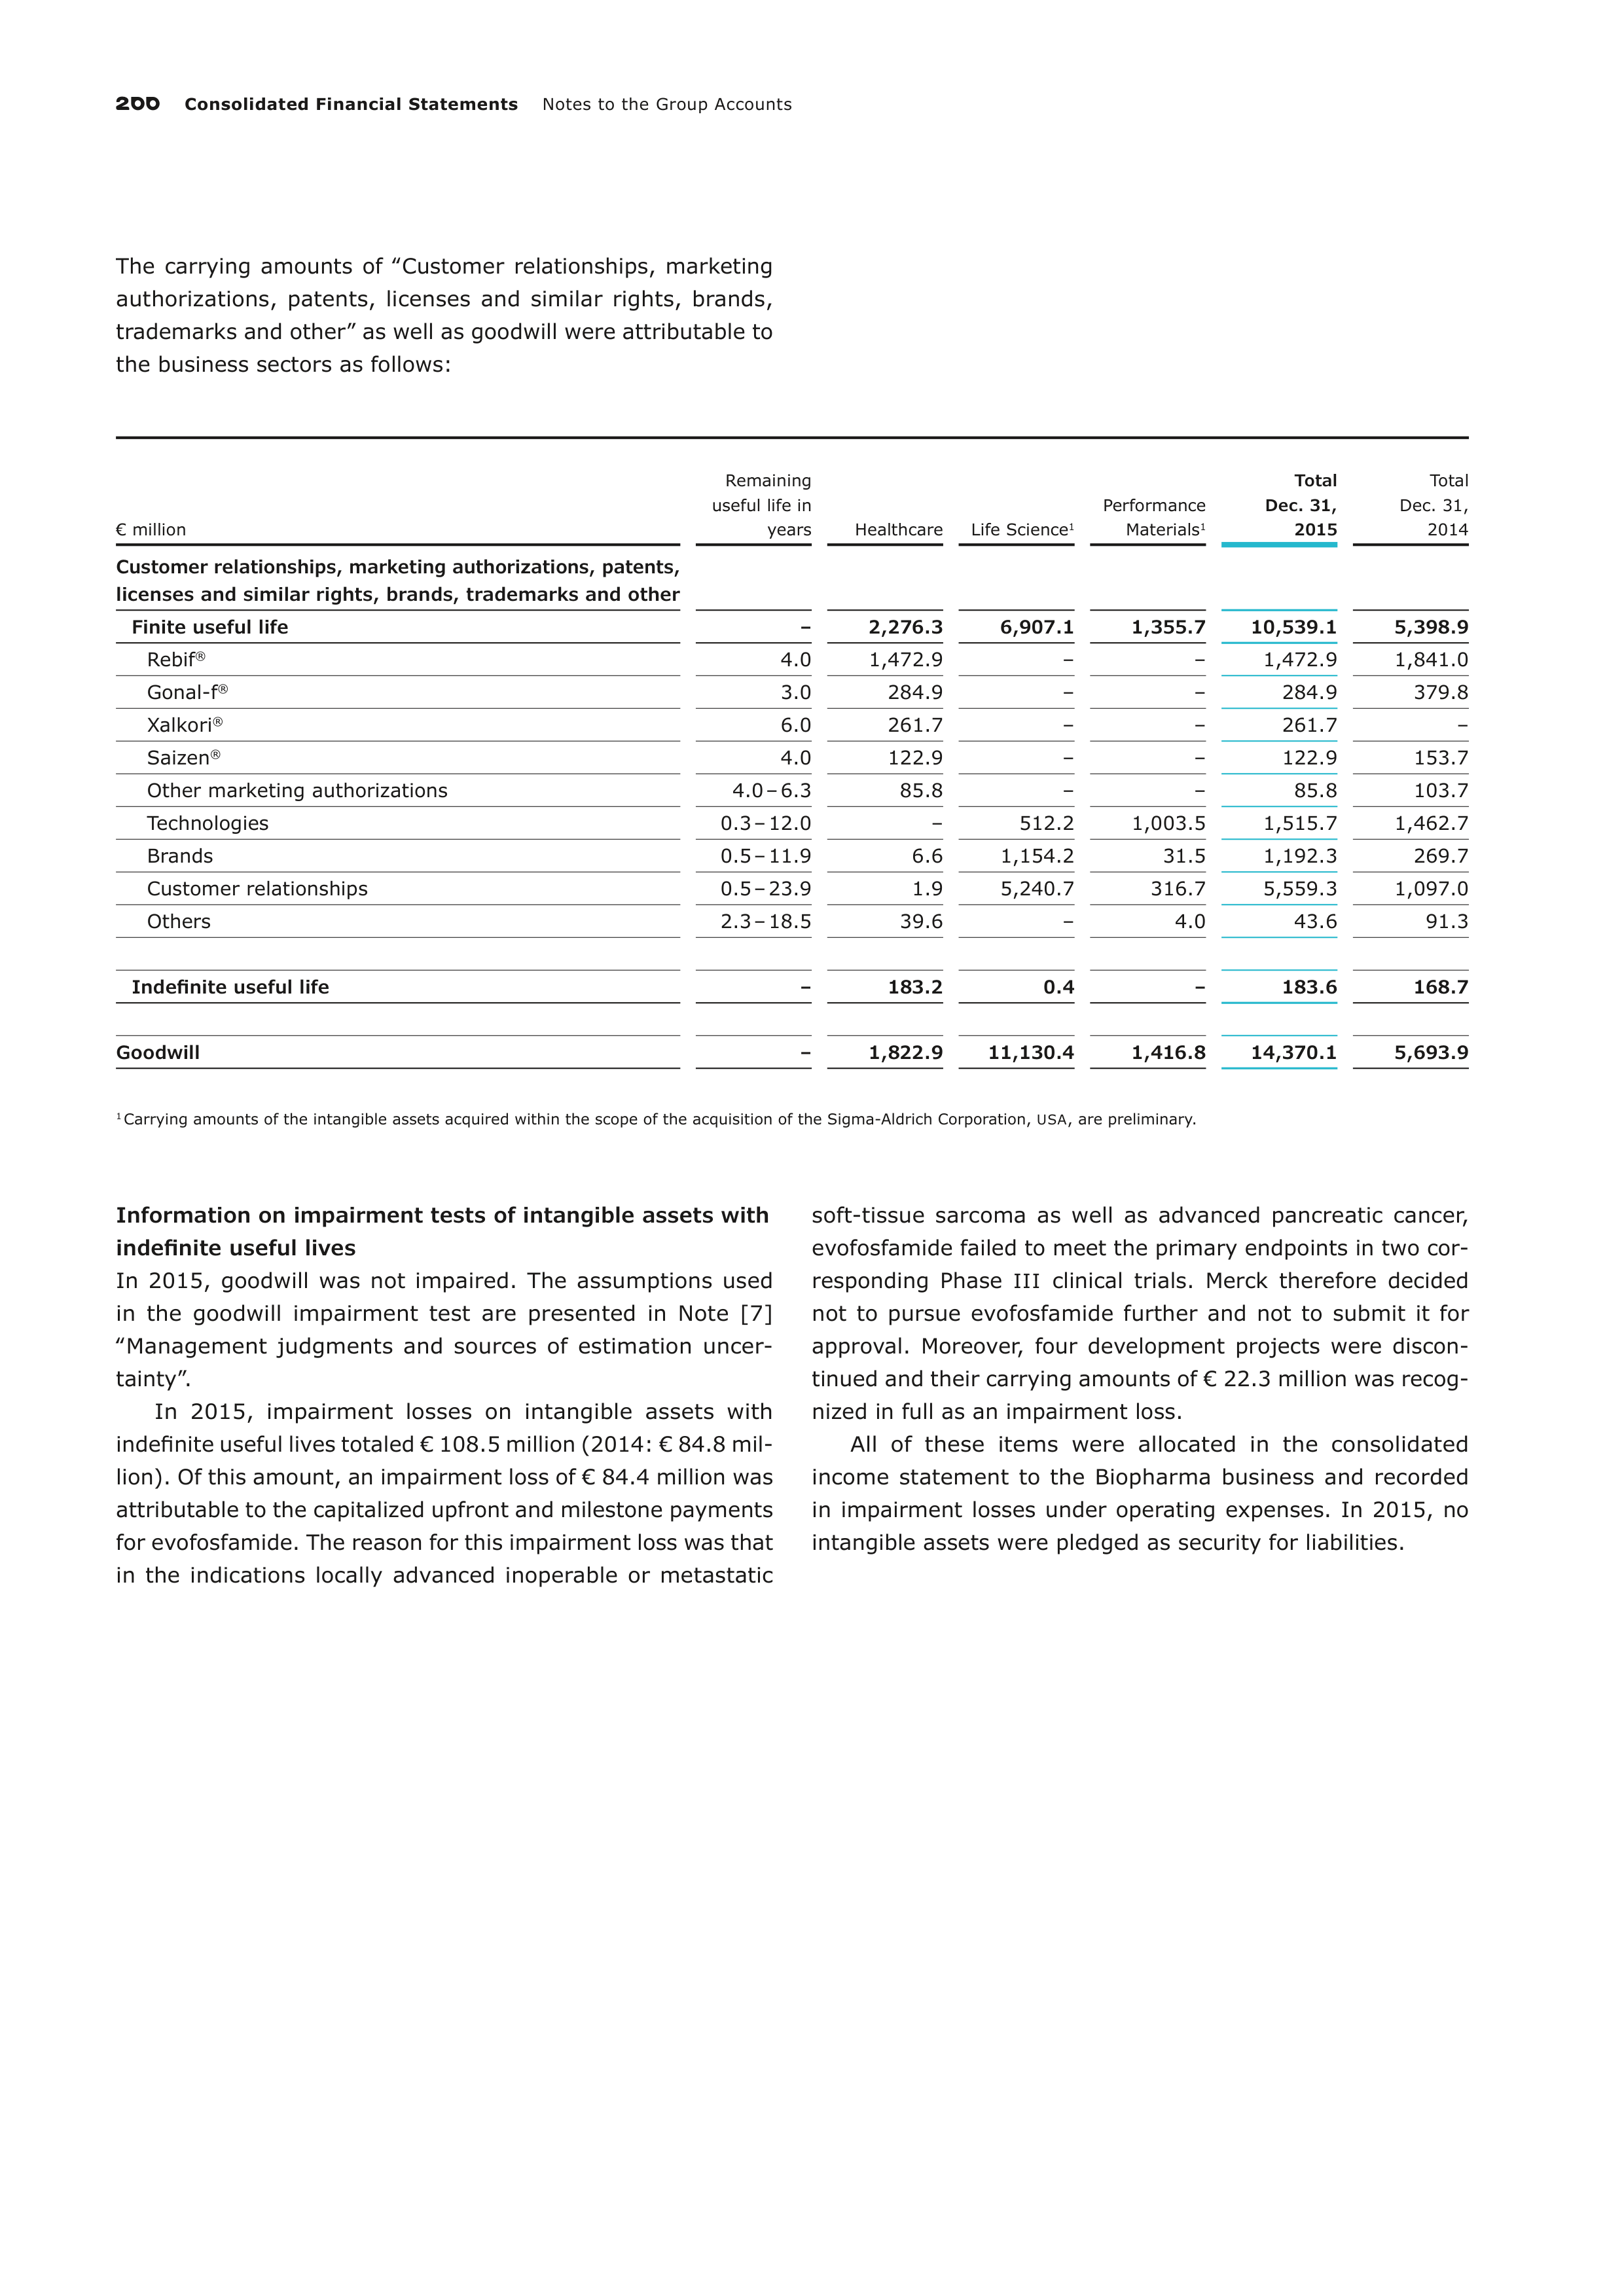
200
Consolidated Financial Statements
Notes to the Group Accounts
The carrying amounts of ‟Customer relationships, marketing
authorizations, patents, licenses and similar rights, brands,
trademarks and other” as well as goodwill were attributable to
the business sectors as follows:
€ million
Remaining
useful life in
years
Healthcare
Life Science
1
Performance
Materials
1
Total
Dec. 31,
2015
Total
Dec. 31,
2014
Customer relationships, marketing authorizations, patents,
licenses and similar rights, brands, trademarks and other
Finite useful life
–
2,276.3
6,907.1
1,355.7
10,539.1
5,398.9
Rebif
®
4.0
1,472.9
–
–
1,472.9
1,841.0
Gonal-f
®
3.0
284.9
–
–
284.9
379.8
Xalkori
®
6.0
261.7
–
–
261.7
–
Saizen
®
4.0
122.9
–
–
122.9
153.7
Other marketing authorizations
4.0 – 6.3
85.8
–
–
85.8
103.7
Technologies
0.3 – 12.0
–
512.2
1,003.5
1,515.7
1,462.7
Brands
0.5 – 11.9
6.6
1,154.2
31.5
1,192.3
269.7
Customer relationships
0.5 – 23.9
1.9
5,240.7
316.7
5,559.3
1,097.0
Others
2.3 – 18.5
39.6
–
4.0
43.6
91.3
Indefinite useful life
–
183.2
0.4
–
183.6
168.7
Goodwill
–
1,822.9
11,130.4
1,416.8
14,370.1
5,693.9
1
Carrying amounts of the intangible assets acquired within the scope of the acquisition of the Sigma-Aldrich Corporation,
USA
, are preliminary.
Information on impairment tests of intangible assets with
indefinite useful lives
In 2015, goodwill was not impaired. The assumptions used
in the goodwill impairment test are presented in Note [7]
‟Management judgments and sources of estimation uncer-
tainty”.
In 2015, impairment losses on intangible assets with
indefinite useful lives totaled € 108.5 million (2014: € 84.8 mil-
lion). Of this amount, an impairment loss of € 84.4 million was
attributable to the capitalized upfront and milestone payments
for evofosfamide. The reason for this impairment loss was that
in the indications locally advanced inoperable or metastatic
soft-tissue sarcoma as well as advanced pancreatic cancer,
evofosfamide failed to meet the primary endpoints in two cor-
responding Phase
III
clinical trials. Merck therefore decided
not to pursue evofosfamide further and not to submit it for
approval. Moreover, four development projects were discon-
tinued and their carrying amounts of € 22.3 million was recog-
nized in full as an impairment loss.
All of these items were allocated in the consolidated
income statement to the Biopharma business and recorded
in
impairment losses under operating expenses. In 2015, no
intangible assets were pledged as security for liabilities.
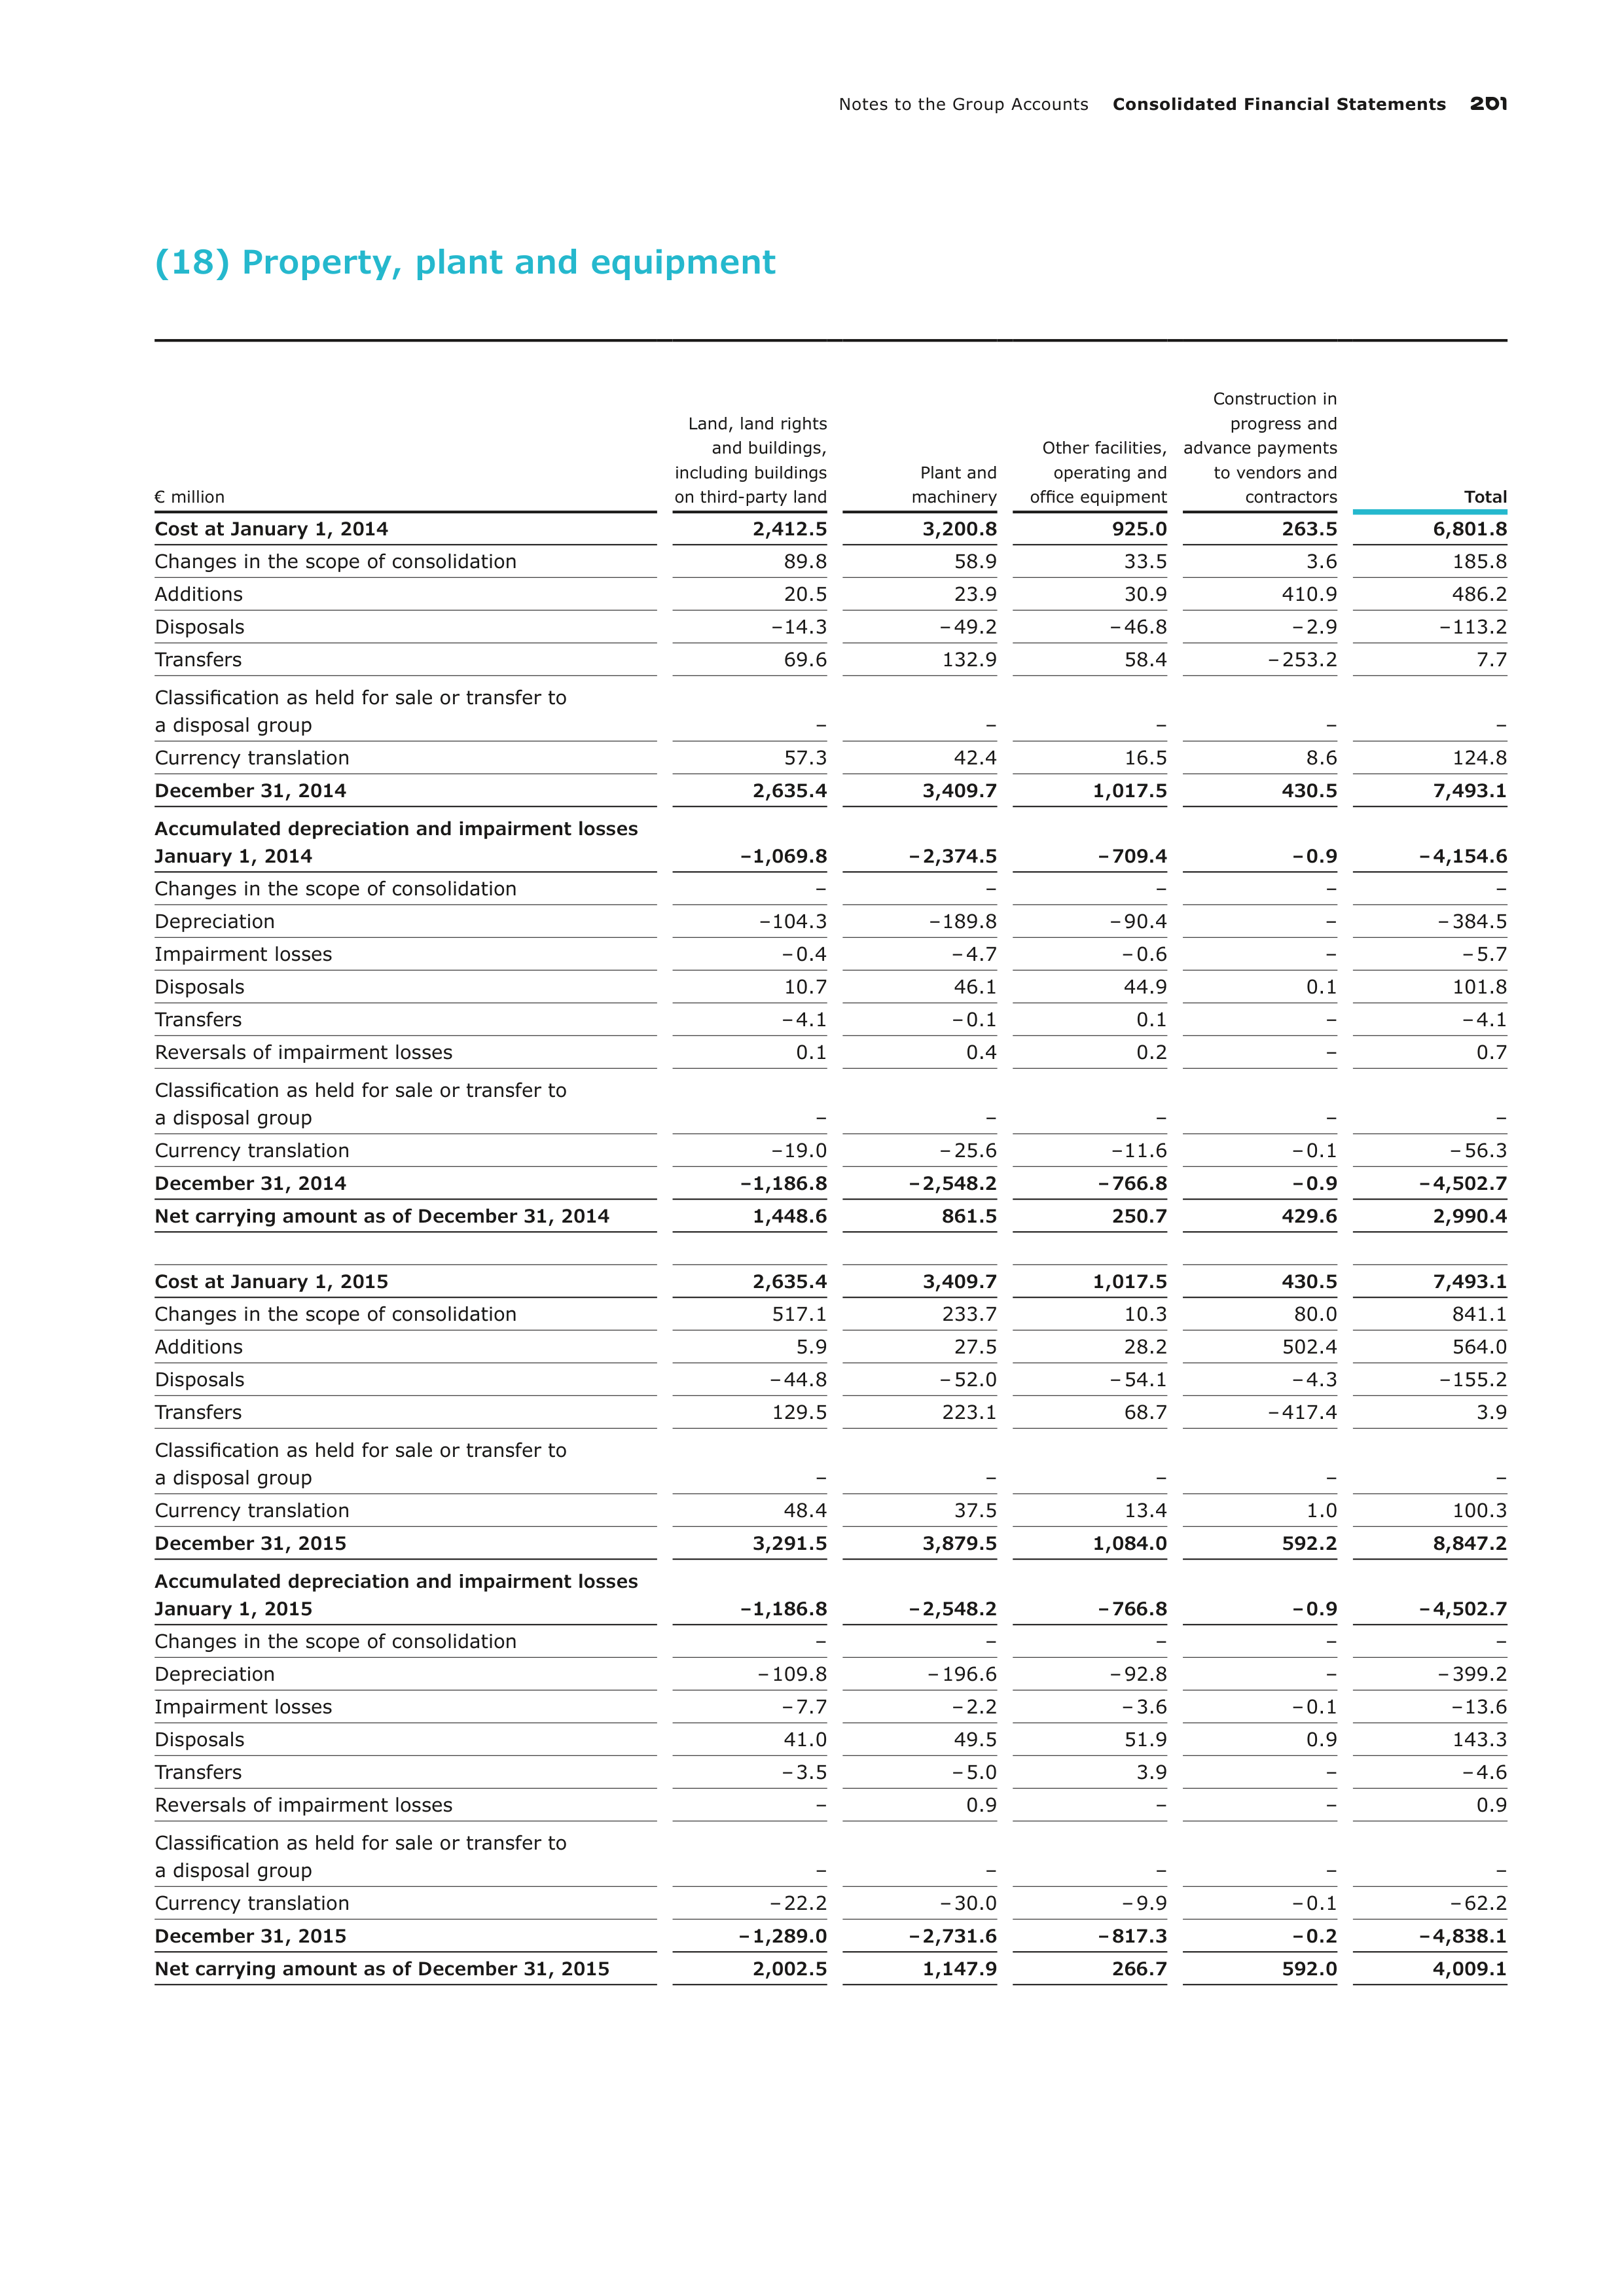
Notes to the Group Accounts
Consolidated Financial Statements
201
(18) Property, plant and equipment
€ million
Land, land rights
and buildings,
including buildings
on third-party land
Plant and
machinery
Other facilities,
operating and
office equipment
Construction in
progress and
advance payments
to vendors and
contractors
Total
Cost at January 1, 2014
2,412.5
3,200.8
925.0
263.5
6,801.8
Changes in the scope of consolidation
89.8
58.9
33.5
3.6
185.8
Additions
20.5
23.9
30.9
410.9
486.2
Disposals
– 14.3
– 49.2
– 46.8
– 2.9
– 113.2
Transfers
69.6
132.9
58.4
– 253.2
7.7
Classification as held for sale or transfer to
a disposal group
–
–
–
–
–
Currency translation
57.3
42.4
16.5
8.6
124.8
December 31, 2014
2,635.4
3,409.7
1,017.5
430.5
7,493.1
Accumulated depreciation and impairment losses
January 1, 2014
– 1,069.8
– 2,374.5
– 709.4
– 0.9
– 4,154.6
Changes in the scope of consolidation
–
–
–
–
–
Depreciation
– 104.3
– 189.8
– 90.4
–
– 384.5
Impairment losses
– 0.4
– 4.7
– 0.6
–
– 5.7
Disposals
10.7
46.1
44.9
0.1
101.8
Transfers
– 4.1
– 0.1
0.1
–
– 4.1
Reversals of impairment losses
0.1
0.4
0.2
–
0.7
Classification as held for sale or transfer to
a disposal group
–
–
–
–
–
Currency translation
– 19.0
– 25.6
– 11.6
– 0.1
– 56.3
December 31, 2014
– 1,186.8
– 2,548.2
– 766.8
– 0.9
– 4,502.7
Net carrying amount as of December 31, 2014
1,448.6
861.5
250.7
429.6
2,990.4
Cost at January 1, 2015
2,635.4
3,409.7
1,017.5
430.5
7,493.1
Changes in the scope of consolidation
517.1
233.7
10.3
80.0
841.1
Additions
5.9
27.5
28.2
502.4
564.0
Disposals
– 44.8
– 52.0
– 54.1
– 4.3
– 155.2
Transfers
129.5
223.1
68.7
– 417.4
3.9
Classification as held for sale or transfer to
a disposal group
–
–
–
–
–
Currency translation
48.4
37.5
13.4
1.0
100.3
December 31, 2015
3,291.5
3,879.5
1,084.0
592.2
8,847.2
Accumulated depreciation and impairment losses
January 1, 2015
–
1,186.8
– 2,548.2
– 766.8
– 0.9
– 4,502.7
Changes in the scope of consolidation
–
–
–
–
–
Depreciation
– 109.8
– 196.6
– 92.8
–
– 399.2
Impairment losses
– 7.7
– 2.2
– 3.6
– 0.1
– 13.6
Disposals
41.0
49.5
51.9
0.9
143.3
Transfers
– 3.5
– 5.0
3.9
–
– 4.6
Reversals of impairment losses
–
0.9
–
–
0.9
Classification as held for sale or transfer to
a disposal group
–
–
–
–
–
Currency translation
– 22.2
– 30.0
– 9.9
– 0.1
– 62.2
December 31, 2015
– 1,289.0
– 2,731.6
– 817.3
– 0.2
– 4,838.1
Net carrying amount as of December 31, 2015
2,002.5
1,147.9
266.7
592.0
4,009.1
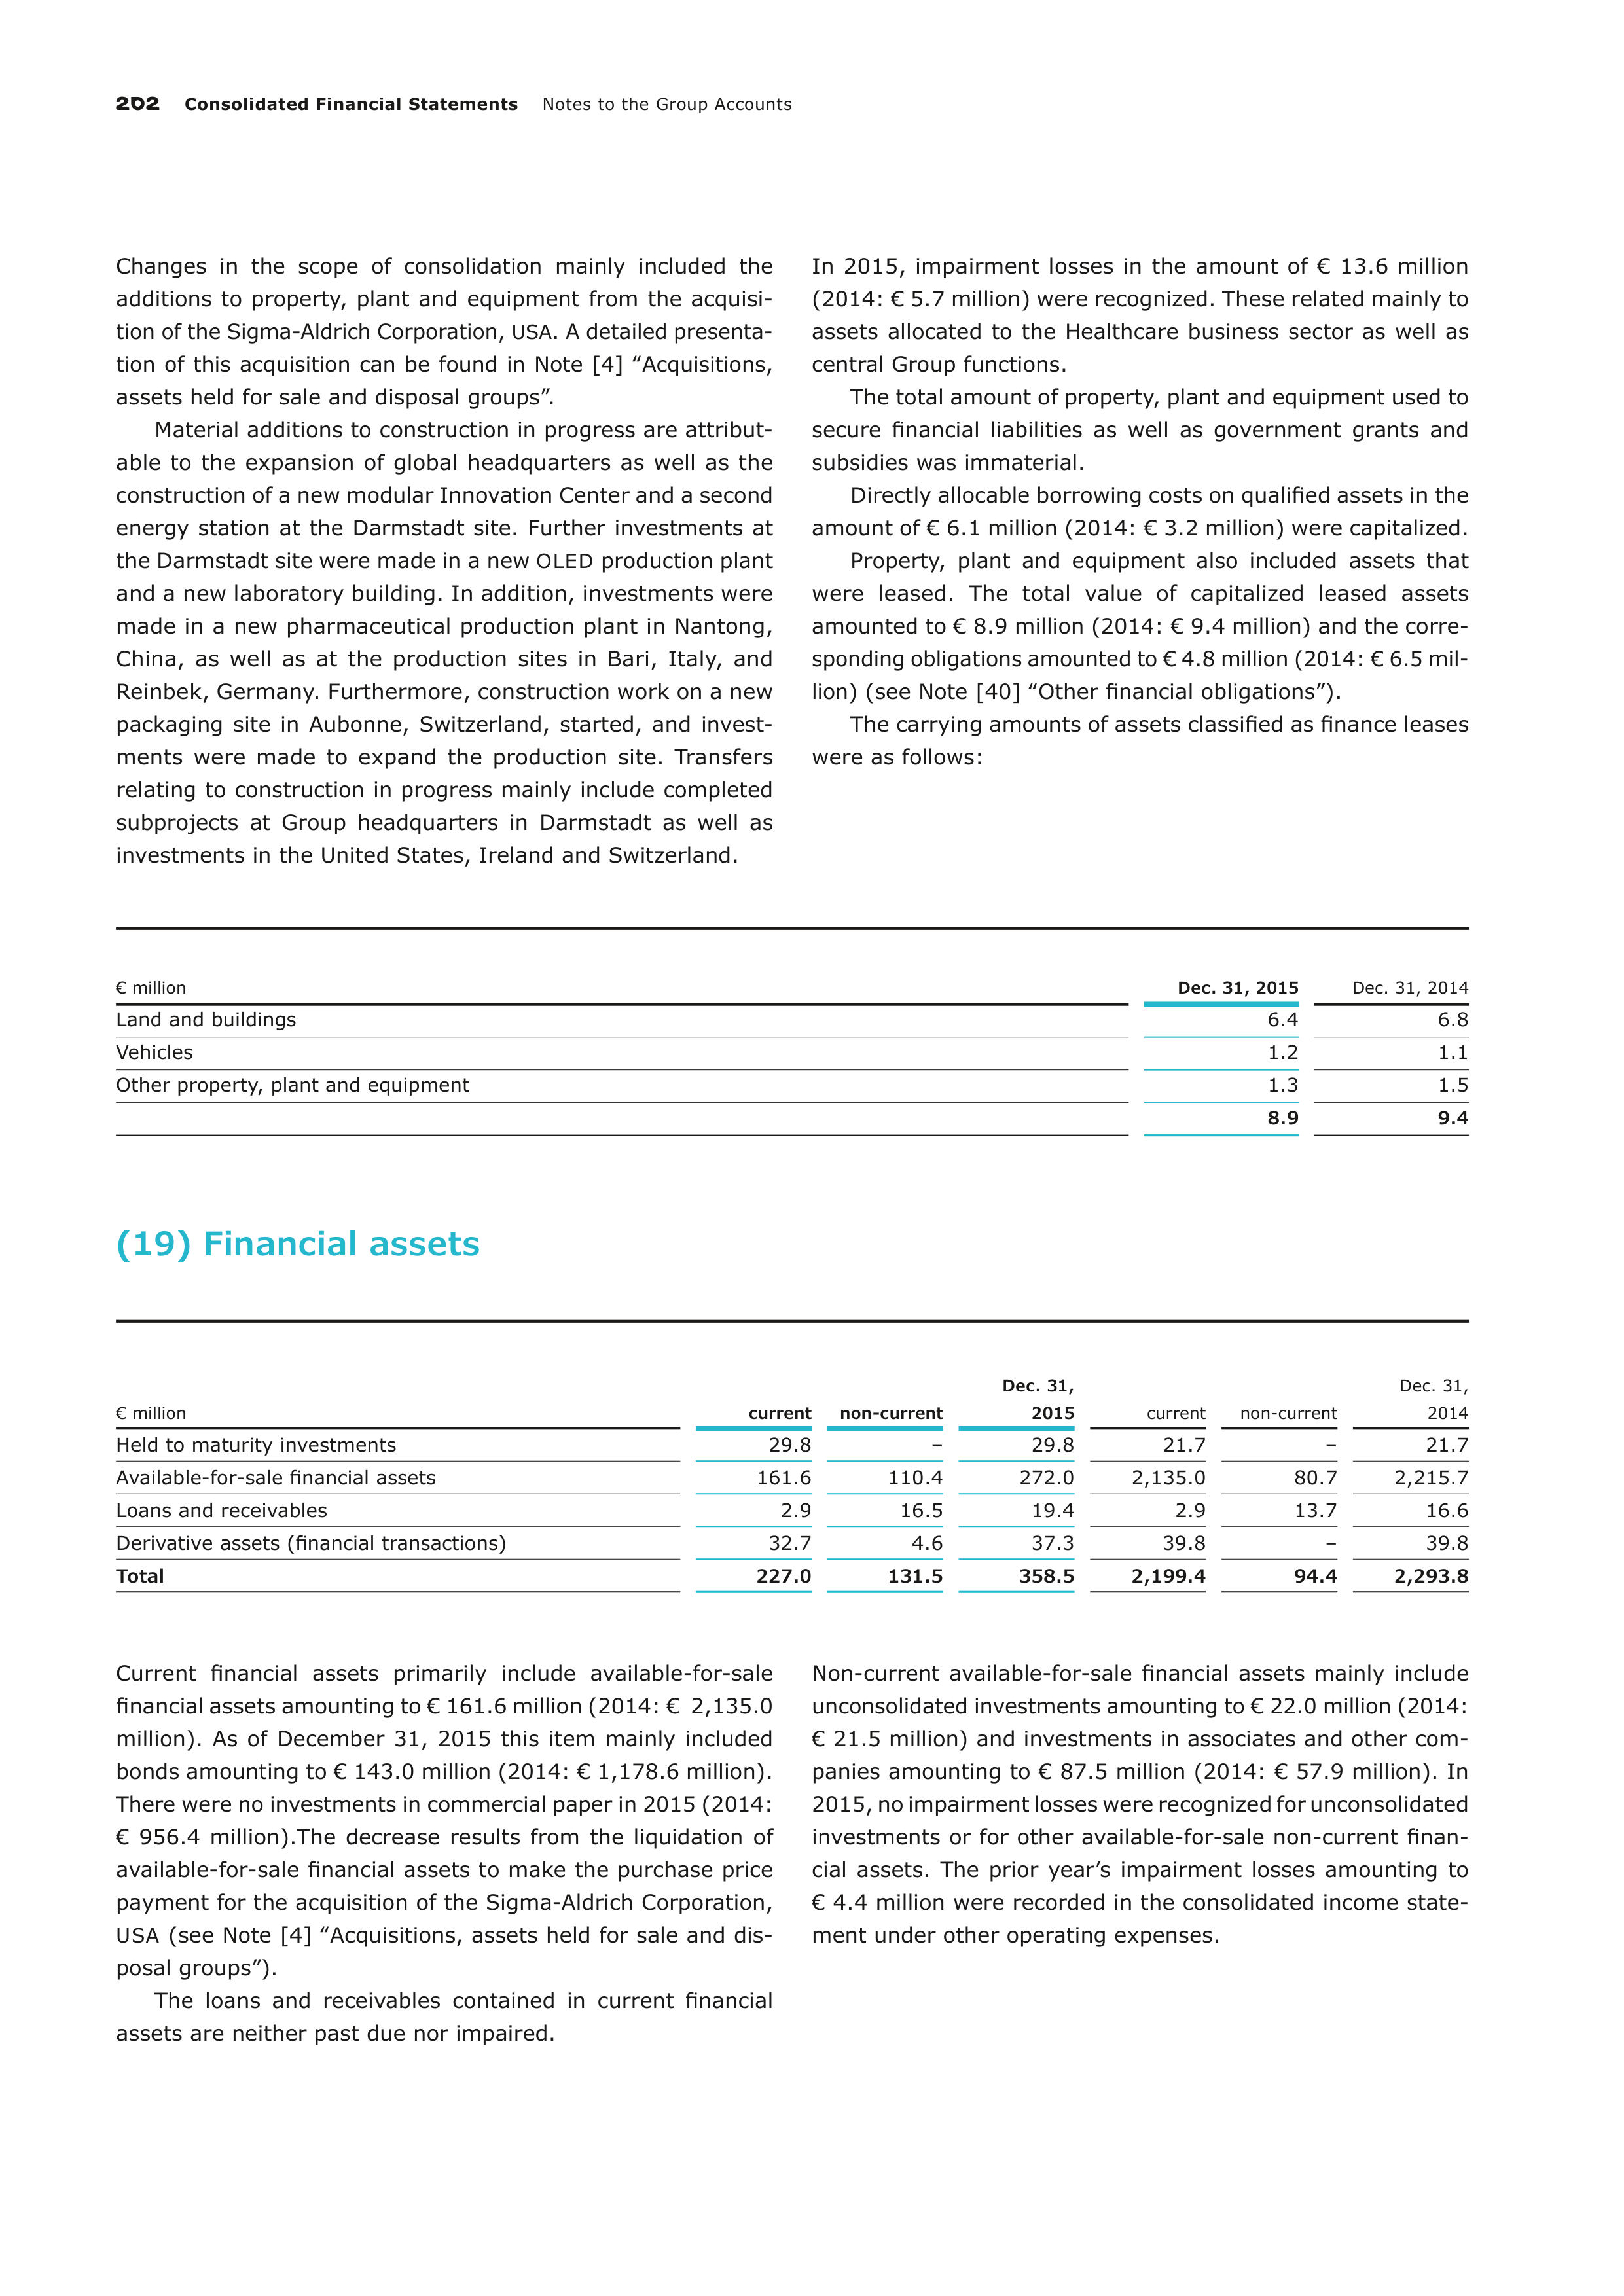
202
Consolidated Financial Statements
Notes to the Group Accounts
Changes in the scope of consolidation mainly included the
additions to property, plant and equipment from the acquisi-
tion of the Sigma-Aldrich Corporation,
USA
. A detailed presenta-
tion of this acquisition can be found in Note [4] ‟Acquisitions,
assets held for sale and disposal groups”.
Material additions to construction in progress are attribut-
able to the expansion of global headquarters as well as the
construction of a new modular Innovation Center and a second
energy station at the Darmstadt site. Further investments at
the Darmstadt site were made in a new
OLED
production plant
and a new laboratory building. In addition, investments were
made in a new pharmaceutical production plant in Nantong,
China, as well as at the production sites in Bari, Italy, and
Reinbek, Germany. Furthermore, construction work on a new
packaging site in Aubonne, Switzerland, started, and invest-
ments were made to expand the production site. Transfers
relating to construction in progress mainly include completed
subprojects at Group headquarters in Darmstadt as well as
investments in the United States, Ireland and Switzerland.
In 2015, impairment losses in the amount of € 13.6 million
(2014: € 5.7 million) were recognized. These related mainly to
assets allocated to the Healthcare business sector as well as
central Group functions.
The total amount of property, plant and equipment used to
secure financial liabilities as well as government grants and
subsidies was immaterial.
Directly allocable borrowing costs on qualified assets in the
amount of € 6.1 million (2014: € 3.2 million) were capitalized.
Property, plant and equipment also included assets that
were leased. The total value of capitalized leased assets
amounted to € 8.9 million (2014: € 9.4 million) and the corre-
sponding obligations amounted to € 4.8 million (2014: € 6.5 mil-
lion)
(see Note [40] ‟Other financial obligations”).
The carrying amounts of assets classified as finance leases
were as follows:
€ million
Dec. 31, 2015
Dec. 31, 2014
Land and buildings
6.4
6.8
Vehicles
1.2
1.1
Other property, plant and equipment
1.3
1.5
8.9
9.4
(19) Financial assets
€ million
current
non-current
Dec. 31,
2015
current
non-current
Dec. 31,
2014
Held to maturity investments
29.8
–
29.8
21.7
–
21.7
Available-for-sale financial assets
161.6
110.4
272.0
2,135.0
80.7
2,215.7
Loans and receivables
2.9
16.5
19.4
2.9
13.7
16.6
Derivative assets (financial transactions)
32.7
4.6
37.3
39.8
–
39.8
Total
227.0
131.5
358.5
2,199.4
94.4
2,293.8
Current financial assets primarily include available-for-sale
financial assets amounting to € 161.6 million (2014: € 2,135.0
million). As of December 31, 2015 this item mainly included
bonds amounting to € 143.0 million (2014: € 1,178.6 million).
There were no investments in commercial paper in 2015 (2014:
€ 956.4 million).The decrease results from the liquidation of
available-for-sale financial assets to make the purchase price
payment for the acquisition of the Sigma-Aldrich Corporation,
USA
(see Note [4] ‟Acquisitions, assets held for sale and dis-
posal groups”).
The loans and receivables contained in current financial
assets are neither past due nor impaired.
Non-current available-for-sale financial assets mainly include
unconsolidated investments amounting to € 22.0 million (2014:
€ 21.5 million) and investments in associates and other com-
panies amounting to € 87.5 million (2014: € 57.9 million). In
2015, no impairment losses were recognized for unconsolidated
investments or for other available-for-sale non-current finan-
cial assets. The prior year’s impairment losses amounting to
€ 4.4 million were recorded in the consolidated income state-
ment under other operating expenses.
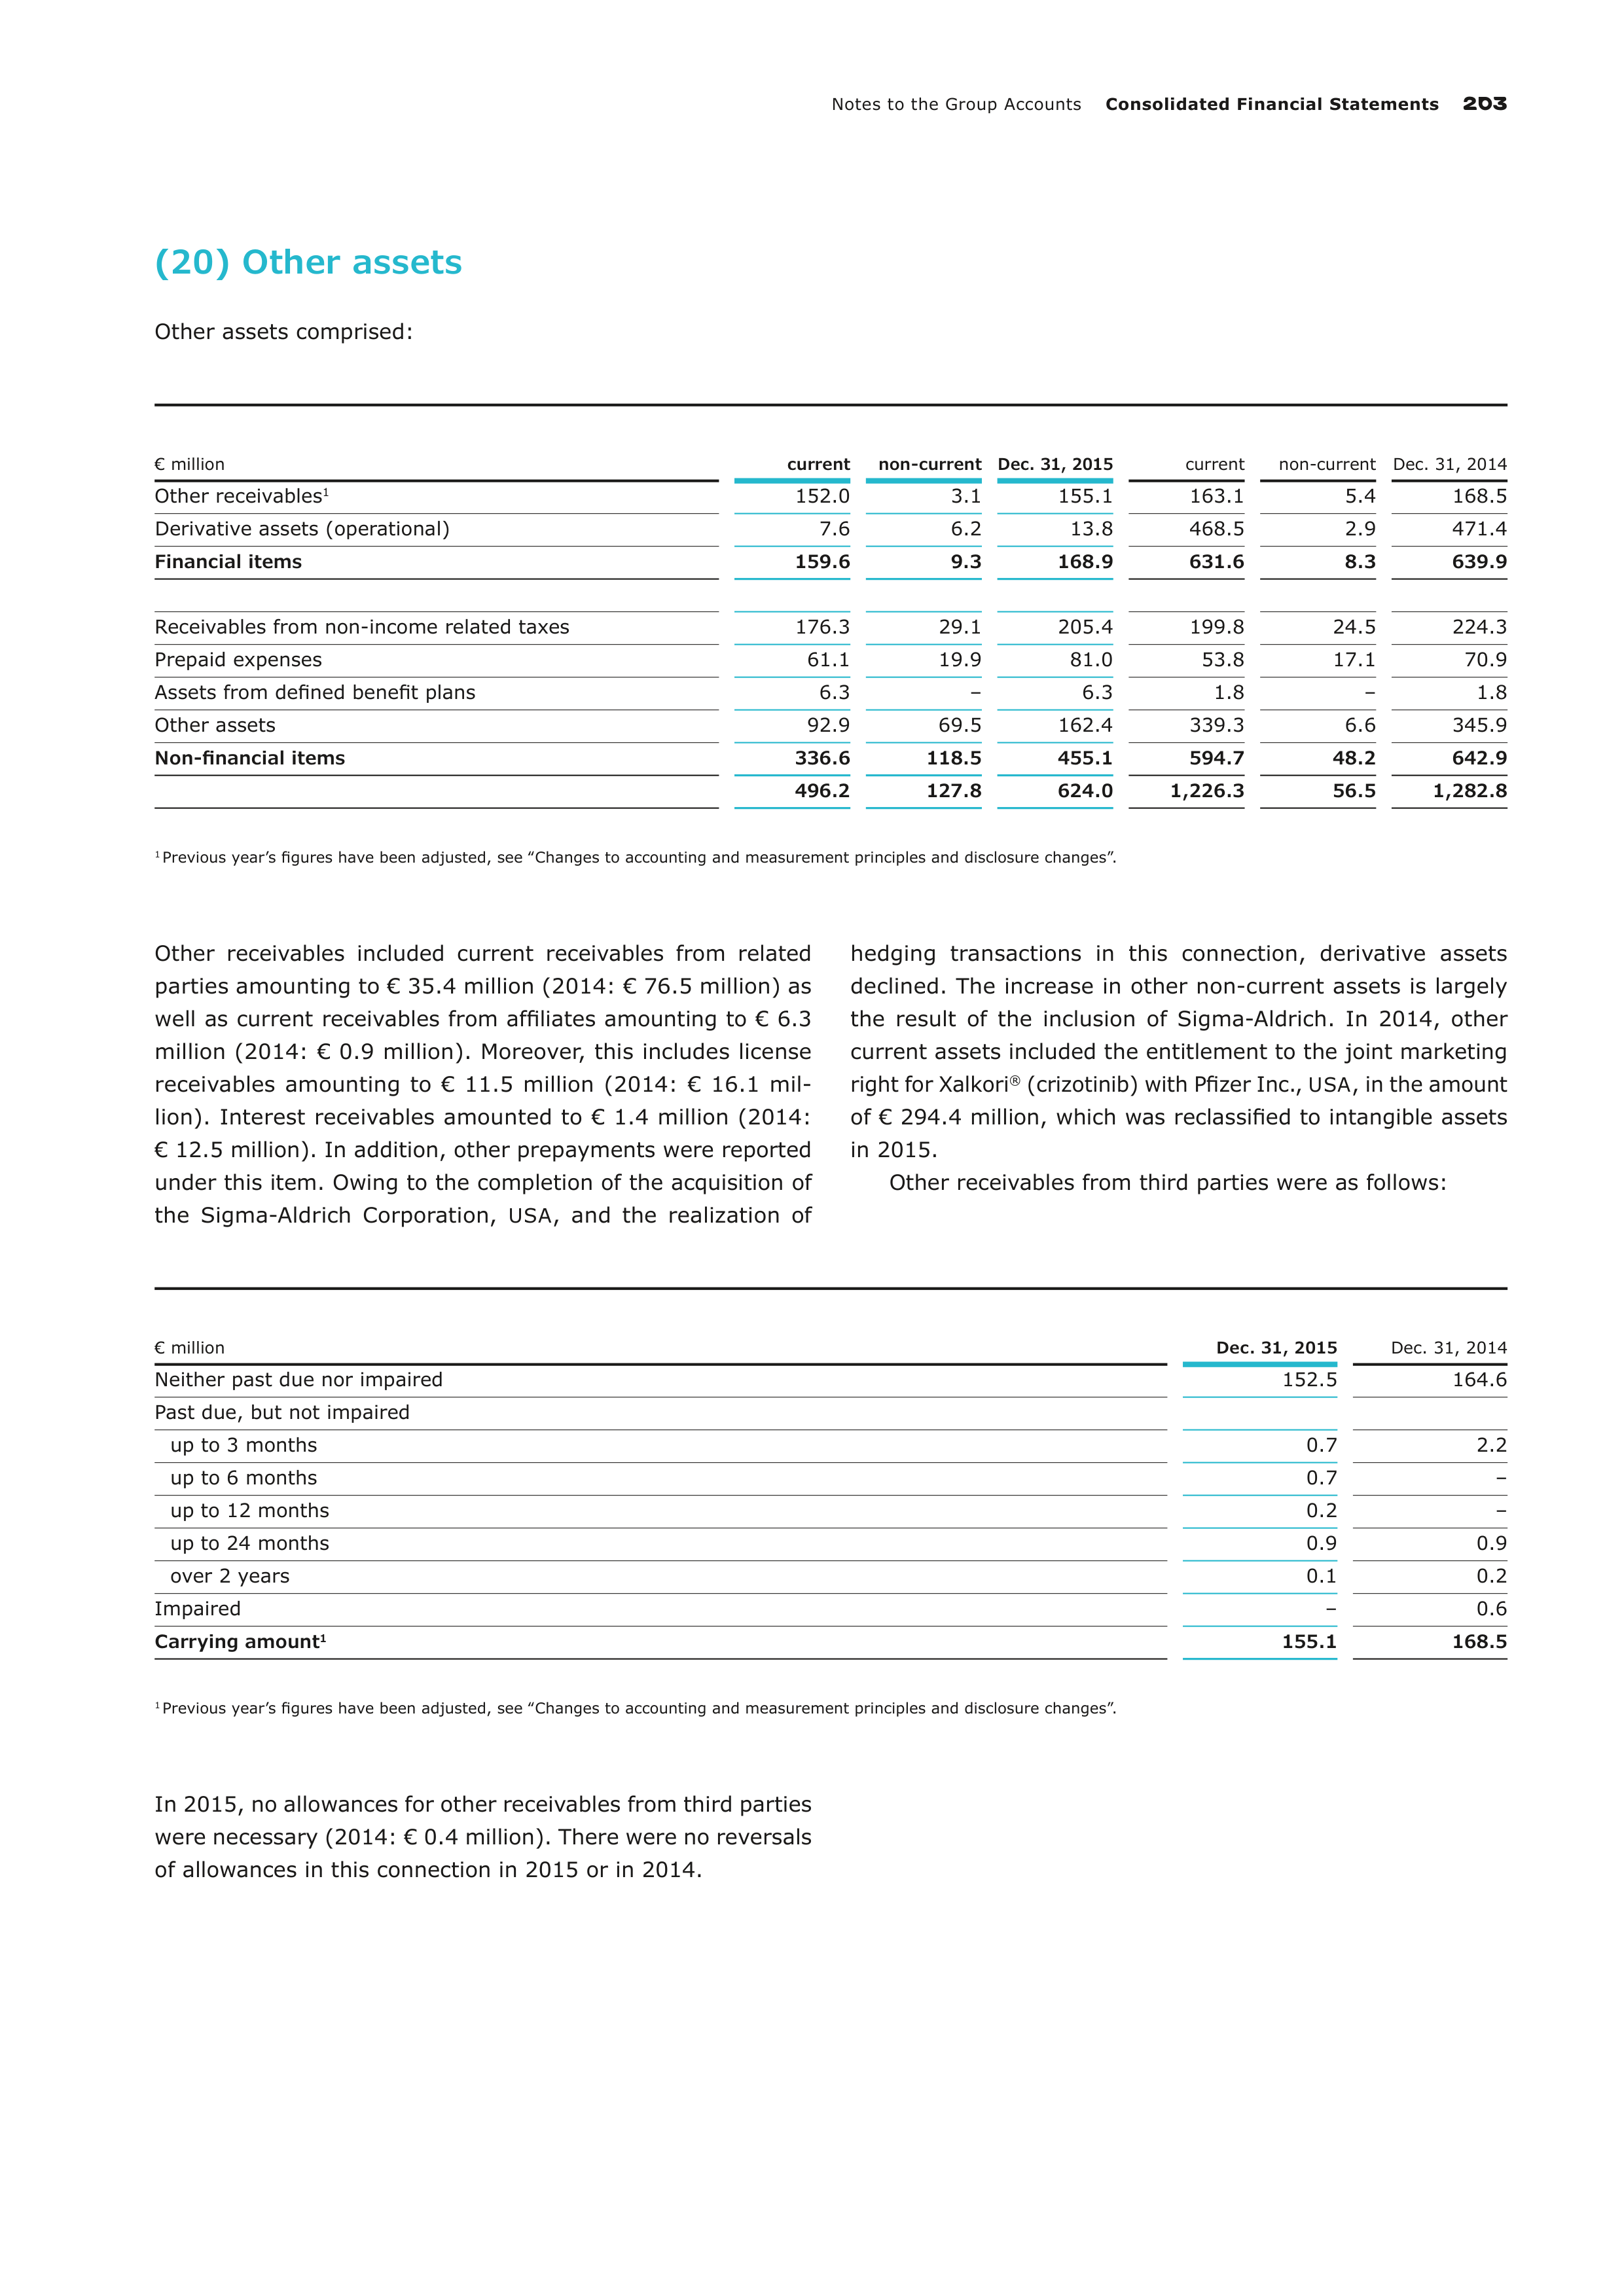
Notes to the Group Accounts
Consolidated Financial Statements
203
(20) Other assets
Other assets comprised:
€ million
current
non-current
Dec. 31, 2015
current
non-current
Dec. 31, 2014
Other receivables
1
152.0
3.1
155.1
163.1
5.4
168.5
Derivative assets (operational)
7.6
6.2
13.8
468.5
2.9
471.4
Financial items
159.6
9.3
168.9
631.6
8.3
639.9
Receivables from non-income related taxes
176.3
29.1
205.4
199.8
24.5
224.3
Prepaid expenses
61.1
19.9
81.0
53.8
17.1
70.9
Assets from defined benefit plans
6.3
–
6.3
1.8
–
1.8
Other assets
92.9
69.5
162.4
339.3
6.6
345.9
Non-financial items
336.6
118.5
455.1
594.7
48.2
642.9
496.2
127.8
624.0
1,226.3
56.5
1,282.8
1
Previous year’s figures have been adjusted, see ‟Changes to accounting and measurement principles and disclosure changes”.
Other receivables included current receivables from related
parties amounting to € 35.4 million (2014: € 76.5 million) as
well as current receivables from affiliates amounting to € 6.3
million (2014: € 0.9 million). Moreover, this includes license
receivables amounting to € 11.5 million (2014: € 16.1 mil-
lion). Interest receivables amounted to € 1.4 million (2014:
€ 12.5 million). In addition, other prepayments were reported
under this item. Owing to the completion of the acquisition of
the Sigma-Aldrich Corporation,
USA
, and the realization of
hedging transactions in this connection, derivative assets
declined. The increase in other non-current assets is largely
the result of the inclusion of Sigma-Aldrich. In 2014, other
current assets included the entitlement to the joint marketing
right for Xalkori
®
(crizotinib) with Pfizer Inc.,
USA
, in the amount
of € 294.4 million, which was reclassified to intangible assets
in 2015.
Other receivables from third parties were as follows:
€ million
Dec. 31, 2015
Dec. 31, 2014
Neither past due nor impaired
152.5
164.6
Past due, but not impaired
up to 3 months
0.7
2.2
up to 6 months
0.7
–
up to 12 months
0.2
–
up to 24 months
0.9
0.9
over 2 years
0.1
0.2
Impaired
–
0.6
Carrying amount
1
155.1
168.5
1
Previous year’s figures have been adjusted, see ‟Changes to accounting and measurement principles and disclosure changes”.
In 2015, no allowances for other receivables from third parties
were necessary (2014: € 0.4 million). There were no reversals
of allowances in this connection in 2015 or in 2014.
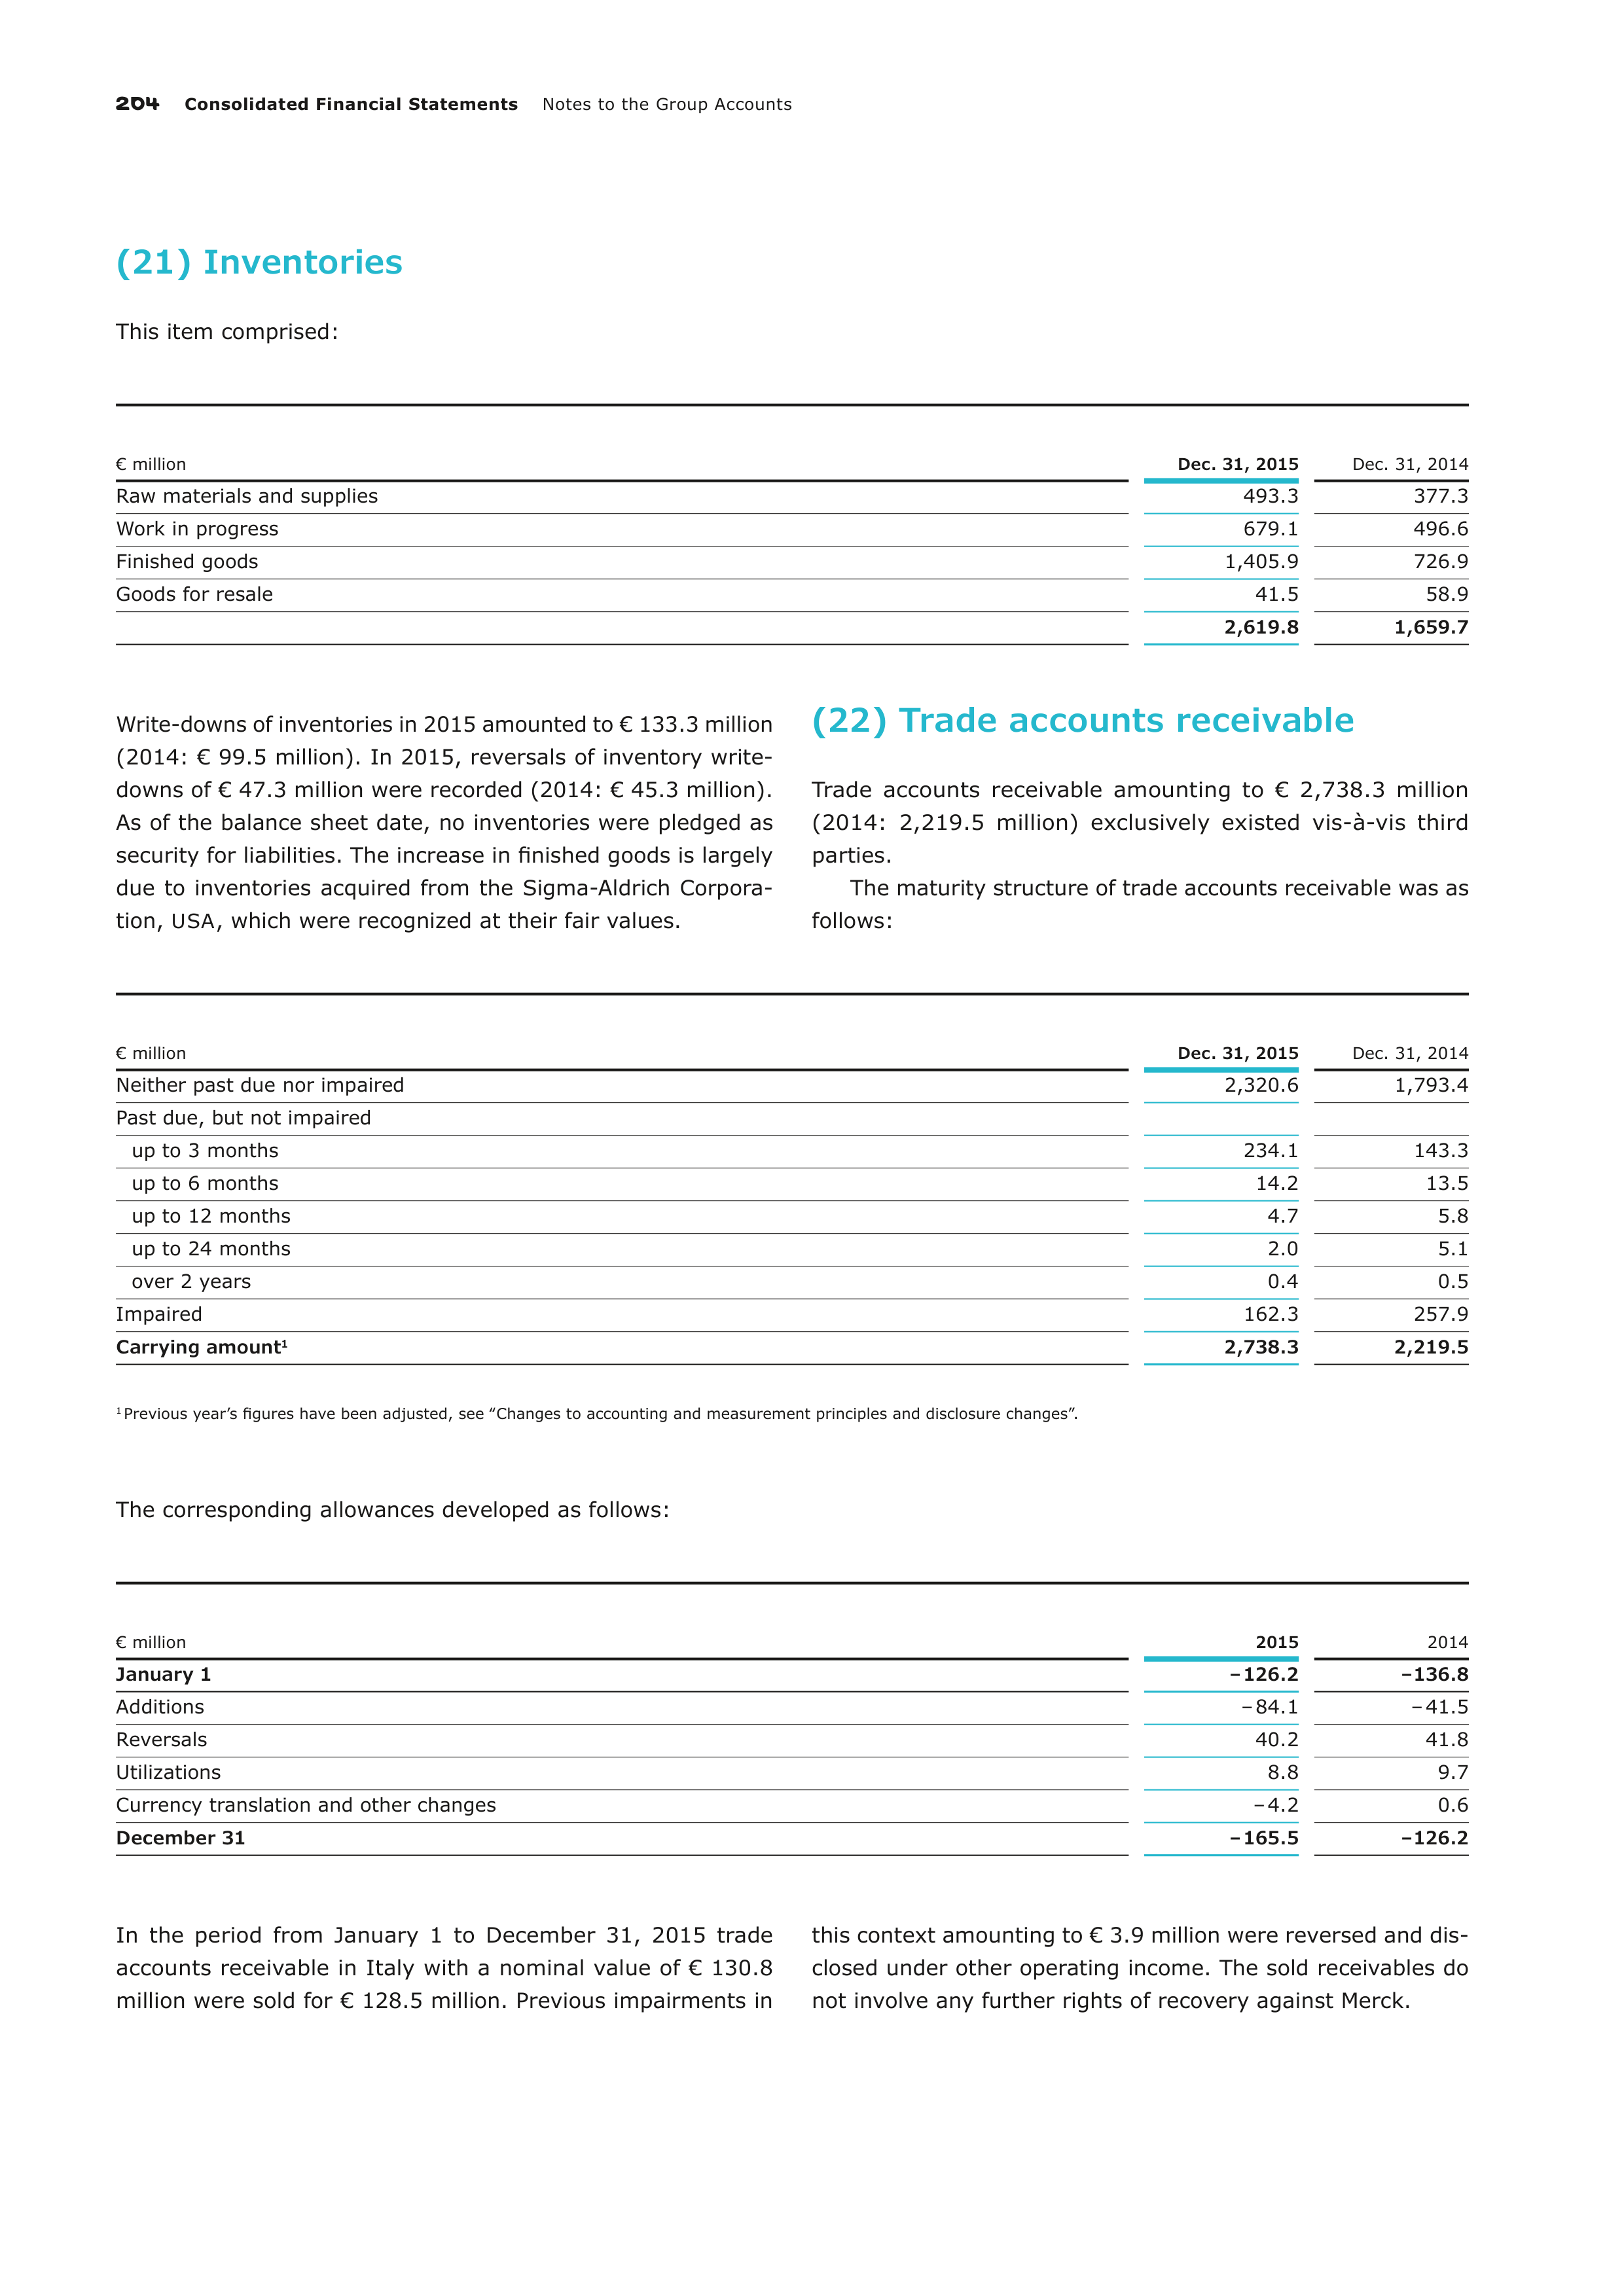
204
Consolidated Financial Statements
Notes to the Group Accounts
(21) Inventories
This item comprised:
€ million
Dec. 31, 2015
Dec. 31, 2014
Raw materials and supplies
493.3
377.3
Work in progress
679.1
496.6
Finished goods
1,405.9
726.9
Goods for resale
41.5
58.9
2,619.8
1,659.7
Write-downs of inventories in 2015 amounted to € 133.3 million
(2014: € 99.5 million). In 2015, reversals of inventory write-
downs of € 47.3 million were recorded (2014: € 45.3 million).
As of the balance sheet date, no inventories were pledged as
security for liabilities. The increase in finished goods is largely
due to inventories acquired from the Sigma-Aldrich Corpora-
tion,
USA
, which were recognized at their fair values.
(22) Trade accounts receivable
Trade accounts receivable amounting to € 2,738.3 million
(2014: 2,219.5 million) exclusively existed vis-à-vis third
par
ties.
The maturity structure of trade accounts receivable was as
follows:
€ million
Dec. 31, 2015
Dec. 31, 2014
Neither past due nor impaired
2,320.6
1,793.4
Past due, but not impaired
up to 3 months
234.1
143.3
up to 6 months
14.2
13.5
up to 12 months
4.7
5.8
up to 24 months
2.0
5.1
over 2 years
0.4
0.5
Impaired
162.3
257.9
Carrying amount
1
2,738.3
2,219.5
1
Previous year’s figures have been adjusted, see ‟Changes to accounting and measurement principles and disclosure changes”.
The corresponding allowances developed as follows:
€ million
2015
2014
January 1
– 126.2
– 136.8
Additions
– 84.1
– 41.5
Reversals
40.2
41.8
Utilizations
8.8
9.7
Currency translation and other changes
– 4.2
0.6
December 31
– 165.5
– 126.2
In the period from January 1 to December 31, 2015 trade
accounts receivable in Italy with a nominal value of € 130.8
million were sold for € 128.5 million. Previous impairments in
this context amounting to € 3.9 million were reversed and dis-
closed under other operating income. The sold receivables do
not involve any further rights of recovery against Merck.
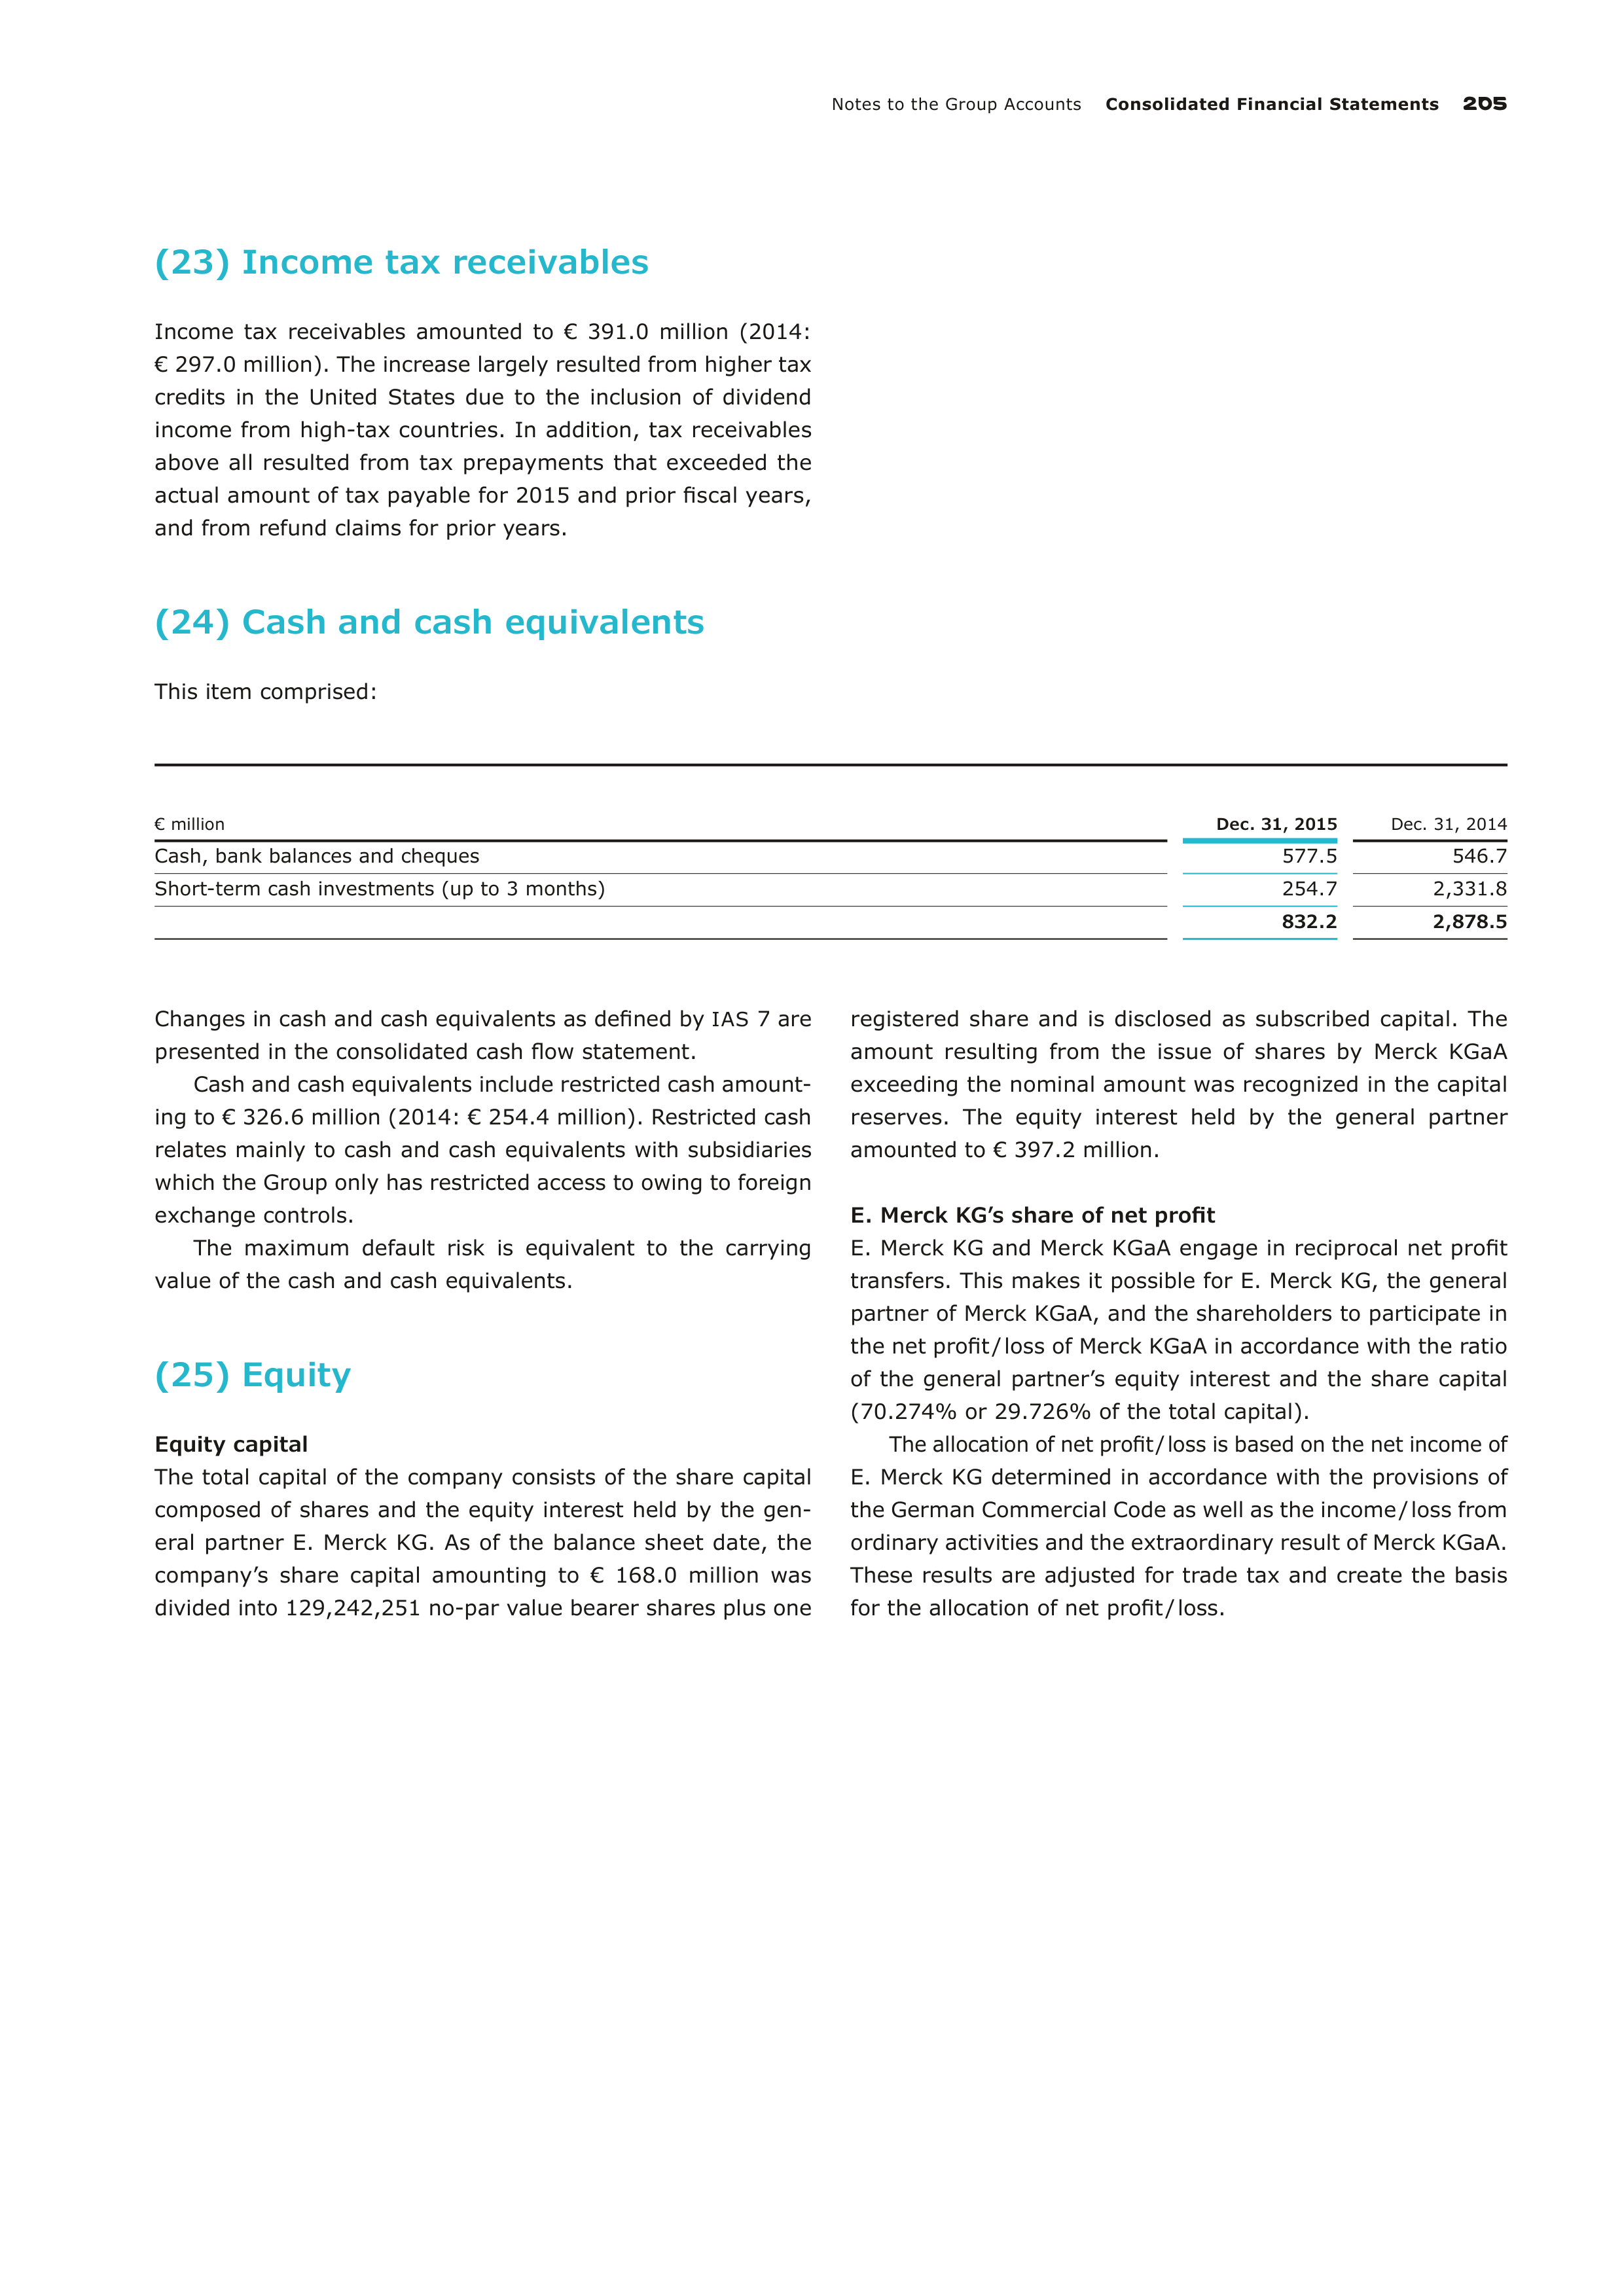
Notes to the Group Accounts
Consolidated Financial Statements
205
(23) Income tax receivables
Income tax receivables amounted to € 391.0 million (2014:
€ 297.0 million). The increase largely resulted from higher tax
credits in the United States due to the inclusion of dividend
income from high-tax countries. In addition, tax receivables
above all resulted from tax prepayments that exceeded the
actual amount of tax payable for 2015 and prior fiscal years,
and from refund claims for prior years.
(24) Cash and cash equivalents
This item comprised:
€ million
Dec. 31, 2015
Dec. 31, 2014
Cash, bank balances and cheques
577.5
546.7
Short-term cash investments (up to 3 months)
254.7
2,331.8
832.2
2,878.5
Changes in cash and cash equivalents as defined by
IAS
7 are
presented in the consolidated cash flow statement.
Cash and cash equivalents include restricted cash amount-
ing to € 326.6 million (2014: € 254.4 million). Restricted cash
relates mainly to cash and cash equivalents with subsidiaries
which the Group only has restricted access to owing to foreign
exchange controls.
The maximum default risk is equivalent to the carrying
value of the cash and cash equivalents.
(25) Equity
Equity capital
The total capital of the company consists of the share capital
composed of shares and the equity interest held by the gen-
eral partner E. Merck KG. As of the balance sheet date, the
company’s share capital amounting to € 168.0 million was
divided into 129,242,251 no-par value bearer shares plus one
registered share and is disclosed as subscribed capital. The
amount resulting from the issue of shares by Merck KGaA
exceeding the nominal amount was recognized in the capital
reserves. The equity interest held by the general partner
amounted to € 397.2 million.
E. Merck KG’s share of net profit
E. Merck KG and Merck KGaA engage in reciprocal net profit
transfers. This makes it possible for E. Merck KG, the general
partner of Merck KGaA, and the shareholders to participate in
the net profit / loss of Merck KGaA in accordance with the ratio
of the general partner’s equity interest and the share capital
(70.274% or 29.726% of the total capital).
The allocation of net profit / loss is based on the net income of
E. Merck KG determined in accordance with the provisions of
the German Commercial Code as well as the income / loss from
ordinary activities and the extraordinary result of Merck KGaA.
These results are adjusted for trade tax and create the basis
for the allocation of net profit / loss.
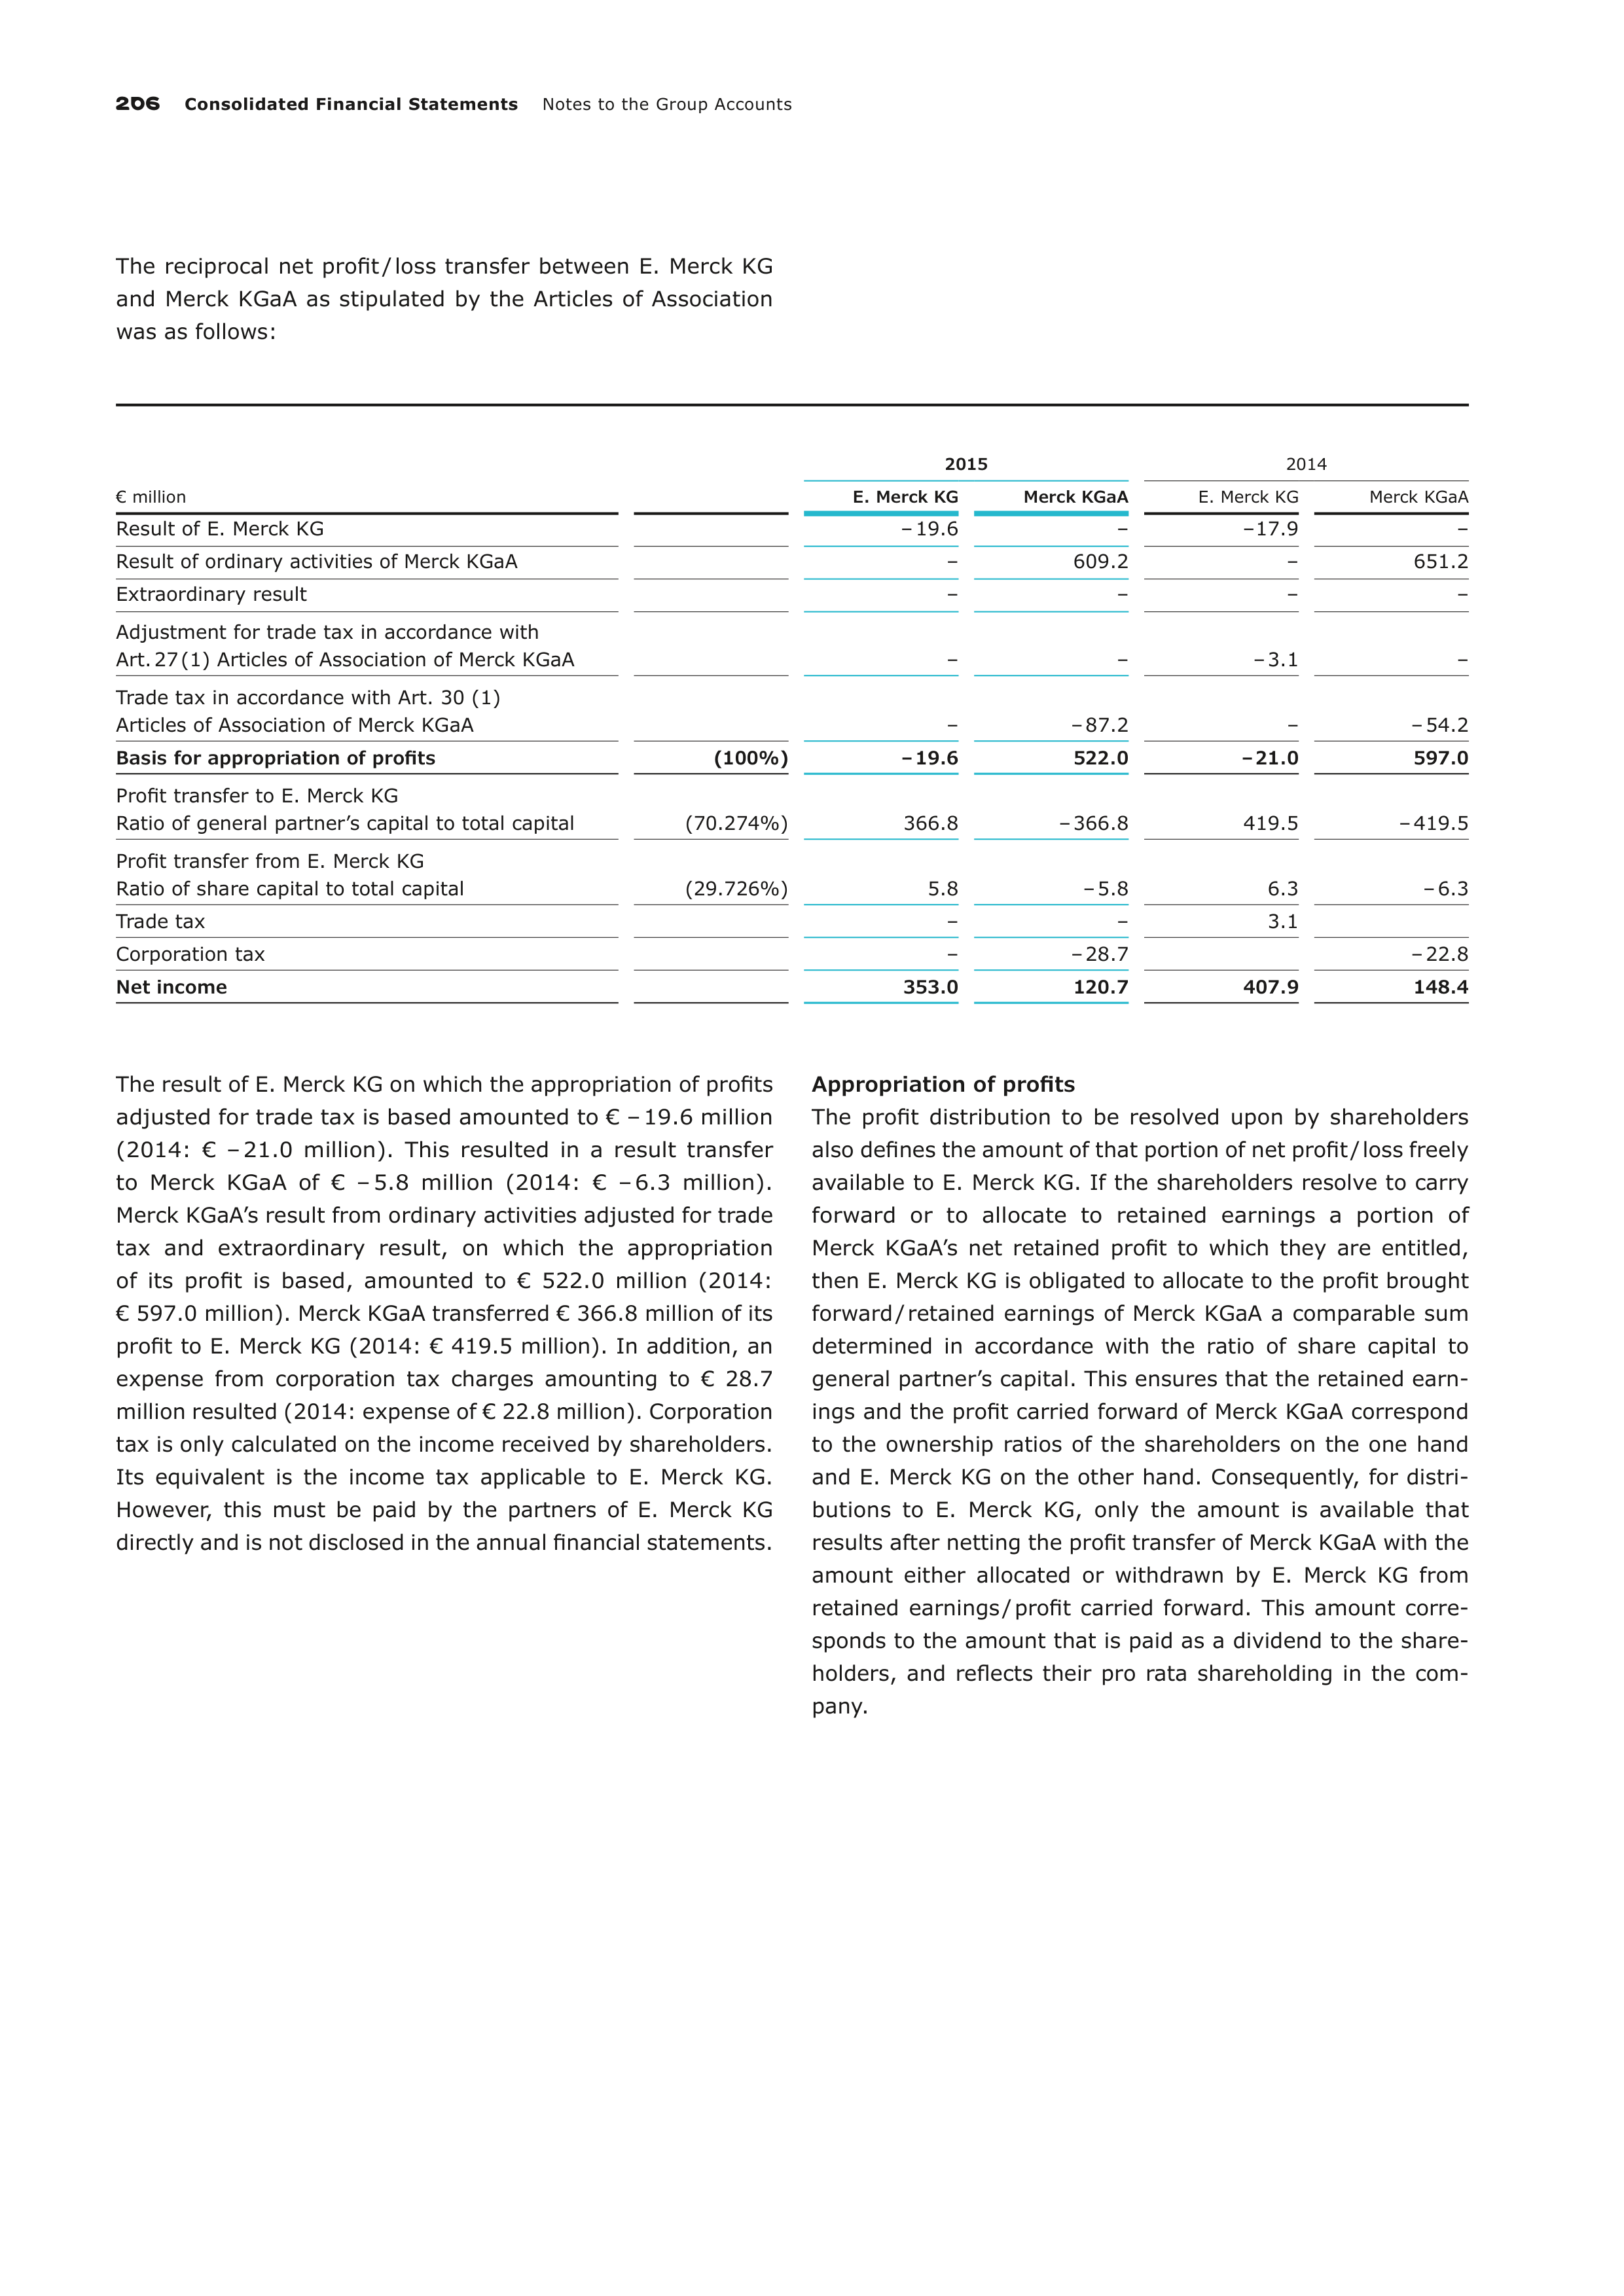
206
Consolidated Financial Statements
Notes to the Group Accounts
The reciprocal net profit / loss transfer between E. Merck KG
and Merck KGaA as stipulated by the Articles of Association
was as follows:
€ million
2015
2014
E. Merck KG
Merck KGaA
E. Merck KG
Merck KGaA
Result of E. Merck KG
– 19.6
–
– 17.9
–
Result of ordinary activities of Merck KGaA
–
609.2
–
651.2
Extraordinary result
–
–
–
–
Adjustment for trade tax in accordance with
Art. 27 (1) Articles of Association of Merck KGaA
–
–
– 3.1
–
Trade tax in accordance with Art. 30 (1)
Articles of Association of Merck KGaA
–
– 87.2
–
– 54.2
Basis for appropriation of profits
(100%)
– 19.6
522.0
– 21.0
597.0
Profit transfer to E. Merck KG
Ratio of general partner’s capital to total capital
(70.274%)
366.8
– 366.8
419.5
– 419.5
Profit transfer from E. Merck KG
Ratio of share capital to total capital
(29.726%)
5.8
– 5.8
6.3
– 6.3
Trade tax
–
–
3.1
Corporation tax
–
– 28.7
– 22.8
Net income
353.0
120.7
407.9
148.4
The result of E. Merck KG on which the appropriation of profits
adjusted for trade tax is based amounted to € – 19.6 million
(2014: € – 21.0 million). This resulted in a result transfer
to Merck KGaA of € – 5.8 million (2014: € – 6.3 million).
Merck KGaA’s result from ordinary activities adjusted for trade
tax and extraordinary result, on which the appropriation
of its profit is based, amounted to € 522.0 million (2014:
€ 597.0 million). Merck KGaA transferred € 366.8 million of its
profit to E. Merck KG (2014: € 419.5 million). In addition, an
expense from corporation tax charges amounting to € 28.7
million resulted (2014: expense of € 22.8 million). Corporation
tax is only calculated on the income received by shareholders.
Its equivalent is the income tax applicable to E. Merck KG.
However, this must be paid by the partners of E. Merck KG
directly and is not disclosed in the annual financial statements.
Appropriation of profits
The profit distribution to be resolved upon by shareholders
also defines the amount of that portion of net profit / loss freely
available to E. Merck KG. If the shareholders resolve to carry
forward or to allocate to retained earnings a portion of
Merck KGaA’s net retained profit to which they are entitled,
then E. Merck KG is obligated to allocate to the profit brought
forward / retained earnings of Merck KGaA a comparable sum
determined in accordance with the ratio of share capital to
general partner’s capital. This ensures that the retained earn-
ings and the profit carried forward of Merck KGaA correspond
to the ownership ratios of the shareholders on the one hand
and E. Merck KG on the other hand. Consequently, for distri-
butions to E. Merck KG, only the amount is available that
results after netting the profit transfer of Merck KGaA with the
amount either allocated or withdrawn by E. Merck KG from
retained earnings / profit carried forward. This amount corre-
sponds to the amount that is paid as a dividend to the share-
holders, and reflects their pro rata shareholding in the com-
pany.
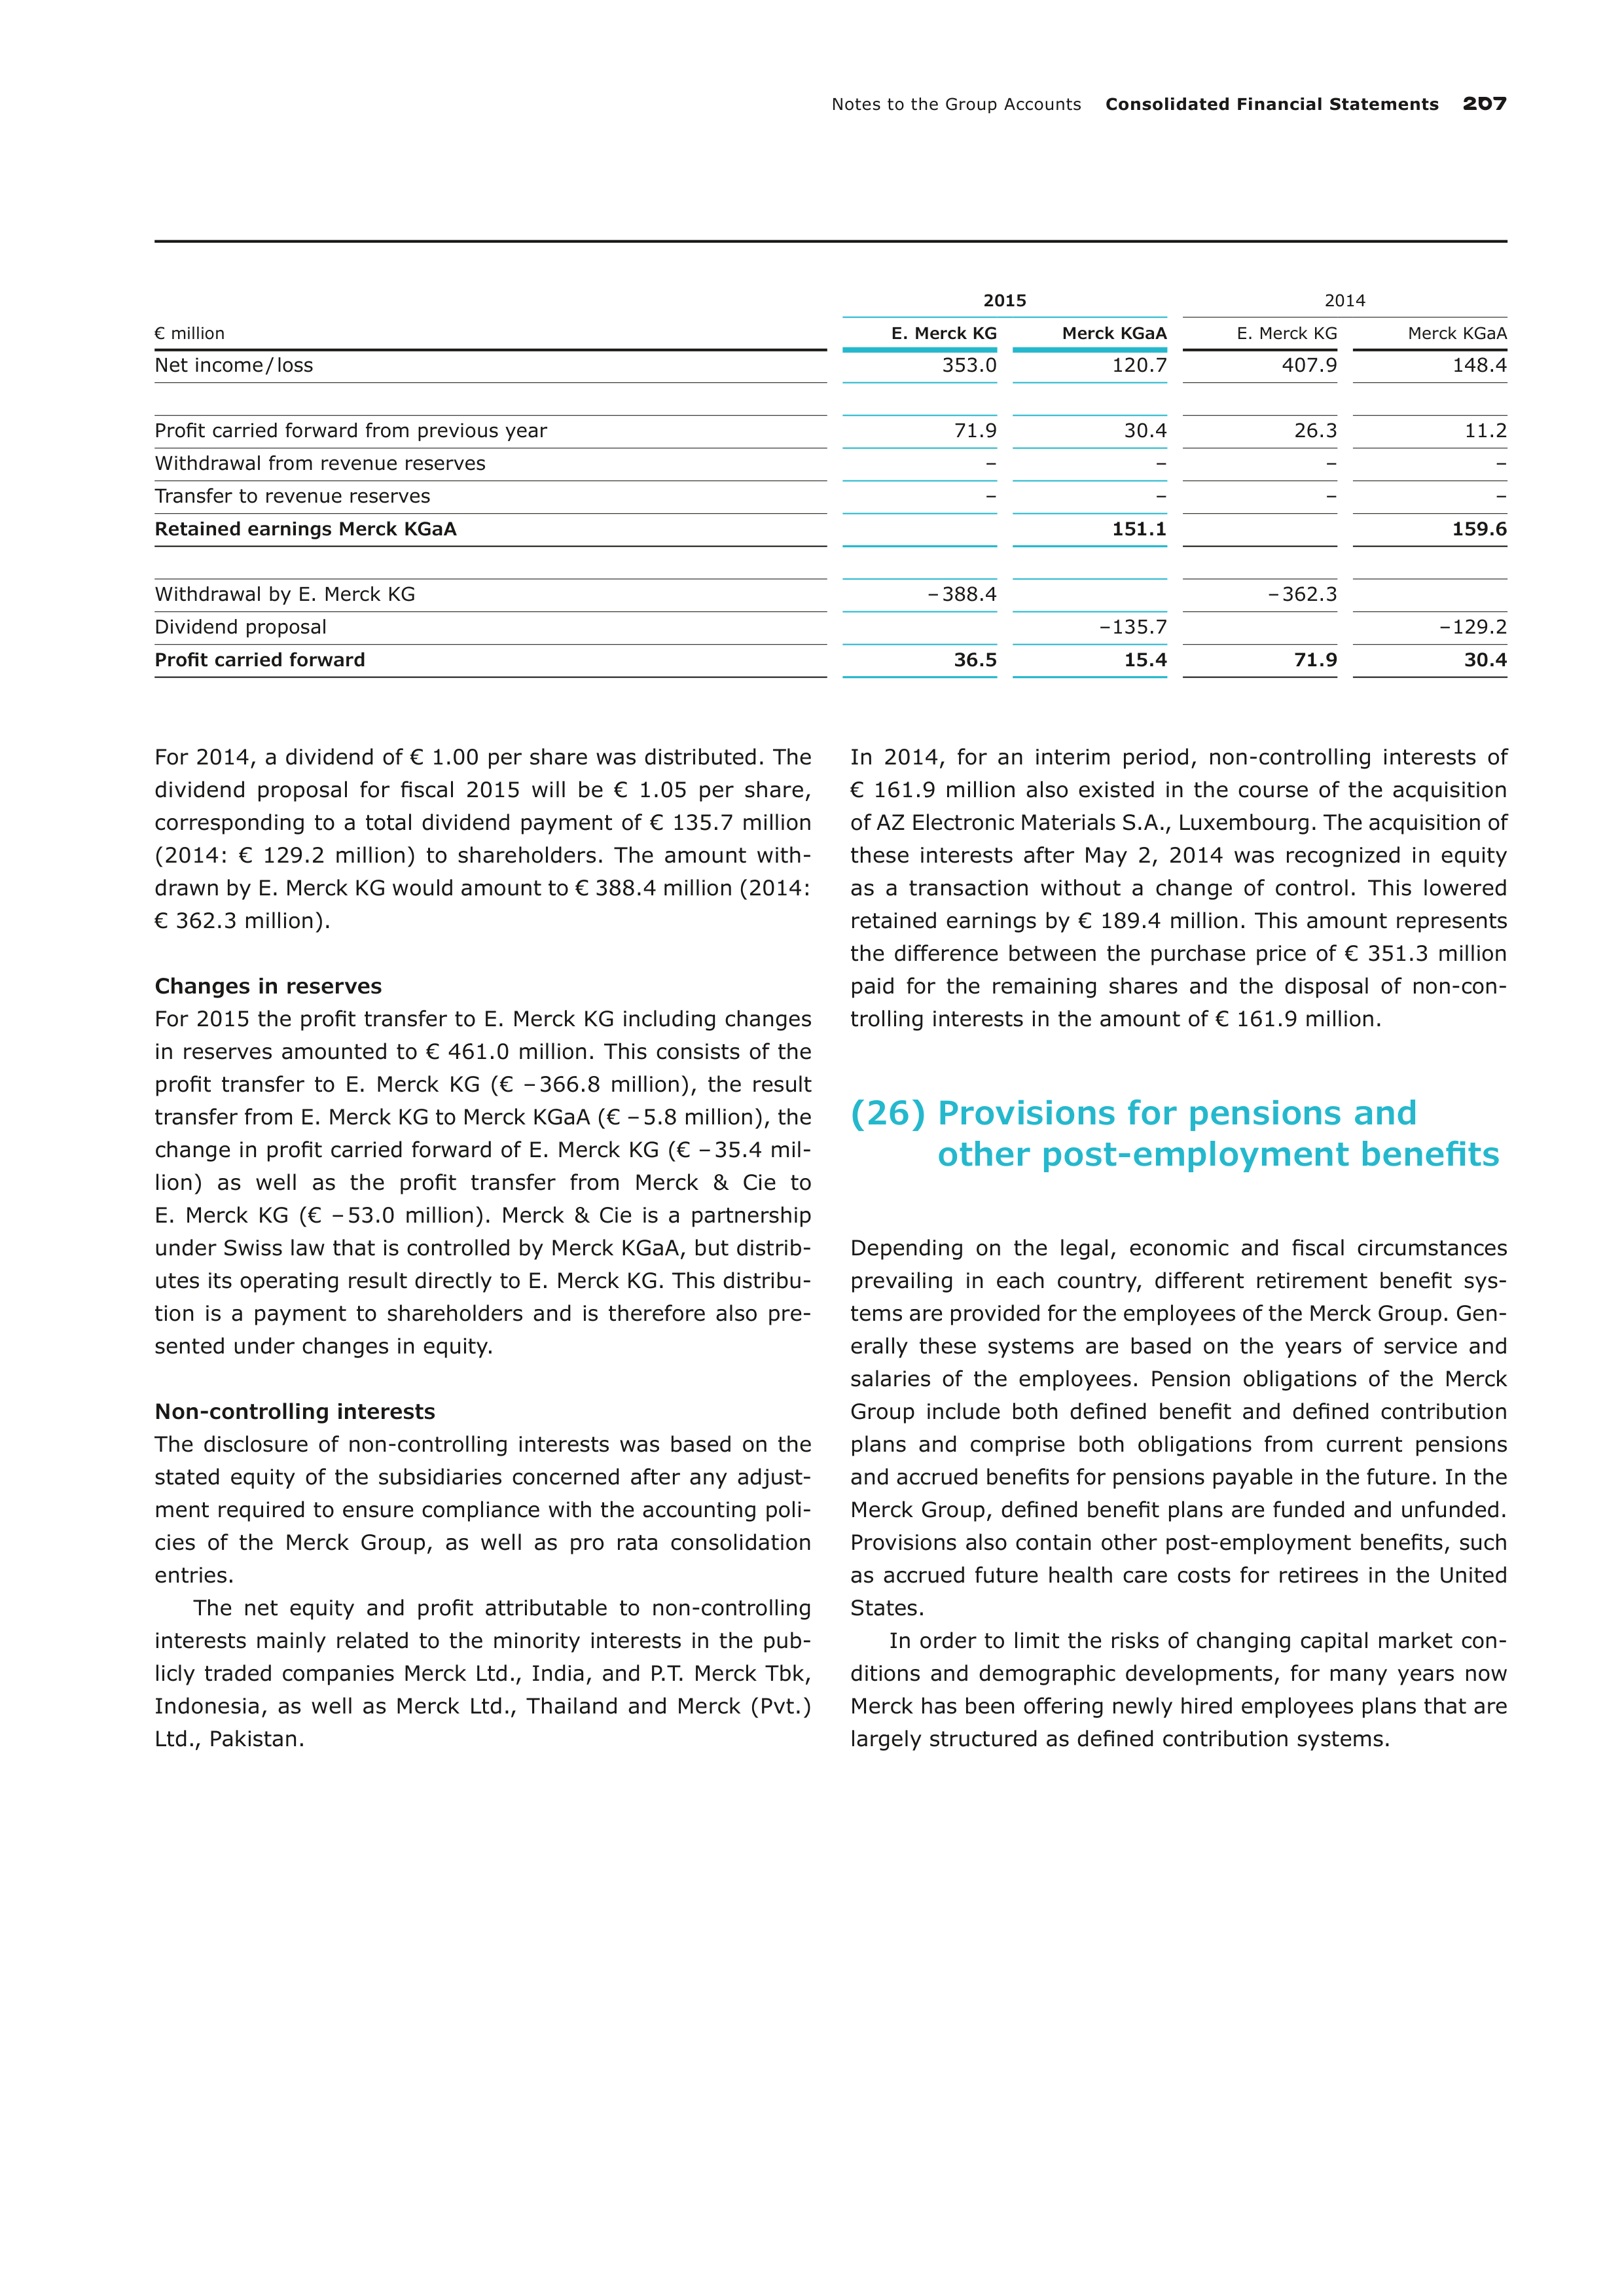
Notes to the Group Accounts
Consolidated Financial Statements
207
€ million
2015
2014
E. Merck KG
Merck KGaA
E. Merck KG
Merck KGaA
Net income / loss
353.0
120.7
407.9
148.4
Profit carried forward from previous year
71.9
30.4
26.3
11.2
Withdrawal from revenue reserves
–
–
–
–
Transfer to revenue reserves
–
–
–
–
Retained earnings Merck KGaA
151.1
159.6
Withdrawal by E. Merck KG
– 388.4
– 362.3
Dividend proposal
– 135.7
– 129.2
Profit carried forward
36.5
15.4
71.9
30.4
For 2014, a dividend of € 1.00 per share was distributed. The
dividend proposal for fiscal 2015 will be € 1.05 per share,
cor
responding to a total dividend payment of € 135.7 million
(2014: € 129.2 million) to shareholders. The amount with-
drawn by E. Merck KG would amount to € 388.4 million (2014:
€ 362.3 million).
Changes in reserves
For 2015 the profit transfer to E. Merck KG including changes
in reserves amounted to € 461.0 million. This consists of the
profit transfer to E. Merck KG (€ – 366.8 million), the result
transfer from E. Merck KG to Merck KGaA (€ – 5.8 million), the
change in profit carried forward of E. Merck KG (€ – 35.4 mil-
lion) as well as the profit transfer from Merck & Cie to
E. Merck KG (€ – 53.0 million). Merck & Cie is a partnership
under Swiss law that is controlled by Merck KGaA, but distrib-
utes its operating result directly to E. Merck KG. This distribu-
tion is a payment to shareholders and is therefore also pre-
sented under changes in equity.
Non-controlling interests
The disclosure of non-controlling interests was based on the
stated equity of the subsidiaries concerned after any adjust-
ment required to ensure compliance with the accounting poli-
cies of the Merck Group, as well as pro rata consolidation
entries.
The net equity and profit attributable to non-controlling
interests mainly related to the minority interests in the pub-
licly traded companies Merck Ltd., India, and P.T. Merck Tbk,
Indonesia, as well as Merck Ltd., Thailand and Merck (Pvt.)
Ltd., Pakistan.
In 2014, for an interim period, non-controlling interests of
€ 161.9 million also existed in the course of the acquisition
of AZ Electronic Materials S.A., Luxembourg. The acquisition of
these interests after May 2, 2014 was recognized in equity
as a transaction without a change of control. This lowered
retained earnings by € 189.4 million. This amount represents
the difference between the purchase price of € 351.3 million
paid for the remaining shares and the disposal of non-con-
trolling interests in the amount of € 161.9 million.
(26) Provisions for pensions and
other post-employment benefits
Depending on the legal, economic and fiscal circumstances
prevailing in each country, different retirement benefit sys-
tems are provided for the employees of the Merck Group. Gen-
erally these systems are based on the years of service and
salaries of the employees. Pension obligations of the Merck
Group include both defined benefit and defined contribution
plans and comprise both obligations from current pensions
and accrued benefits for pensions payable in the future. In the
Merck Group, defined benefit plans are funded and unfunded.
Provisions also contain other post-employment benefits, such
as accrued future health care costs for retirees in the United
States.
In order to limit the risks of changing capital market con-
ditions and demographic developments, for many years now
Merck has been offering newly hired employees plans that are
largely structured as defined contribution systems.
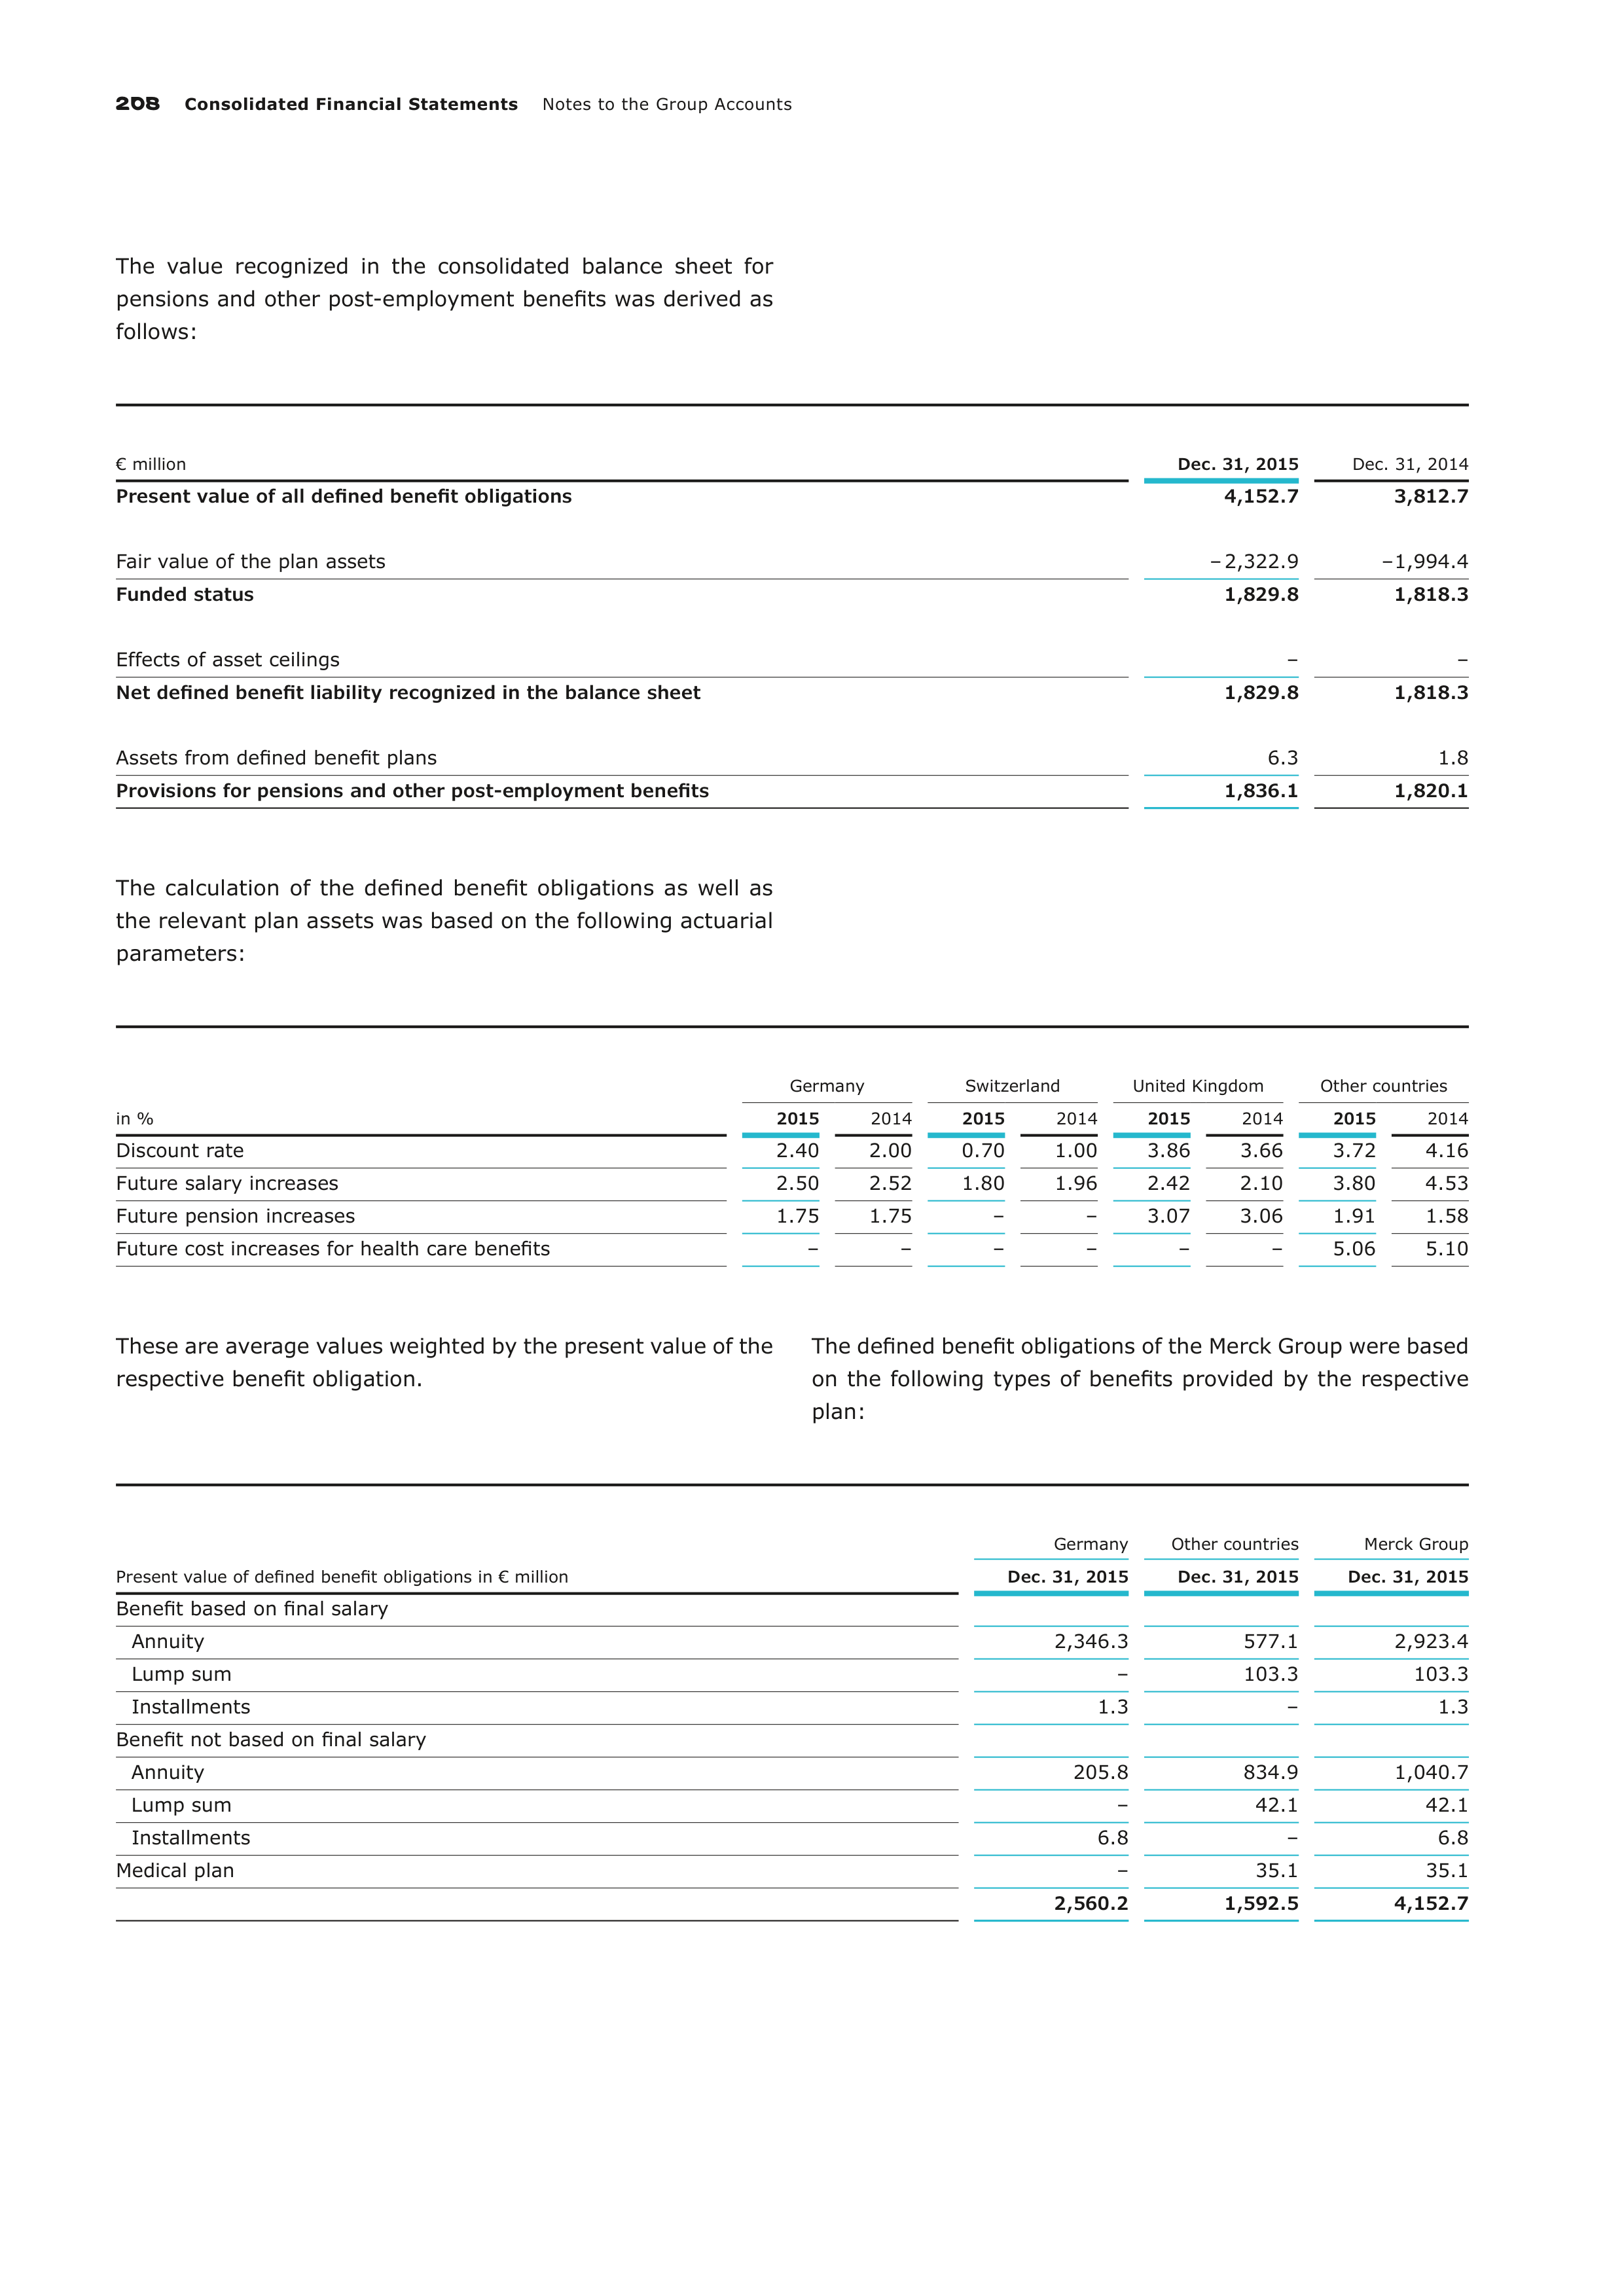
208
Consolidated Financial Statements
Notes to the Group Accounts
The value recognized in the consolidated balance sheet for
pensions and other post-employment benefits was derived as
follows:
€ million
Dec. 31, 2015
Dec. 31, 2014
Present value of all defined benefit obligations
4,152.7
3,812.7
Fair value of the plan assets
– 2,322.9
– 1,994.4
Funded status
1,829.8
1,818.3
Effects of asset ceilings
–
–
Net defined benefit liability recognized in the balance sheet
1,829.8
1,818.3
Assets from defined benefit plans
6.3
1.8
Provisions for pensions and other post-employment benefits
1,836.1
1,820.1
The calculation of the defined benefit obligations as well as
the relevant plan assets was based on the following actuarial
parameters:
in %
Germany
Switzerland
United Kingdom
Other countries
2015
2014
2015
2014
2015
2014
2015
2014
Discount rate
2.40
2.00
0.70
1.00
3.86
3.66
3.72
4.16
Future salary increases
2.50
2.52
1.80
1.96
2.42
2.10
3.80
4.53
Future pension increases
1.75
1.75
–
–
3.07
3.06
1.91
1.58
Future cost increases for health care benefits
–
–
–
–
–
–
5.06
5.10
These are average values weighted by the present value of the
respective benefit obligation.
The defined benefit obligations of the Merck Group were based
on the following types of benefits provided by the respective
plan:
Present value of defined benefit obligations in € million
Germany
Other countries
Merck Group
Dec. 31, 2015
Dec. 31, 2015
Dec. 31, 2015
Benefit based on final salary
Annuity
2,346.3
577.1
2,923.4
Lump sum
–
103.3
103.3
Installments
1.3
–
1.3
Benefit not based on final salary
Annuity
205.8
834.9
1,040.7
Lump sum
–
42.1
42.1
Installments
6.8
–
6.8
Medical plan
–
35.1
35.1
2,560.2
1,592.5
4,152.7
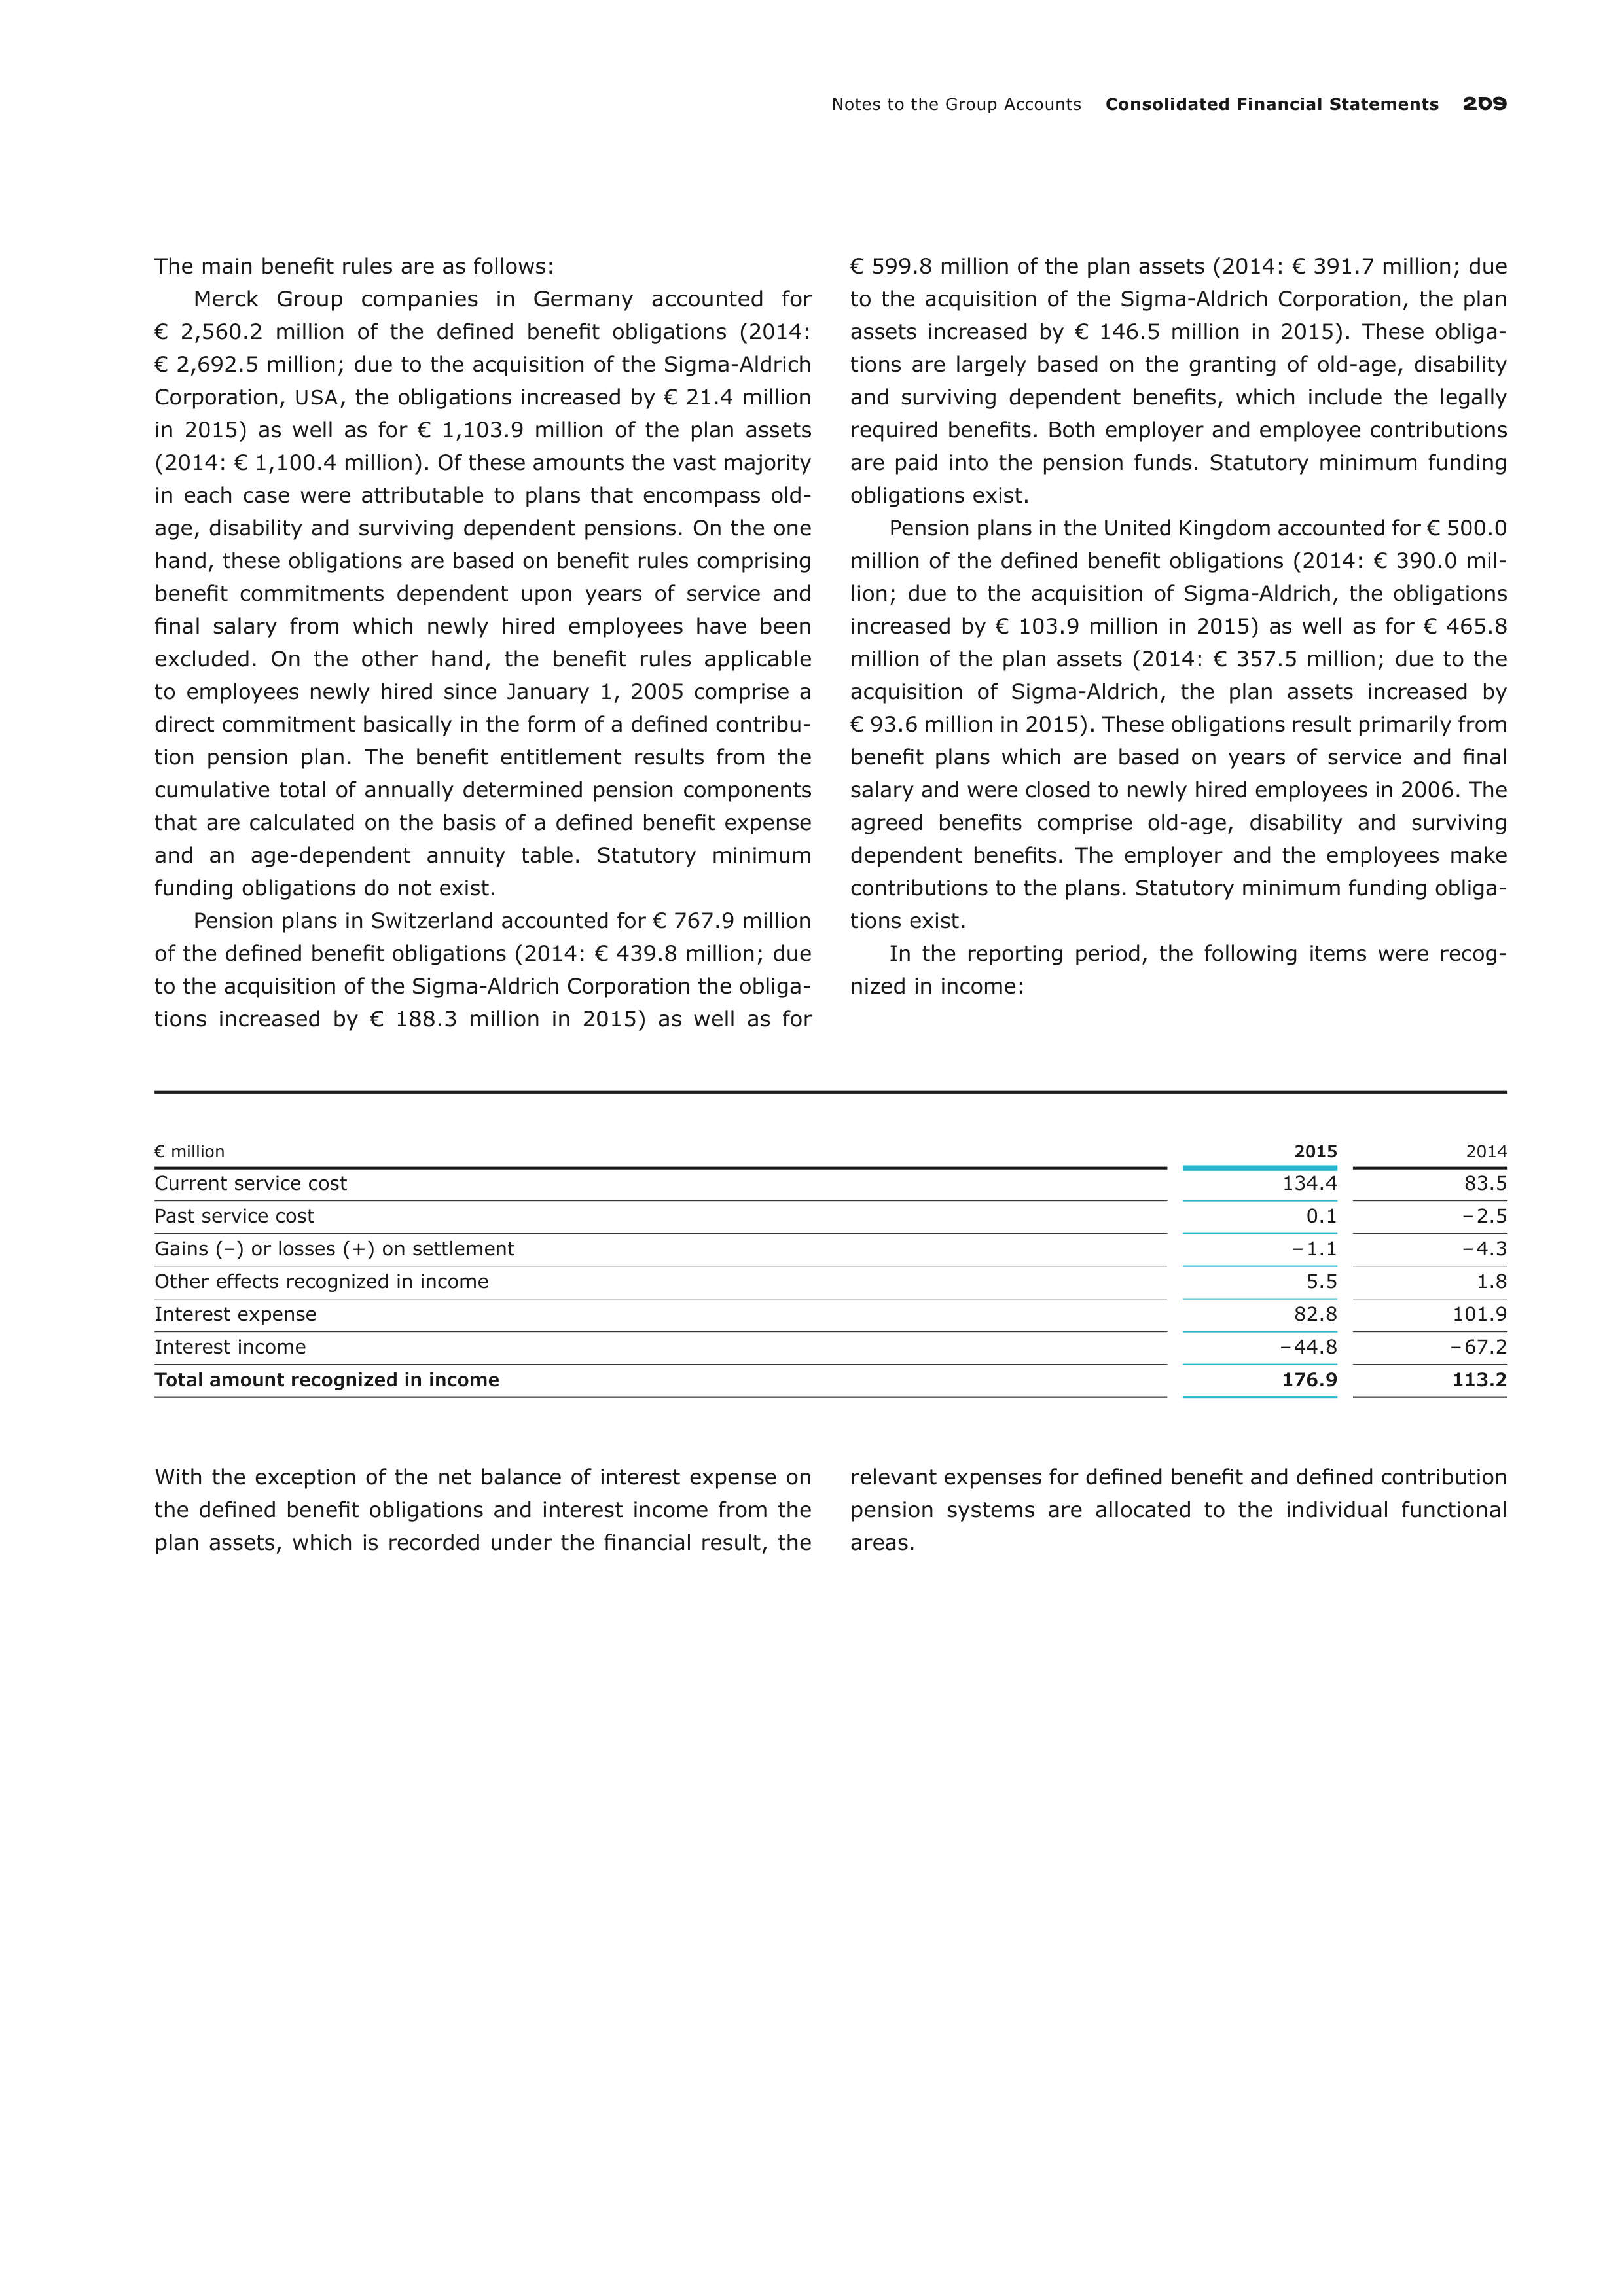
Notes to the Group Accounts
Consolidated Financial Statements
209
The main benefit rules are as follows:
Merck Group companies in Germany accounted for
€ 2,560.2 million of the defined benefit obligations (2014:
€ 2,692.5 million; due to the acquisition of the Sigma-Aldrich
Corporation,
USA
, the obligations increased by € 21.4 million
in 2015) as well as for € 1,103.9 million of the plan assets
(2014: € 1,100.4 million). Of these amounts the vast majority
in each case were attributable to plans that encompass old-
age, disability and surviving dependent pensions. On the one
hand, these obligations are based on benefit rules comprising
benefit commitments dependent upon years of service and
final salary from which newly hired employees have been
excluded. On the other hand, the benefit rules applicable
to
employees newly hired since January 1, 2005 comprise a
direct commitment basically in the form of a defined contribu-
tion pension plan. The benefit entitlement results from the
cumulative total of annually determined pension components
that are calculated on the basis of a defined benefit expense
and an age-dependent annuity table. Statutory minimum
funding obligations do not exist.
Pension plans in Switzerland accounted for € 767.9 million
of the defined benefit obligations (2014: € 439.8 million; due
to the acquisition of the Sigma-Aldrich Corporation the obliga-
tions increased by € 188.3 million in 2015) as well as for
€ 599.8 million of the plan assets (2014: € 391.7 million; due
to the acquisition of the Sigma-Aldrich Corporation, the plan
assets increased by € 146.5 million in 2015). These obliga-
tions are largely based on the granting of old-age, disability
and surviving dependent benefits, which include the legally
required benefits. Both employer and employee contributions
are paid into the pension funds. Statutory minimum funding
obligations exist.
Pension plans in the United Kingdom accounted for € 500.0
million of the defined benefit obligations (2014: € 390.0 mil-
lion; due to the acquisition of Sigma-Aldrich, the obligations
increased by € 103.9 million in 2015) as well as for € 465.8
million of the plan assets (2014: € 357.5 million; due to the
acquisition of Sigma-Aldrich, the plan assets increased by
€ 93.6 million in 2015). These obligations result primarily from
benefit plans which are based on years of service and final
salary and were closed to newly hired employees in 2006. The
agreed benefits comprise old-age, disability and surviving
dependent benefits. The employer and the employees make
contributions to the plans. Statutory minimum funding obliga-
tions exist.
In the reporting period, the following items were recog-
nized in income:
€ million
2015
2014
Current service cost
134.4
83.5
Past service cost
0.1
– 2.5
Gains (–) or losses (+) on settlement
– 1.1
– 4.3
Other effects recognized in income
5.5
1.8
Interest expense
82.8
101.9
Interest income
– 44.8
– 67.2
Total amount recognized in income
176.9
113.2
With the exception of the net balance of interest expense on
the defined benefit obligations and interest income from the
plan assets, which is recorded under the financial result, the
relevant expenses for defined benefit and defined contribution
pension systems are allocated to the individual functional
areas.
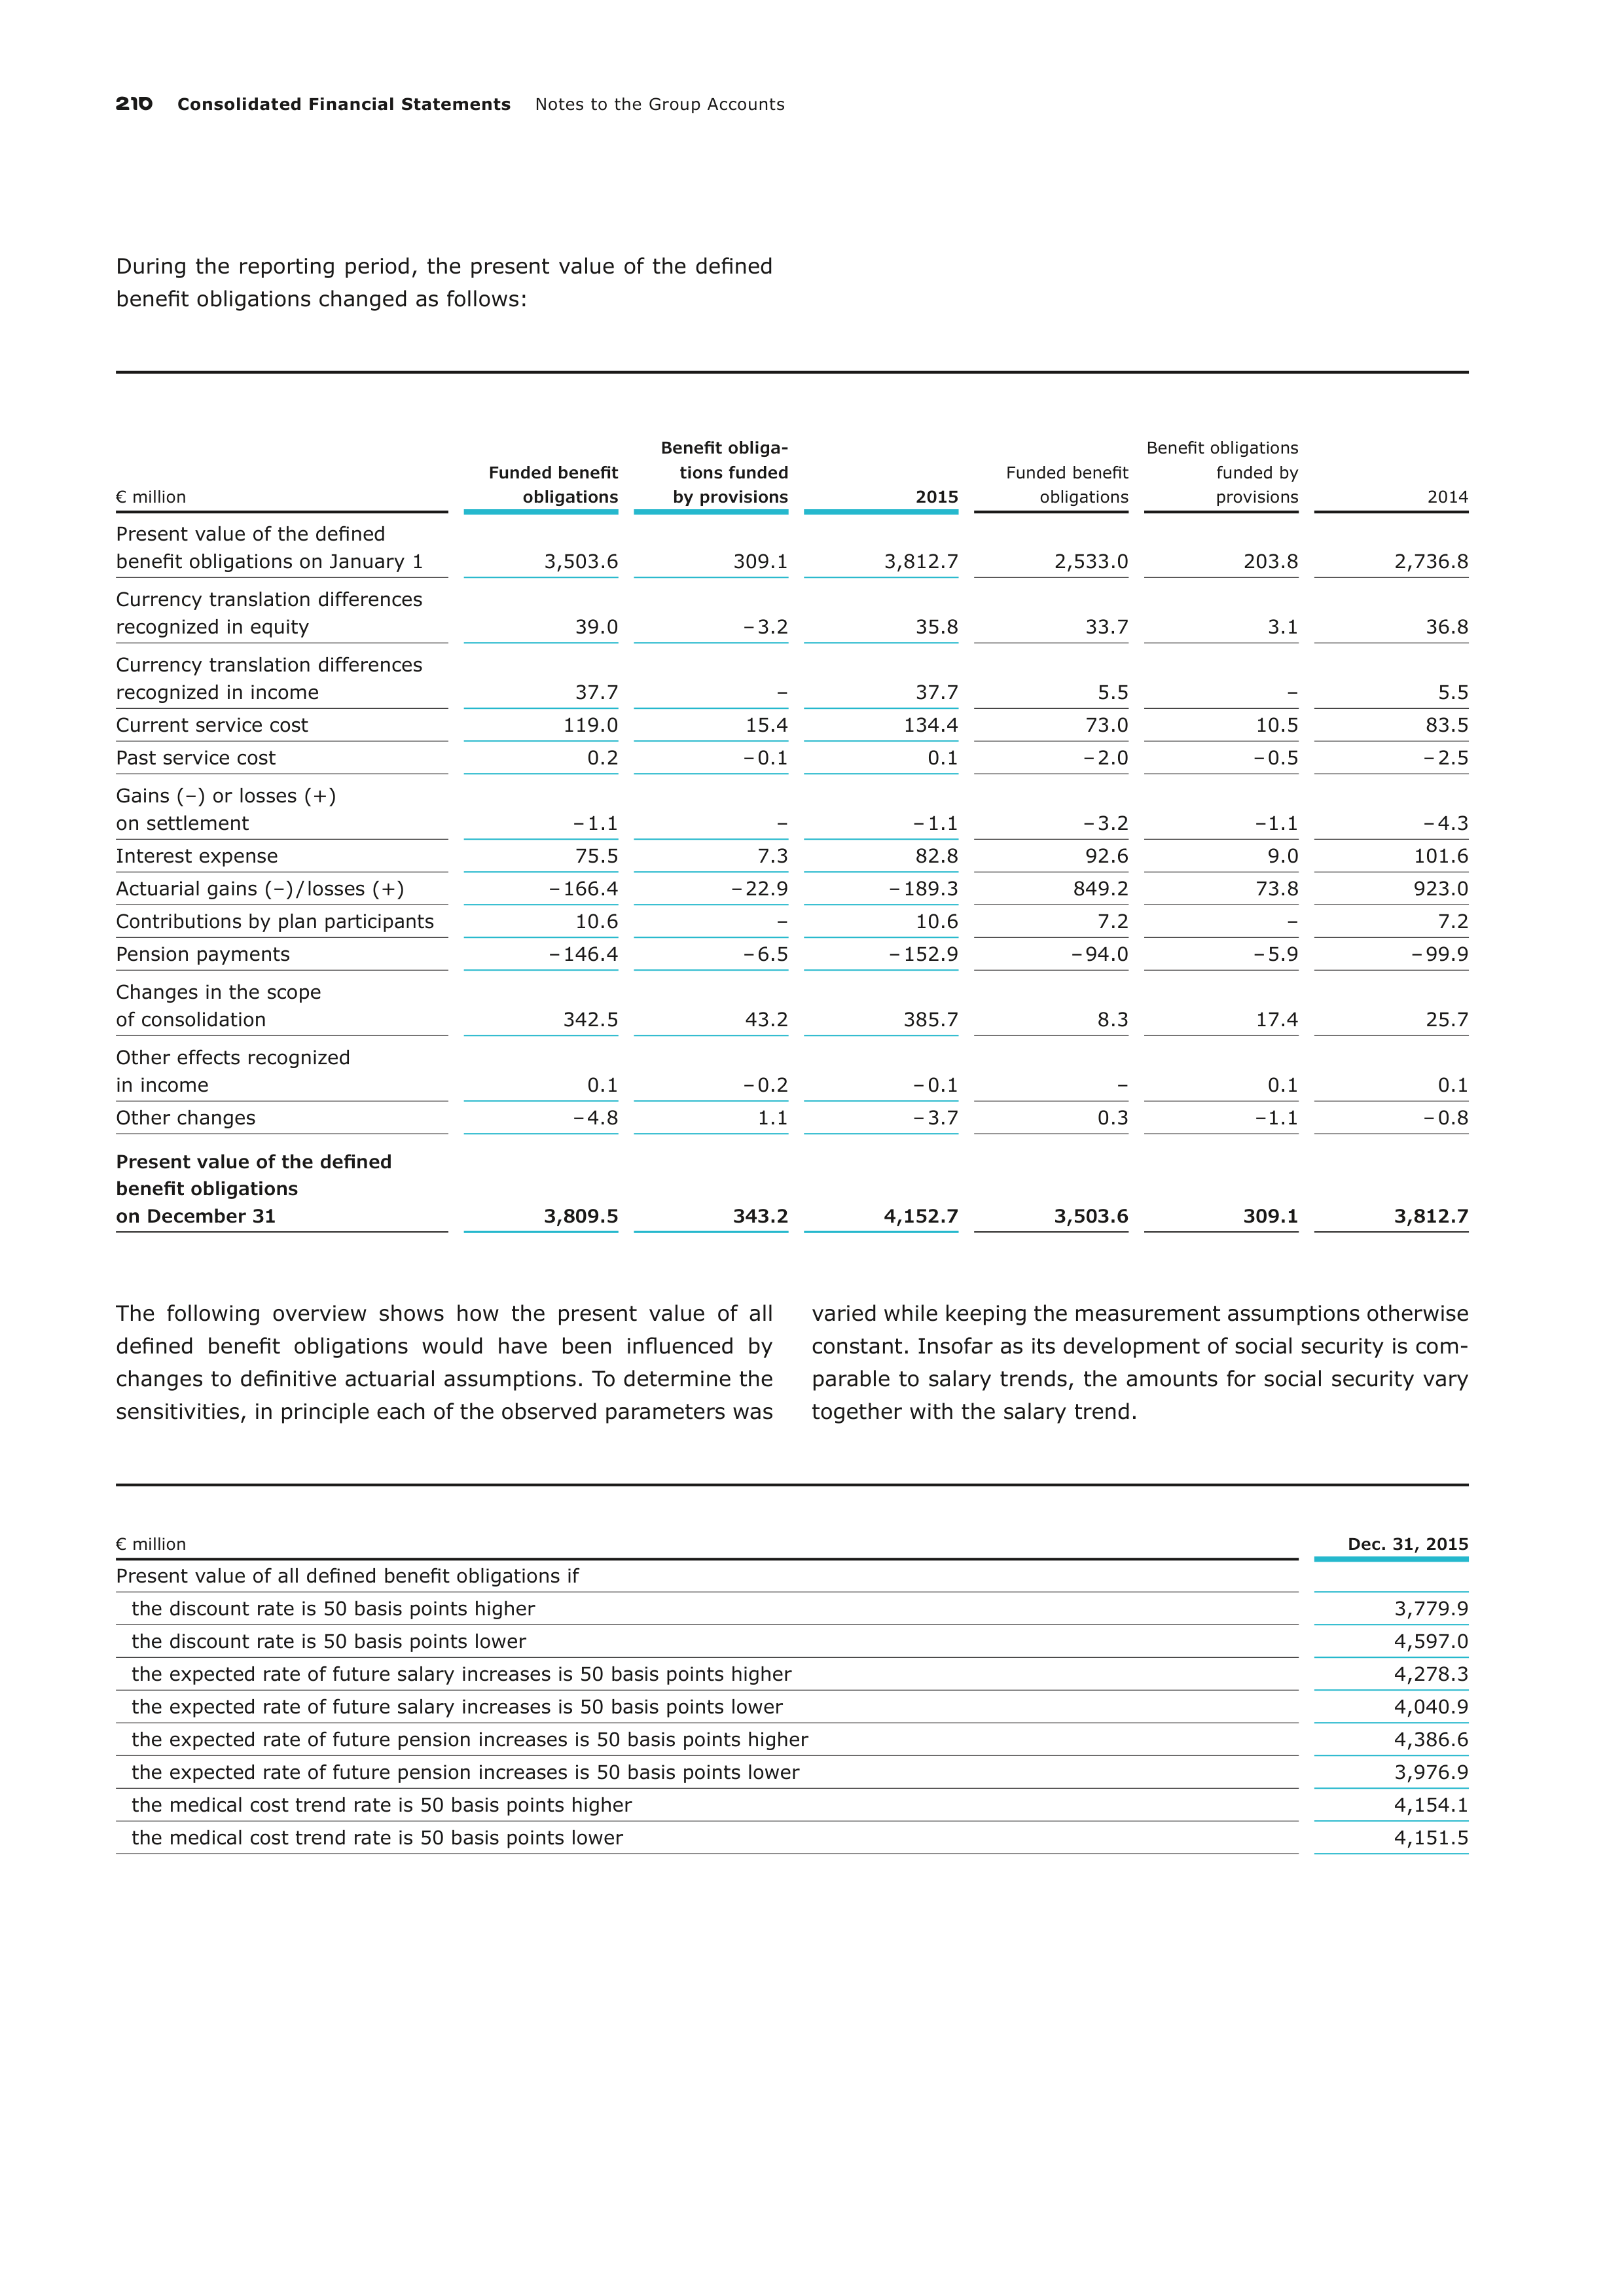
210
Consolidated Financial Statements
Notes to the Group Accounts
During the reporting period, the present value of the defined
benefit obligations changed as follows:
€ million
Funded benefit
obligations
Benefit obliga-
tions funded
by provisions
2015
Funded benefit
obligations
Benefit obligations
funded by
provisions
2014
Present value of the defined
benefit obligations on January 1
3,503.6
309.1
3,812.7
2,533.0
203.8
2,736.8
Currency translation differences
recognized in equity
39.0
– 3.2
35.8
33.7
3.1
36.8
Currency translation differences
recognized in income
37.7
–
37.7
5.5
–
5.5
Current service cost
119.0
15.4
134.4
73.0
10.5
83.5
Past service cost
0.2
– 0.1
0.1
– 2.0
– 0.5
– 2.5
Gains (–) or losses (+)
on settlement
– 1.1
–
– 1.1
– 3.2
– 1.1
– 4.3
Interest expense
75.5
7.3
82.8
92.6
9.0
101.6
Actuarial gains (–) / losses (+)
– 166.4
– 22.9
– 189.3
849.2
73.8
923.0
Contributions by plan participants
10.6
–
10.6
7.2
–
7.2
Pension payments
– 146.4
– 6.5
– 152.9
– 94.0
– 5.9
– 99.9
Changes in the scope
of consolidation
342.5
43.2
385.7
8.3
17.4
25.7
Other effects recognized
in income
0.1
– 0.2
– 0.1
–
0.1
0.1
Other changes
– 4.8
1.1
– 3.7
0.3
– 1.1
– 0.8
Present value of the defined
benefit obligations
on December 31
3,809.5
343.2
4,152.7
3,503.6
309.1
3,812.7
The following overview shows how the present value of all
defined benefit obligations would have been influenced by
changes to definitive actuarial assumptions. To determine the
sensitivities, in principle each of the observed parameters was
varied while keeping the measurement assumptions otherwise
constant. Insofar as its development of social security is com-
parable to salary trends, the amounts for social security vary
together with the salary trend.
€ million
Dec. 31, 2015
Present value of all defined benefit obligations if
the discount rate is 50 basis points higher
3,779.9
the discount rate is 50 basis points lower
4,597.0
the expected rate of future salary increases is 50 basis points higher
4,278.3
the expected rate of future salary increases is 50 basis points lower
4,040.9
the expected rate of future pension increases is 50 basis points higher
4,386.6
the expected rate of future pension increases is 50 basis points lower
3,976.9
the medical cost trend rate is 50 basis points higher
4,154.1
the medical cost trend rate is 50 basis points lower
4,151.5
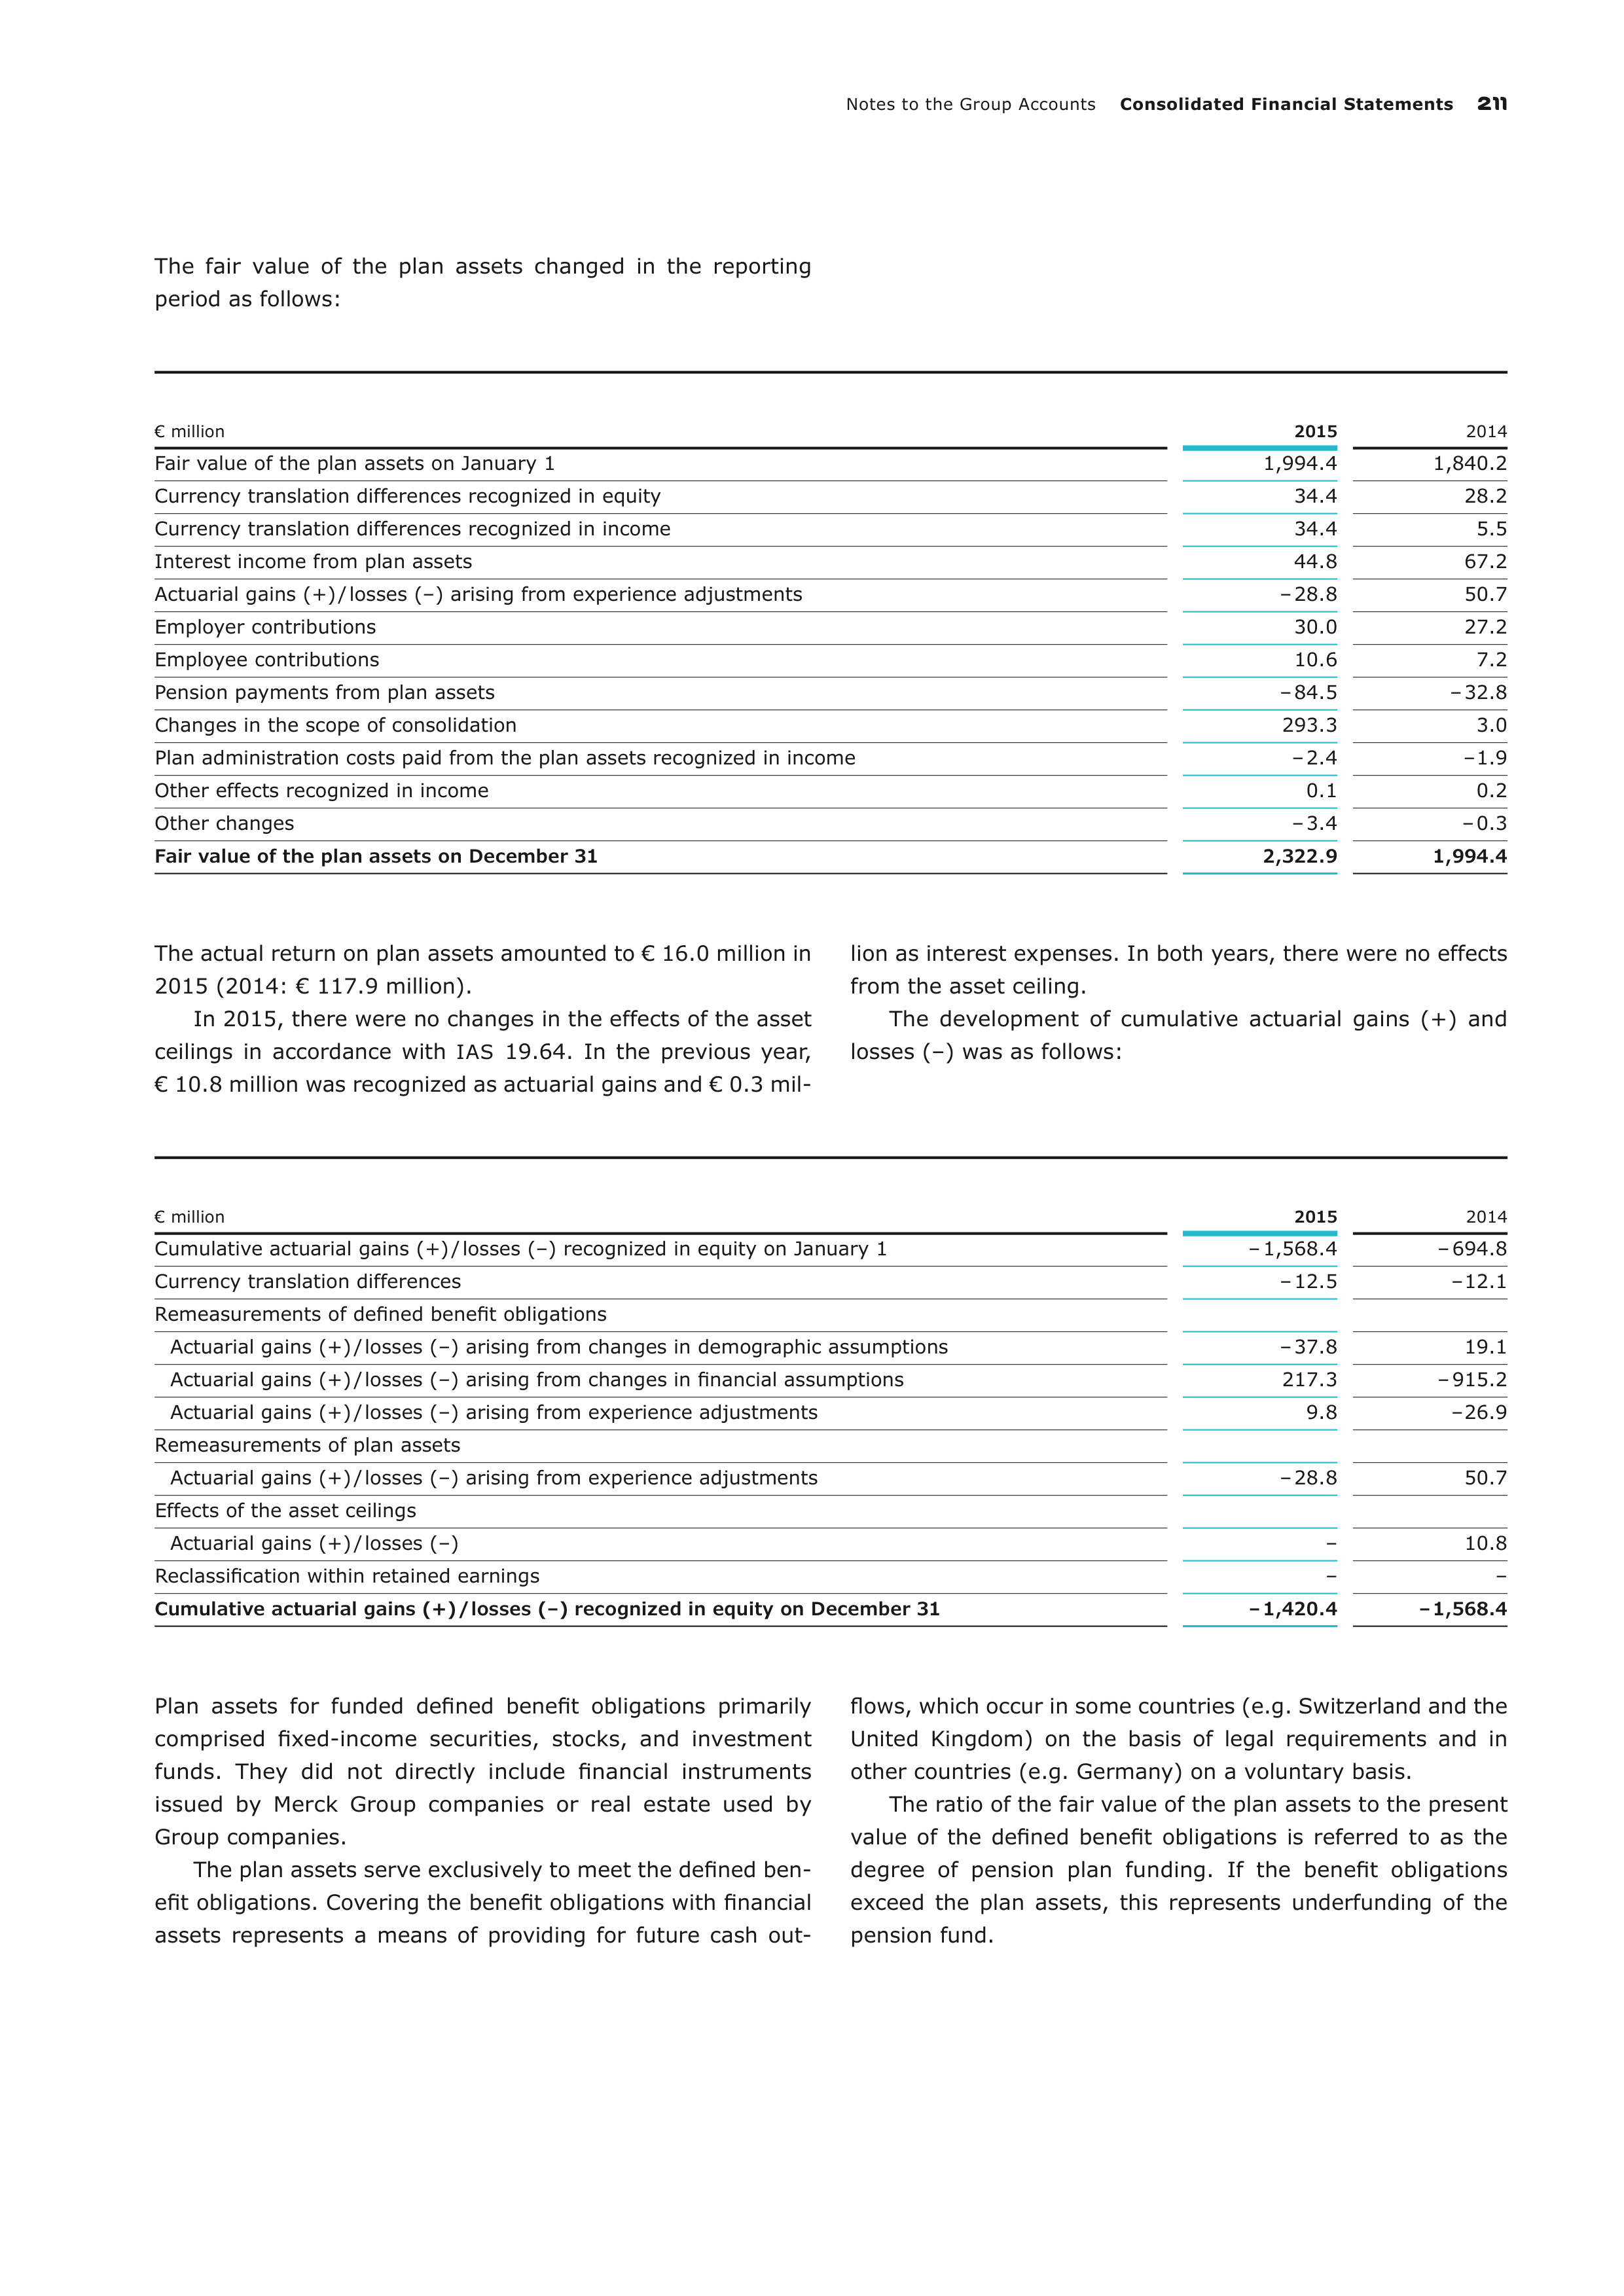
Notes to the Group Accounts
Consolidated Financial Statements
211
The fair value of the plan assets changed in the reporting
period as follows:
€ million
2015
2014
Fair value of the plan assets on January 1
1,994.4
1,840.2
Currency translation differences recognized in equity
34.4
28.2
Currency translation differences recognized in income
34.4
5.5
Interest income from plan assets
44.8
67.2
Actuarial gains (+) / losses (–) arising from experience adjustments
– 28.8
50.7
Employer contributions
30.0
27.2
Employee contributions
10.6
7.2
Pension payments from plan assets
– 84.5
– 32.8
Changes in the scope of consolidation
293.3
3.0
Plan administration costs paid from the plan assets recognized in income
– 2.4
– 1.9
Other effects recognized in income
0.1
0.2
Other changes
– 3.4
– 0.3
Fair value of the plan assets on December 31
2,322.9
1,994.4
The actual return on plan assets amounted to € 16.0 million in
2015 (2014: € 117.9 million).
In 2015, there were no changes in the effects of the asset
ceilings in accordance with
IAS
19.64. In the previous year,
€ 10.8 million was recognized as actuarial gains and € 0.3 mil-
lion as interest expenses. In both years, there were no effects
from the asset ceiling.
The development of cumulative actuarial gains (+) and
losses (–) was as follows:
€ million
2015
2014
Cumulative actuarial gains (+) / losses (–) recognized in equity on January 1
– 1,568.4
– 694.8
Currency translation differences
– 12.5
– 12.1
Remeasurements of defined benefit obligations
Actuarial gains (+) / losses (–) arising from changes in demographic assumptions
– 37.8
19.1
Actuarial gains (+) / losses (–) arising from changes in financial assumptions
217.3
– 915.2
Actuarial gains (+) / losses (–) arising from experience adjustments
9.8
– 26.9
Remeasurements of plan assets
Actuarial gains (+) / losses (–) arising from experience adjustments
– 28.8
50.7
Effects of the asset ceilings
Actuarial gains (+) / losses (–)
–
10.8
Reclassification within retained earnings
–
–
Cumulative actuarial gains (+) / losses (–) recognized in equity on December 31
– 1,420.4
– 1,568.4
Plan assets for funded defined benefit obligations primarily
comprised fixed-income securities, stocks, and investment
funds. They did not directly include financial instruments
issued by Merck Group companies or real estate used by
Group companies.
The plan assets serve exclusively to meet the defined ben-
efit obligations. Covering the benefit obligations with financial
assets represents a means of providing for future cash out-
flows, which occur in some countries (e.g. Switzerland and the
United Kingdom) on the basis of legal requirements and in
other countries (e.g. Germany) on a voluntary basis.
The ratio of the fair value of the plan assets to the present
value of the defined benefit obligations is referred to as the
degree of pension plan funding. If the benefit obligations
exceed the plan assets, this represents underfunding of the
pension fund.
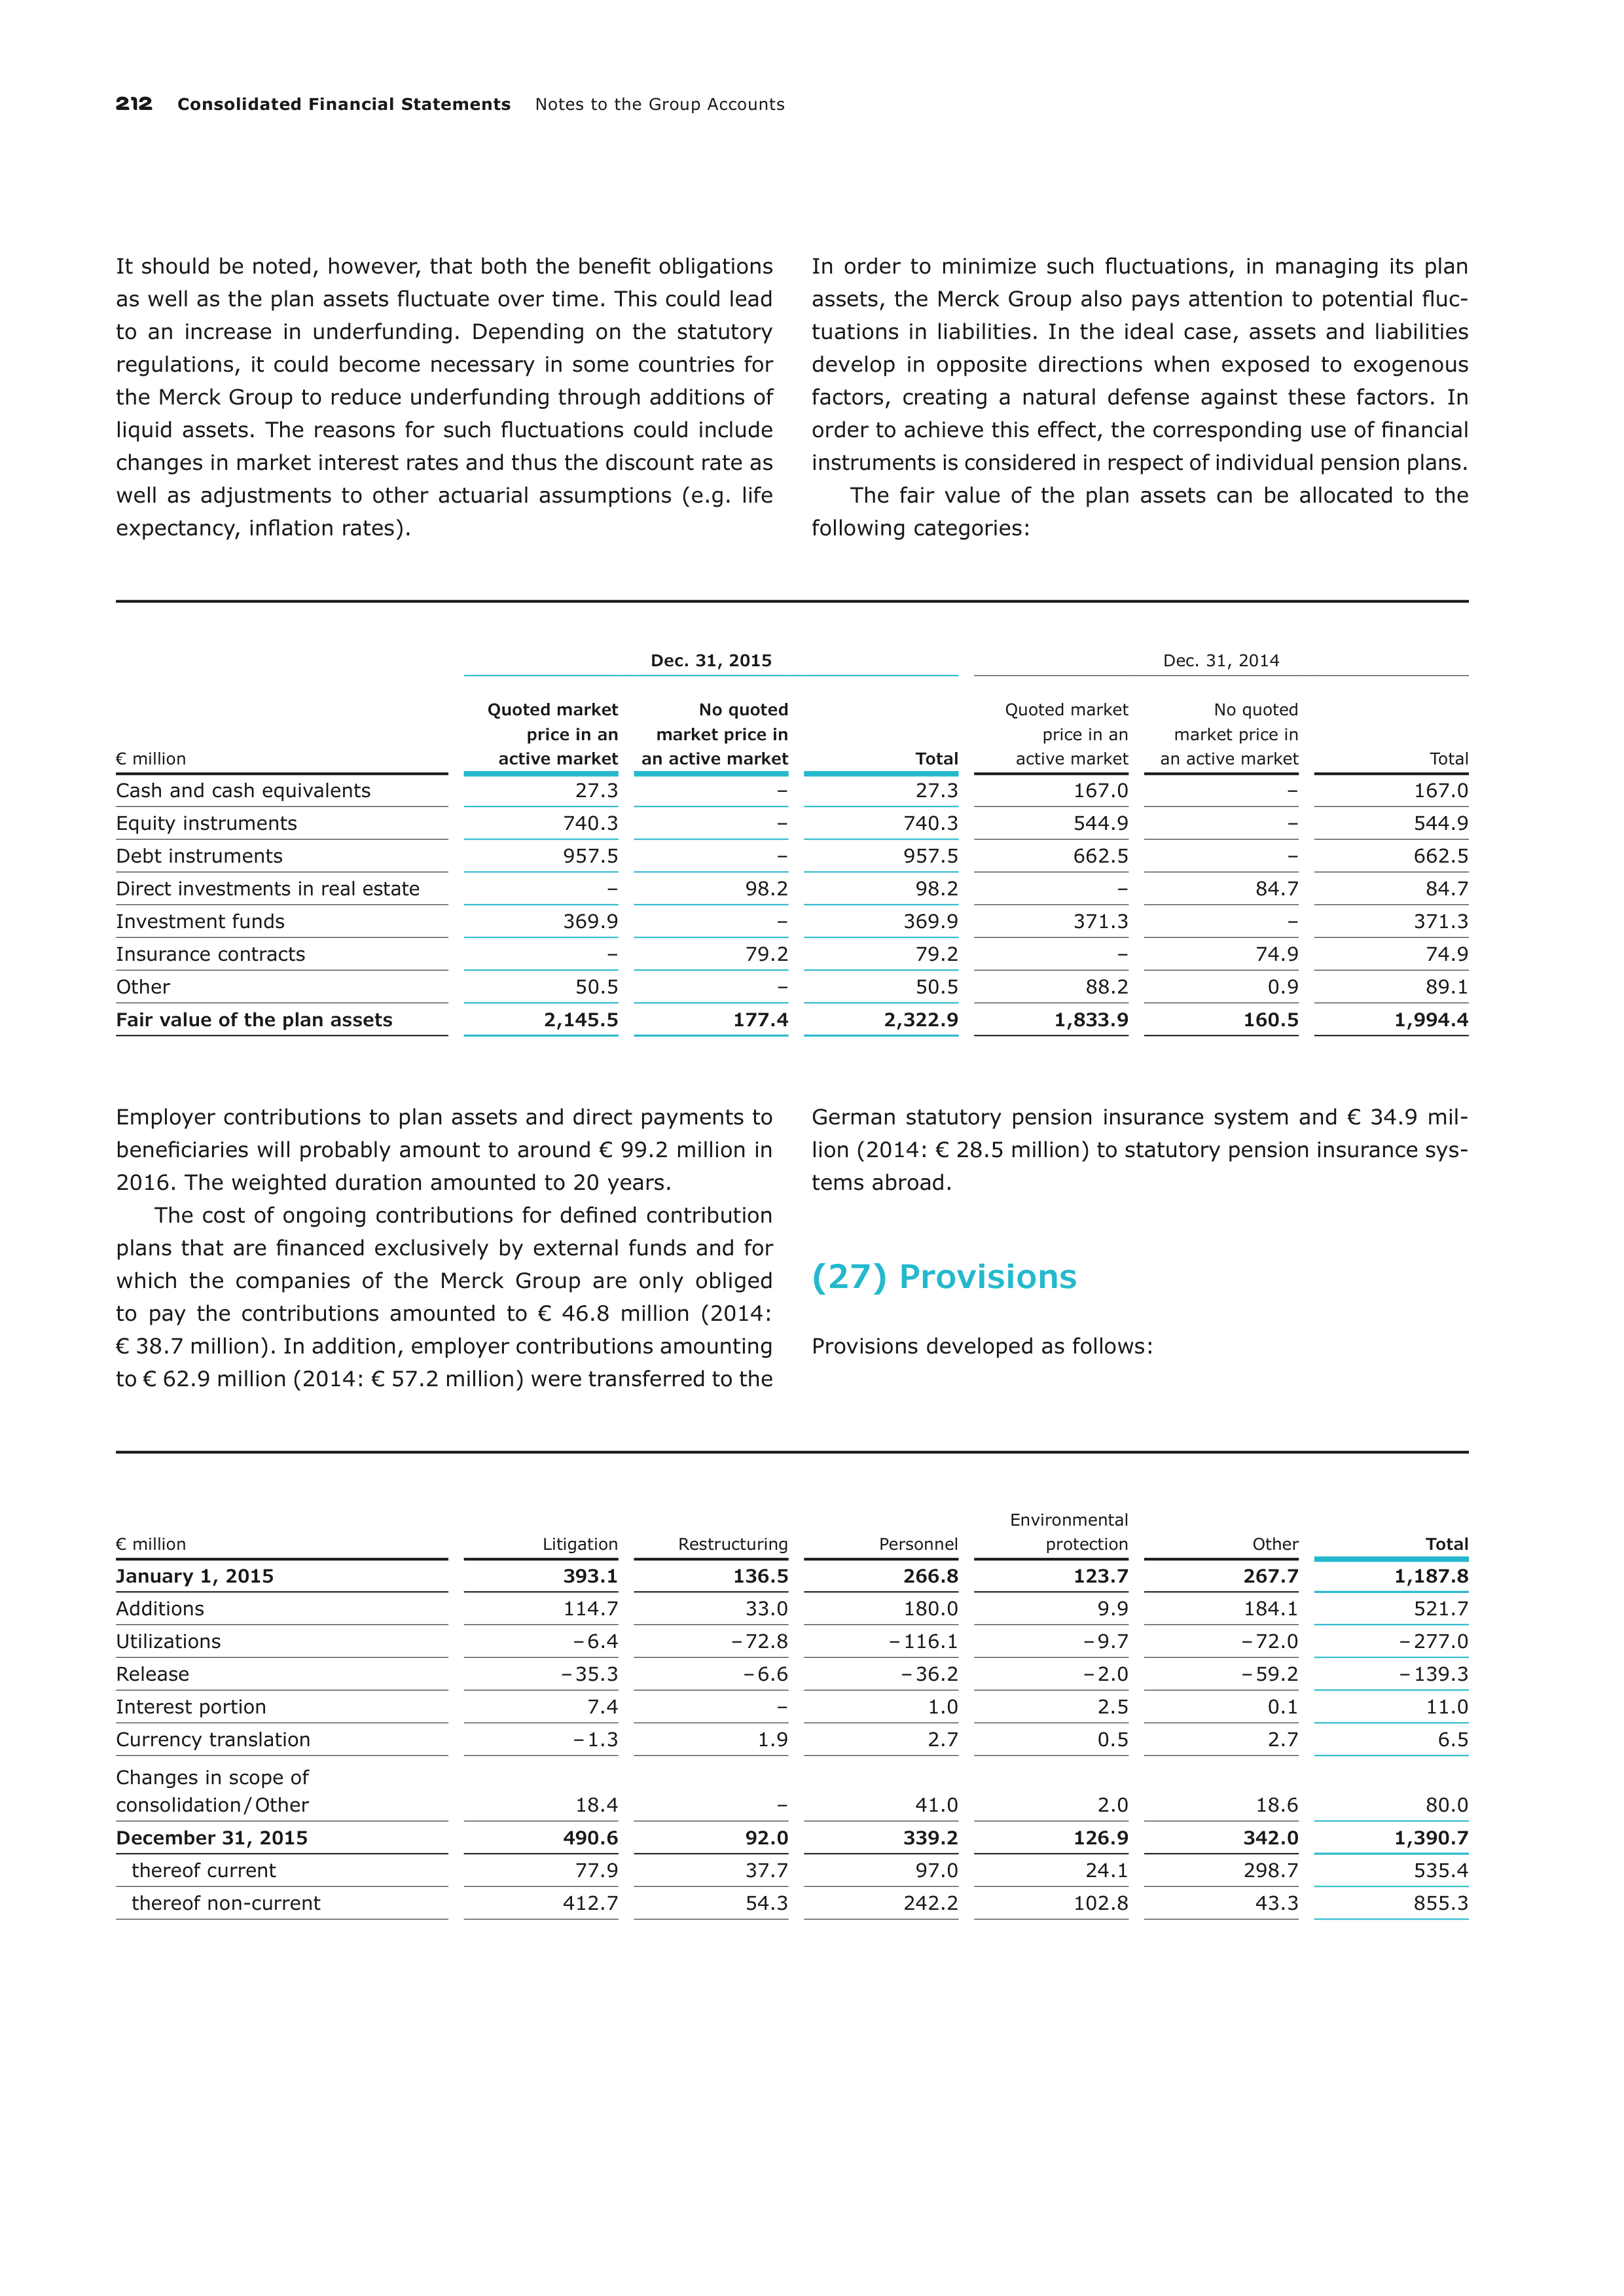
212
Consolidated Financial Statements
Notes to the Group Accounts
It should be noted, however, that both the benefit obligations
as well as the plan assets fluctuate over time. This could lead
to an increase in underfunding. Depending on the statutory
regulations, it could become necessary in some countries for
the Merck Group to reduce underfunding through additions of
liquid assets. The reasons for such fluctuations could include
changes in market interest rates and thus the discount rate as
well as adjustments to other actuarial assumptions (e.g. life
expectancy, inflation rates).
In order to minimize such fluctuations, in managing its plan
assets, the Merck Group also pays attention to potential fluc-
tuations in liabilities. In the ideal case, assets and liabilities
develop in opposite directions when exposed to exogenous
factors, creating a natural defense against these factors. In
order to achieve this effect, the corresponding use of financial
instruments is considered in respect of individual pension plans.
The fair value of the plan assets can be allocated to the
following categories:
€ million
Dec. 31, 2015
Dec. 31, 2014
Quoted market
price in an
active market
No quoted
market price in
an active market
Total
Quoted market
price in an
active market
No quoted
market price in
an active market
Total
Cash and cash equivalents
27.3
–
27.3
167.0
–
167.0
Equity instruments
740.3
–
740.3
544.9
–
544.9
Debt instruments
957.5
–
957.5
662.5
–
662.5
Direct investments in real estate
–
98.2
98.2
–
84.7
84.7
Investment funds
369.9
–
369.9
371.3
–
371.3
Insurance contracts
–
79.2
79.2
–
74.9
74.9
Other
50.5
–
50.5
88.2
0.9
89.1
Fair value of the plan assets
2,145.5
177.4
2,322.9
1,833.9
160.5
1,994.4
Employer contributions to plan assets and direct payments to
beneficiaries will probably amount to around € 99.2 million in
2016. The weighted duration amounted to 20 years.
The cost of ongoing contributions for defined contribution
plans that are financed exclusively by external funds and for
which the companies of the Merck Group are only obliged
to
pay the contributions amounted to € 46.8 million (2014:
€ 38.7 million). In addition, employer contributions amounting
to € 62.9 million (2014: € 57.2 million) were transferred to the
German statutory pension insurance system and € 34.9 mil-
lion (2014: € 28.5 million) to statutory pension insurance sys-
tems abroad.
(27) Provisions
Provisions developed as follows:
€ million
Litigation
Restructuring
Personnel
Environmental
protection
Other
Total
January 1, 2015
393.1
136.5
266.8
123.7
267.7
1,187.8
Additions
114.7
33.0
180.0
9.9
184.1
521.7
Utilizations
– 6.4
– 72.8
– 116.1
– 9.7
– 72.0
– 277.0
Release
– 35.3
– 6.6
– 36.2
– 2.0
– 59.2
– 139.3
Interest portion
7.4
–
1.0
2.5
0.1
11.0
Currency translation
– 1.3
1.9
2.7
0.5
2.7
6.5
Changes in scope of
consolidation / Other
18.4
–
41.0
2.0
18.6
80.0
December 31, 2015
490.6
92.0
339.2
126.9
342.0
1,390.7
thereof current
77.9
37.7
97.0
24.1
298.7
535.4
thereof non-current
412.7
54.3
242.2
102.8
43.3
855.3
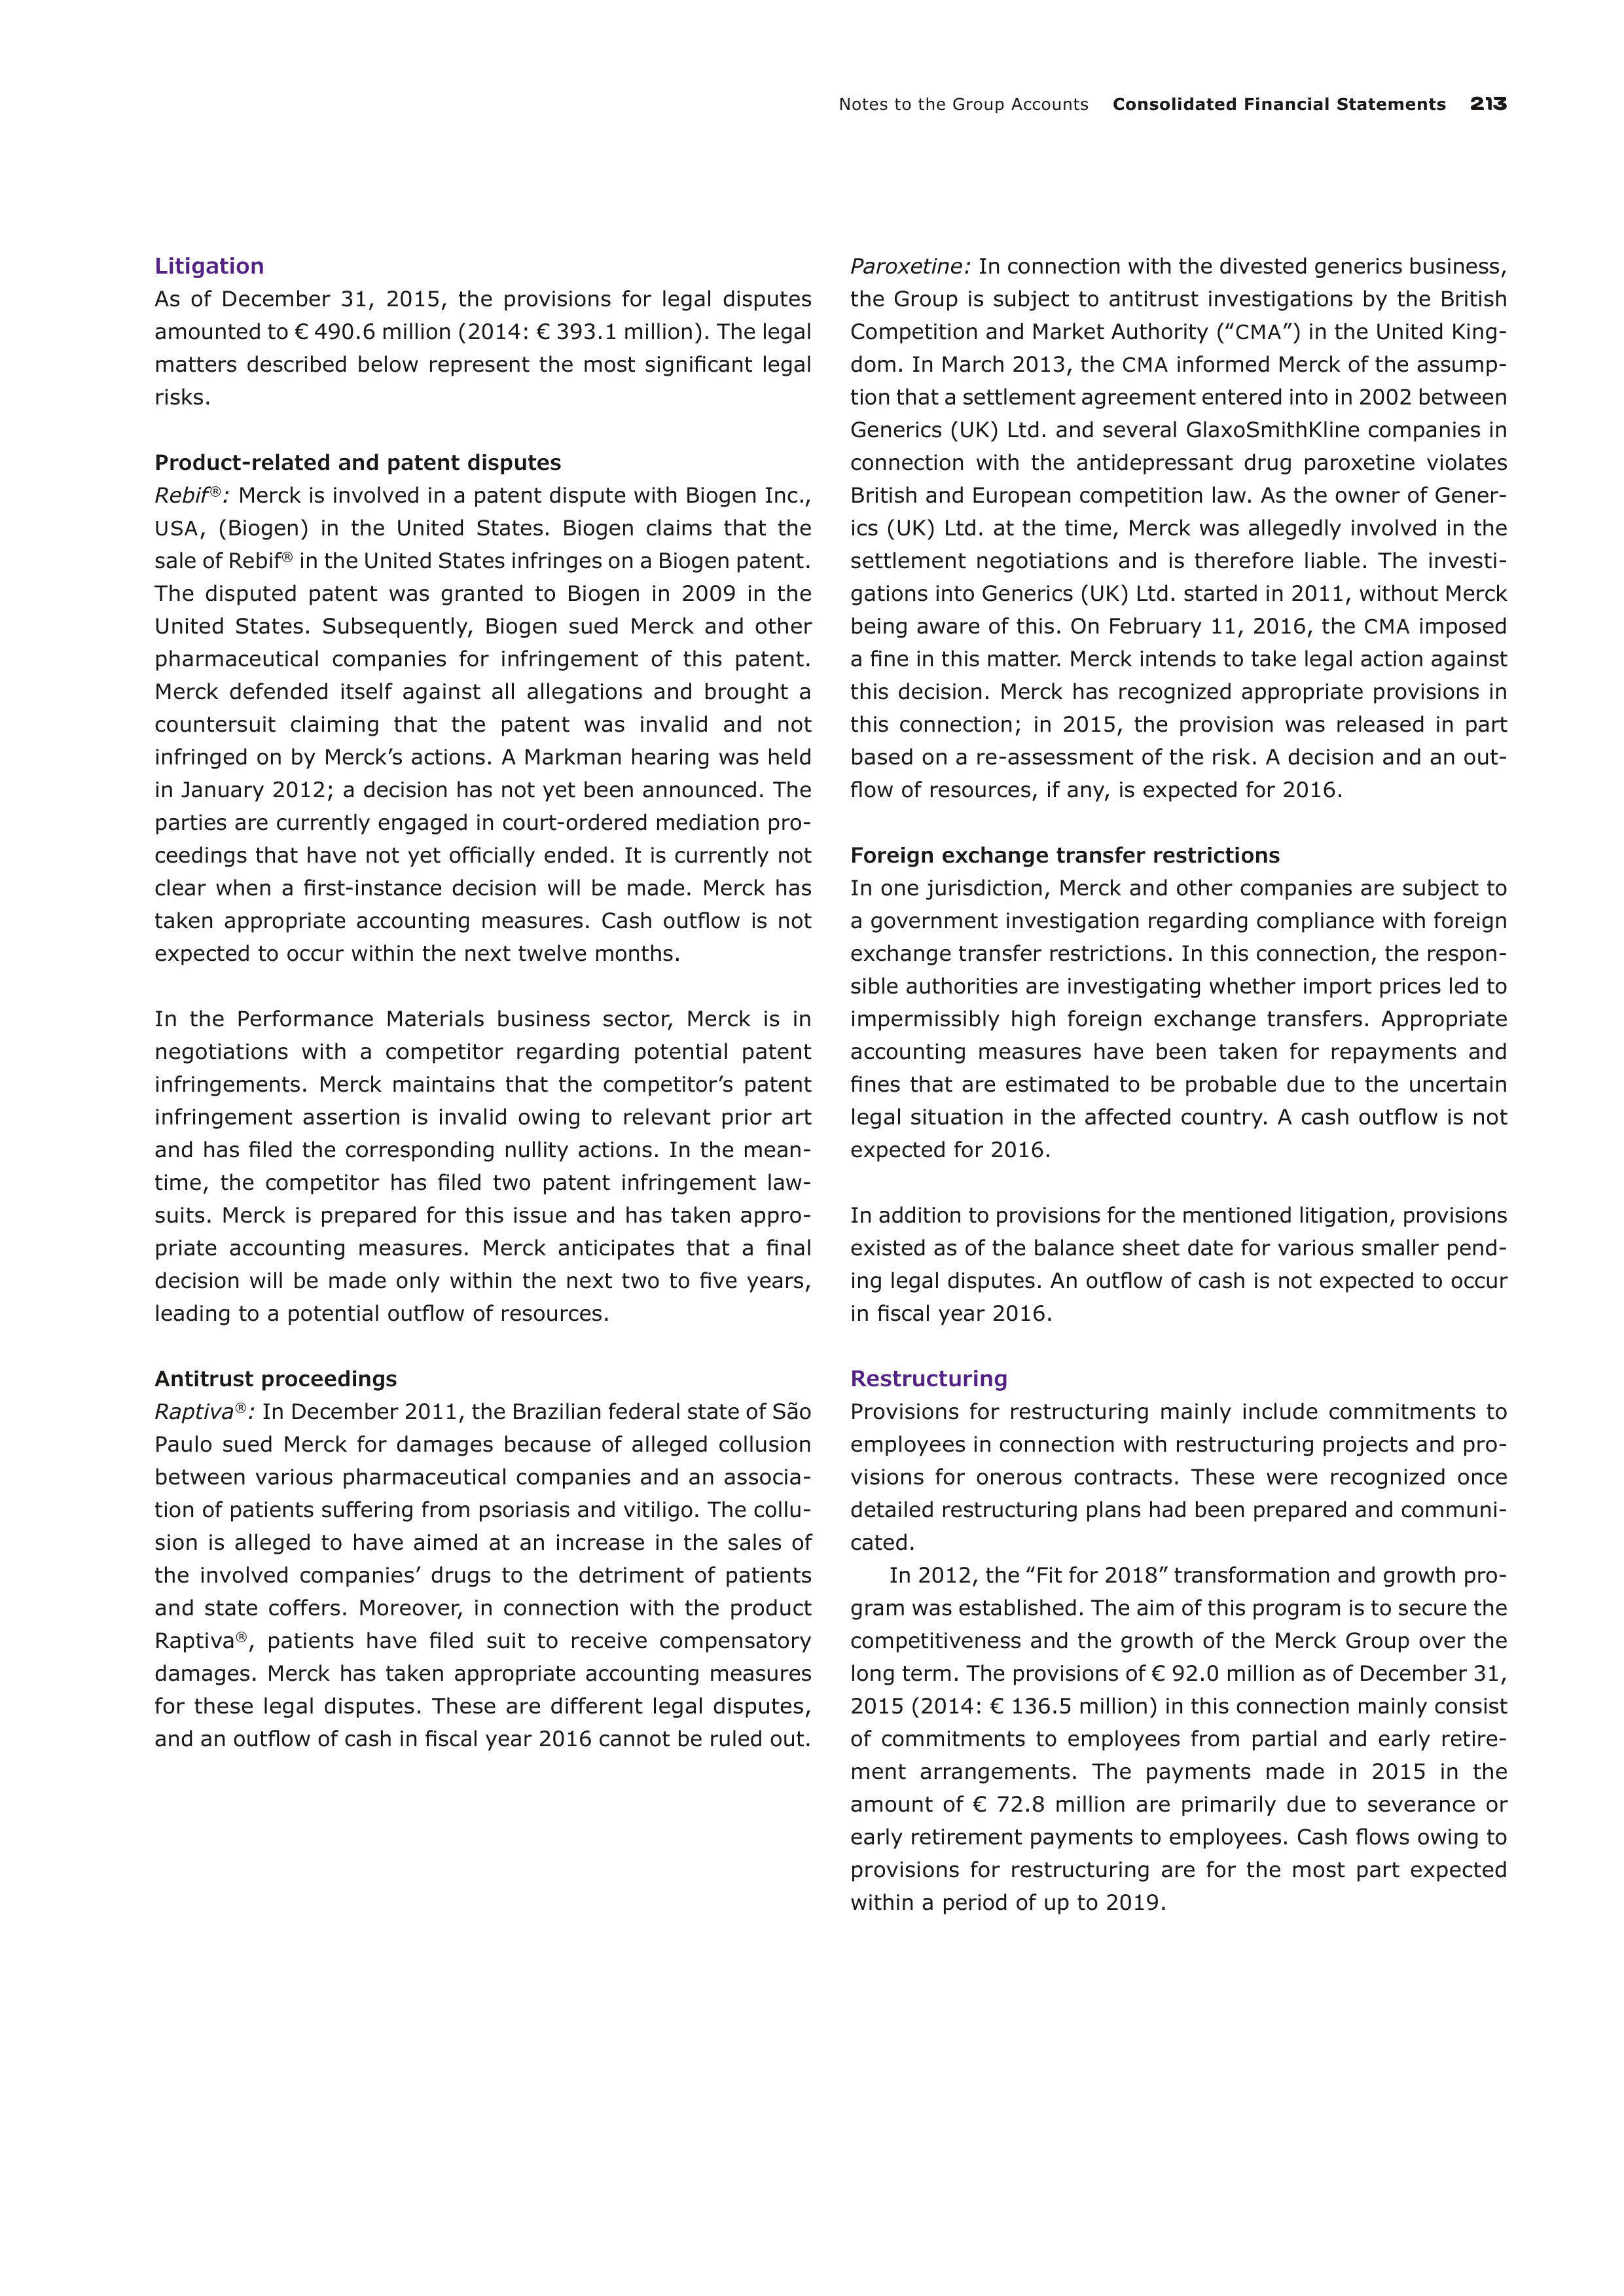
Notes to the Group Accounts
Consolidated Financial Statements
213
Litigation
As of December 31, 2015, the provisions for legal disputes
amounted to € 490.6 million (2014: € 393.1 million). The legal
matters described below represent the most significant legal
risks.
Product-related and patent disputes
Rebif
®
:
Merck is involved in a patent dispute with Biogen Inc.,
USA
, (Biogen) in the United States. Biogen claims that the
sale of Rebif
®
in the United States infringes on a Biogen patent.
The disputed patent was granted to Biogen in 2009 in the
United States. Subsequently, Biogen sued Merck and other
pharmaceutical companies for infringement of this patent.
Merck defended itself against all allegations and brought a
countersuit claiming that the patent was invalid and not
infringed on by Merck’s actions. A Markman hearing was held
in January 2012; a decision has not yet been announced. The
parties are currently engaged in court-ordered mediation pro-
ceedings that have not yet officially ended. It is currently not
clear when a first-instance decision will be made. Merck has
taken appropriate accounting measures. Cash outflow is not
expected to occur within the next twelve months.
In the Performance Materials business sector, Merck is in
negotiations with a competitor regarding potential patent
infringements. Merck maintains that the competitor’s patent
infringement assertion is invalid owing to relevant prior art
and has filed the corresponding nullity actions. In the mean-
time, the competitor has filed two patent infringement law-
suits. Merck is prepared for this issue and has taken appro-
priate accounting measures. Merck anticipates that a final
decision will be made only within the next two to five years,
leading to a potential outflow of resources.
Antitrust proceedings
Raptiva
®
:
In December 2011, the Brazilian federal state of São
Paulo sued Merck for damages because of alleged collusion
between various pharmaceutical companies and an associa-
tion of patients suffering from psoriasis and vitiligo. The collu-
sion is alleged to have aimed at an increase in the sales of
the involved companies’ drugs to the detriment of patients
and state coffers. Moreover, in connection with the product
Raptiva
®
, patients have filed suit to receive compensatory
damages. Merck has taken appropriate accounting measures
for these legal disputes. These are different legal disputes,
and an outflow of cash in fiscal year 2016 cannot be ruled out.
Paroxetine:
In connection with the divested generics business,
the Group is subject to antitrust investigations by the British
Competition and Market Authority (‟
CMA
”) in the United King-
dom. In March 2013, the
CMA
informed Merck of the assump-
tion that a settlement agreement entered into in 2002 between
Generics (UK) Ltd. and several GlaxoSmithKline companies in
connection with the antidepressant drug paroxetine violates
British and European competition law. As the owner of Gener-
ics (UK) Ltd. at the time, Merck was allegedly involved in the
settlement negotiations and is therefore liable. The investi-
ga
tions into Generics (UK) Ltd. started in 2011, without Merck
being aware of this. On February 11, 2016, the
CMA
imposed
a fine in this matter. Merck intends to take legal action against
this decision. Merck has recognized appropriate provisions in
this connection; in 2015, the provision was released in part
based on a re-assessment of the risk. A decision and an out-
flow of resources, if any, is expected for 2016.
Foreign exchange transfer restrictions
In one jurisdiction, Merck and other companies are subject to
a government investigation regarding compliance with foreign
exchange transfer restrictions. In this connection, the respon-
sible authorities are investigating whether import prices led to
impermissibly high foreign exchange transfers. Appropriate
accounting measures have been taken for repayments and
fines that are estimated to be probable due to the uncertain
legal situation in the affected country. A cash outflow is not
expected for 2016.
In addition to provisions for the mentioned litigation, provisions
existed as of the balance sheet date for various smaller pend-
ing legal disputes. An outflow of cash is not expected to occur
in fiscal year 2016.
Restructuring
Provisions for restructuring mainly include commitments to
employees in connection with restructuring projects and pro-
visions for onerous contracts. These were recognized once
detailed restructuring plans had been prepared and communi-
cated.
In 2012, the ‟Fit for 2018” transformation and growth pro-
gram was established. The aim of this program is to secure the
competitiveness and the growth of the Merck Group over the
long term. The provisions of € 92.0 million as of December 31,
2015 (2014: € 136.5 million) in this connection mainly consist
of commitments to employees from partial and early retire-
ment arrangements. The payments made in 2015 in the
amount of € 72.8 million are primarily due to severance or
early retirement payments to employees. Cash flows owing to
provisions for restructuring are for the most part expected
within a period of up to 2019.
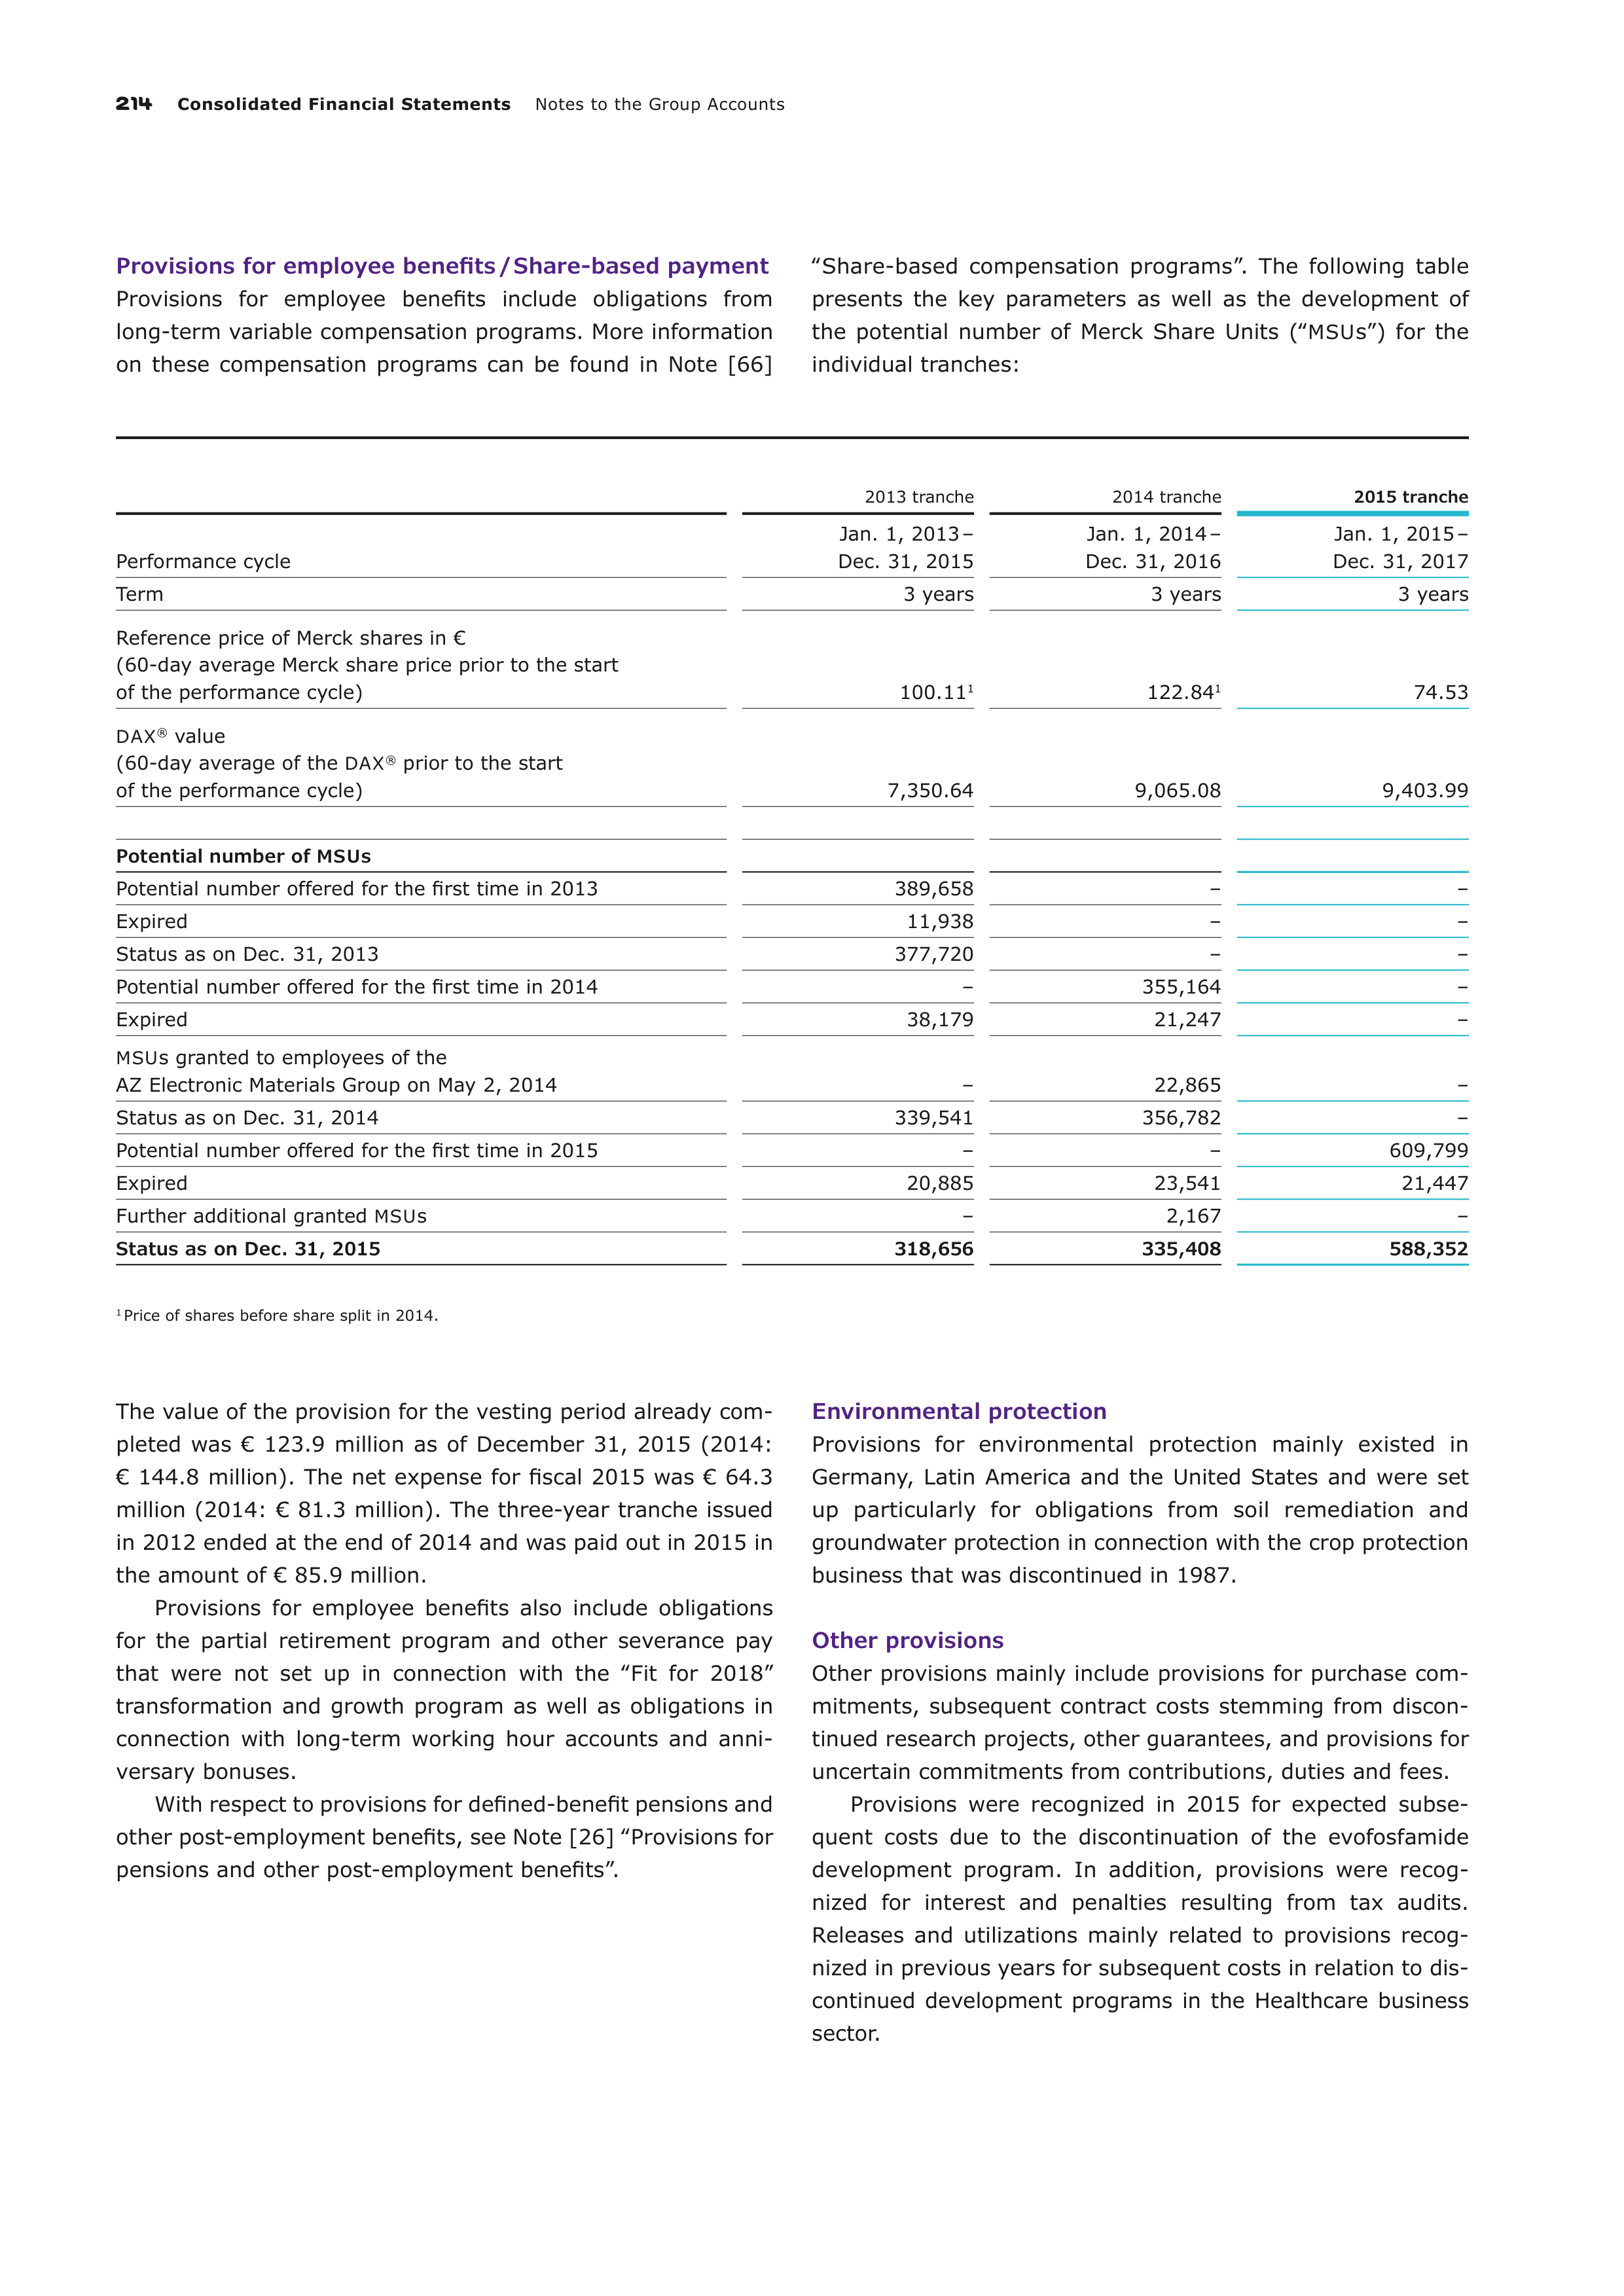
214
Consolidated Financial Statements
Notes to the Group Accounts
Provisions for employee benefits / Share-based payment
Provisions for employee benefits include obligations from
long-term variable compensation programs. More information
on these compensation programs can be found in Note [66]
‟Share-based compensation programs”. The following table
presents the key parameters as well as the development of
the potential number of Merck Share Units (‟
MSU
s”) for the
individual tranches:
2013 tranche
2014 tranche
2015 tranche
Performance cycle
Jan. 1, 2013 –
Dec. 31, 2015
Jan. 1, 2014 –
Dec. 31, 2016
Jan. 1, 2015 –
Dec. 31, 2017
Term
3 years
3 years
3 years
Reference price of Merck shares in €
(60-day average Merck share price prior to the start
of the performance cycle)
100.11
1
122.84
1
74.53
DAX
®
value
(60-day average of the
DAX
®
prior to the start
of the performance cycle)
7,350.64
9,065.08
9,403.99
Potential number of
MSU
s
Potential number offered for the first time in 2013
389,658
–
–
Expired
11,938
–
–
Status as on Dec. 31, 2013
377,720
–
–
Potential number offered for the first time in 2014
–
355,164
–
Expired
38,179
21,247
–
MSU
s granted to employees of the
AZ Electronic Materials Group on May 2, 2014
–
22,865
–
Status as on Dec. 31, 2014
339,541
356,782
–
Potential number offered for the first time in 2015
–
–
609,799
Expired
20,885
23,541
21,447
Further additional granted
MSU
s
–
2,167
–
Status as on Dec. 31, 2015
318,656
335,408
588,352
1
Price of shares before share split in 2014.
The value of the provision for the vesting period already com-
pleted was € 123.9 million as of December 31, 2015 (2014:
€ 144.8 million). The net expense for fiscal 2015 was € 64.3
million (2014: € 81.3 million). The three-year tranche issued
in 2012 ended at the end of 2014 and was paid out in 2015 in
the amount of € 85.9 million.
Provisions for employee benefits also include obligations
for the partial retirement program and other severance pay
that were not set up in connection with the ‟Fit for 2018”
transformation and growth program as well as obligations in
connection with long-term working hour accounts and anni-
versary bonuses.
With respect to provisions for defined-benefit pensions and
other post-employment benefits, see Note [26] ‟Provisions for
pensions and other post-employment benefits”.
Environmental protection
Provisions for environmental protection mainly existed in
Germany, Latin America and the United States and were set
up particularly for obligations from soil remediation and
groundwater protection in connection with the crop protection
business that was discontinued in 1987.
Other provisions
Other provisions mainly include provisions for purchase com-
mitments, subsequent contract costs stemming from discon-
tinued research projects, other guarantees, and provisions for
uncertain commitments from contributions, duties and fees.
Provisions were recognized in 2015 for expected subse-
quent costs due to the discontinuation of the evofosfamide
development program. In addition, provisions were recog-
nized for interest and penalties resulting from tax audits.
Releases and utilizations mainly related to provisions recog-
nized in previous years for subsequent costs in relation to dis-
continued development programs in the Healthcare business
sector.
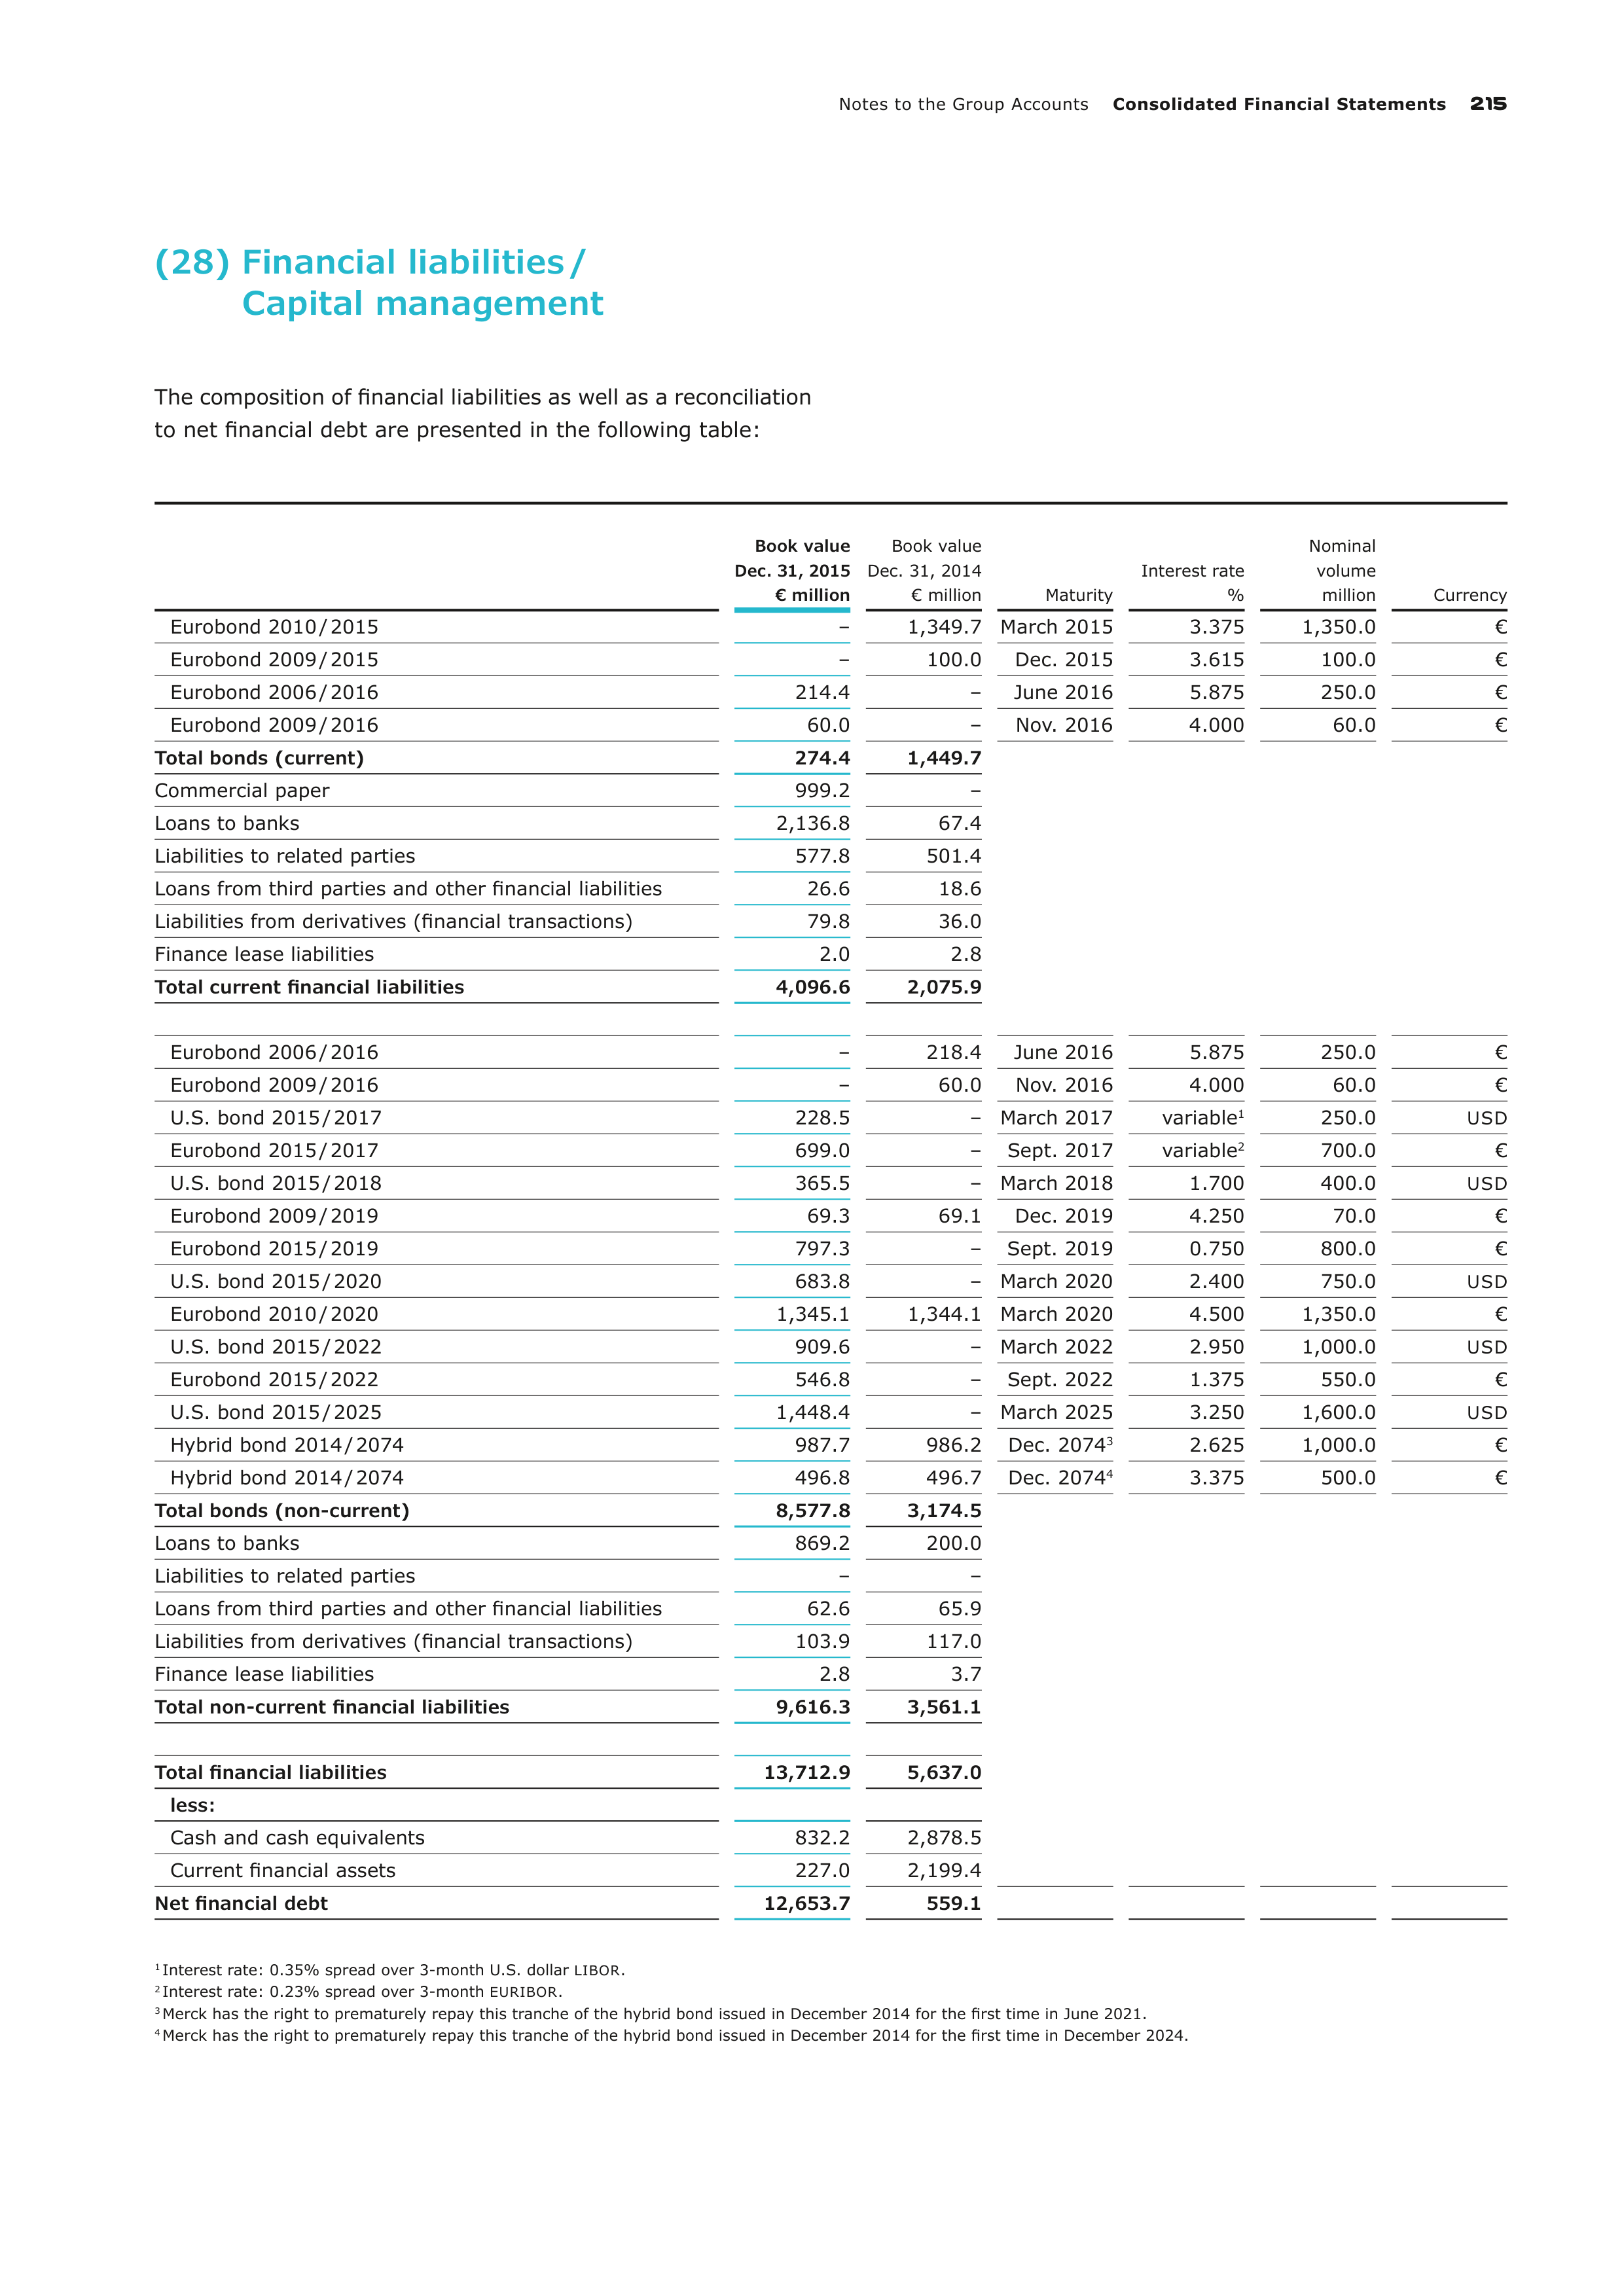
Notes to the Group Accounts
Consolidated Financial Statements
215
(28) Financial liabilities /
Capital management
The composition of financial liabilities as well as a reconciliation
to net financial debt are presented in the following table:
Book value
Dec. 31, 2015
€ million
Book value
Dec. 31, 2014
€ million
Maturity
Interest rate
%
Nominal
volume
million
Currency
Eurobond 2010 / 2015
–
1,349.7
March 2015
3.375
1,350.0
€
Eurobond 2009 / 2015
–
100.0
Dec. 2015
3.615
100.0
€
Eurobond 2006 / 2016
214.4
–
June 2016
5.875
250.0
€
Eurobond 2009 / 2016
60.0
–
Nov. 2016
4.000
60.0
€
Total bonds (current)
274.4
1,449.7
Commercial paper
999.2
–
Loans to banks
2,136.8
67.4
Liabilities to related parties
577.8
501.4
Loans from third parties and other financial liabilities
26.6
18.6
Liabilities from derivatives (financial transactions)
79.8
36.0
Finance lease liabilities
2.0
2.8
Total current financial liabilities
4,096.6
2,075.9
Eurobond 2006 / 2016
–
218.4
June 2016
5.875
250.0
€
Eurobond 2009 / 2016
–
60.0
Nov. 2016
4.000
60.0
€
U.S. bond 2015 / 2017
228.5
– March 2017
variable
1
250.0
USD
Eurobond 2015 / 2017
699.0
–
Sept. 2017
variable
2
700.0
€
U.S. bond 2015 / 2018
365.5
– March 2018
1.700
400.0
USD
Eurobond 2009 / 2019
69.3
69.1
Dec. 2019
4.250
70.0
€
Eurobond 2015 / 2019
797.3
–
Sept. 2019
0.750
800.0
€
U.S. bond 2015 / 2020
683.8
– March 2020
2.400
750.0
USD
Eurobond 2010 / 2020
1,345.1
1,344.1
March 2020
4.500
1,350.0
€
U.S. bond 2015 / 2022
909.6
– March 2022
2.950
1,000.0
USD
Eurobond 2015 / 2022
546.8
–
Sept. 2022
1.375
550.0
€
U.S. bond 2015 / 2025
1,448.4
– March 2025
3.250
1,600.0
USD
Hybrid bond 2014 / 2074
987.7
986.2
Dec. 2074
3
2.625
1,000.0
€
Hybrid bond 2014 / 2074
496.8
496.7
Dec. 2074
4
3.375
500.0
€
Total bonds (non-current)
8,577.8
3,174.5
Loans to banks
869.2
200.0
Liabilities to related parties
–
–
Loans from third parties and other financial liabilities
62.6
65.9
Liabilities from derivatives (financial transactions)
103.9
117.0
Finance lease liabilities
2.8
3.7
Total non-current financial liabilities
9,616.3
3,561.1
Total financial liabilities
13,712.9
5,637.0
less:
Cash and cash equivalents
832.2
2,878.5
Current financial assets
227.0
2,199.4
Net financial debt
12,653.7
559.1
1
Interest rate: 0.35% spread over 3-month U.S. dollar
LIBOR
.
2
Interest rate: 0.23% spread over 3-month
EURIBOR
.
3
Merck has the right to prematurely repay this tranche of the hybrid bond issued in December 2014 for the first time in June 2021.
4
Merck has the right to prematurely repay this tranche of the hybrid bond issued in December 2014 for the first time in December 2024.
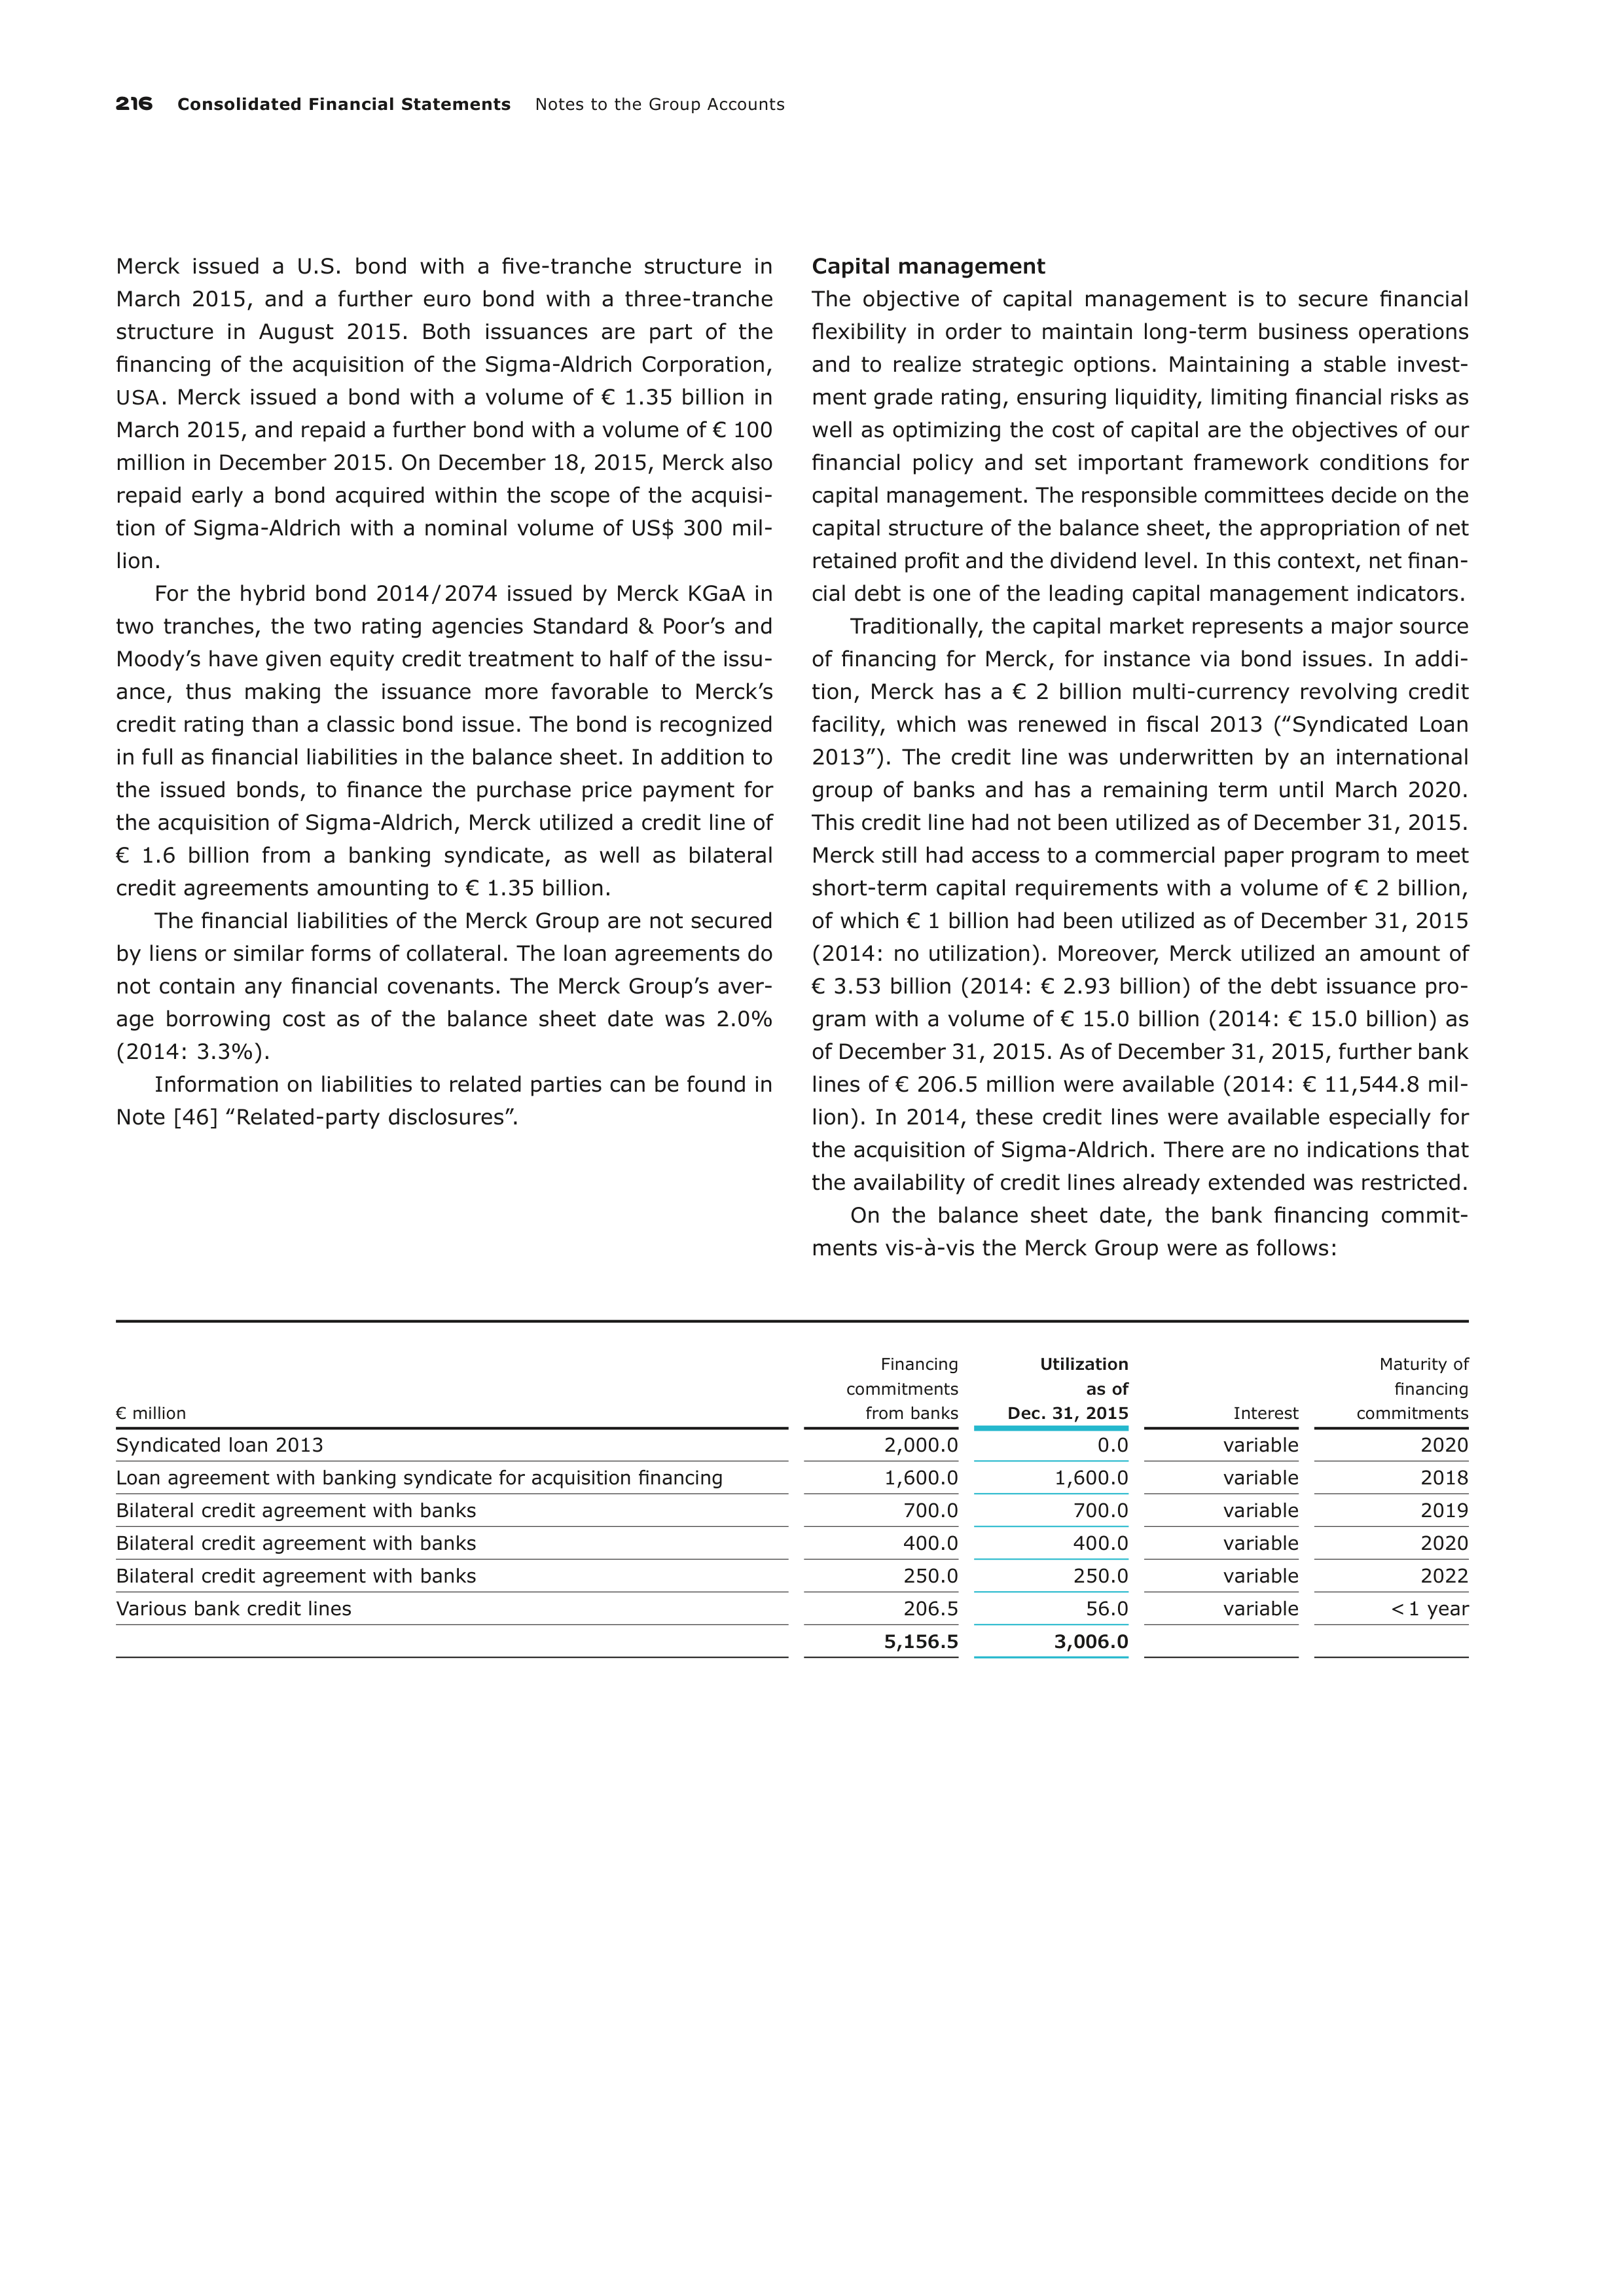
216
Consolidated Financial Statements
Notes to the Group Accounts
Merck issued a U.S. bond with a five-tranche structure in
March 2015, and a further euro bond with a three-tranche
structure in August 2015. Both issuances are part of the
financing of the acquisition of the Sigma-Aldrich Corporation,
USA
. Merck issued a bond with a volume of € 1.35 billion in
March 2015, and repaid a further bond with a volume of € 100
million in December 2015. On December 18, 2015, Merck also
repaid early a bond acquired within the scope of the acquisi-
tion of Sigma-Aldrich with a nominal volume of US$ 300 mil-
lion.
For the hybrid bond 2014 / 2074 issued by Merck KGaA in
two tranches, the two rating agencies Standard & Poor’s and
Moody’s have given equity credit treatment to half of the issu-
ance, thus making the issuance more favorable to Merck’s
credit rating than a classic bond issue. The bond is recognized
in full as financial liabilities in the balance sheet. In addition to
the issued bonds, to finance the purchase price payment for
the acquisition of Sigma-Aldrich, Merck utilized a credit line of
€ 1.6 billion from a banking syndicate, as well as bilateral
credit agreements amounting to € 1.35 billion.
The financial liabilities of the Merck Group are not secured
by liens or similar forms of collateral. The loan agreements do
not contain any financial covenants. The Merck Group’s aver-
age borrowing cost as of the balance sheet date was 2.0%
(2014: 3.3%).
Information on liabilities to related parties can be found in
Note [46] ‟Related-party disclosures”.
Capital management
The objective of capital management is to secure financial
flexibility in order to maintain long-term business operations
and to realize strategic options. Maintaining a stable invest-
ment grade rating, ensuring liquidity, limiting financial risks as
well as optimizing the cost of capital are the objectives of our
financial policy and set important framework conditions for
capital management. The responsible committees decide on the
capital structure of the balance sheet, the appropriation of net
retained profit and the dividend level. In this context, net finan-
cial
debt is one of the leading capital management indicators.
Traditionally, the capital market represents a major source
of financing for Merck, for instance via bond issues. In addi-
tion, Merck has a € 2 billion multi-currency revolving credit
facility, which was renewed in fiscal 2013 (‟Syndicated Loan
2013”). The credit line was underwritten by an international
group of banks and has a remaining term until March 2020.
This credit line had not been utilized as of December 31, 2015.
Merck still had access to a commercial paper program to meet
short-term capital requirements with a volume of € 2 billion,
of
which € 1 billion had been utilized as of December 31,
2015
(2014: no utilization). Moreover, Merck utilized an amount of
€ 3.53 billion (2014: € 2.93 billion) of the debt issuance pro-
gram with a volume of € 15.0 billion (2014: € 15.0 billion) as
of December 31, 2015. As of December 31, 2015, further bank
lines of € 206.5 million were available (2014: € 11,544.8 mil-
lion). In 2014, these credit lines were available especially for
the acquisition of Sigma-Aldrich. There are no indications that
the availability of credit lines already extended was restricted.
On the balance sheet date, the bank financing commit-
ments vis-à-vis the Merck Group were as follows:
€ million
Financing
commitments
from banks
Utilization
as of
Dec. 31, 2015
Interest
Maturity of
financing
commitments
Syndicated loan 2013
2,000.0
0.0
variable
2020
Loan agreement with banking syndicate for acquisition financing
1,600.0
1,600.0
variable
2018
Bilateral credit agreement with banks
700.0
700.0
variable
2019
Bilateral credit agreement with banks
400.0
400.0
variable
2020
Bilateral credit agreement with banks
250.0
250.0
variable
2022
Various bank credit lines
206.5
56.0
variable
< 1 year
5,156.5
3,006.0
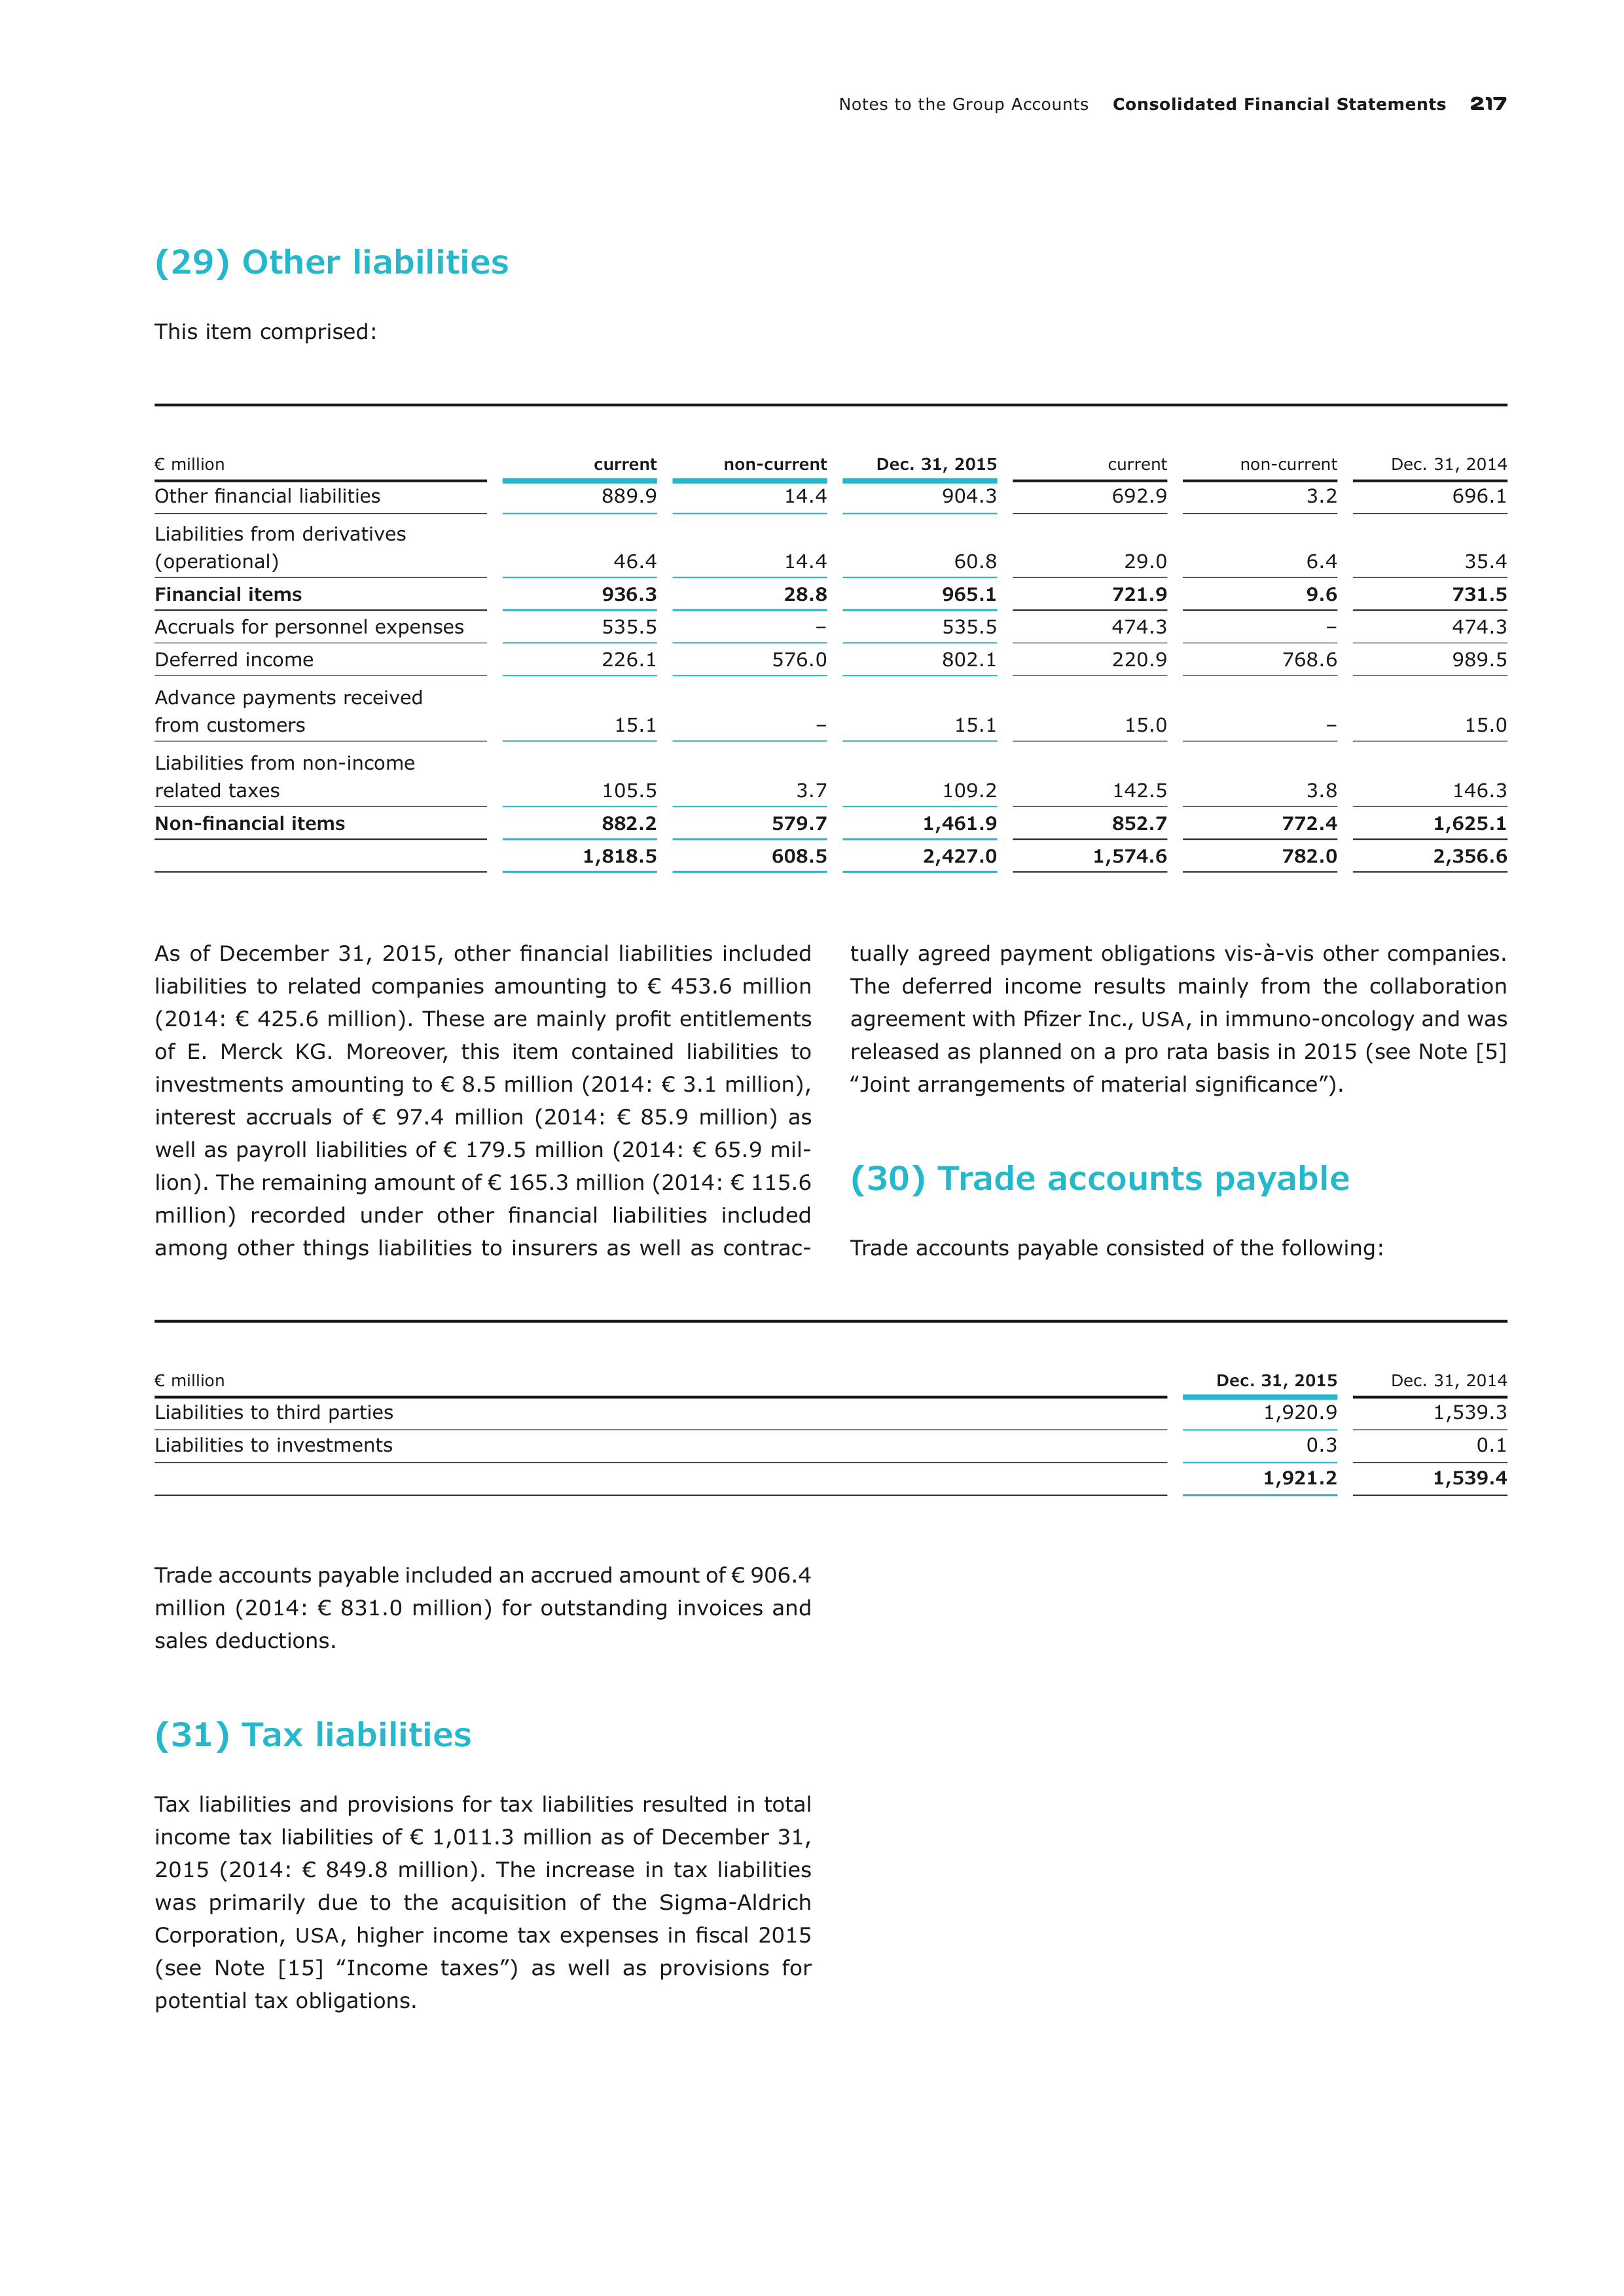
Notes to the Group Accounts
Consolidated Financial Statements
217
(29) Other liabilities
This item comprised:
€ million
current
non-current
Dec. 31, 2015
current
non-current
Dec. 31, 2014
Other financial liabilities
889.9
14.4
904.3
692.9
3.2
696.1
Liabilities from derivatives
(operational)
46.4
14.4
60.8
29.0
6.4
35.4
Financial items
936.3
28.8
965.1
721.9
9.6
731.5
Accruals for personnel expenses
535.5
–
535.5
474.3
–
474.3
Deferred income
226.1
576.0
802.1
220.9
768.6
989.5
Advance payments received
from customers
15.1
–
15.1
15.0
–
15.0
Liabilities from non-income
related taxes
105.5
3.7
109.2
142.5
3.8
146.3
Non-financial items
882.2
579.7
1,461.9
852.7
772.4
1,625.1
1,818.5
608.5
2,427.0
1,574.6
782.0
2,356.6
As of December 31, 2015, other financial liabilities included
liabilities to related companies amounting to € 453.6 million
(2014: € 425.6 million). These are mainly profit entitlements
of E. Merck KG. Moreover, this item contained liabilities to
investments amounting to € 8.5 million (2014: € 3.1 million),
interest accruals of € 97.4 million (2014: € 85.9 million) as
well as payroll liabilities of € 179.5 million (2014: € 65.9 mil-
lion). The remaining amount of € 165.3 million (2014: € 115.6
million) recorded under other financial liabilities included
among other things liabilities to insurers as well as contrac
tu
ally agreed payment obligations vis-à-vis other companies.
The deferred income results mainly from the collaboration
agreement with Pfizer Inc.,
USA
, in immuno-oncology and was
released as planned on a pro rata basis in 2015 (see Note [5]
‟Joint arrangements of material significance”).
(30) Trade accounts payable
Trade accounts payable consisted of the following:
€ million
Dec. 31, 2015
Dec. 31, 2014
Liabilities to third parties
1,920.9
1,539.3
Liabilities to investments
0.3
0.1
1,921.2
1,539.4
Trade accounts payable included an accrued amount of € 906.4
million (2014: € 831.0 million) for outstanding invoices and
sales deductions.
(31) Tax liabilities
Tax liabilities and provisions for tax liabilities resulted in total
income tax liabilities of € 1,011.3 million as of December 31,
2015 (2014: € 849.8 million). The increase in tax liabilities
was primarily due to the acquisition of the Sigma-Aldrich
Corporation,
USA
, higher income tax expenses in fiscal 2015
(see Note [15] ‟Income taxes”) as well as provisions for
potential tax obligations.
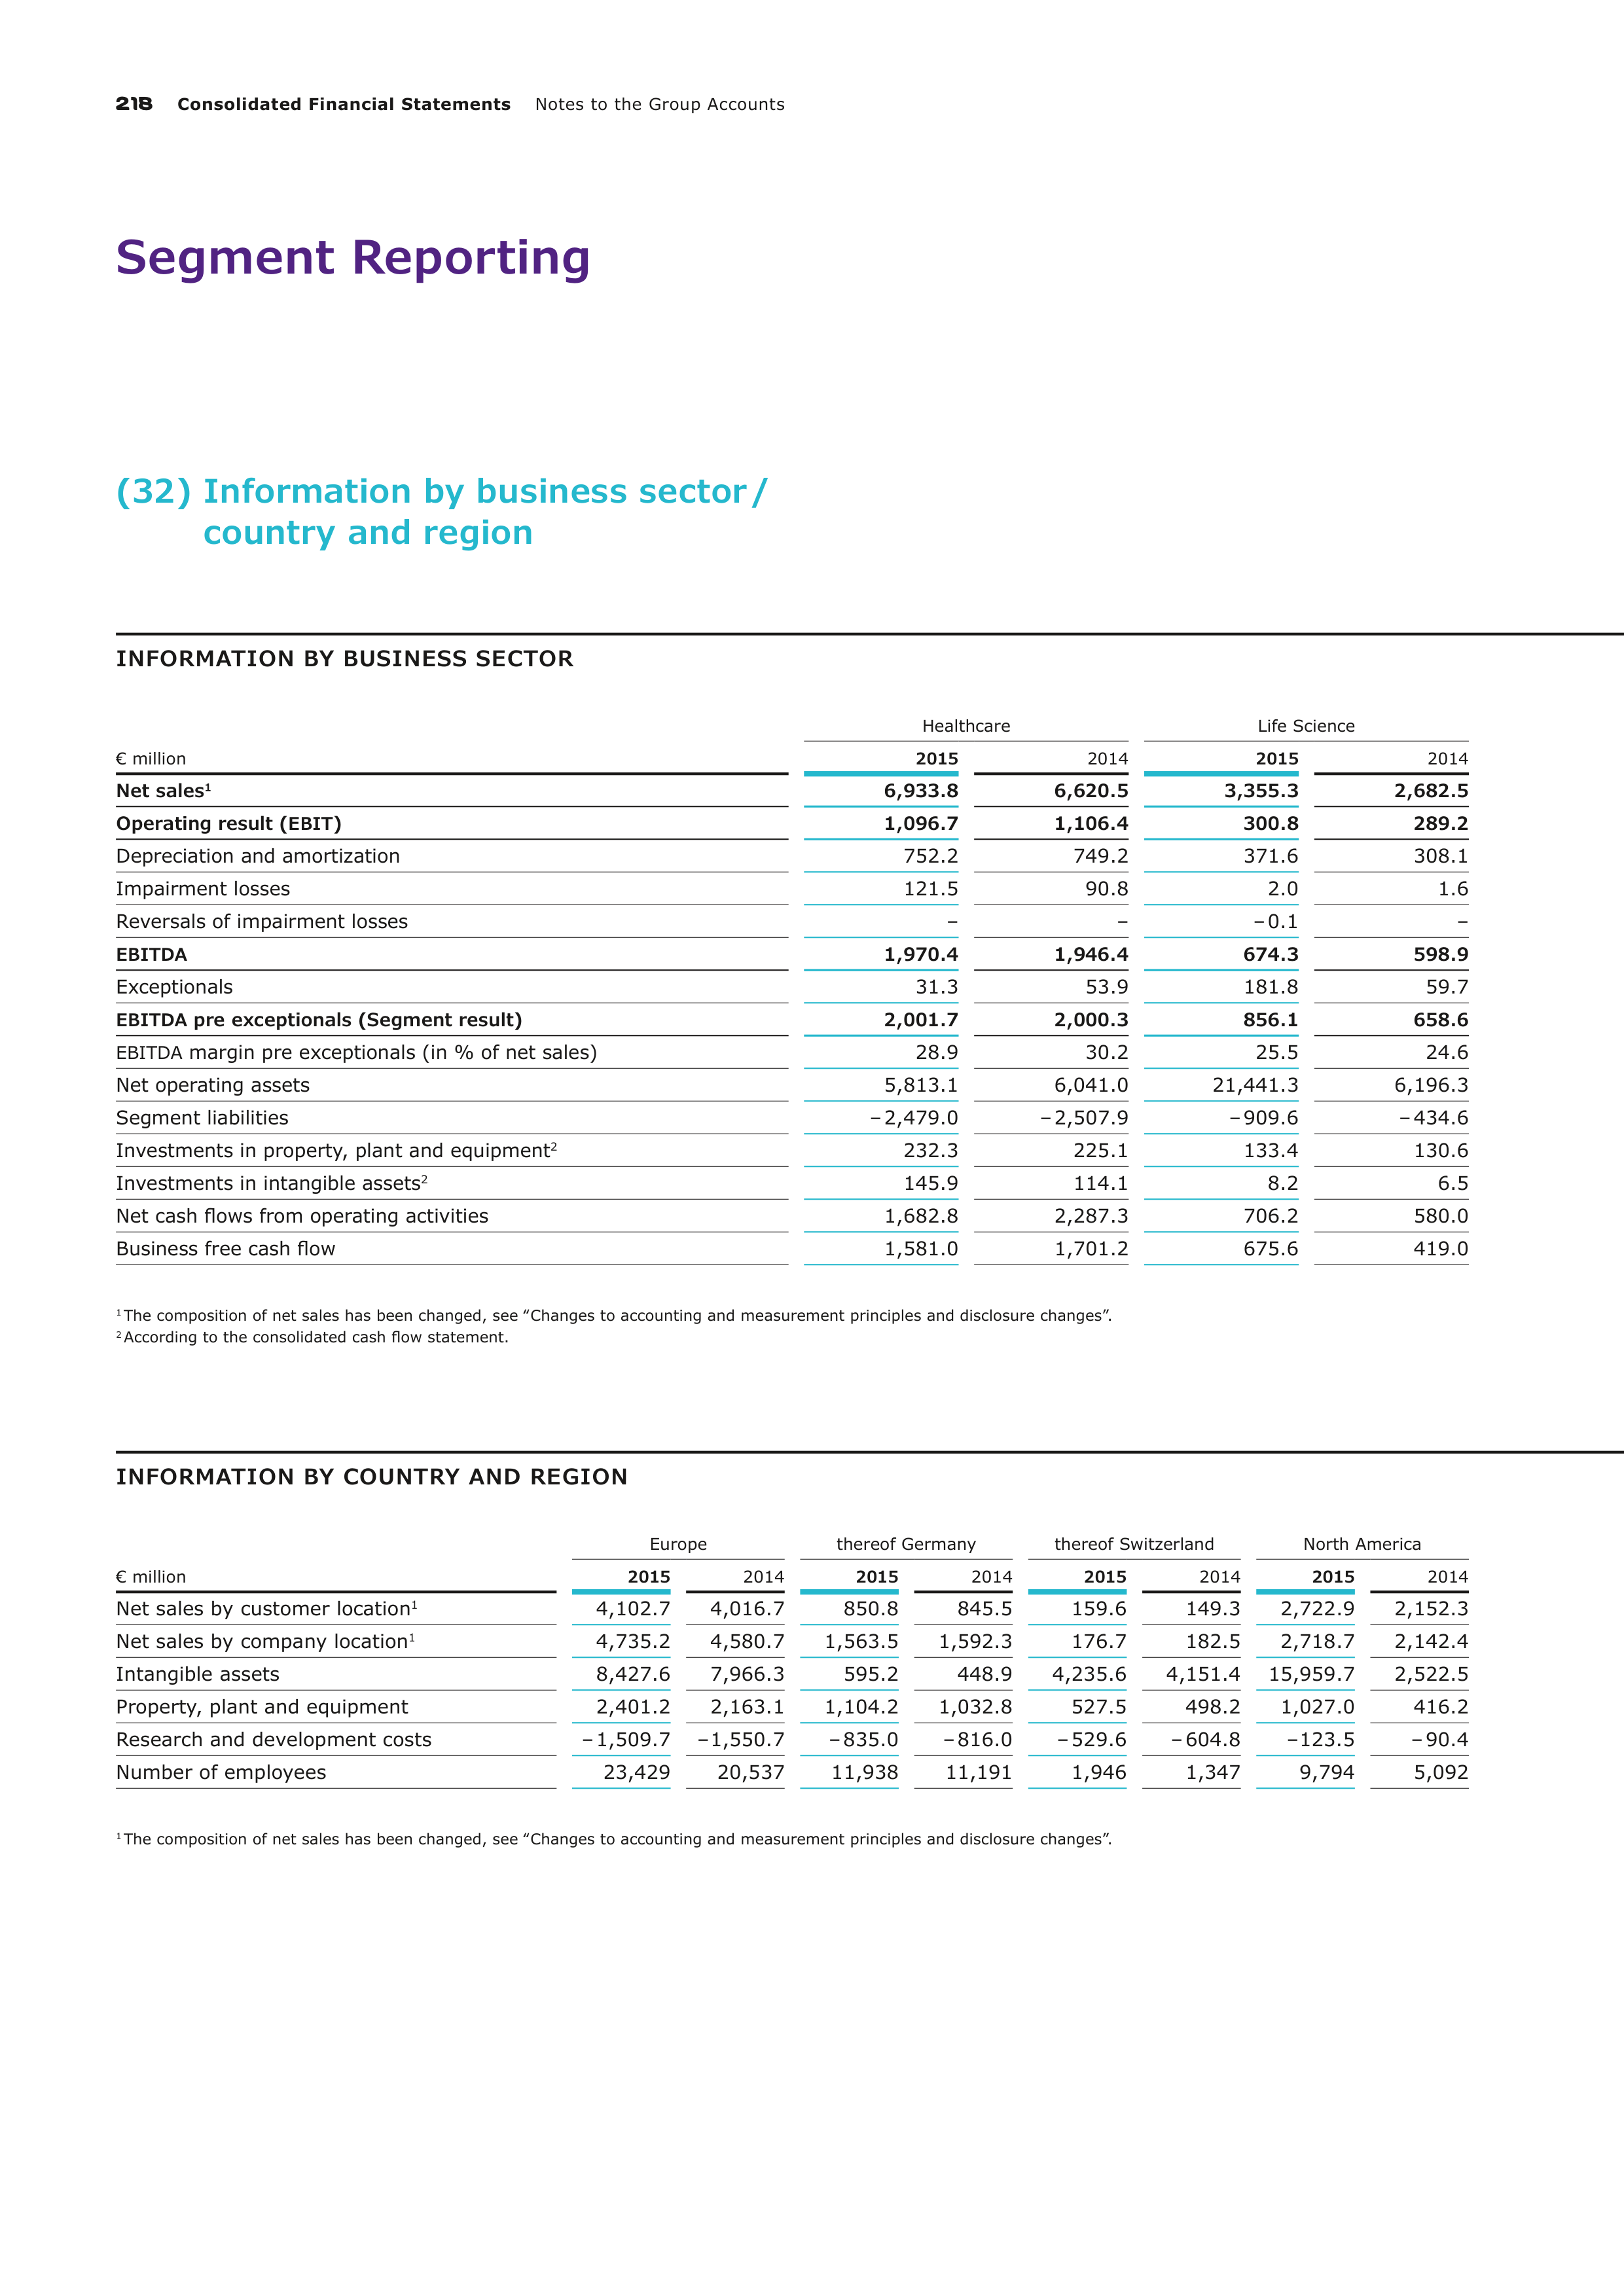
218
Consolidated Financial Statements
Notes to the Group Accounts
Segment Reporting
(32) Information by business sector /
country and region
INFORMATION BY BUSINESS SECTOR
€ million
Healthcare
Life Science
2015
2014
2015
2014
Net sales
1
6,933.8
6,620.5
3,355.3
2,682.5
Operating result (
EBIT
)
1,096.7
1,106.4
300.8
289.2
Depreciation and amortization
752.2
749.2
371.6
308.1
Impairment losses
121.5
90.8
2.0
1.6
Reversals of impairment losses
–
–
– 0.1
–
EBITDA
1,970.4
1,946.4
674.3
598.9
Exceptionals
31.3
53.9
181.8
59.7
EBITDA
pre exceptionals (Segment result)
2,001.7
2,000.3
856.1
658.6
EBITDA
margin pre exceptionals (in % of net sales)
28.9
30.2
25.5
24.6
Net operating assets
5,813.1
6,041.0
21,441.3
6,196.3
Segment liabilities
– 2,479.0
– 2,507.9
– 909.6
– 434.6
Investments in property, plant and equipment
2
232.3
225.1
133.4
130.6
Investments in intangible assets
2
145.9
114.1
8.2
6.5
Net cash flows from operating activities
1,682.8
2,287.3
706.2
580.0
Business free cash flow
1,581.0
1,701.2
675.6
419.0
1
The composition of net sales has been changed, see ‟Changes to accounting and measurement principles and disclosure changes”.
2
According to the consolidated cash flow statement.
INFORMATION BY COUNTRY AND REGION
€ million
Europe
thereof Germany
thereof Switzerland
North America
2015
2014
2015
2014
2015
2014
2015
2014
Net sales by customer location
1
4,102.7
4,016.7
850.8
845.5
159.6
149.3
2,722.9
2,152.3
Net sales by company location
1
4,735.2
4,580.7
1,563.5
1,592.3
176.7
182.5
2,718.7
2,142.4
Intangible assets
8,427.6
7,966.3
595.2
448.9
4,235.6
4,151.4
15,959.7
2,522.5
Property, plant and equipment
2,401.2
2,163.1
1,104.2
1,032.8
527.5
498.2
1,027.0
416.2
Research and development costs
– 1,509.7
– 1,550.7
– 835.0
– 816.0
– 529.6
– 604.8
– 123.5
– 90.4
Number of employees
23,429
20,537
11,938
11,191
1,946
1,347
9,794
5,092
1
The composition of net sales has been changed, see ‟Changes to accounting and measurement principles and disclosure changes”.
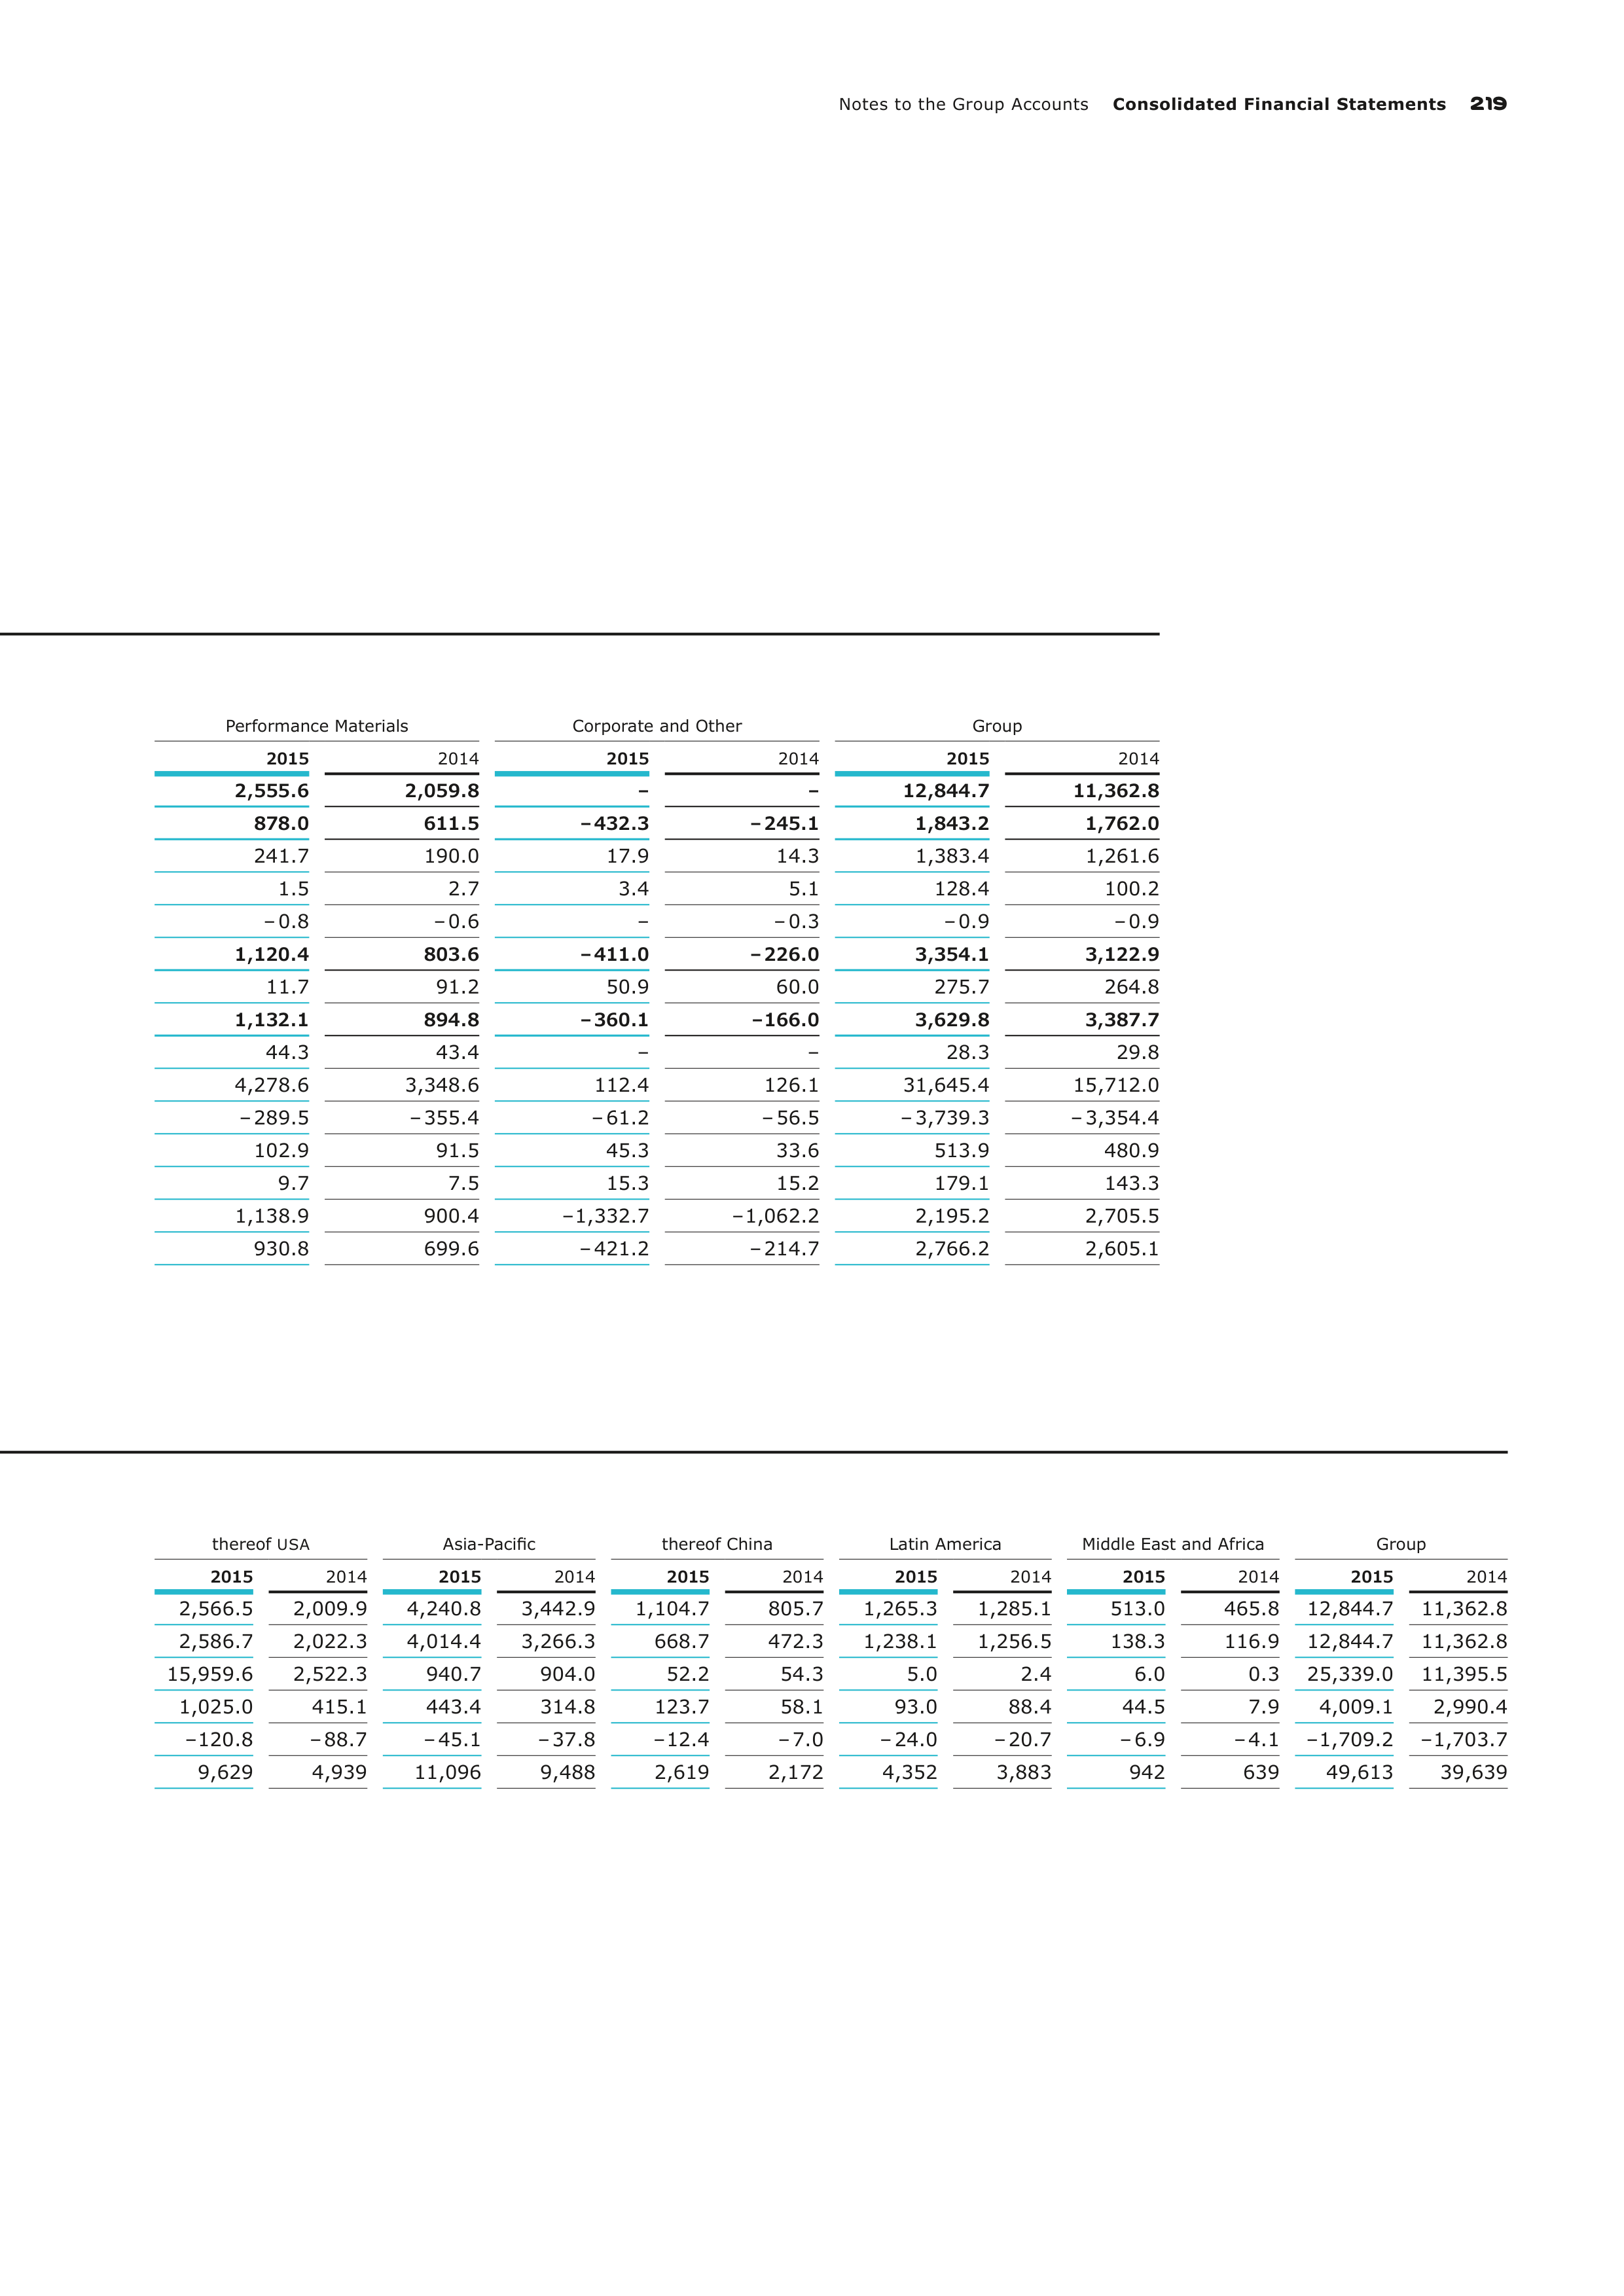
Notes to the Group Accounts
Consolidated Financial Statements
219
Performance Materials
Corporate and Other
Group
2015
2014
2015
2014
2015
2014
2,555.6
2,059.8
–
–
12,844.7
11,362.8
878.0
611.5
– 432.3
– 245.1
1,843.2
1,762.0
241.7
190.0
17.9
14.3
1,383.4
1,261.6
1.5
2.7
3.4
5.1
128.4
100.2
– 0.8
– 0.6
–
– 0.3
– 0.9
– 0.9
1,120.4
803.6
– 411.0
– 226.0
3,354.1
3,122.9
11.7
91.2
50.9
60.0
275.7
264.8
1,132.1
894.8
– 360.1
– 166.0
3,629.8
3,387.7
44.3
43.4
–
–
28.3
29.8
4,278.6
3,348.6
112.4
126.1
31,645.4
15,712.0
– 289.5
– 355.4
– 61.2
– 56.5
– 3,739.3
– 3,354.4
102.9
91.5
45.3
33.6
513.9
480.9
9.7
7.5
15.3
15.2
179.1
143.3
1,138.9
900.4
– 1,332.7
– 1,062.2
2,195.2
2,705.5
930.8
699.6
– 421.2
– 214.7
2,766.2
2,605.1
thereof
USA
Asia-Pacific
thereof China
Latin America
Middle East and Africa
Group
2015
2014
2015
2014
2015
2014
2015
2014
2015
2014
2015
2014
2,566.5
2,009.9
4,240.8
3,442.9
1,104.7
805.7
1,265.3
1,285.1
513.0
465.8
12,844.7
11,362.8
2,586.7
2,022.3
4,014.4
3,266.3
668.7
472.3
1,238.1
1,256.5
138.3
116.9
12,844.7
11,362.8
15,959.6
2,522.3
940.7
904.0
52.2
54.3
5.0
2.4
6.0
0.3
25,339.0
11,395.5
1,025.0
415.1
443.4
314.8
123.7
58.1
93.0
88.4
44.5
7.9
4,009.1
2,990.4
– 120.8
– 88.7
– 45.1
– 37.8
– 12.4
– 7.0
– 24.0
– 20.7
– 6.9
– 4.1
– 1,709.2
– 1,703.7
9,629
4,939
11,096
9,488
2,619
2,172
4,352
3,883
942
639
49,613
39,639
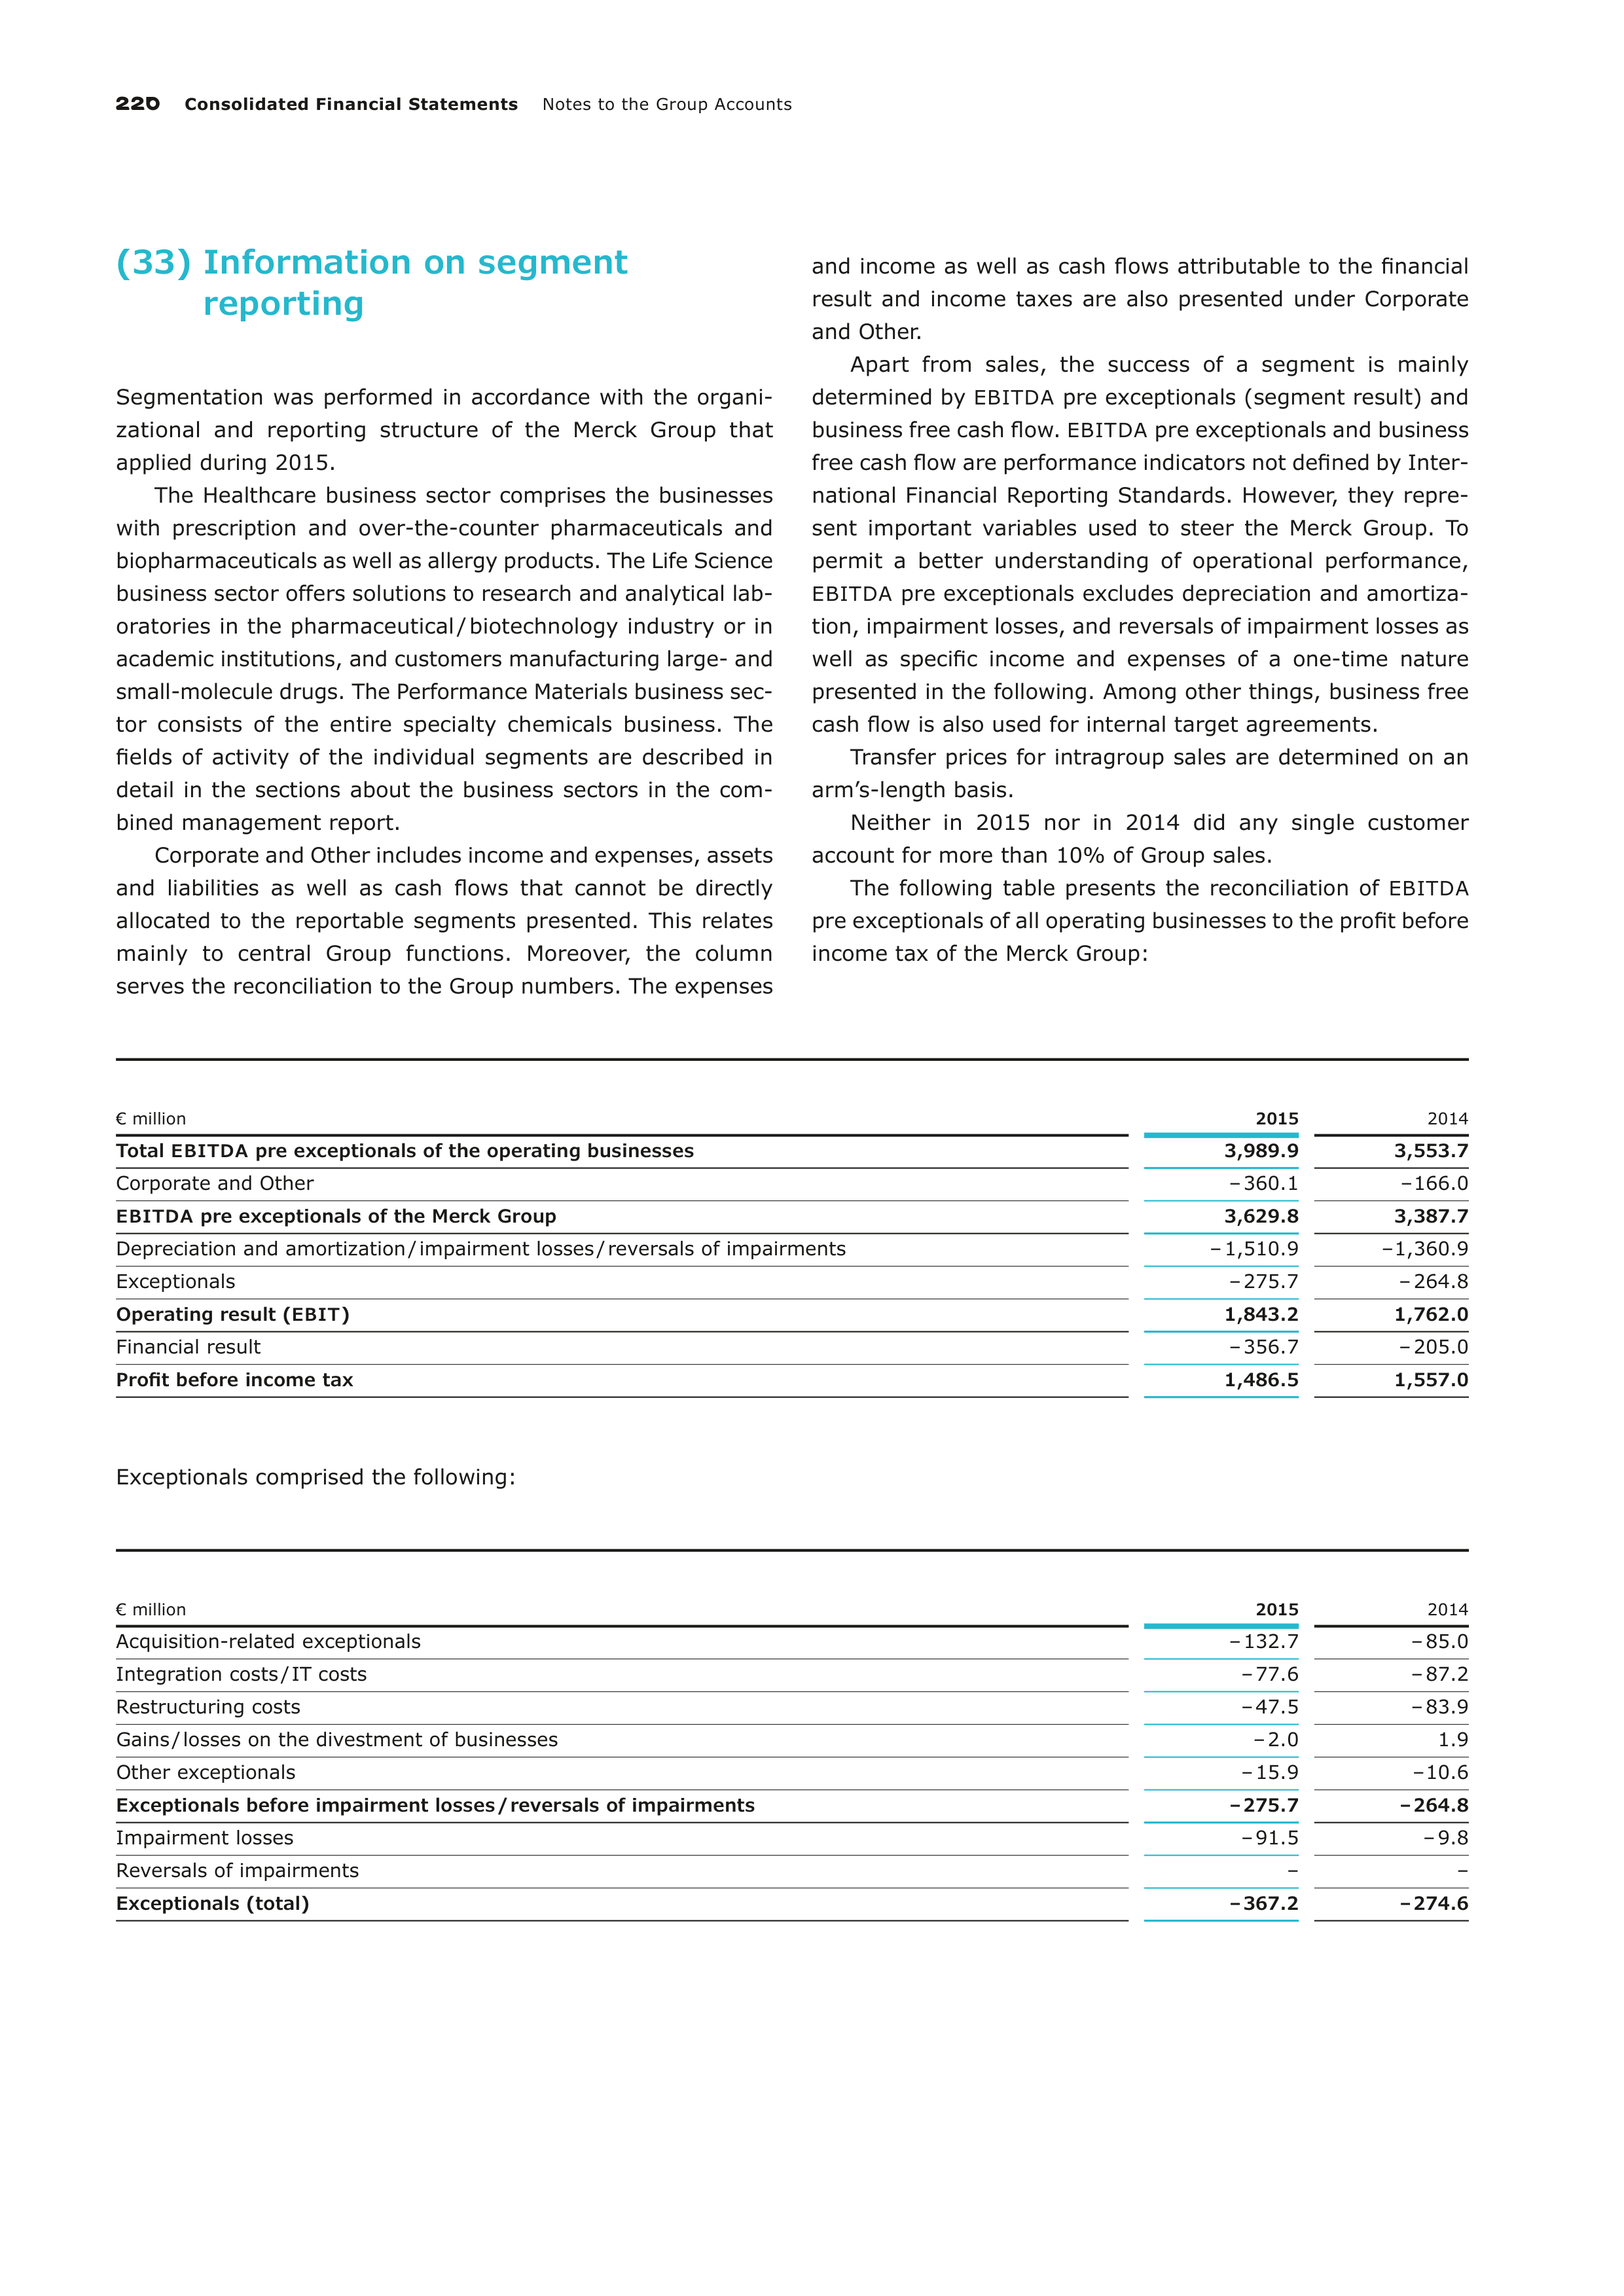
220
Consolidated Financial Statements
Notes to the Group Accounts
(33) Information on segment
reporting
Segmentation was performed in accordance with the organi-
zational and reporting structure of the Merck Group that
applied during 2015.
The Healthcare business sector comprises the businesses
with prescription and over-the-counter pharmaceuticals and
biopharmaceuticals as well as allergy products. The Life Science
business sector offers solutions to research and analytical lab-
oratories in the pharmaceutical / biotechnology industry or in
academic institutions, and customers manufacturing large- and
small-molecule drugs. The Performance Materials business sec-
tor consists of the entire specialty chemicals business. The
fields of activity of the individual segments are described in
detail in the sections about the business sectors in the com-
bined management report.
Corporate and Other includes income and expenses, assets
and liabilities as well as cash flows that cannot be directly
allocated to the reportable segments presented. This relates
mainly to central Group functions. Moreover, the column
serves the reconciliation to the Group numbers. The expenses
and income as well as cash flows attributable to the financial
result and income taxes are also presented under Corporate
and Other.
Apart from sales, the success of a segment is mainly
determined by
EBITDA
pre exceptionals (segment result) and
business free cash flow.
EBITDA
pre exceptionals and business
free cash flow are performance indicators not defined by Inter-
national Financial Reporting Standards. However, they repre-
sent important variables used to steer the Merck Group. To
permit a better understanding of operational performance,
EBITDA
pre exceptionals excludes depreciation and amortiza-
tion, impairment losses, and reversals of impairment losses as
well as specific income and expenses of a one-time nature
presented in the following. Among other things, business free
cash flow is also used for internal target agreements.
Transfer prices for intragroup sales are determined on an
arm’s-length basis.
Neither in 2015 nor in 2014 did any single customer
account for more than 10% of Group sales.
The following table presents the reconciliation of
EBITDA
pre exceptionals of all operating businesses to the profit before
income tax of the Merck Group:
€ million
2015
2014
Total
EBITDA
pre exceptionals of the operating businesses
3,989.9
3,553.7
Corporate and Other
– 360.1
– 166.0
EBITDA
pre exceptionals of the Merck Group
3,629.8
3,387.7
Depreciation and amortization / impairment losses / reversals of impairments
– 1,510.9
– 1,360.9
Exceptionals
– 275.7
– 264.8
Operating result (
EBIT
)
1,843.2
1,762.0
Financial result
– 356.7
– 205.0
Profit before income tax
1,486.5
1,557.0
Exceptionals comprised the following:
€ million
2015
2014
Acquisition-related exceptionals
– 132.7
– 85.0
Integration costs / IT costs
– 77.6
– 87.2
Restructuring costs
– 47.5
– 83.9
Gains / losses on the divestment of businesses
– 2.0
1.9
Other exceptionals
– 15.9
– 10.6
Exceptionals before impairment losses / reversals of impairments
– 275.7
– 264.8
Impairment losses
– 91.5
– 9.8
Reversals of impairments
–
–
Exceptionals (total)
– 367.2
– 274.6
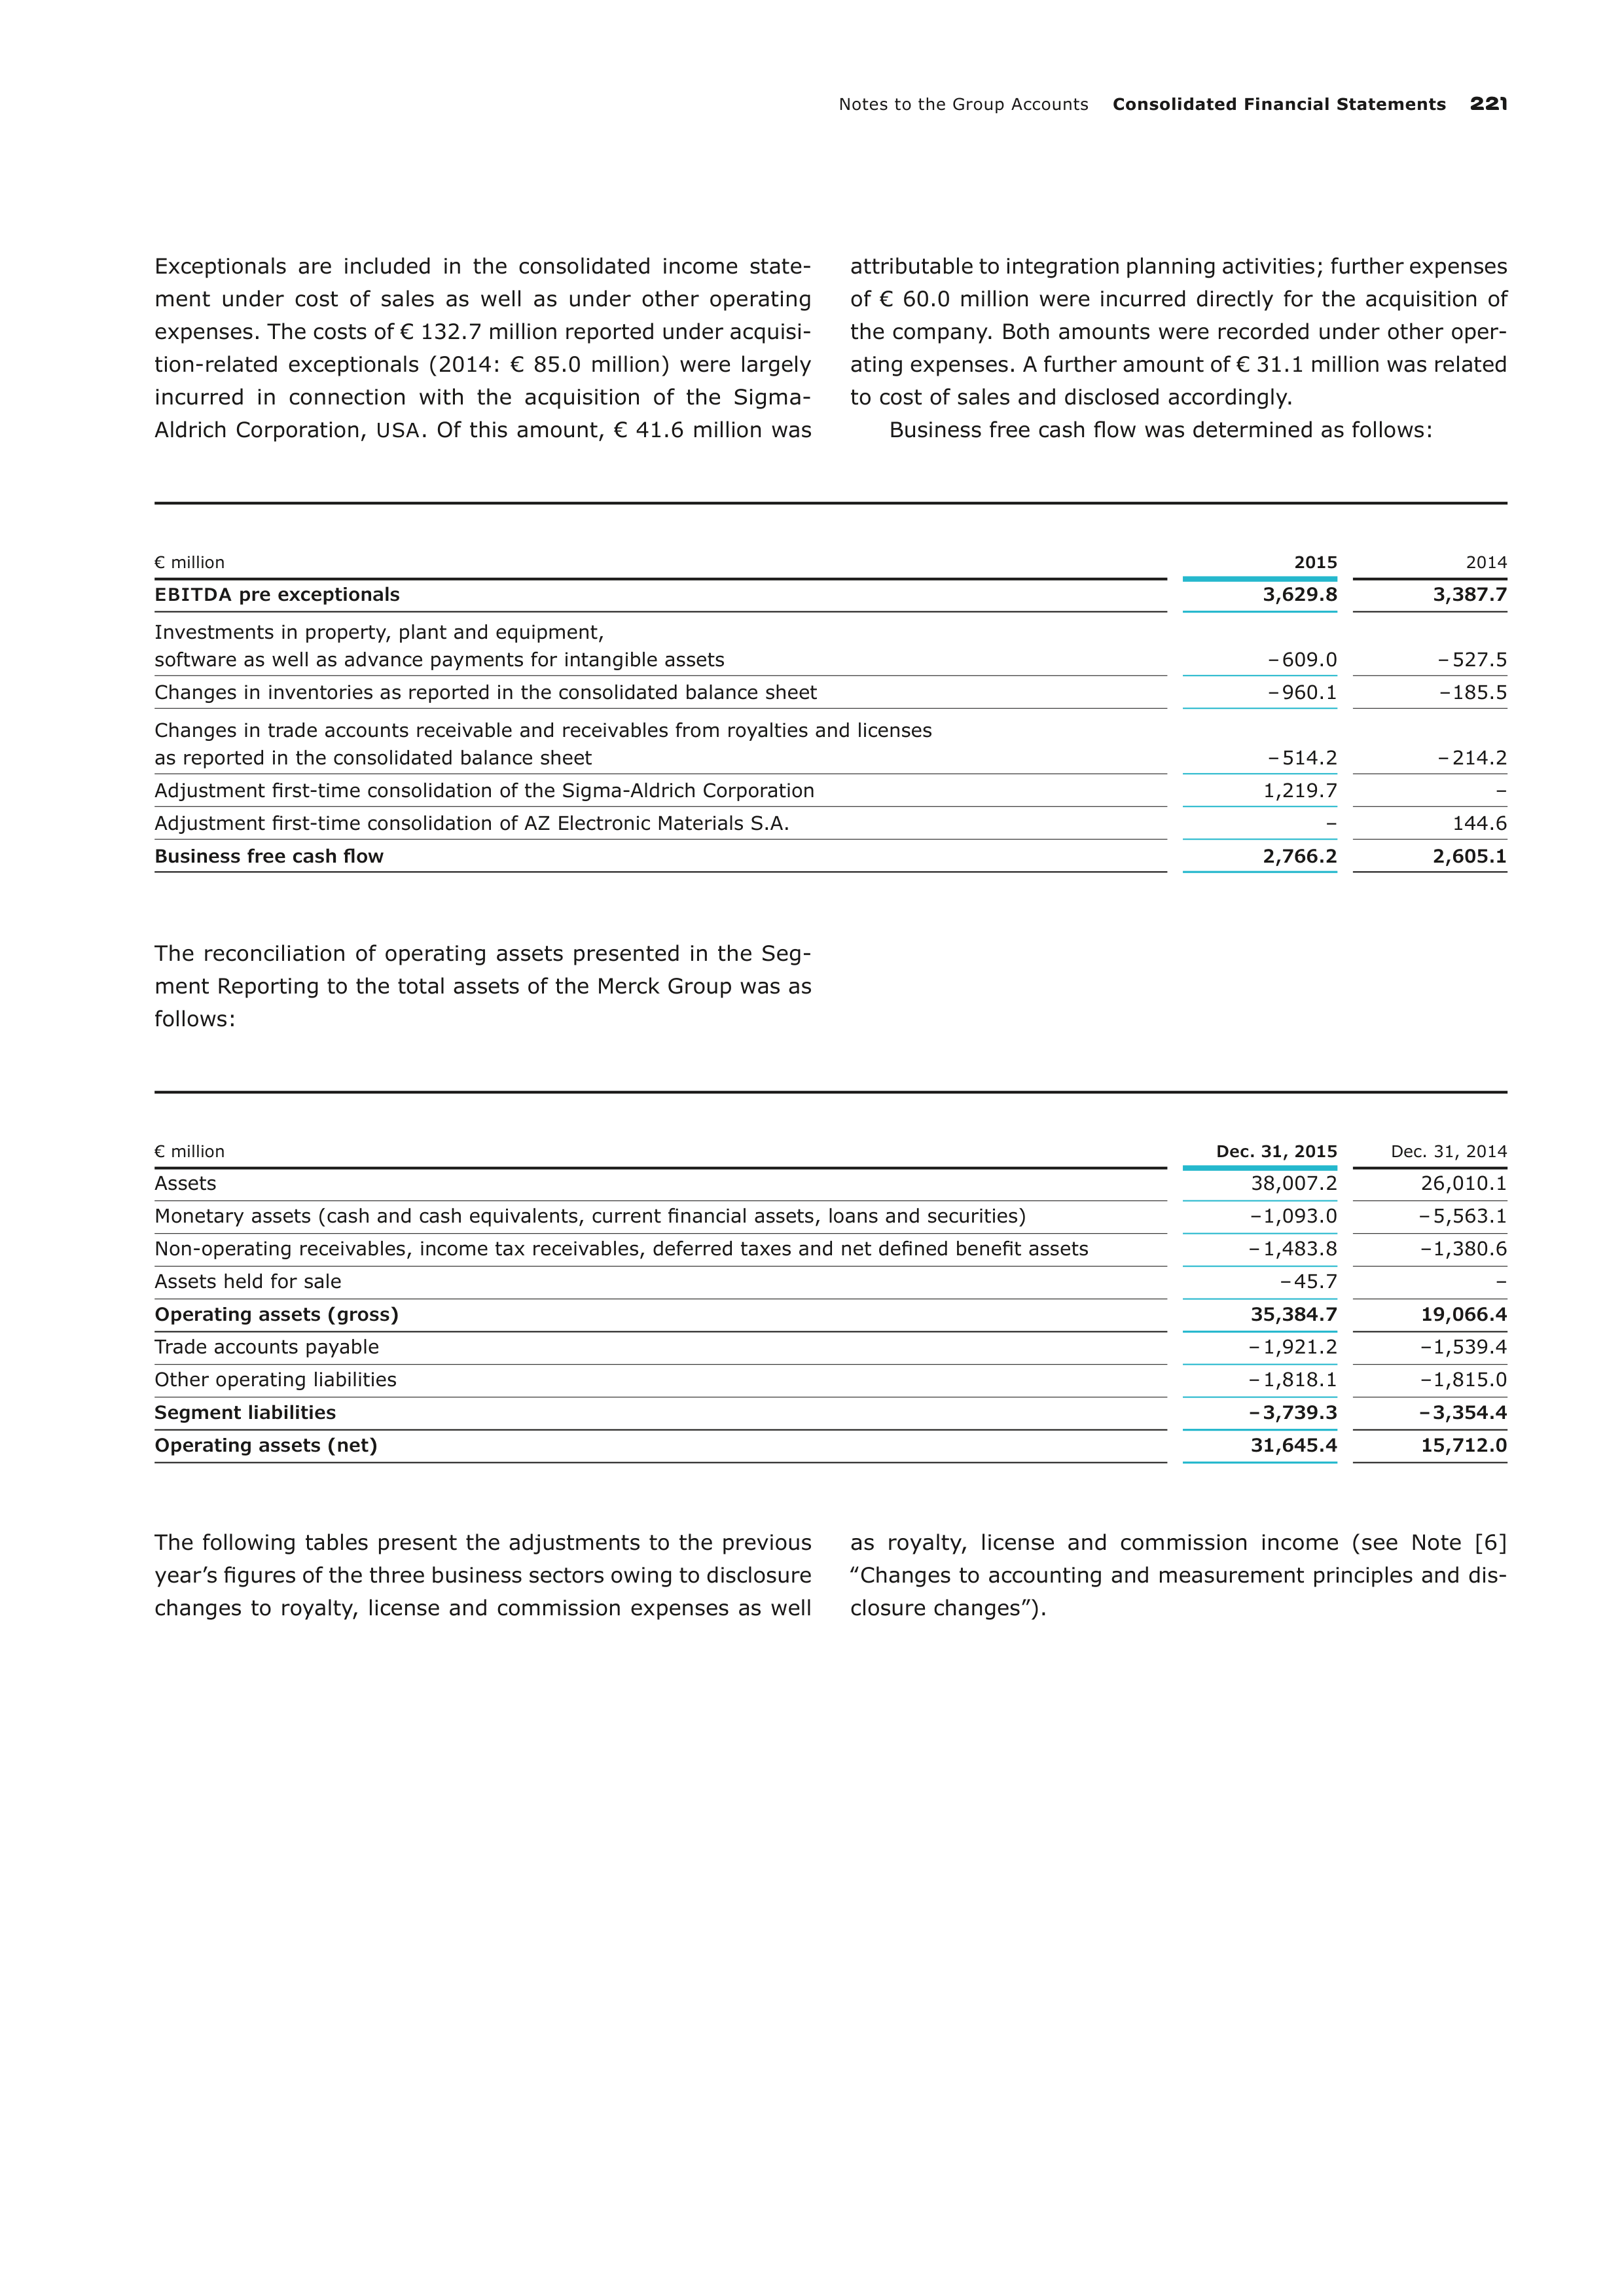
Notes to the Group Accounts
Consolidated Financial Statements
221
Exceptionals are included in the consolidated income state-
ment under cost of sales as well as under other operating
expenses. The costs of € 132.7 million reported under acquisi-
tion-related exceptionals (2014: € 85.0 million) were largely
incurred in connection with the acquisition of the Sigma-
Aldrich Corporation,
USA
. Of this amount, € 41.6 million was
attributable to integration planning activities; further expenses
of € 60.0 million were incurred directly for the acquisition of
the company. Both amounts were recorded under other oper-
ating expenses. A further amount of € 31.1 million was related
to cost of sales and disclosed accordingly.
Business free cash flow was determined as follows:
€ million
2015
2014
EBITDA
pre exceptionals
3,629.8
3,387.7
Investments in property, plant and equipment,
software as well as advance payments for intangible assets
– 609.0
– 527.5
Changes in inventories as reported in the consolidated balance sheet
– 960.1
– 185.5
Changes in trade accounts receivable and receivables from royalties and licenses
as reported in the consolidated balance sheet
– 514.2
– 214.2
Adjustment first-time consolidation of the Sigma-Aldrich Corporation
1,219.7
–
Adjustment first-time consolidation of AZ Electronic Materials S.A.
–
144.6
Business free cash flow
2,766.2
2,605.1
The reconciliation of operating assets presented in the Seg-
ment Reporting to the total assets of the Merck Group was as
follows:
€ million
Dec. 31, 2015
Dec. 31, 2014
Assets
38,007.2
26,010.1
Monetary assets (cash and cash equivalents, current financial assets, loans and securities)
– 1,093.0
– 5,563.1
Non-operating receivables, income tax receivables, deferred taxes and net defined benefit assets
– 1,483.8
– 1,380.6
Assets held for sale
– 45.7
–
Operating assets (gross)
35,384.7
19,066.4
Trade accounts payable
– 1,921.2
– 1,539.4
Other operating liabilities
– 1,818.1
– 1,815.0
Segment liabilities
– 3,739.3
– 3,354.4
Operating assets (net)
31,645.4
15,712.0
The following tables present the adjustments to the previous
year’s figures of the three business sectors owing to disclosure
changes to royalty, license and commission expenses as well
as royalty, license and commission income (see Note [6]
‟Changes to accounting and measurement principles and dis-
closure changes”).
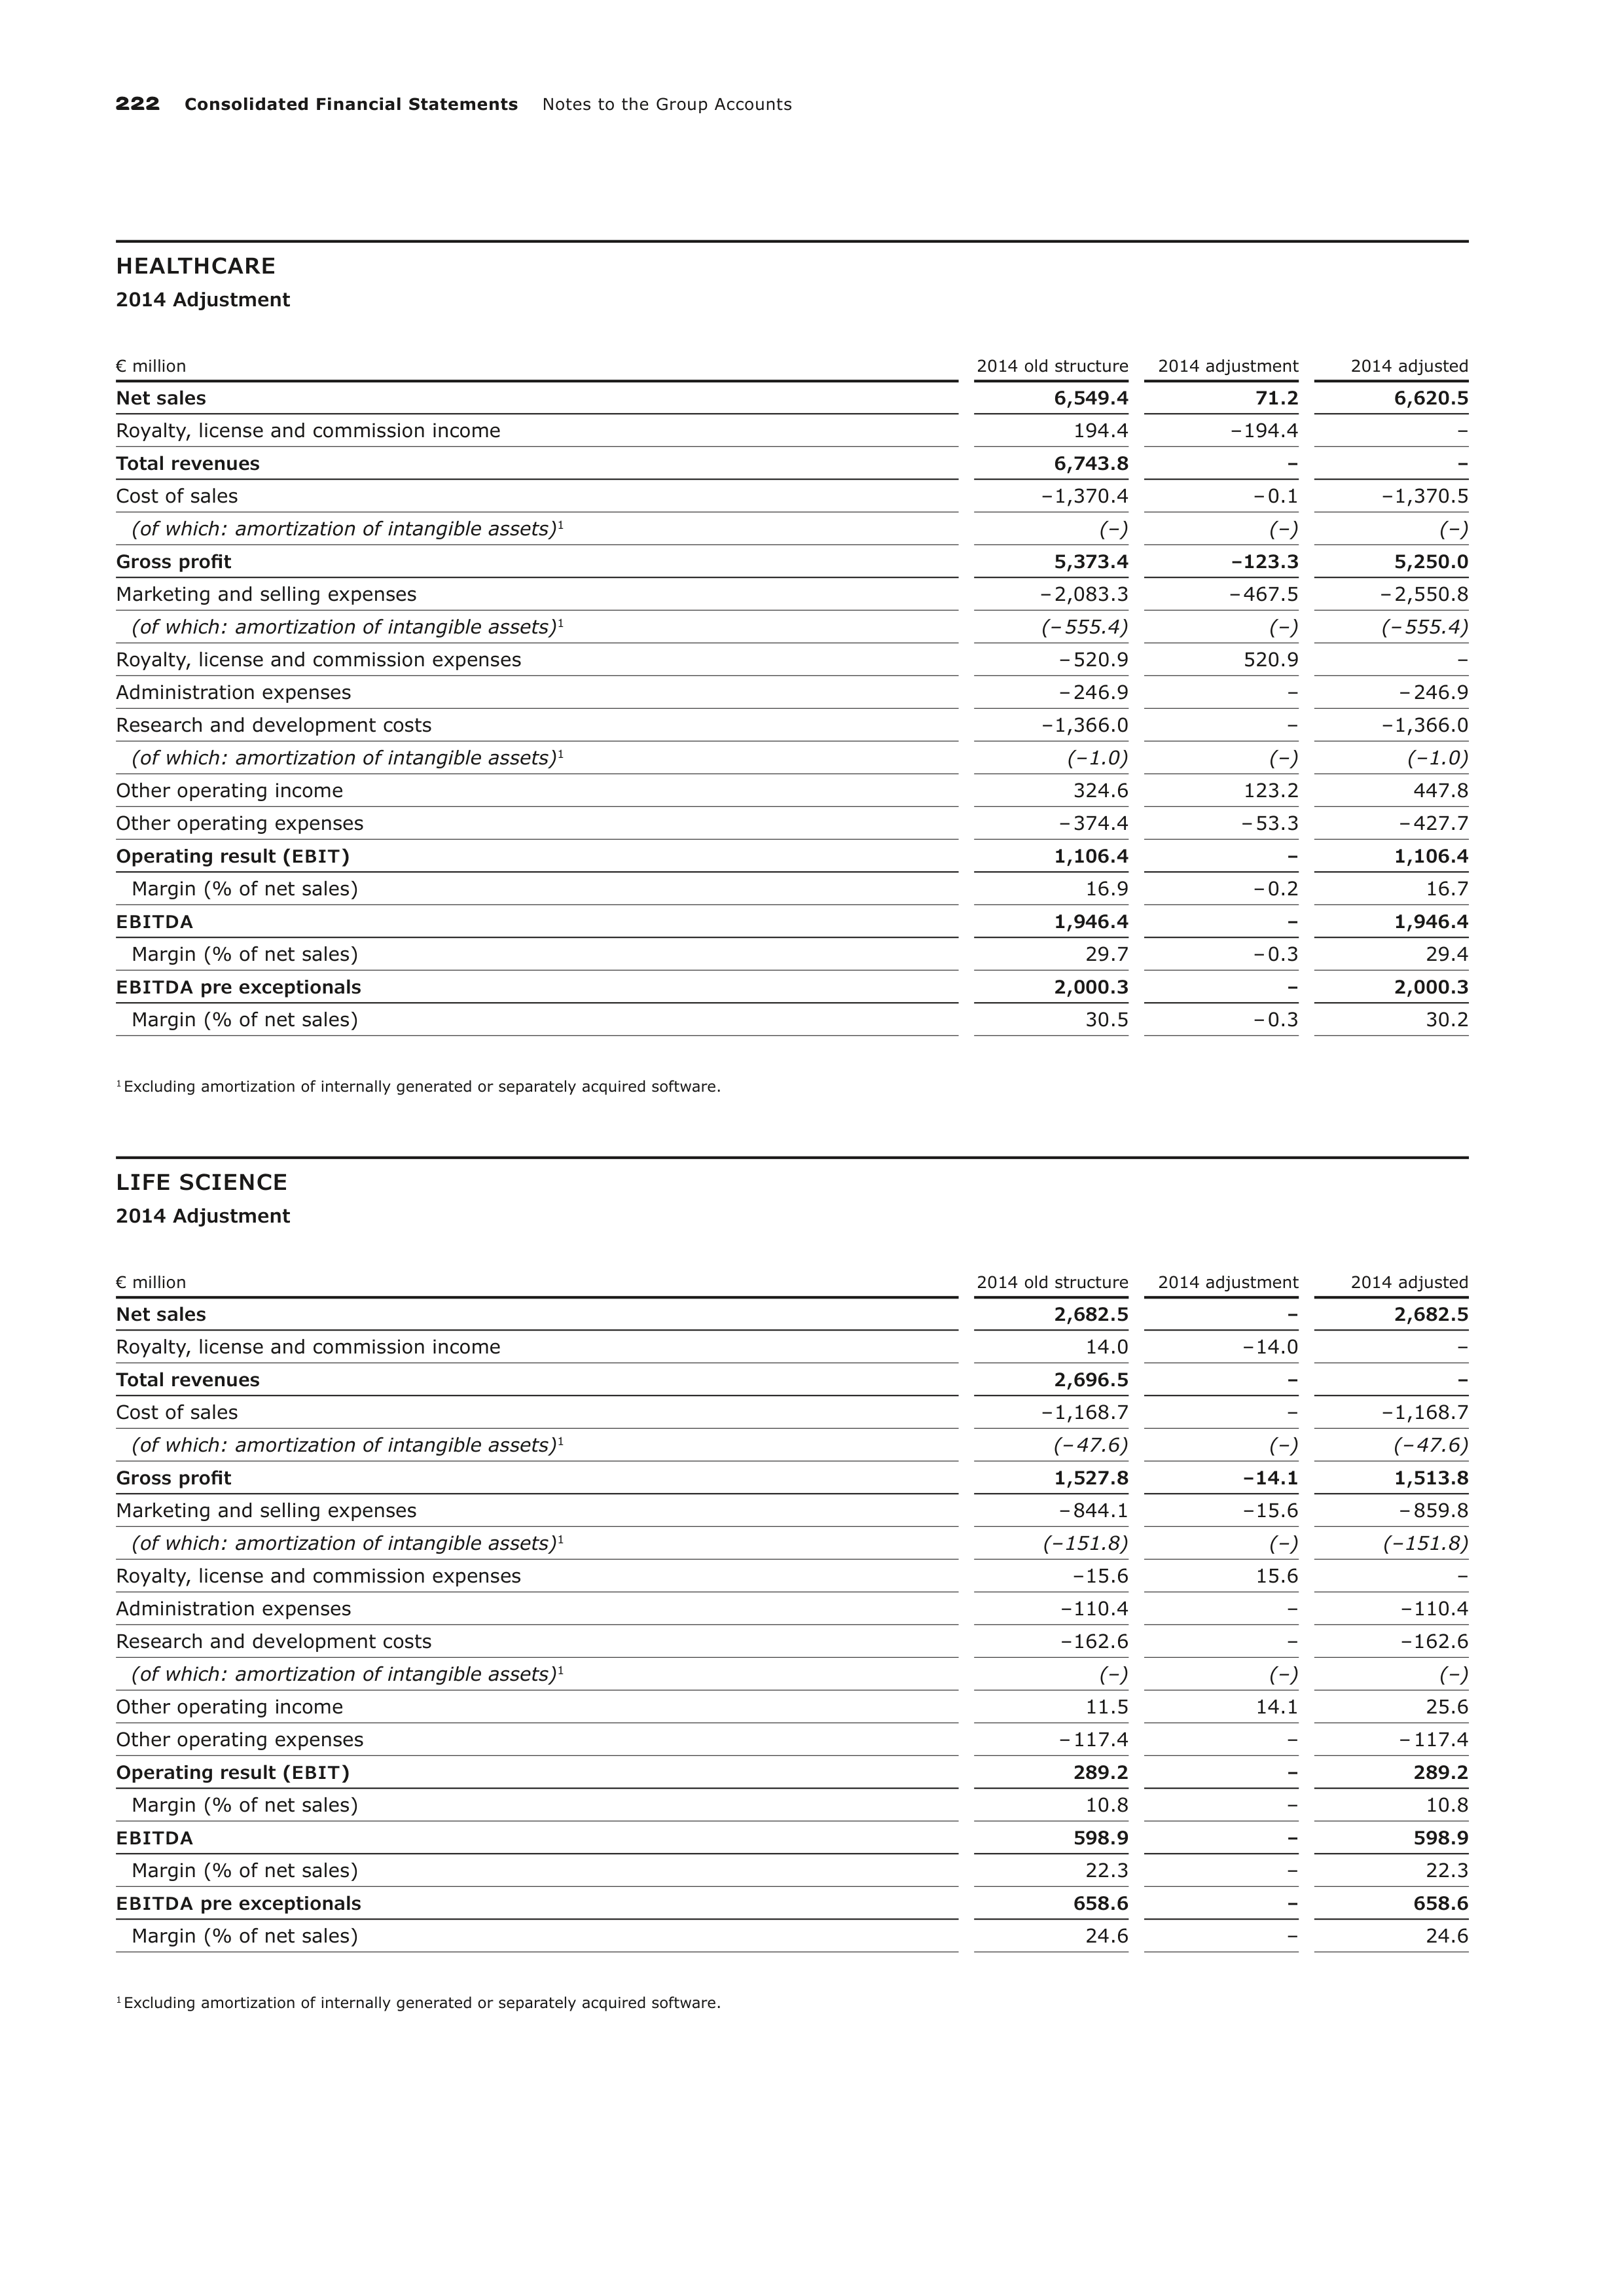
222
Consolidated Financial Statements
Notes to the Group Accounts
HEALTHCARE
2014 Adjustment
€ million
2014 old structure
2014 adjustment
2014 adjusted
Net sales
6,549.4
71.2
6,620.5
Royalty, license and commission income
194.4
– 194.4
–
Total revenues
6,743.8
–
–
Cost of sales
– 1,370.4
– 0.1
– 1,370.5
(of which: amortization of intangible assets)
1
(–)
(–)
(–)
Gross profit
5,373.4
– 123.3
5,250.0
Marketing and selling expenses
– 2,083.3
– 467.5
– 2,550.8
(of which: amortization of intangible assets)
1
(– 555.4)
(–)
(– 555.4)
Royalty, license and commission expenses
– 520.9
520.9
–
Administration expenses
– 246.9
–
– 246.9
Research and development costs
– 1,366.0
–
– 1,366.0
(of which: amortization of intangible assets)
1
(– 1.0)
(–)
(– 1.0)
Other operating income
324.6
123.2
447.8
Other operating expenses
– 374.4
– 53.3
– 427.7
Operating result (
EBIT
)
1,106.4
–
1,106.4
Margin (% of net sales)
16.9
– 0.2
16.7
EBITDA
1,946.4
–
1,946.4
Margin (% of net sales)
29.7
– 0.3
29.4
EBITDA
pre exceptionals
2,000.3
–
2,000.3
Margin (% of net sales)
30.5
– 0.3
30.2
1
Excluding amortization of internally generated or separately acquired software.
LIFE SCIENCE
2014 Adjustment
€ million
2014 old structure
2014 adjustment
2014 adjusted
Net sales
2,682.5
–
2,682.5
Royalty, license and commission income
14.0
– 14.0
–
Total revenues
2,696.5
–
–
Cost of sales
– 1,168.7
–
– 1,168.7
(of which: amortization of intangible assets)
1
(– 47.6)
(–)
(– 47.6)
Gross profit
1,527.8
– 14.1
1,513.8
Marketing and selling expenses
– 844.1
– 15.6
– 859.8
(of which: amortization of intangible assets)
1
(– 151.8)
(–)
(– 151.8)
Royalty, license and commission expenses
– 15.6
15.6
–
Administration expenses
– 110.4
–
– 110.4
Research and development costs
– 162.6
–
– 162.6
(of which: amortization of intangible assets)
1
(–)
(–)
(–)
Other operating income
11.5
14.1
25.6
Other operating expenses
– 117.4
–
– 117.4
Operating result (
EBIT
)
289.2
–
289.2
Margin (% of net sales)
10.8
–
10.8
EBITDA
598.9
–
598.9
Margin (% of net sales)
22.3
–
22.3
EBITDA
pre exceptionals
658.6
–
658.6
Margin (% of net sales)
24.6
–
24.6
1
Excluding amortization of internally generated or separately acquired software.
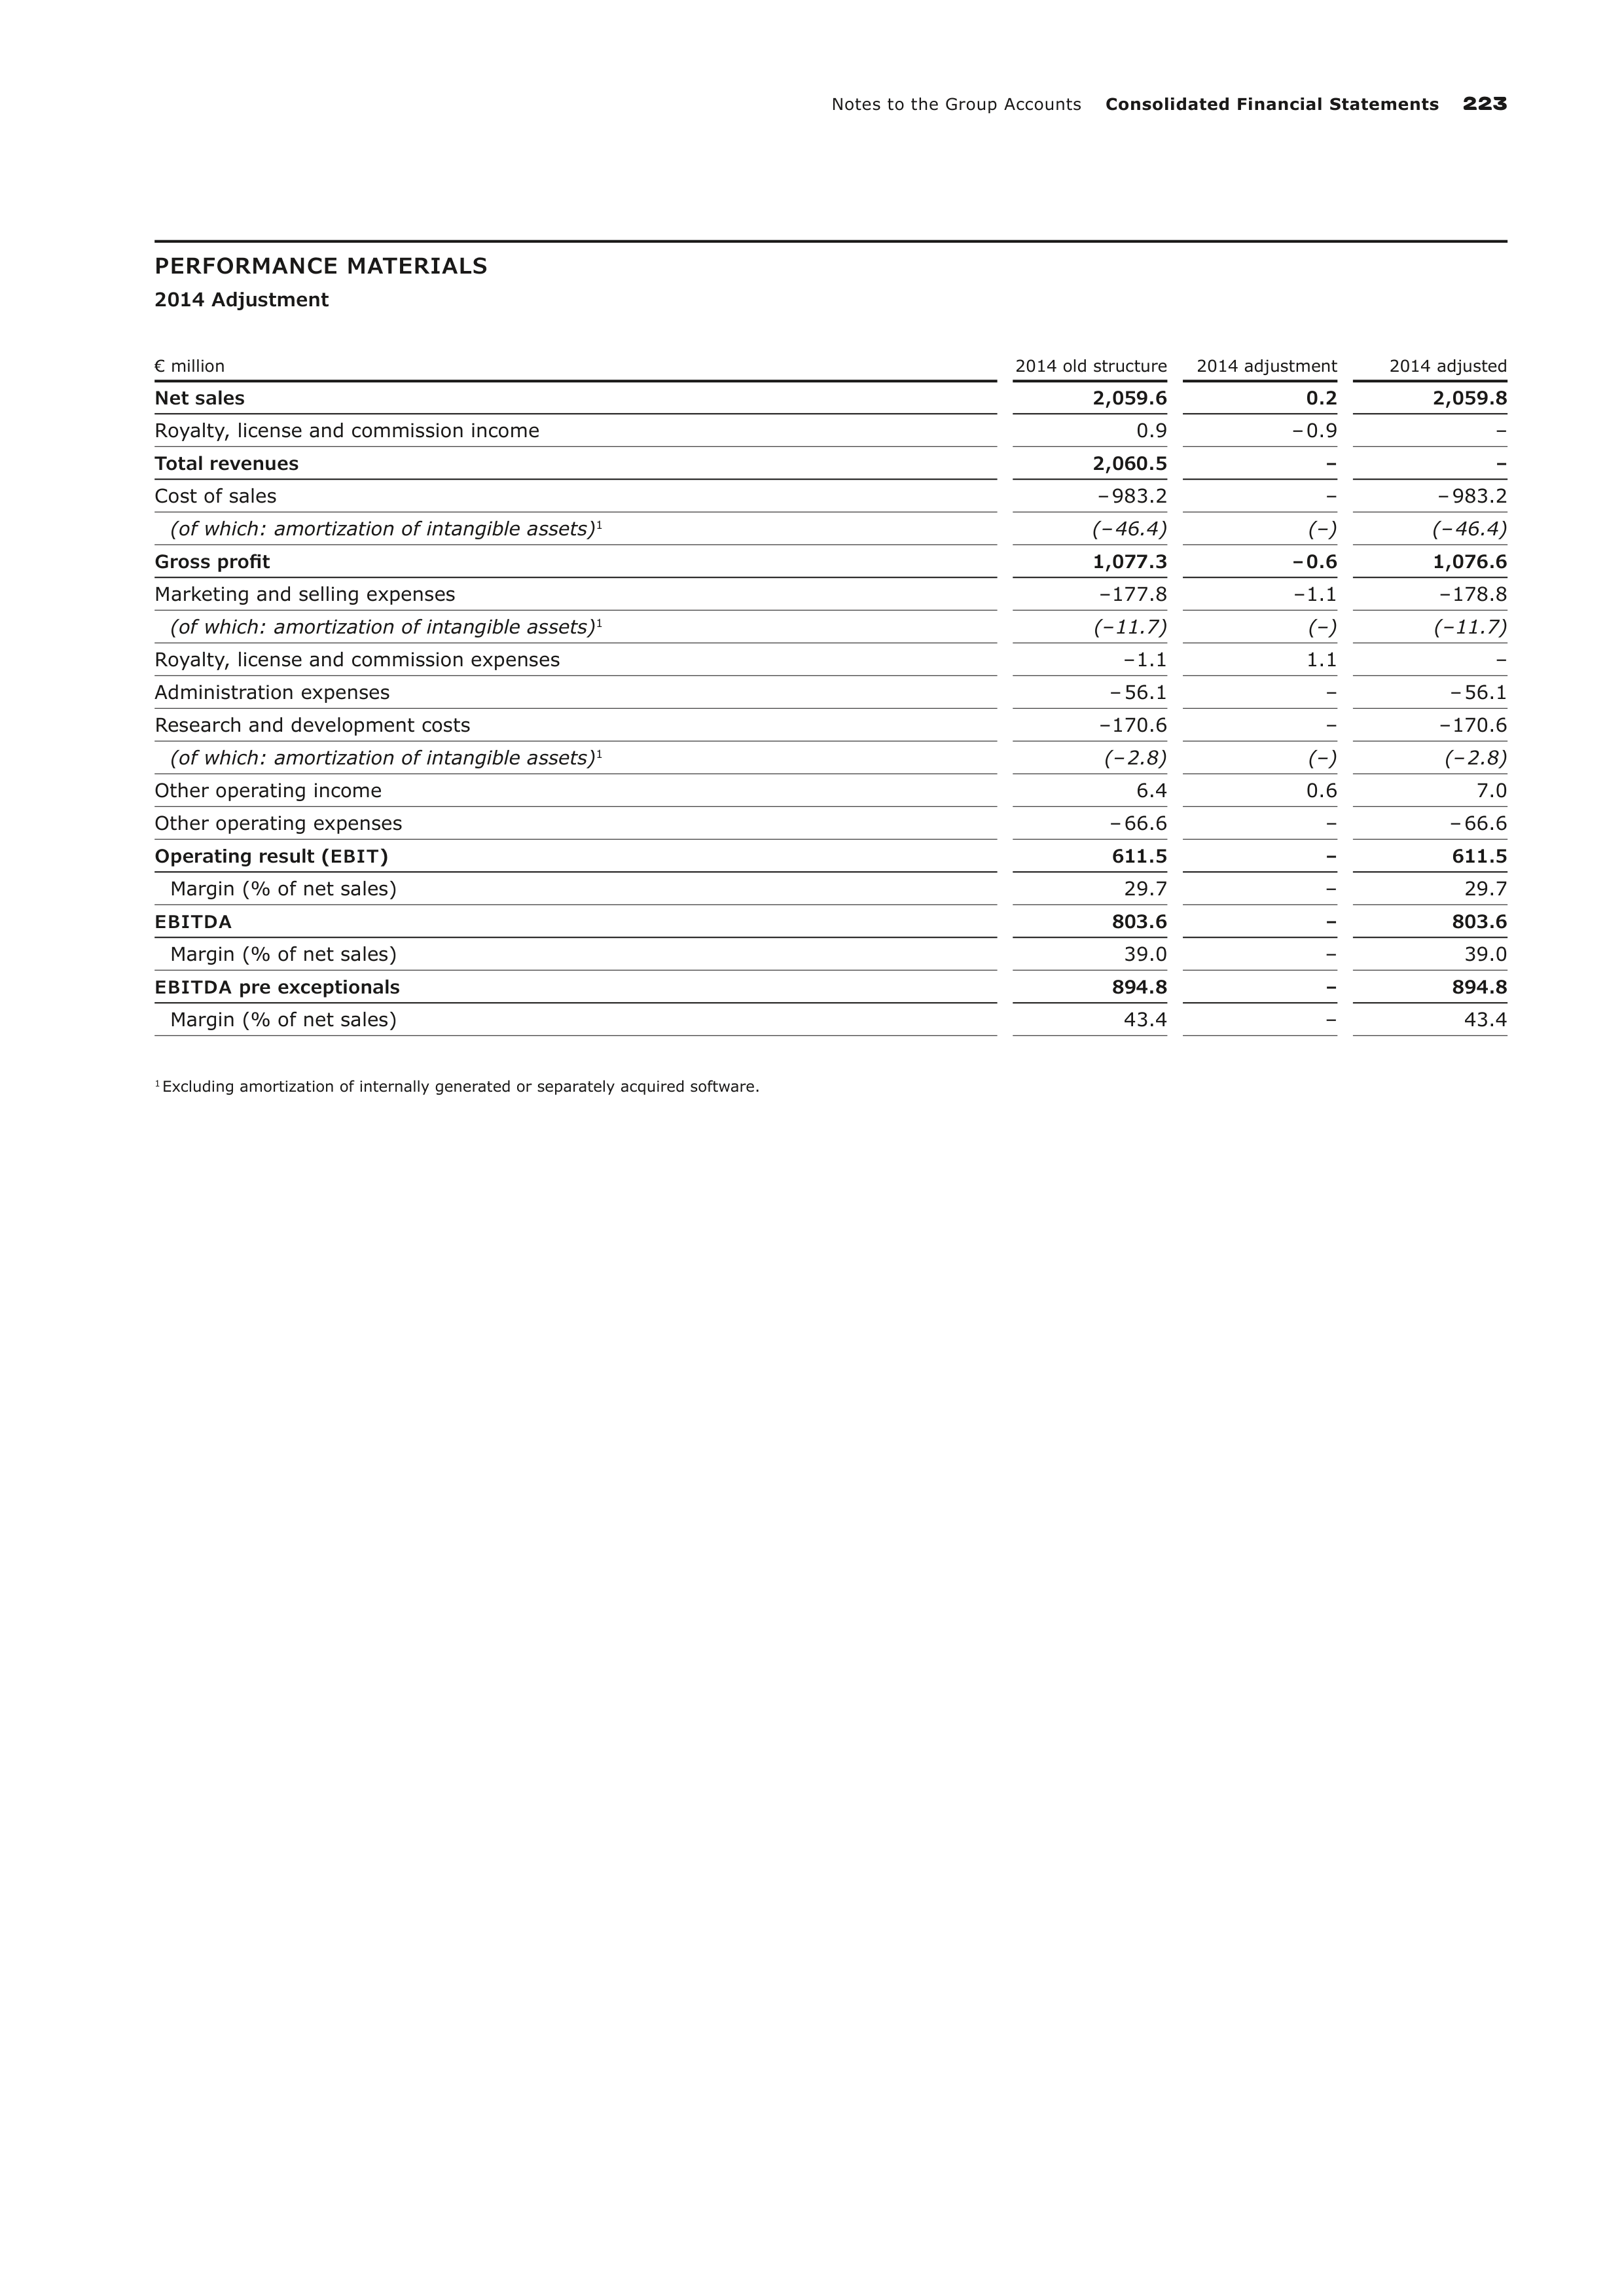
Notes to the Group Accounts
Consolidated Financial Statements
223
PERFORMANCE MATERIALS
2014 Adjustment
€ million
2014 old structure
2014 adjustment
2014 adjusted
Net sales
2,059.6
0.2
2,059.8
Royalty, license and commission income
0.9
– 0.9
–
Total revenues
2,060.5
–
–
Cost of sales
– 983.2
–
– 983.2
(of which: amortization of intangible assets)
1
(– 46.4)
(–)
(– 46.4)
Gross profit
1,077.3
– 0.6
1,076.6
Marketing and selling expenses
– 177.8
– 1.1
– 178.8
(of which: amortization of intangible assets)
1
(– 11.7)
(–)
(– 11.7)
Royalty, license and commission expenses
– 1.1
1.1
–
Administration expenses
– 56.1
–
– 56.1
Research and development costs
– 170.6
–
– 170.6
(of which: amortization of intangible assets)
1
(– 2.8)
(–)
(– 2.8)
Other operating income
6.4
0.6
7.0
Other operating expenses
– 66.6
–
– 66.6
Operating result (
EBIT
)
611.5
–
611.5
Margin (% of net sales)
29.7
–
29.7
EBITDA
803.6
–
803.6
Margin (% of net sales)
39.0
–
39.0
EBITDA
pre exceptionals
894.8
–
894.8
Margin (% of net sales)
43.4
–
43.4
1
Excluding amortization of internally generated or separately acquired software.
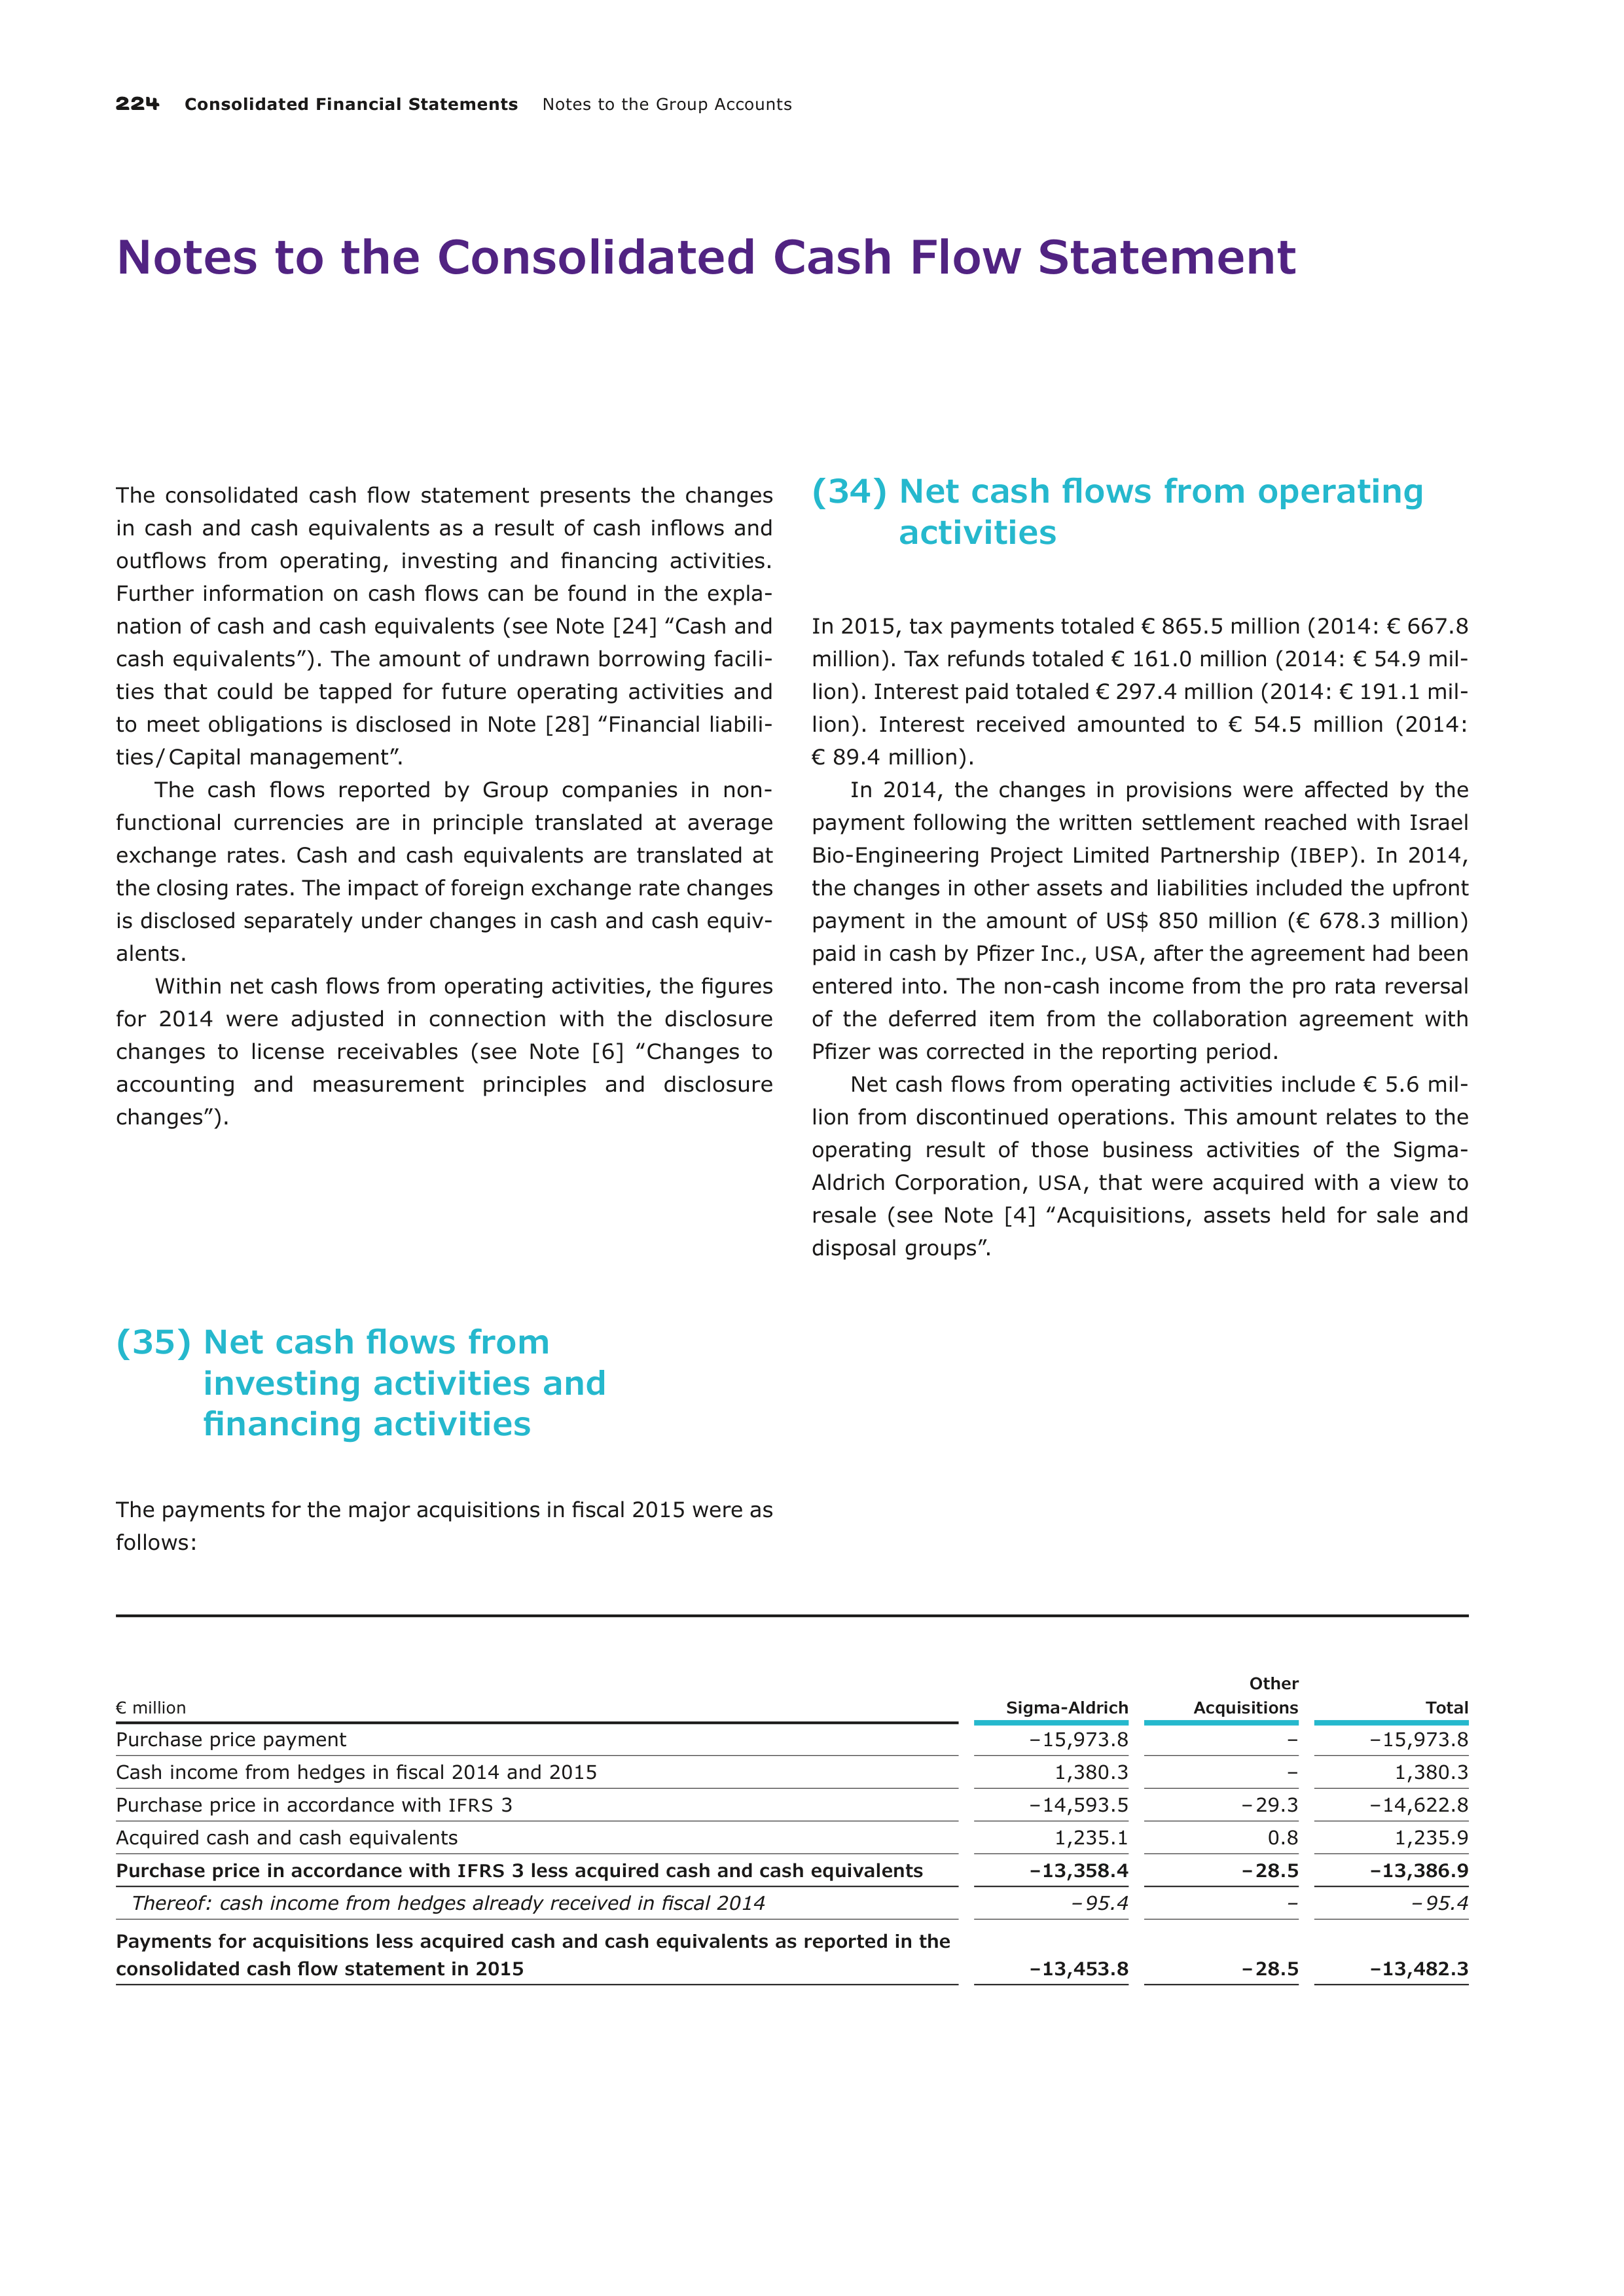
224
Consolidated Financial Statements
Notes to the Group Accounts
Notes to the Consolidated Cash Flow Statement
The consolidated cash flow statement presents the changes
in cash and cash equivalents as a result of cash inflows and
outflows from operating, investing and financing activities.
Further information on cash flows can be found in the expla-
nation of cash and cash equivalents (see Note [24] ‟Cash and
cash equivalents”). The amount of undrawn borrowing facili-
ties that could be tapped for future operating activities and
to
meet obligations is disclosed in Note [28] ‟Financial liabili-
ties / Capital management”.
The cash flows reported by Group companies in non-
functional currencies are in principle translated at average
exchange rates. Cash and cash equivalents are translated at
the closing rates. The impact of foreign exchange rate changes
is disclosed separately under changes in cash and cash equiv-
alents.
Within net cash flows from operating activities, the figures
for 2014 were adjusted in connection with the disclosure
changes to license receivables (see Note [6] ‟Changes to
accounting and measurement principles and disclosure
changes”).
(35) Net cash flows from
investing activities and
financing activities
The payments for the major acquisitions in fiscal 2015 were as
follows:
(34) Net cash flows from operating
activities
In 2015, tax payments totaled € 865.5 million (2014: € 667.8
million). Tax refunds totaled € 161.0 million (2014: € 54.9 mil-
lion). Interest paid totaled € 297.4 million (2014: € 191.1 mil-
lion). Interest received amounted to € 54.5 million (2014:
€ 89.4 million).
In 2014, the changes in provisions were affected by the
payment following the written settlement reached with Israel
Bio-Engineering Project Limited Partnership (
IBEP
). In 2014,
the changes in other assets and liabilities included the upfront
payment in the amount of US$ 850 million (€ 678.3 million)
paid in cash by Pfizer Inc.,
USA
, after the agreement had been
entered into. The non-cash income from the pro rata reversal
of the deferred item from the collaboration agreement with
Pfizer was corrected in the reporting period.
Net cash flows from operating activities include € 5.6 mil-
lion from discontinued operations. This amount relates to the
operating result of those business activities of the Sigma-
Aldrich Corporation,
USA
, that were acquired with a view to
resale (see Note [4] ‟Acquisitions, assets held for sale and
disposal groups”.
€ million
Sigma-Aldrich
Other
Acquisitions
Total
Purchase price payment
– 15,973.8
–
– 15,973.8
Cash income from hedges in fiscal 2014 and 2015
1,380.3
–
1,380.3
Purchase price in accordance with
IFRS
3
– 14,593.5
– 29.3
– 14,622.8
Acquired cash and cash equivalents
1,235.1
0.8
1,235.9
Purchase price in accordance with
IFRS
3 less acquired cash and cash equivalents
– 13,358.4
– 28.5
– 13,386.9
Thereof: cash income from hedges already received in fiscal 2014
– 95.4
–
– 95.4
Payments for acquisitions less acquired cash and cash equivalents as reported in the
consolidated cash flow statement in 2015
– 13,453.8
– 28.5
– 13,482.3
Notes to the Group Accounts
Consolidated Financial Statements
225
In 2014, a hedging gain of € 95.4 million in connection with
the acquisition of the Sigma-Aldrich Corporation,
USA
, had
already been reclassified from other comprehensive income to
financial assets. Consequently, the payment for 100% of
the shares less acquired cash and cash equivalents totaled
€ 13,453.8 million for 2014 and 2015. The figures for 2014
reflected the acquisition of AZ Electronic Materials S.A., Lux-
embourg, in the amount of € 1,419.3 million.
Net cash outflows from investments in current and non-
current assets amounting to € 1,740.8 million (2014: € 3,143.3
million) mainly resulted from the purchase of short-term
invest-
ments in securities not classified as cash and cash equivalents.
Cash inflows from investing activities include € 84.4 million
from discontinued operations in relation to those business
activities of Sigma-Aldrich that were acquired with a view to
resale (see Note [4] ‟Acquisitions, assets held for sale and
disposal groups”).
The cash flows from financing activities included the payments
from new borrowings and the repayment of bonds as well as the
repayment of the bond acquired in the context of the Sigma-
Aldrich acquisition with a nominal volume of US$ 300 million.
Further information on the bonds can be found in Note [28]
‟Financial liabilities / Capital management”.
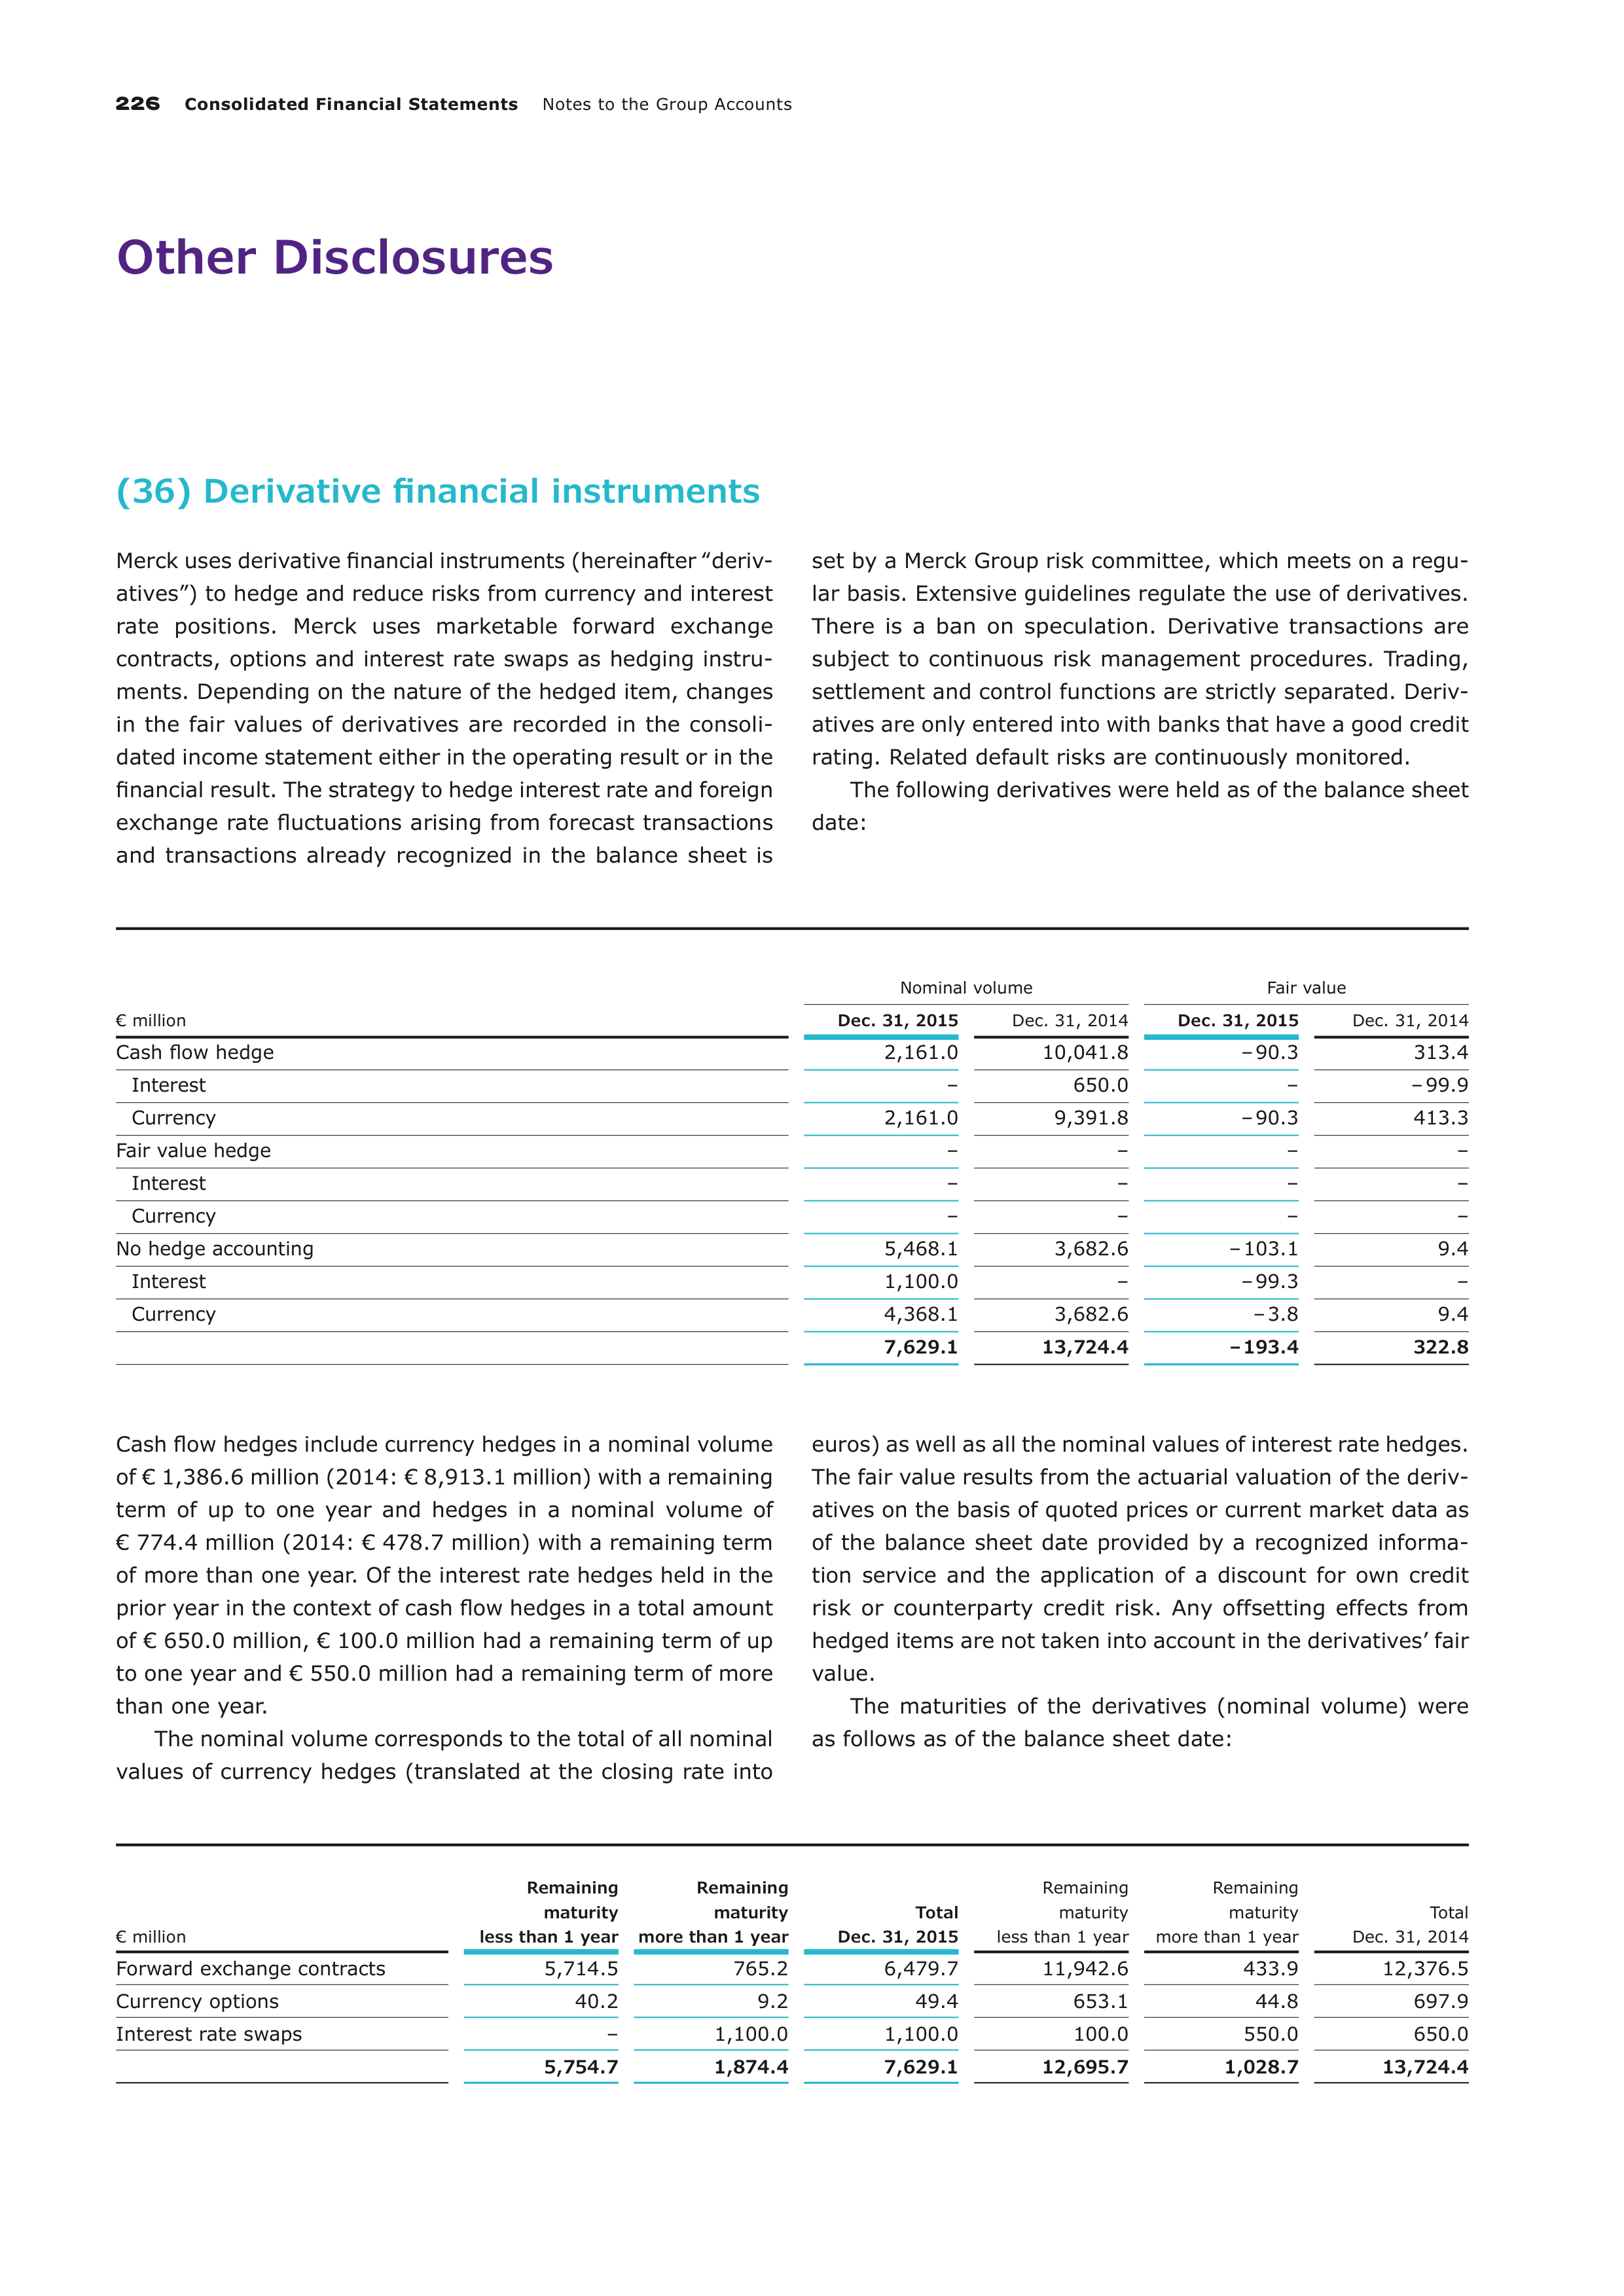
226
Consolidated Financial Statements
Notes to the Group Accounts
Other Disclosures
(36) Derivative financial instruments
Merck uses derivative financial instruments (hereinafter ‟deriv-
atives”) to hedge and reduce risks from currency and
interest
rate positions. Merck uses marketable forward exchange
contracts, options and interest rate swaps as hedging instru-
ments. Depending on the nature of the hedged item, changes
in the fair values of derivatives are recorded in the consoli-
dated income statement either in the operating result or in the
financial result. The strategy to hedge interest rate and foreign
exchange rate fluctuations arising from forecast transactions
and transactions already recognized in the balance sheet is
set
by a Merck Group risk committee, which meets on a regu-
lar basis. Extensive guidelines regulate the use of derivatives.
There is a ban on speculation. Derivative transactions are
sub
ject to continuous risk management procedures. Trading,
settlement and control functions are strictly separated. Deriv-
atives are only entered into with banks that have a good credit
rating. Related default risks are continuously monitored.
The following derivatives were held as of the balance sheet
date:
€ million
Nominal volume
Fair value
Dec. 31, 2015
Dec. 31, 2014
Dec. 31, 2015
Dec. 31, 2014
Cash flow hedge
2,161.0
10,041.8
– 90.3
313.4
Interest
–
650.0
–
– 99.9
Currency
2,161.0
9,391.8
– 90.3
413.3
Fair value hedge
–
–
–
–
Interest
–
–
–
–
Currency
–
–
–
–
No hedge accounting
5,468.1
3,682.6
– 103.1
9.4
Interest
1,100.0
–
– 99.3
–
Currency
4,368.1
3,682.6
– 3.8
9.4
7,629.1
13,724.4
– 193.4
322.8
Cash flow hedges include currency hedges in a nominal volume
of € 1,386.6 million (2014: € 8,913.1 million) with a remaining
term of up to one year and hedges in a nominal volume of
€ 774.4 million (2014: € 478.7 million) with a remaining term
of more than one year. Of the interest rate hedges held in the
prior year in the context of cash flow hedges in a total amount
of € 650.0 million, € 100.0 million had a remaining term of up
to one year and € 550.0 million had a remaining term of more
than one year.
The nominal volume corresponds to the total of all nominal
values of currency hedges (translated at the closing rate into
euros) as well as all the nominal values of interest rate hedges.
The fair value results from the actuarial valuation of the deriv-
atives on the basis of quoted prices or current market data as
of the balance sheet date provided by a recognized informa-
tion service and the application of a discount for own credit
risk or counterparty credit risk. Any offsetting effects from
hedged items are not taken into account in the derivatives’ fair
value.
The maturities of the derivatives (nominal volume) were
as follows as of the balance sheet date:
€ million
Remaining
maturity
less than 1 year
Remaining
maturity
more than 1 year
Total
Dec. 31, 2015
Remaining
maturity
less than 1 year
Remaining
maturity
more than 1 year
Total
Dec. 31, 2014
Forward exchange contracts
5,714.5
765.2
6,479.7
11,942.6
433.9
12,376.5
Currency options
40.2
9.2
49.4
653.1
44.8
697.9
Interest rate swaps
–
1,100.0
1,100.0
100.0
550.0
650.0
5,754.7
1,874.4
7,629.1
12,695.7
1,028.7
13,724.4
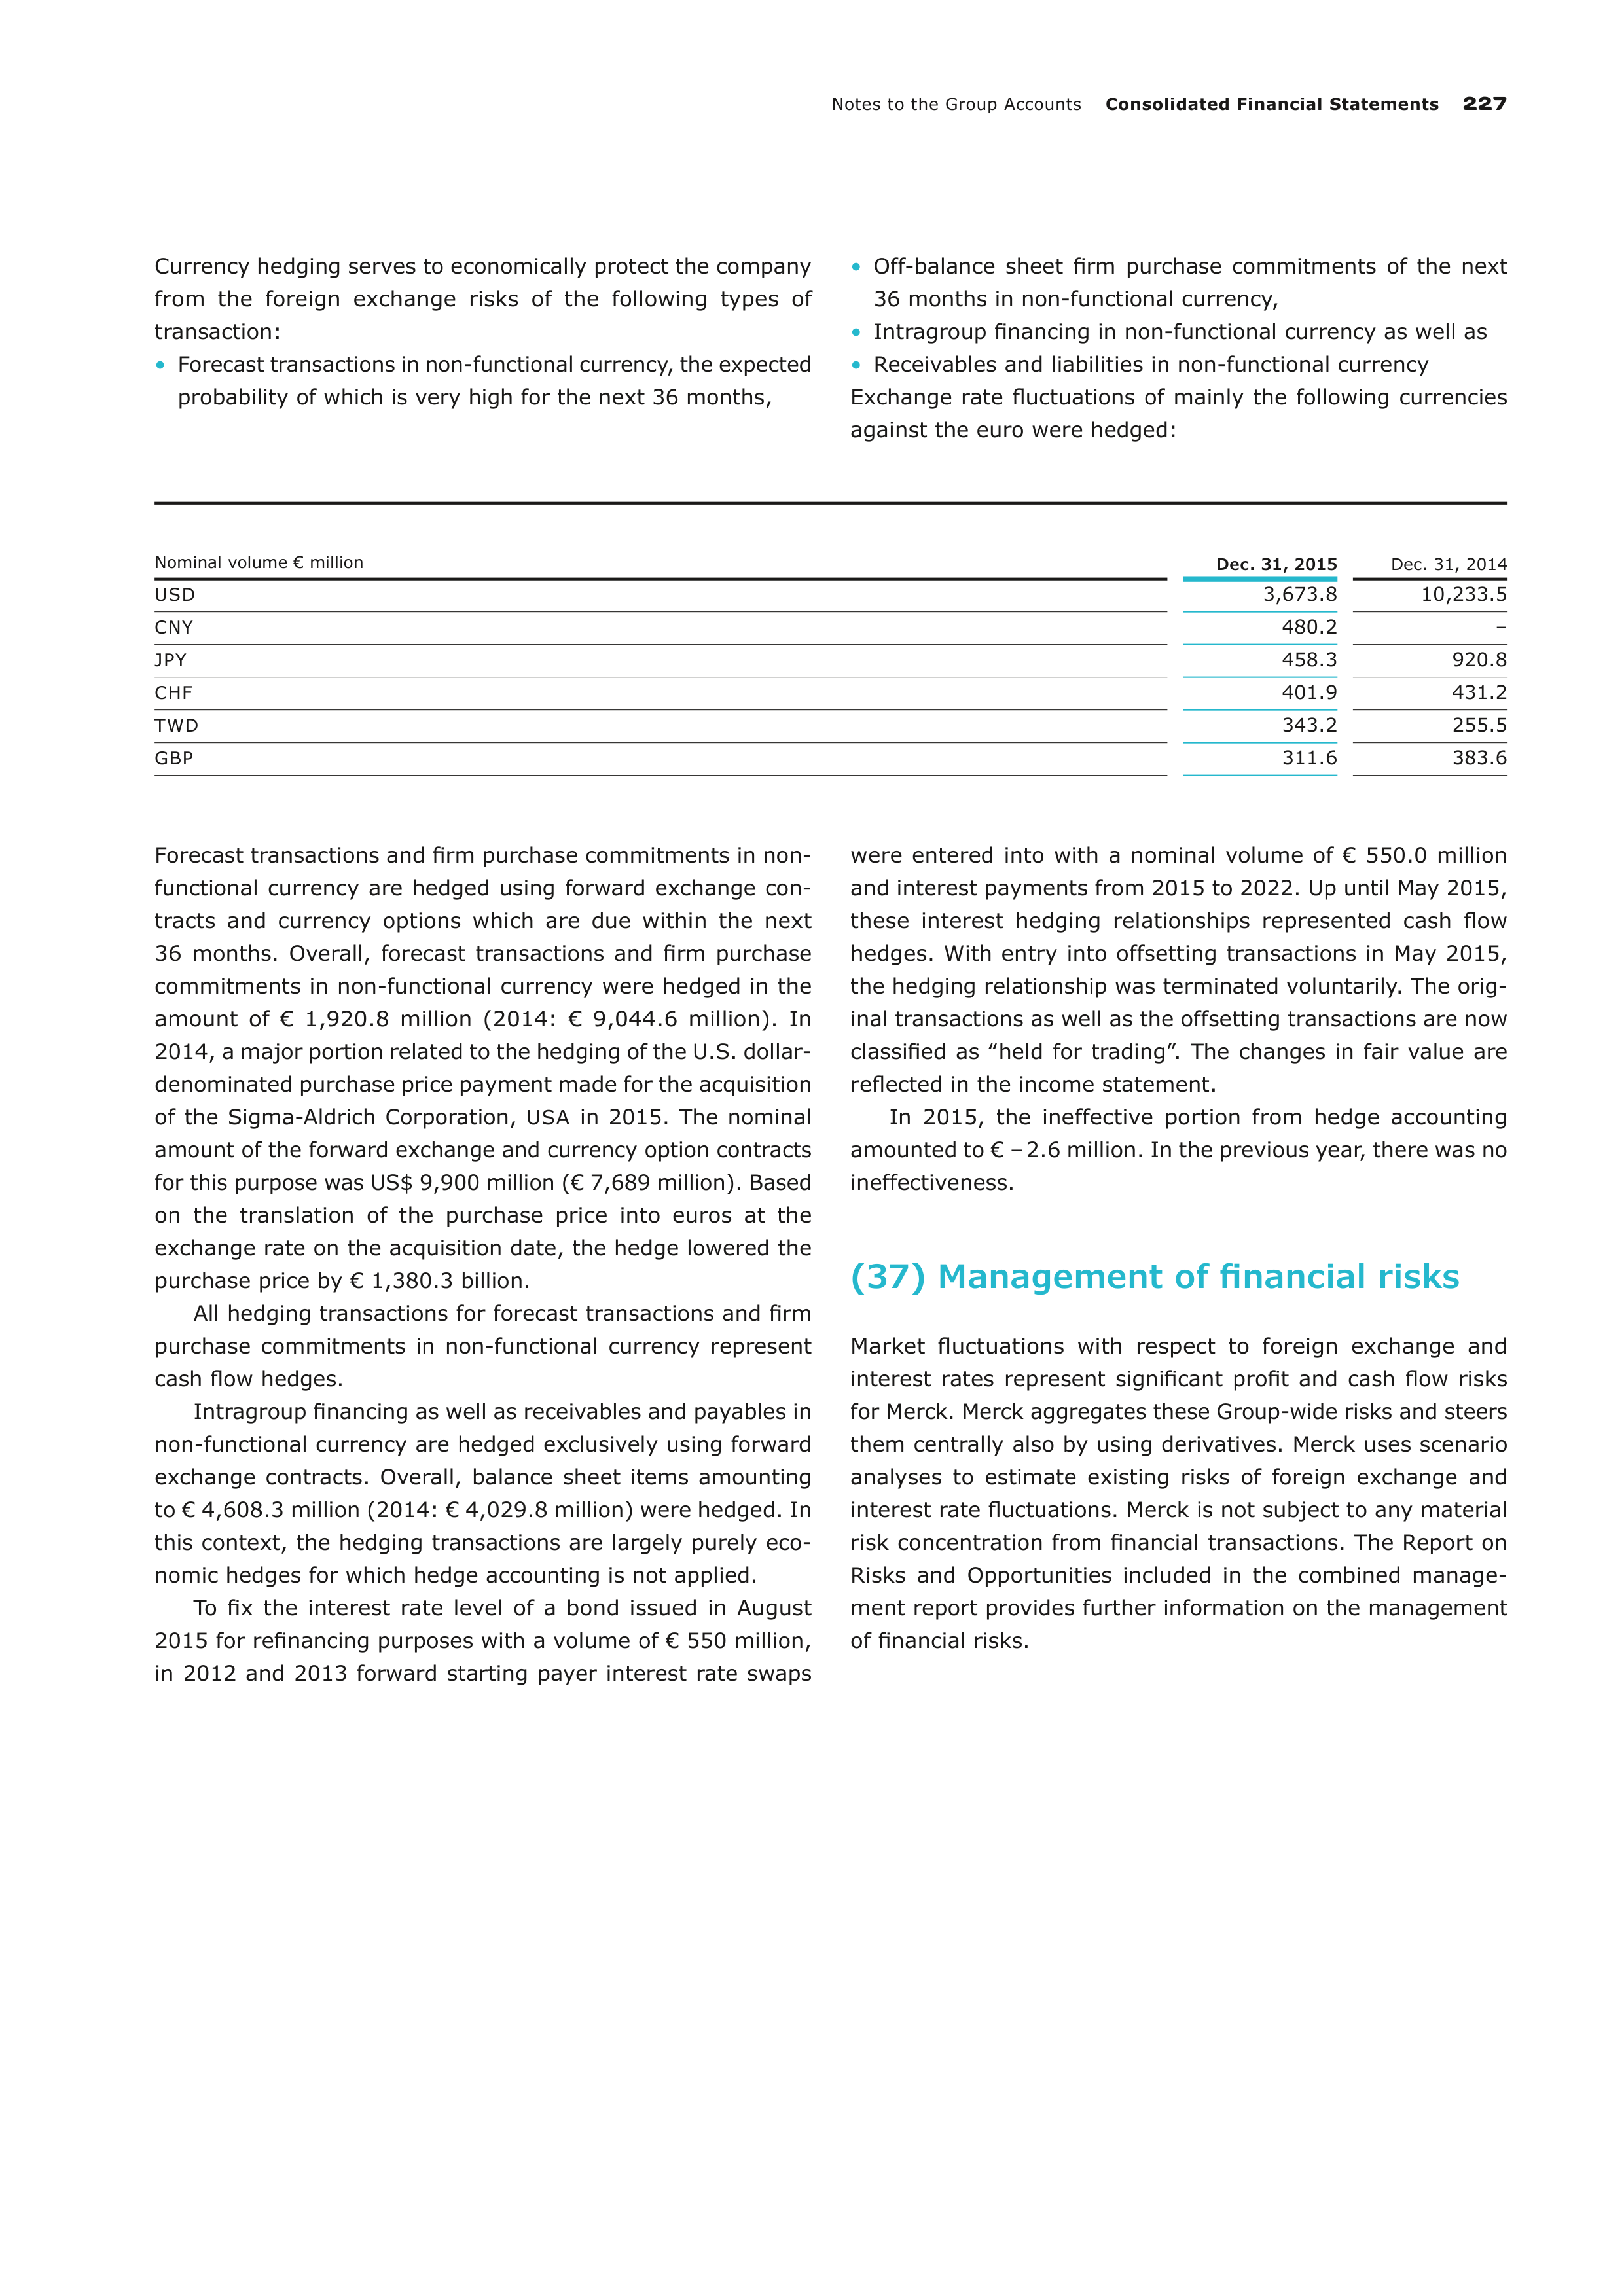
Notes to the Group Accounts
Consolidated Financial Statements
227
Currency hedging serves to economically protect the company
from the foreign exchange risks of the following types of
transaction:
•
Forecast transactions in non-functional currency, the expected
probability of which is very high for the next 36 months,
•
Off-balance sheet firm purchase commitments of the next
36 months in non-functional currency,
•
Intragroup financing in non-functional currency as well as
•
Receivables and liabilities in non-functional currency
Exchange rate fluctuations of mainly the following currencies
against the euro were hedged:
Nominal volume € million
Dec. 31, 2015
Dec. 31, 2014
USD
3,673.8
10,233.5
CNY
480.2
–
JPY
458.3
920.8
CHF
401.9
431.2
TWD
343.2
255.5
GBP
311.6
383.6
Forecast transactions and firm purchase commitments in non-
functional currency are hedged using forward exchange con-
tracts and currency options which are due within the next
36
months. Overall, forecast transactions and firm purchase
commitments in non-functional currency were hedged in the
amount of € 1,920.8 million (2014: € 9,044.6 million). In
2014, a major portion related to the hedging of the U.S. dollar-
denominated purchase price payment made for the acquisition
of the Sigma-Aldrich Corporation,
USA
in 2015. The nominal
amount of the forward exchange and currency option contracts
for this purpose was US$ 9,900 million (€ 7,689 million). Based
on the translation of the purchase price into euros at the
exchange rate on the acquisition date, the hedge lowered the
purchase price by € 1,380.3 billion.
All hedging transactions for forecast transactions and firm
purchase commitments in non-functional currency represent
cash flow hedges.
Intragroup financing as well as receivables and payables in
non-functional currency are hedged exclusively using forward
exchange contracts. Overall, balance sheet items amounting
to € 4,608.3 million (2014: € 4,029.8 million) were hedged. In
this context, the hedging transactions are largely purely eco-
nomic hedges for which hedge accounting is not applied.
To fix the interest rate level of a bond issued in August
2015 for refinancing purposes with a volume of € 550 million,
in 2012 and 2013 forward starting payer interest rate swaps
were entered into with a nominal volume of € 550.0 million
and interest payments from 2015 to 2022. Up until May 2015,
these interest hedging relationships represented cash flow
hedges. With entry into offsetting transactions in May 2015,
the hedging relationship was terminated voluntarily. The orig-
inal transactions as well as the offsetting transactions are now
classified as ‟held for trading”. The changes in fair value are
reflected in the income statement.
In 2015, the ineffective portion from hedge accounting
amounted to € – 2.6 million. In the previous year, there was no
ineffectiveness.
(37) Management of financial risks
Market fluctuations with respect to foreign exchange and
interest rates represent significant profit and cash flow risks
for Merck. Merck aggregates these Group-wide risks and steers
them centrally also by using derivatives. Merck uses scenario
analyses to estimate existing risks of foreign exchange and
interest rate fluctuations. Merck is not subject to any material
risk concentration from financial transactions. The Report on
Risks and Opportunities included in the combined manage-
ment report provides further information on the management
of financial risks.
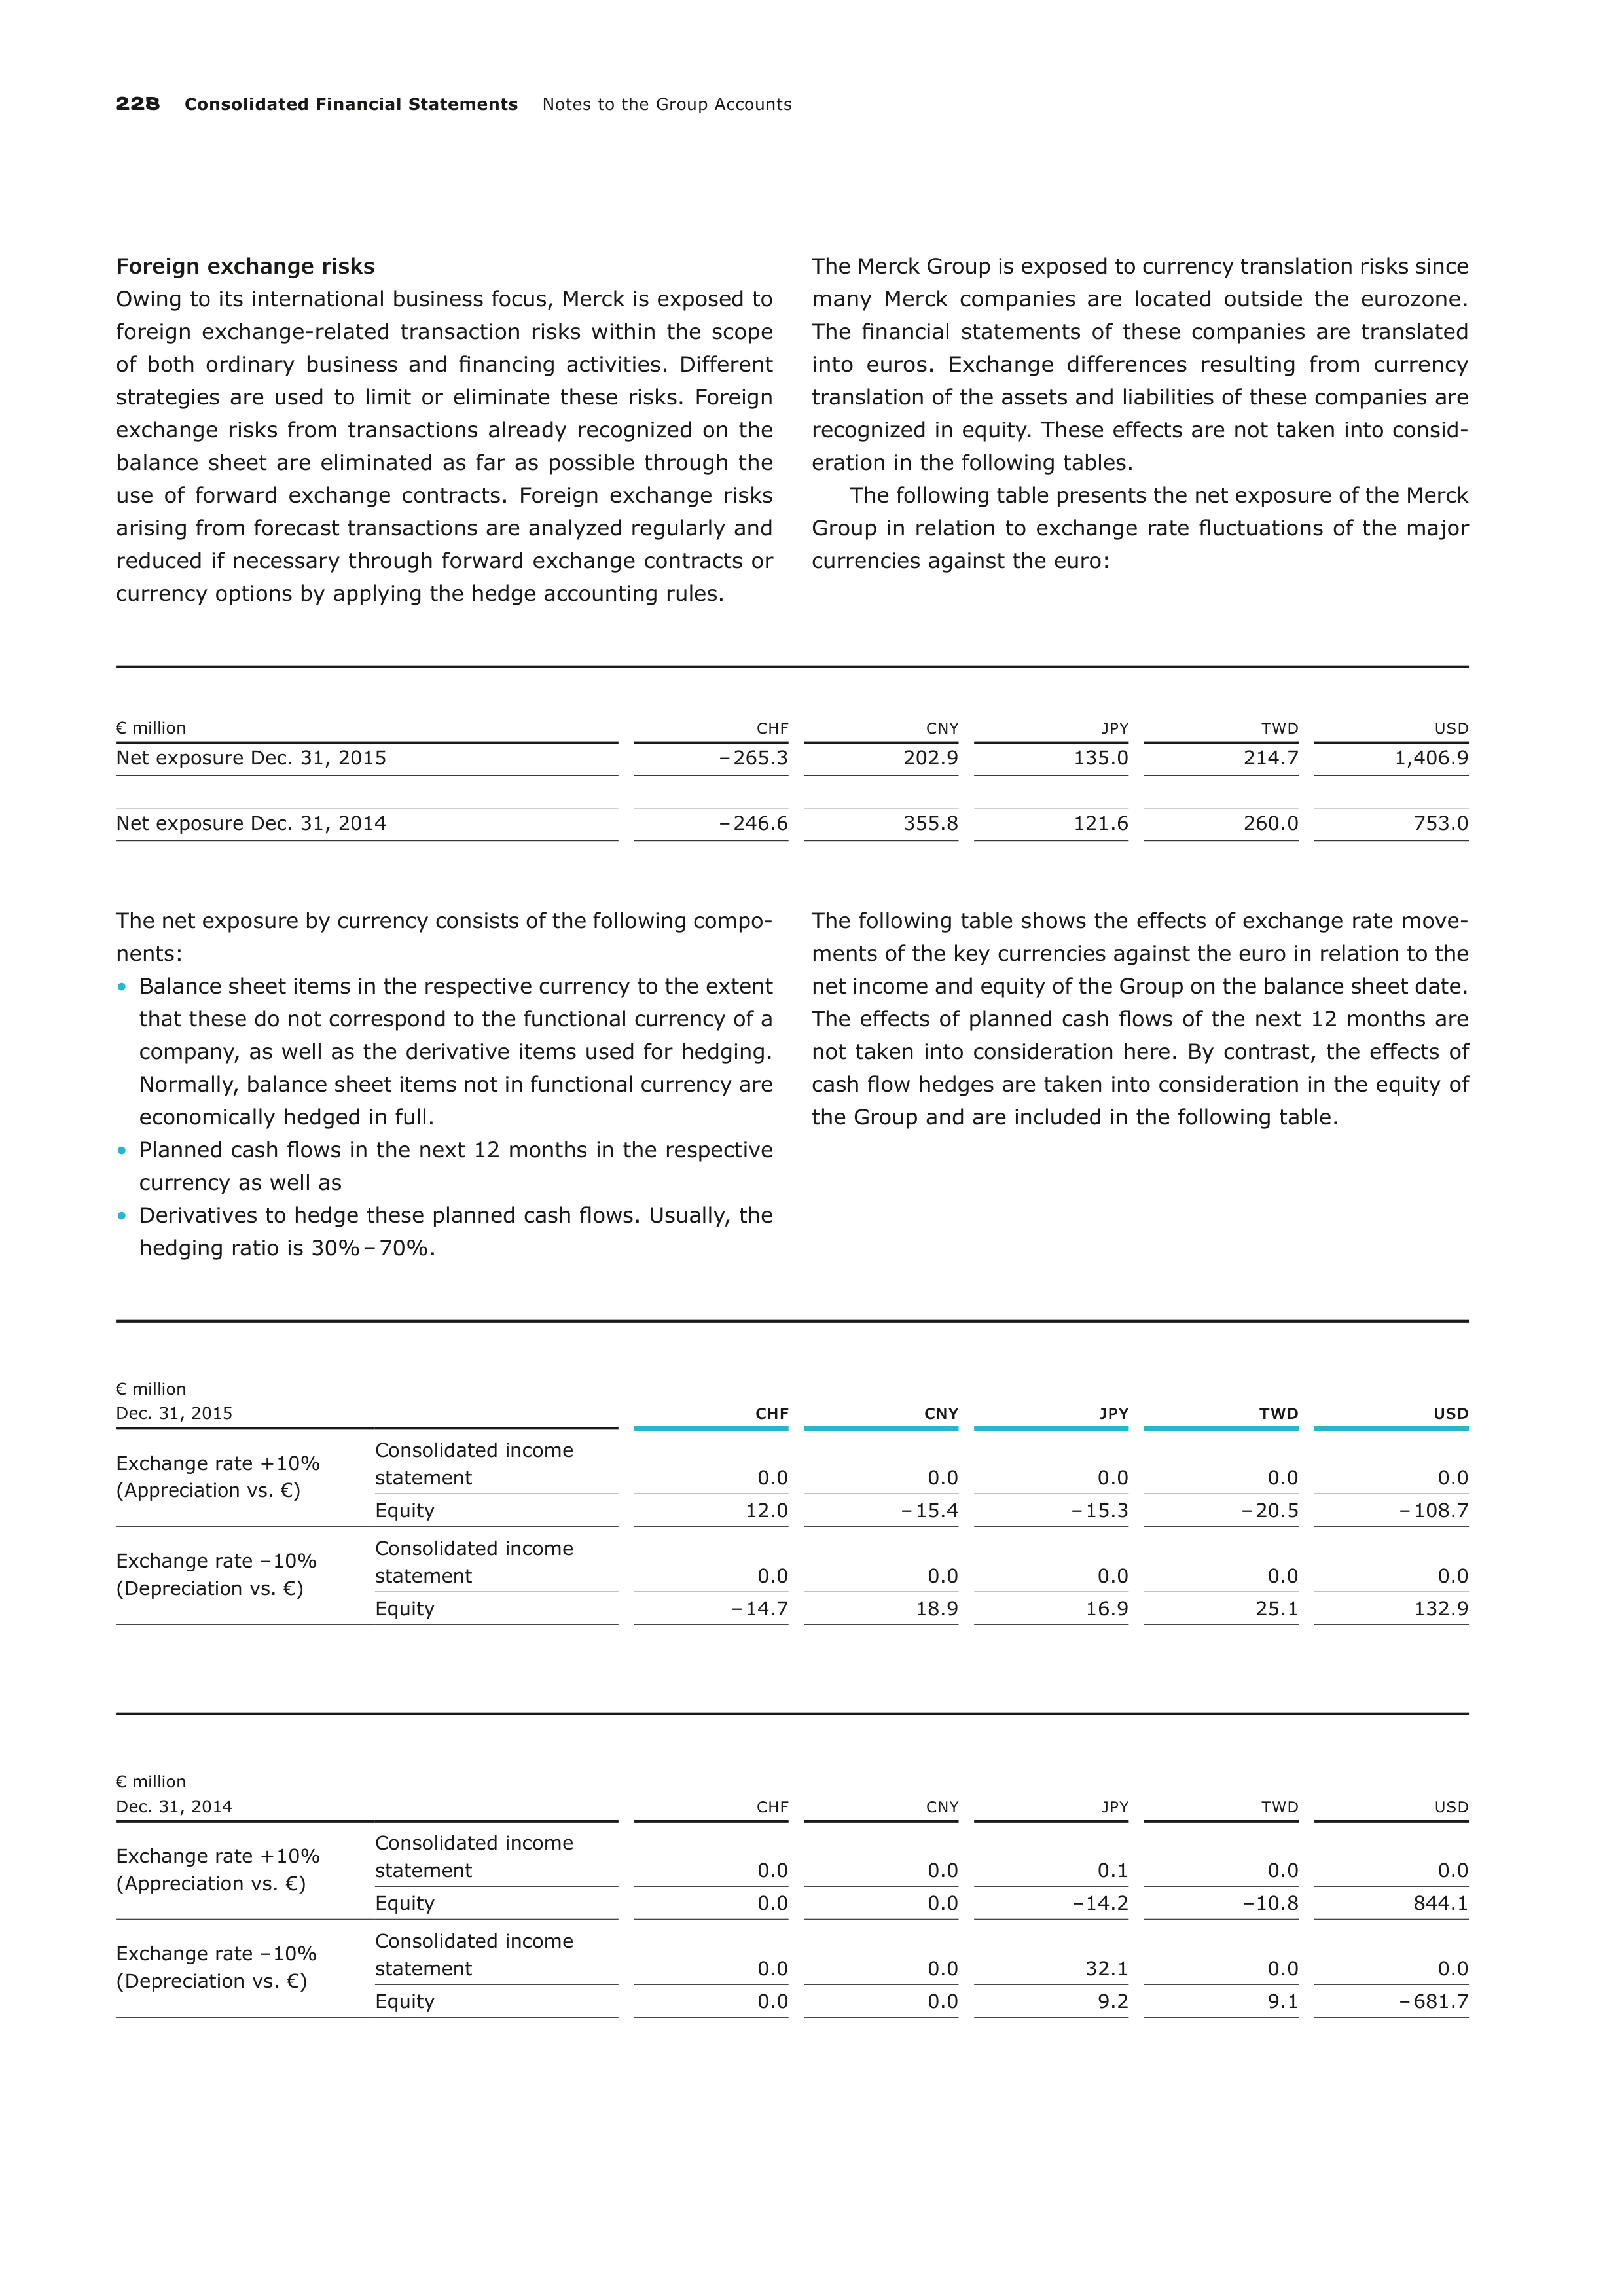
228
Consolidated Financial Statements
Notes to the Group Accounts
Foreign exchange risks
Owing to its international business focus, Merck is exposed to
foreign exchange-related transaction risks within the scope
of both ordinary business and financing activities. Different
strategies are used to limit or eliminate these risks. Foreign
exchange risks from transactions already recognized on the
balance sheet are eliminated as far as possible through the
use of forward exchange contracts. Foreign exchange risks
arising from forecast transactions are analyzed regularly and
reduced if necessary through forward exchange contracts or
currency options by applying the hedge accounting rules.
The Merck Group is exposed to currency translation risks since
many Merck companies are located outside the eurozone.
The financial statements of these companies are translated
into euros. Exchange differences resulting from currency
translation of the assets and liabilities of these companies are
recognized in equity. These effects are not taken into consid-
eration in the following tables.
The following table presents the net exposure of the Merck
Group in relation to exchange rate fluctuations of the major
currencies against the euro:
€ million
CHF
CNY
JPY
TWD
USD
Net exposure Dec. 31, 2015
– 265.3
202.9
135.0
214.7
1,406.9
Net exposure Dec. 31, 2014
– 246.6
355.8
121.6
260.0
753.0
The net exposure by currency consists of the following compo-
nents:
•
Balance sheet items in the respective currency to the extent
that these do not correspond to the functional currency of a
company, as well as the derivative items used for hedging.
Normally, balance sheet items not in functional currency are
economically hedged in full.
•
Planned cash flows in the next 12 months in the respective
currency as well as
•
Derivatives to hedge these planned cash flows. Usually, the
hedging ratio is 30% – 70%.
The following table shows the effects of exchange rate move-
ments of the key currencies against the euro in relation to the
net income and equity of the Group on the balance sheet date.
The effects of planned cash flows of the next 12 months are
not taken into consideration here. By contrast, the effects of
cash flow hedges are taken into consideration in the equity of
the Group and are included in the following table.
€ million
Dec. 31, 2015
CHF
CNY
JPY
TWD
USD
Exchange rate + 10%
(Appreciation vs. €)
Consolidated income
statement
0.0
0.0
0.0
0.0
0.0
Equity
12.0
– 15.4
– 15.3
– 20.5
– 108.7
Exchange rate – 10%
(Depreciation vs. €)
Consolidated income
statement
0.0
0.0
0.0
0.0
0.0
Equity
– 14.7
18.9
16.9
25.1
132.9
€ million
Dec. 31, 2014
CHF
CNY
JPY
TWD
USD
Exchange rate + 10%
(Appreciation vs. €)
Consolidated income
statement
0.0
0.0
0.1
0.0
0.0
Equity
0.0
0.0
– 14.2
– 10.8
844.1
Exchange rate – 10%
(Depreciation vs. €)
Consolidated income
statement
0.0
0.0
32.1
0.0
0.0
Equity
0.0
0.0
9.2
9.1
– 681.7
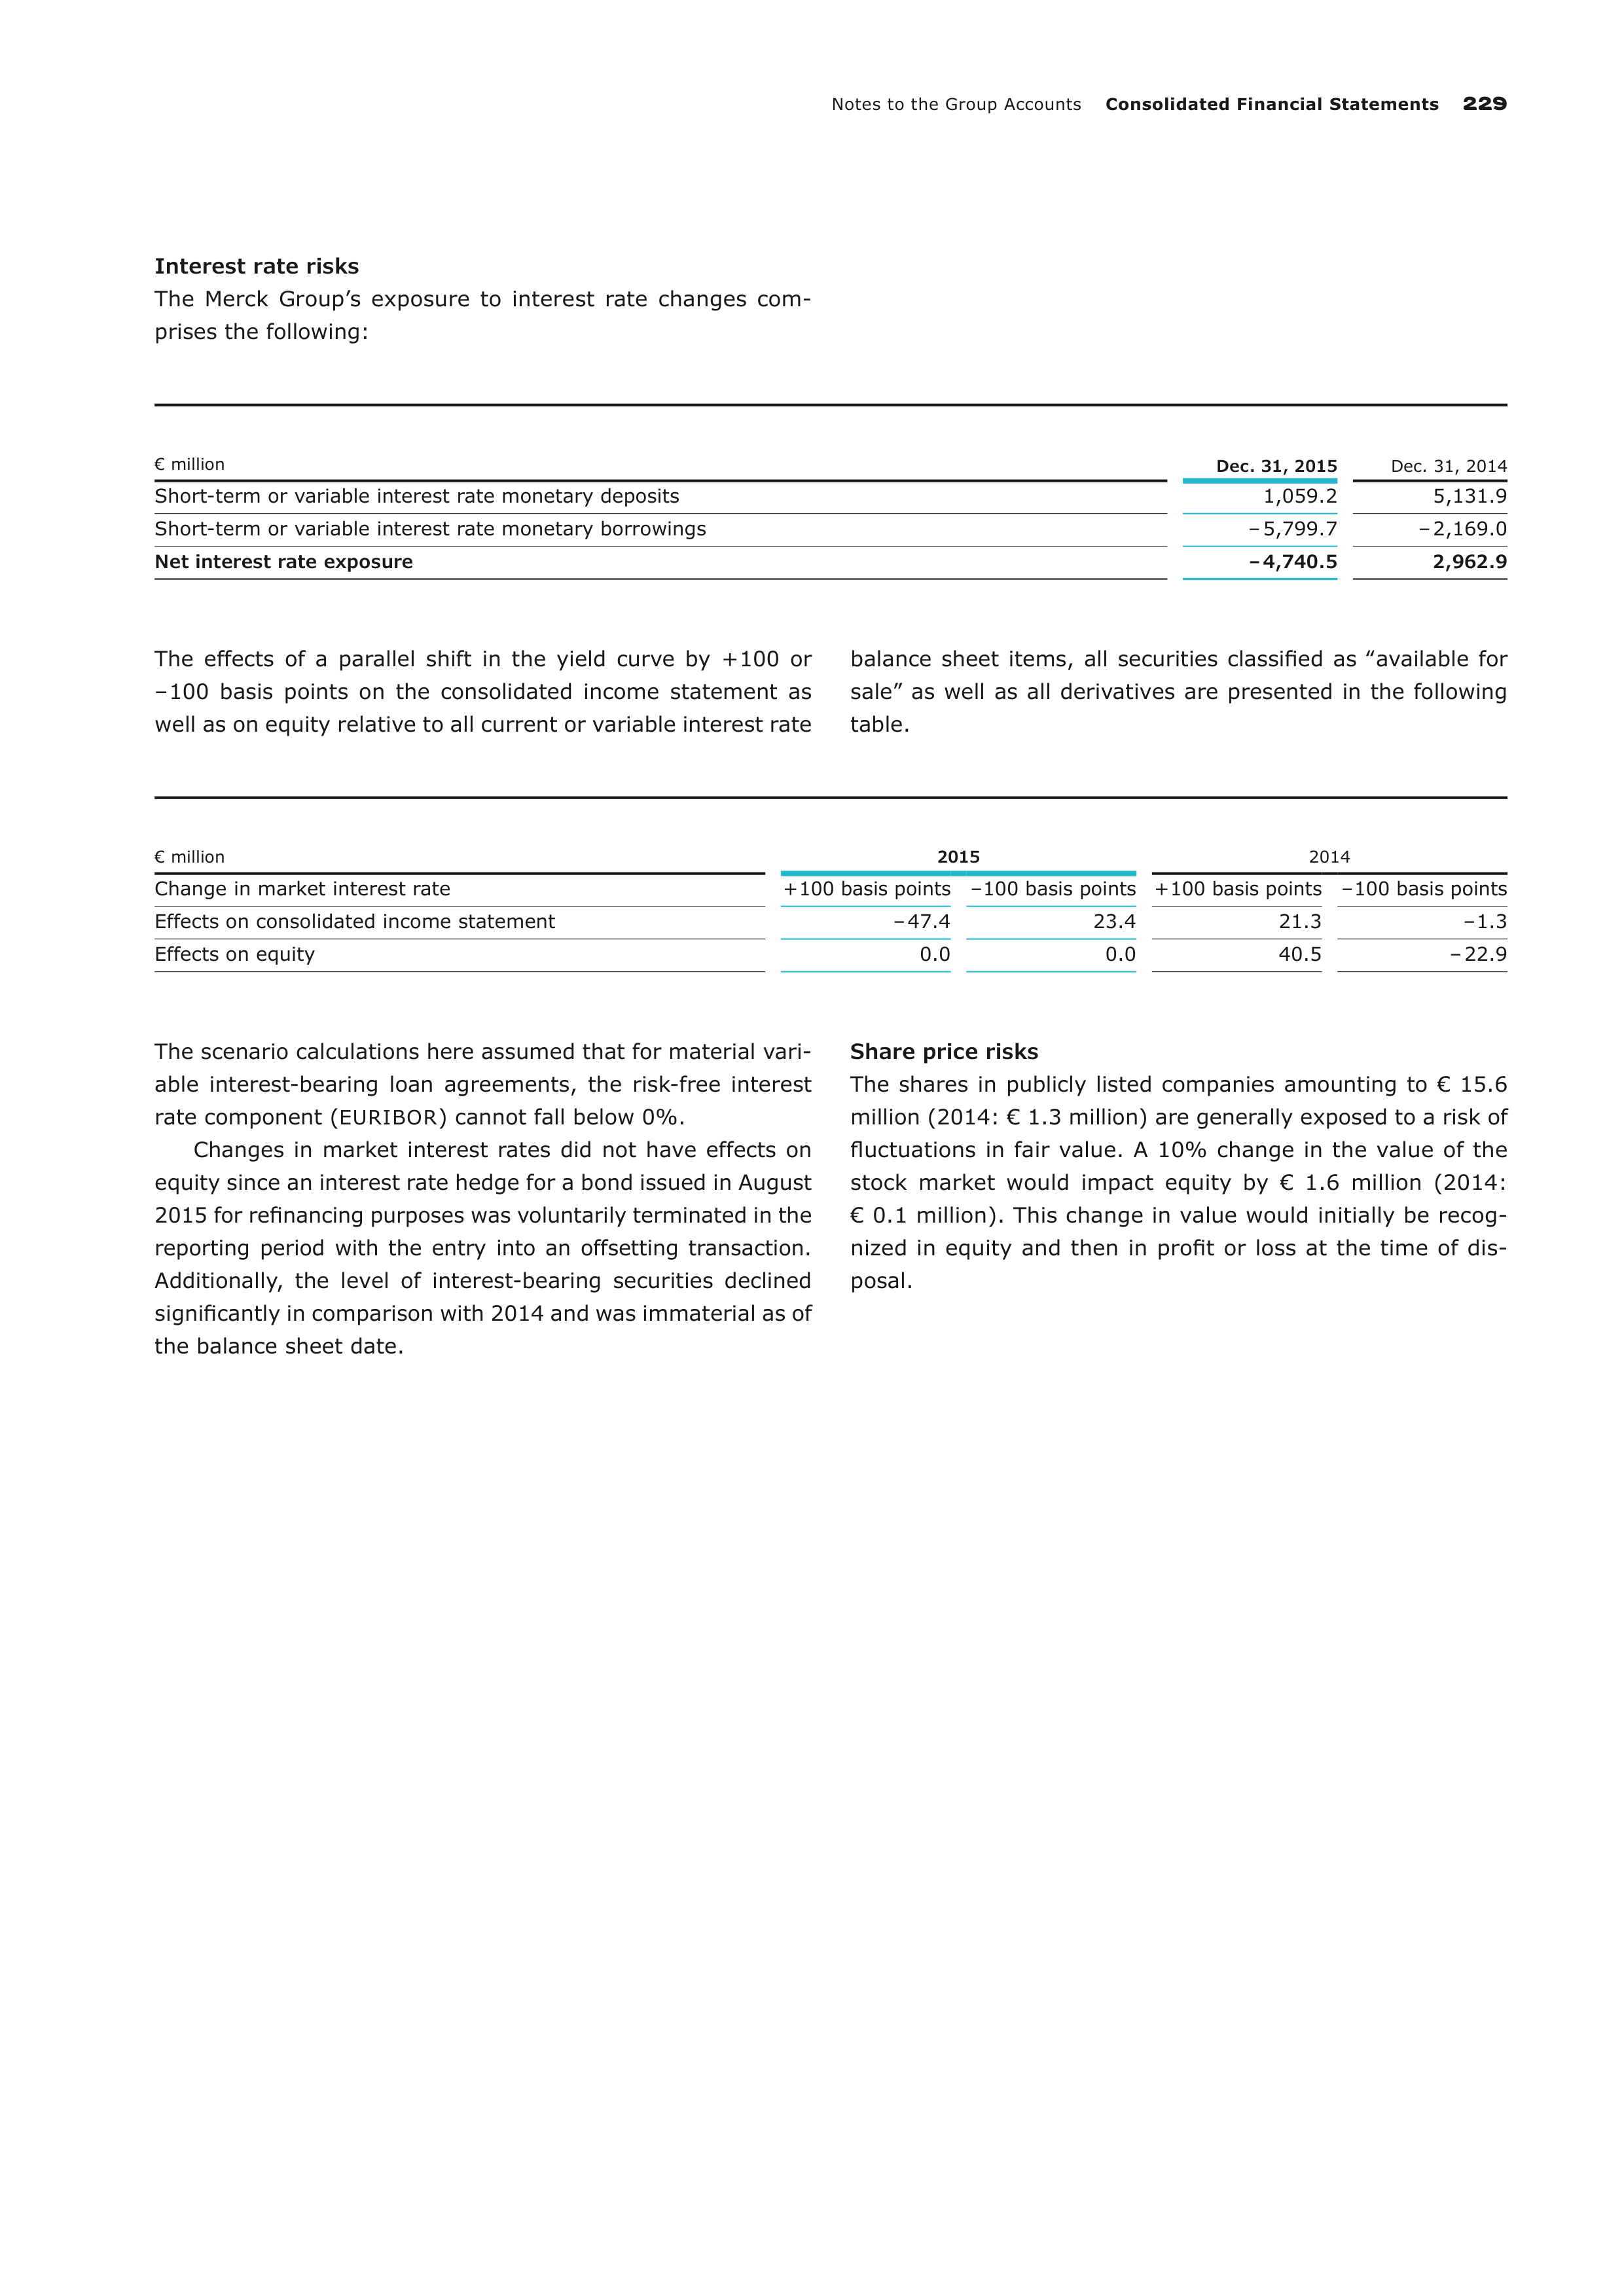
Notes to the Group Accounts
Consolidated Financial Statements
229
Interest rate risks
The Merck Group’s exposure to interest rate changes com-
prises the following:
€ million
Dec. 31, 2015
Dec. 31, 2014
Short-term or variable interest rate monetary deposits
1,059.2
5,131.9
Short-term or variable interest rate monetary borrowings
– 5,799.7
– 2,169.0
Net interest rate exposure
– 4,740.5
2,962.9
The effects of a parallel shift in the yield curve by + 100 or
– 100 basis points on the consolidated income statement as
well as on equity relative to all current or variable interest rate
balance sheet items, all securities classified as ‟available for
sale” as well as all derivatives are presented in the following
table.
€ million
2015
2014
Change in market interest rate
+ 100 basis points
– 100 basis points
+ 100 basis points
– 100 basis points
Effects on consolidated income statement
– 47.4
23.4
21.3
– 1.3
Effects on equity
0.0
0.0
40.5
– 22.9
The scenario calculations here assumed that for material vari-
able interest-bearing loan agreements, the risk-free interest
rate component (
EURIBOR
) cannot fall below 0%.
Changes in market interest rates did not have effects on
equity since an interest rate hedge for a bond issued in August
2015 for refinancing purposes was voluntarily terminated in the
reporting period with the entry into an offsetting transaction.
Additionally, the level of interest-bearing securities declined
significantly in comparison with 2014 and was immaterial as of
the balance sheet date.
Share price risks
The shares in publicly listed companies amounting to € 15.6
million (2014: € 1.3 million) are generally exposed to a risk of
fluctuations in fair value. A 10% change in the value of the
stock market would impact equity by € 1.6 million (2014:
€ 0.1 million). This change in value would initially be recog-
nized in equity and then in profit or loss at the time of dis-
posal.
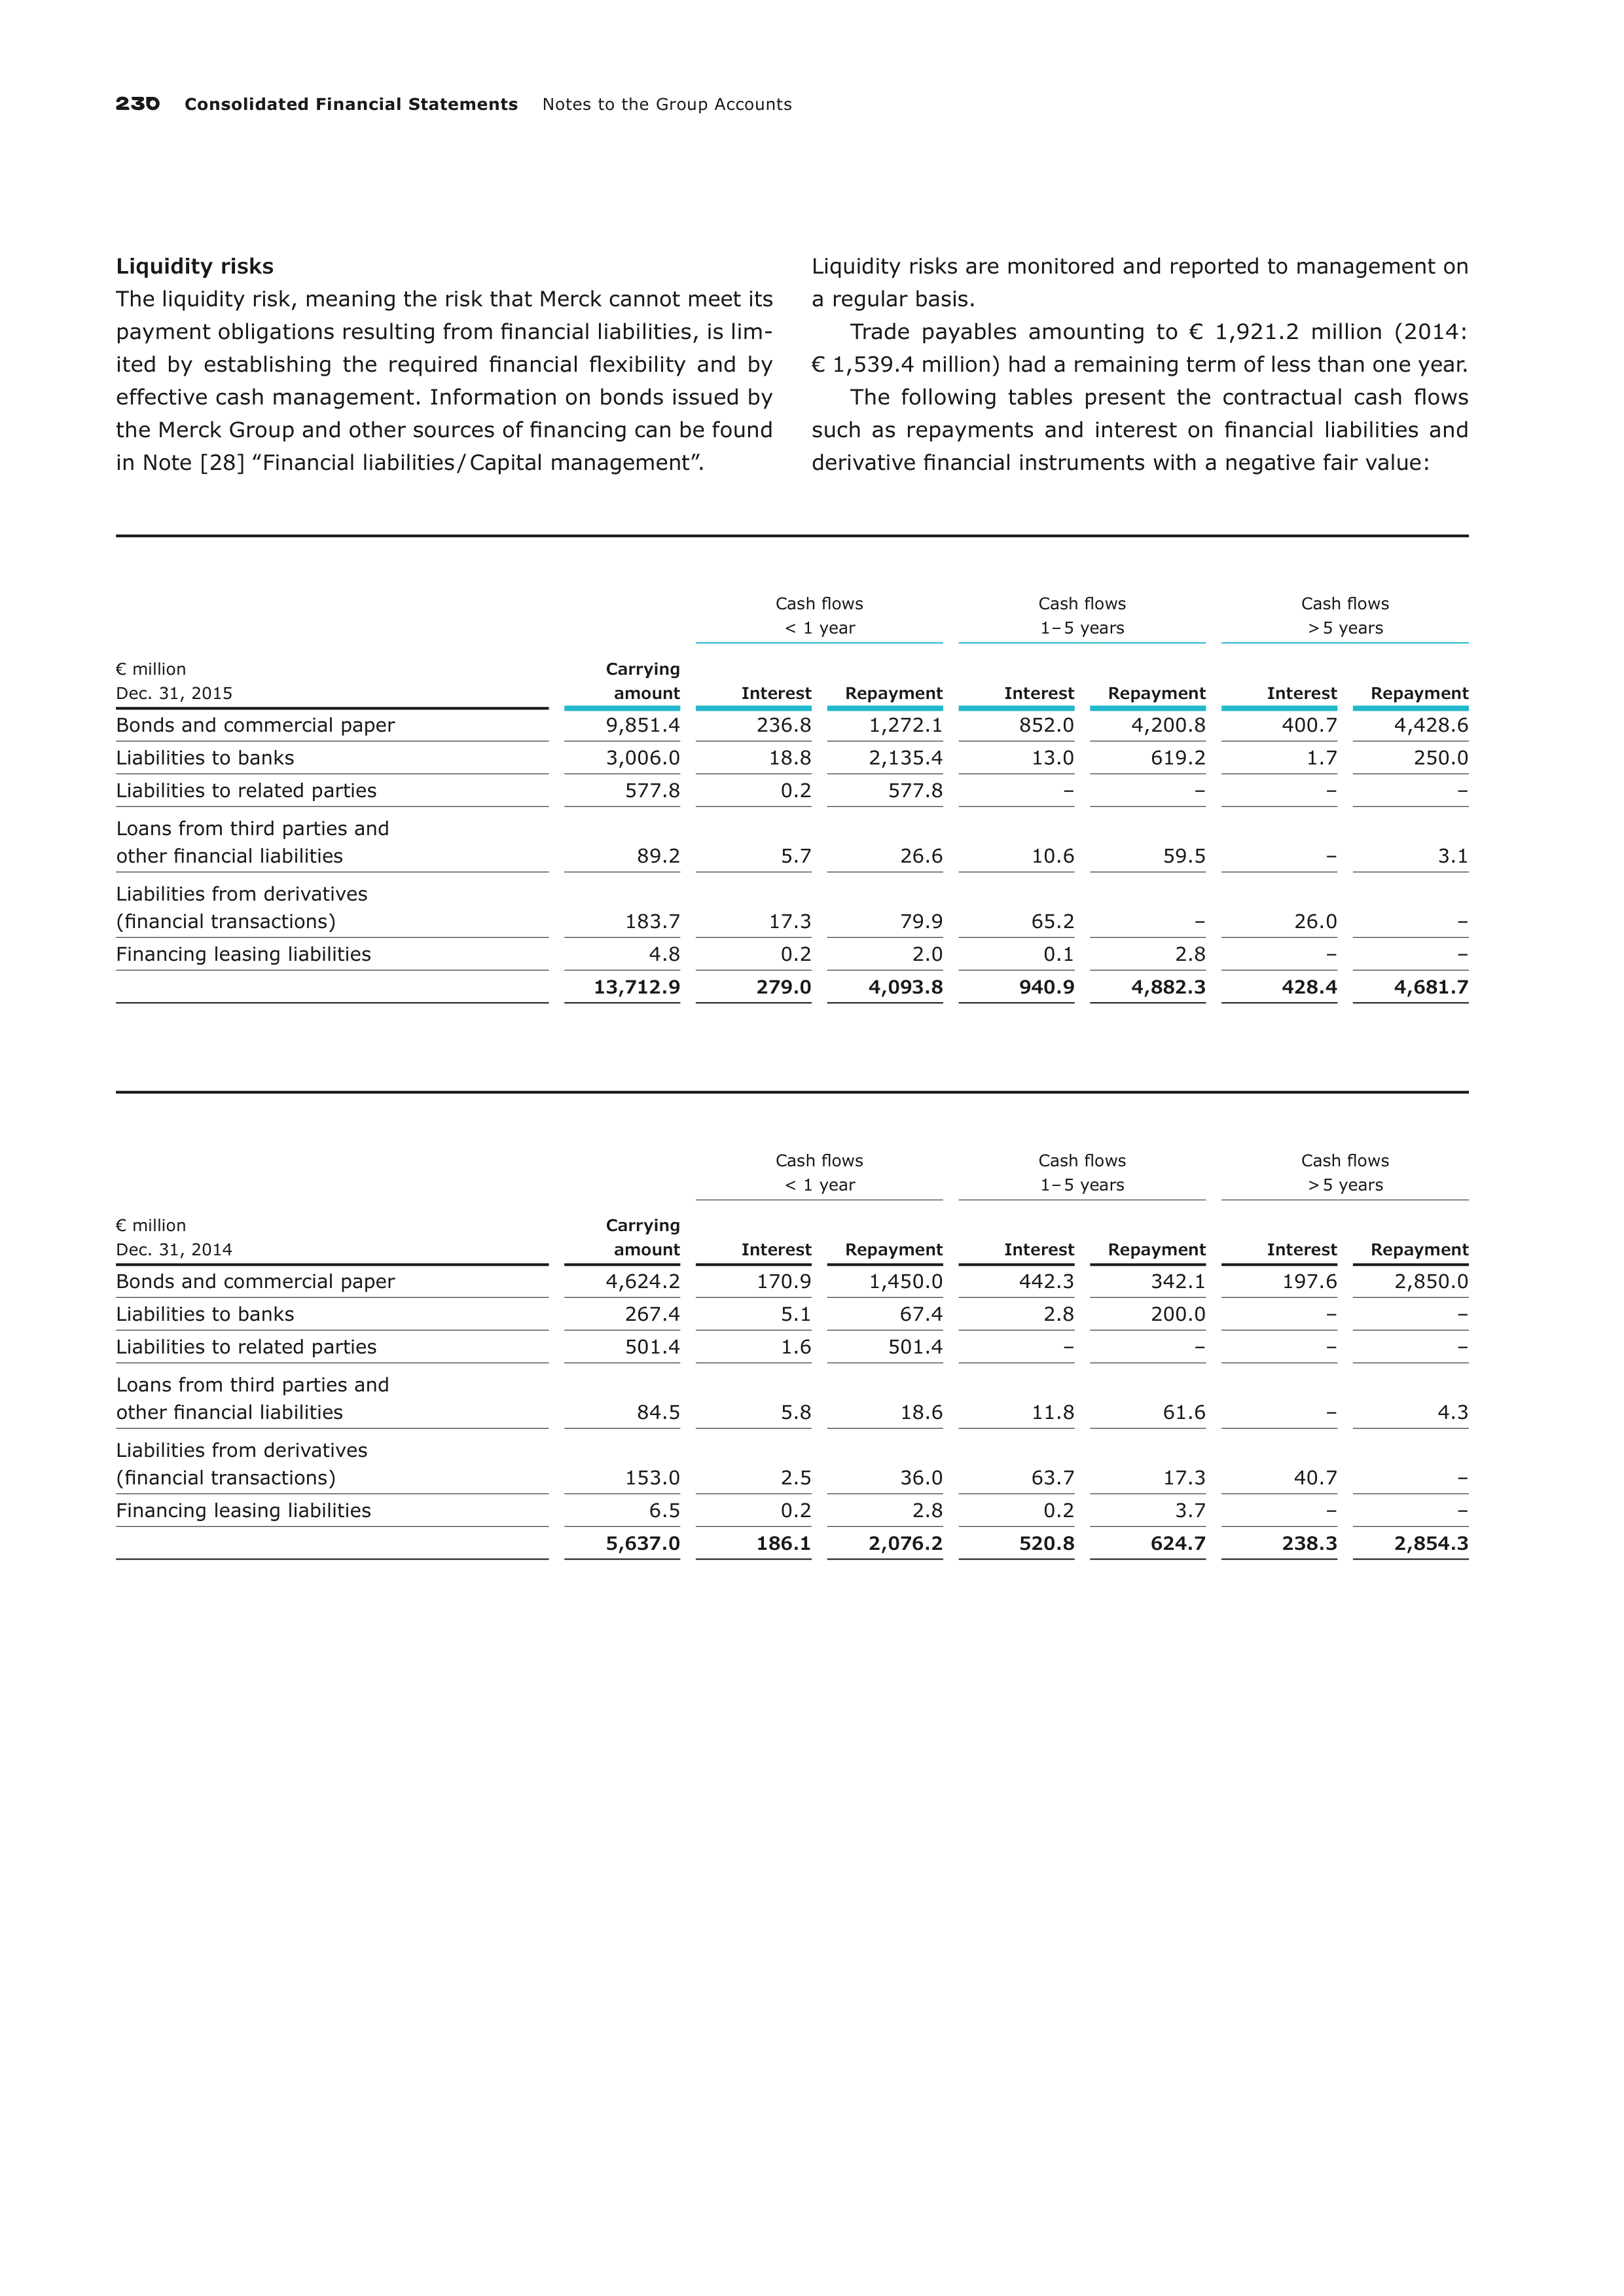
230
Consolidated Financial Statements
Notes to the Group Accounts
Liquidity risks
The liquidity risk, meaning the risk that Merck cannot meet its
payment obligations resulting from financial liabilities, is lim-
ited by establishing the required financial flexibility and by
effective cash management. Information on bonds issued by
the Merck Group and other sources of financing can be found
in Note [28] ‟Financial liabilities / Capital management”.
Liquidity risks are monitored and reported to management on
a regular basis.
Trade payables amounting to € 1,921.2 million (2014:
€ 1,539.4 million) had a remaining term of less than one year.
The following tables present the contractual cash flows
such as repayments and interest on financial liabilities and
derivative financial instruments with a negative fair value:
€ million
Dec. 31, 2015
Cash flows
< 1 year
Cash flows
1 – 5 years
Cash flows
> 5 years
Carrying
amount
Interest
Repayment
Interest
Repayment
Interest
Repayment
Bonds and commercial paper
9,851.4
236.8
1,272.1
852.0
4,200.8
400.7
4,428.6
Liabilities to banks
3,006.0
18.8
2,135.4
13.0
619.2
1.7
250.0
Liabilities to related parties
577.8
0.2
577.8
–
–
–
–
Loans from third parties and
other financial liabilities
89.2
5.7
26.6
10.6
59.5
–
3.1
Liabilities from derivatives
(financial transactions)
183.7
17.3
79.9
65.2
–
26.0
–
Financing leasing liabilities
4.8
0.2
2.0
0.1
2.8
–
–
13,712.9
279.0
4,093.8
940.9
4,882.3
428.4
4,681.7
€ million
Dec. 31, 2014
Cash flows
< 1 year
Cash flows
1 – 5 years
Cash flows
> 5 years
Carrying
amount
Interest
Repayment
Interest
Repayment
Interest
Repayment
Bonds and commercial paper
4,624.2
170.9
1,450.0
442.3
342.1
197.6
2,850.0
Liabilities to banks
267.4
5.1
67.4
2.8
200.0
–
–
Liabilities to related parties
501.4
1.6
501.4
–
–
–
–
Loans from third parties and
other financial liabilities
84.5
5.8
18.6
11.8
61.6
–
4.3
Liabilities from derivatives
(financial transactions)
153.0
2.5
36.0
63.7
17.3
40.7
–
Financing leasing liabilities
6.5
0.2
2.8
0.2
3.7
–
–
5,637.0
186.1
2,076.2
520.8
624.7
238.3
2,854.3
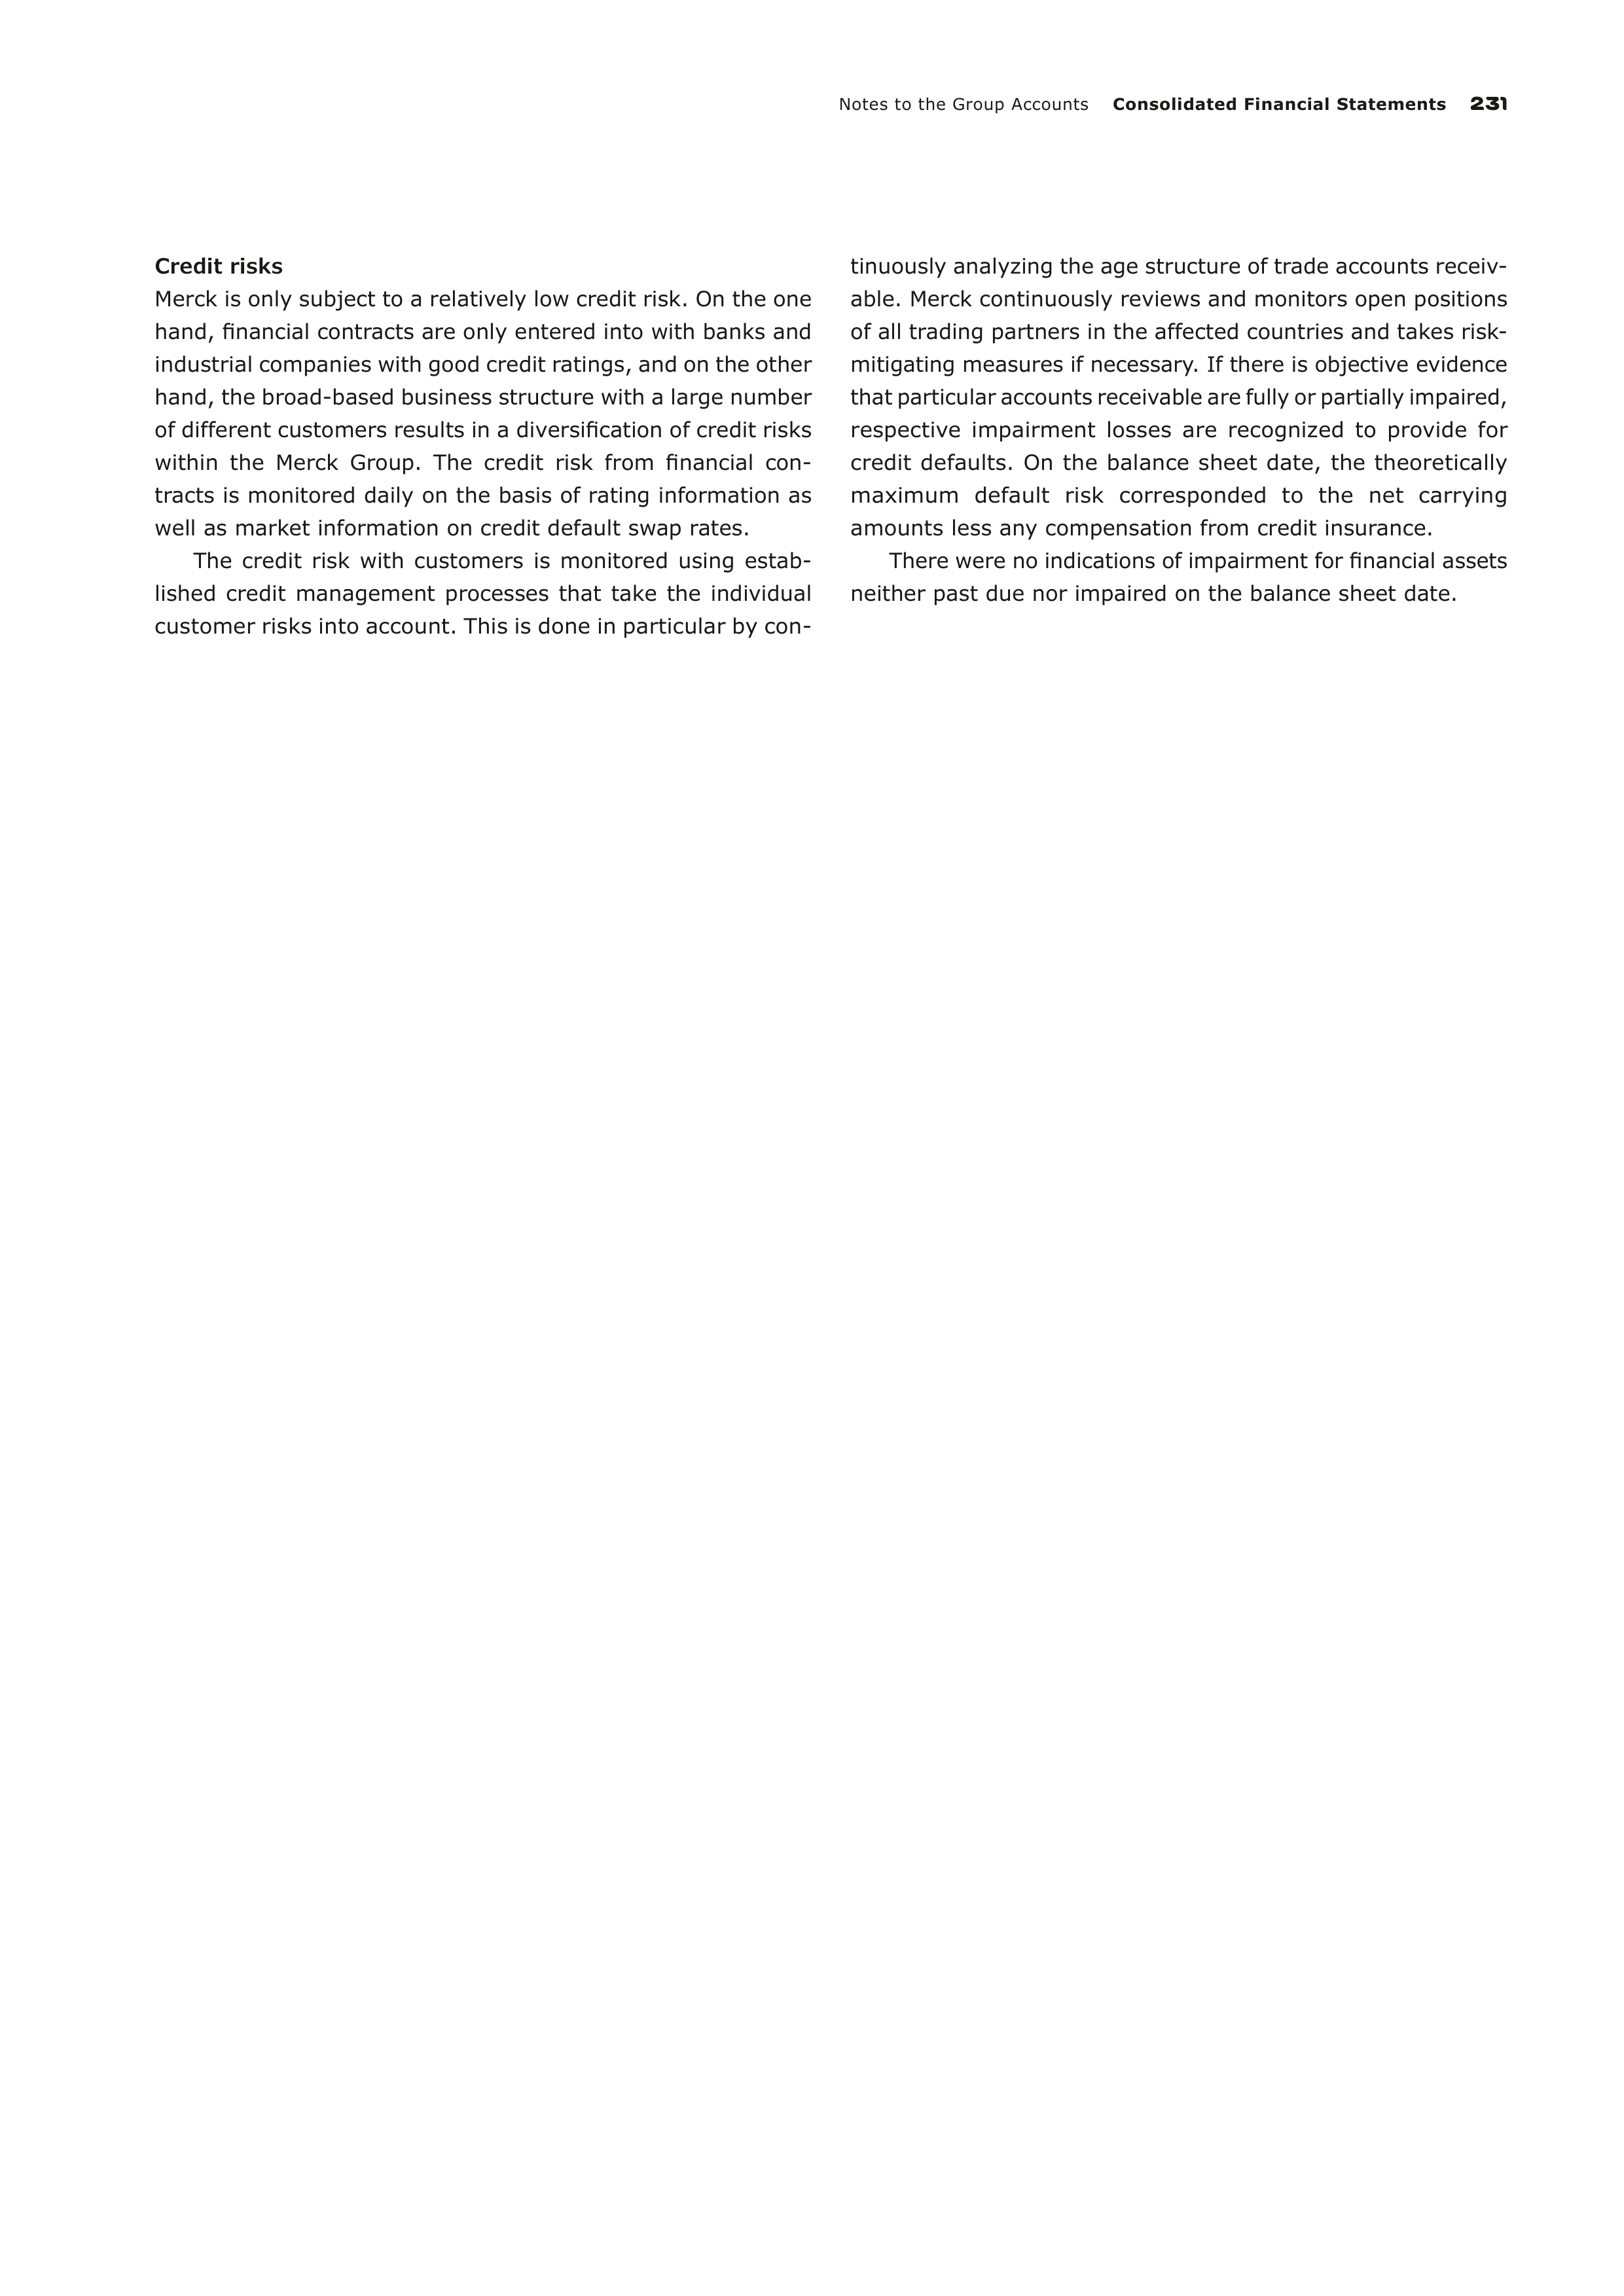
Notes to the Group Accounts
Consolidated Financial Statements
231
Credit risks
Merck is only subject to a relatively low credit risk. On the one
hand, financial contracts are only entered into with banks and
industrial companies with good credit ratings, and on the other
hand, the broad-based business structure with a large number
of different customers results in a diversification of credit risks
within the Merck Group. The credit risk from financial con-
tracts is monitored daily on the basis of rating information as
well as market information on credit default swap rates.
The credit risk with customers is monitored using estab-
lished credit management processes that take the individual
customer risks into account. This is done in particular by con-
tinuously analyzing the age structure of trade accounts receiv-
able. Merck continuously reviews and monitors open positions
of all trading partners in the affected countries and takes risk-
mitigating measures if necessary. If there is objective evidence
that particular accounts receivable are fully or partially impaired,
respective impairment losses are recognized to provide for
credit defaults. On the balance sheet date, the theoretically
maximum default risk corresponded to the net carrying
amounts less
any compensation from credit insurance.
There were no indications of impairment for financial assets
neither past due nor impaired on the balance sheet date.
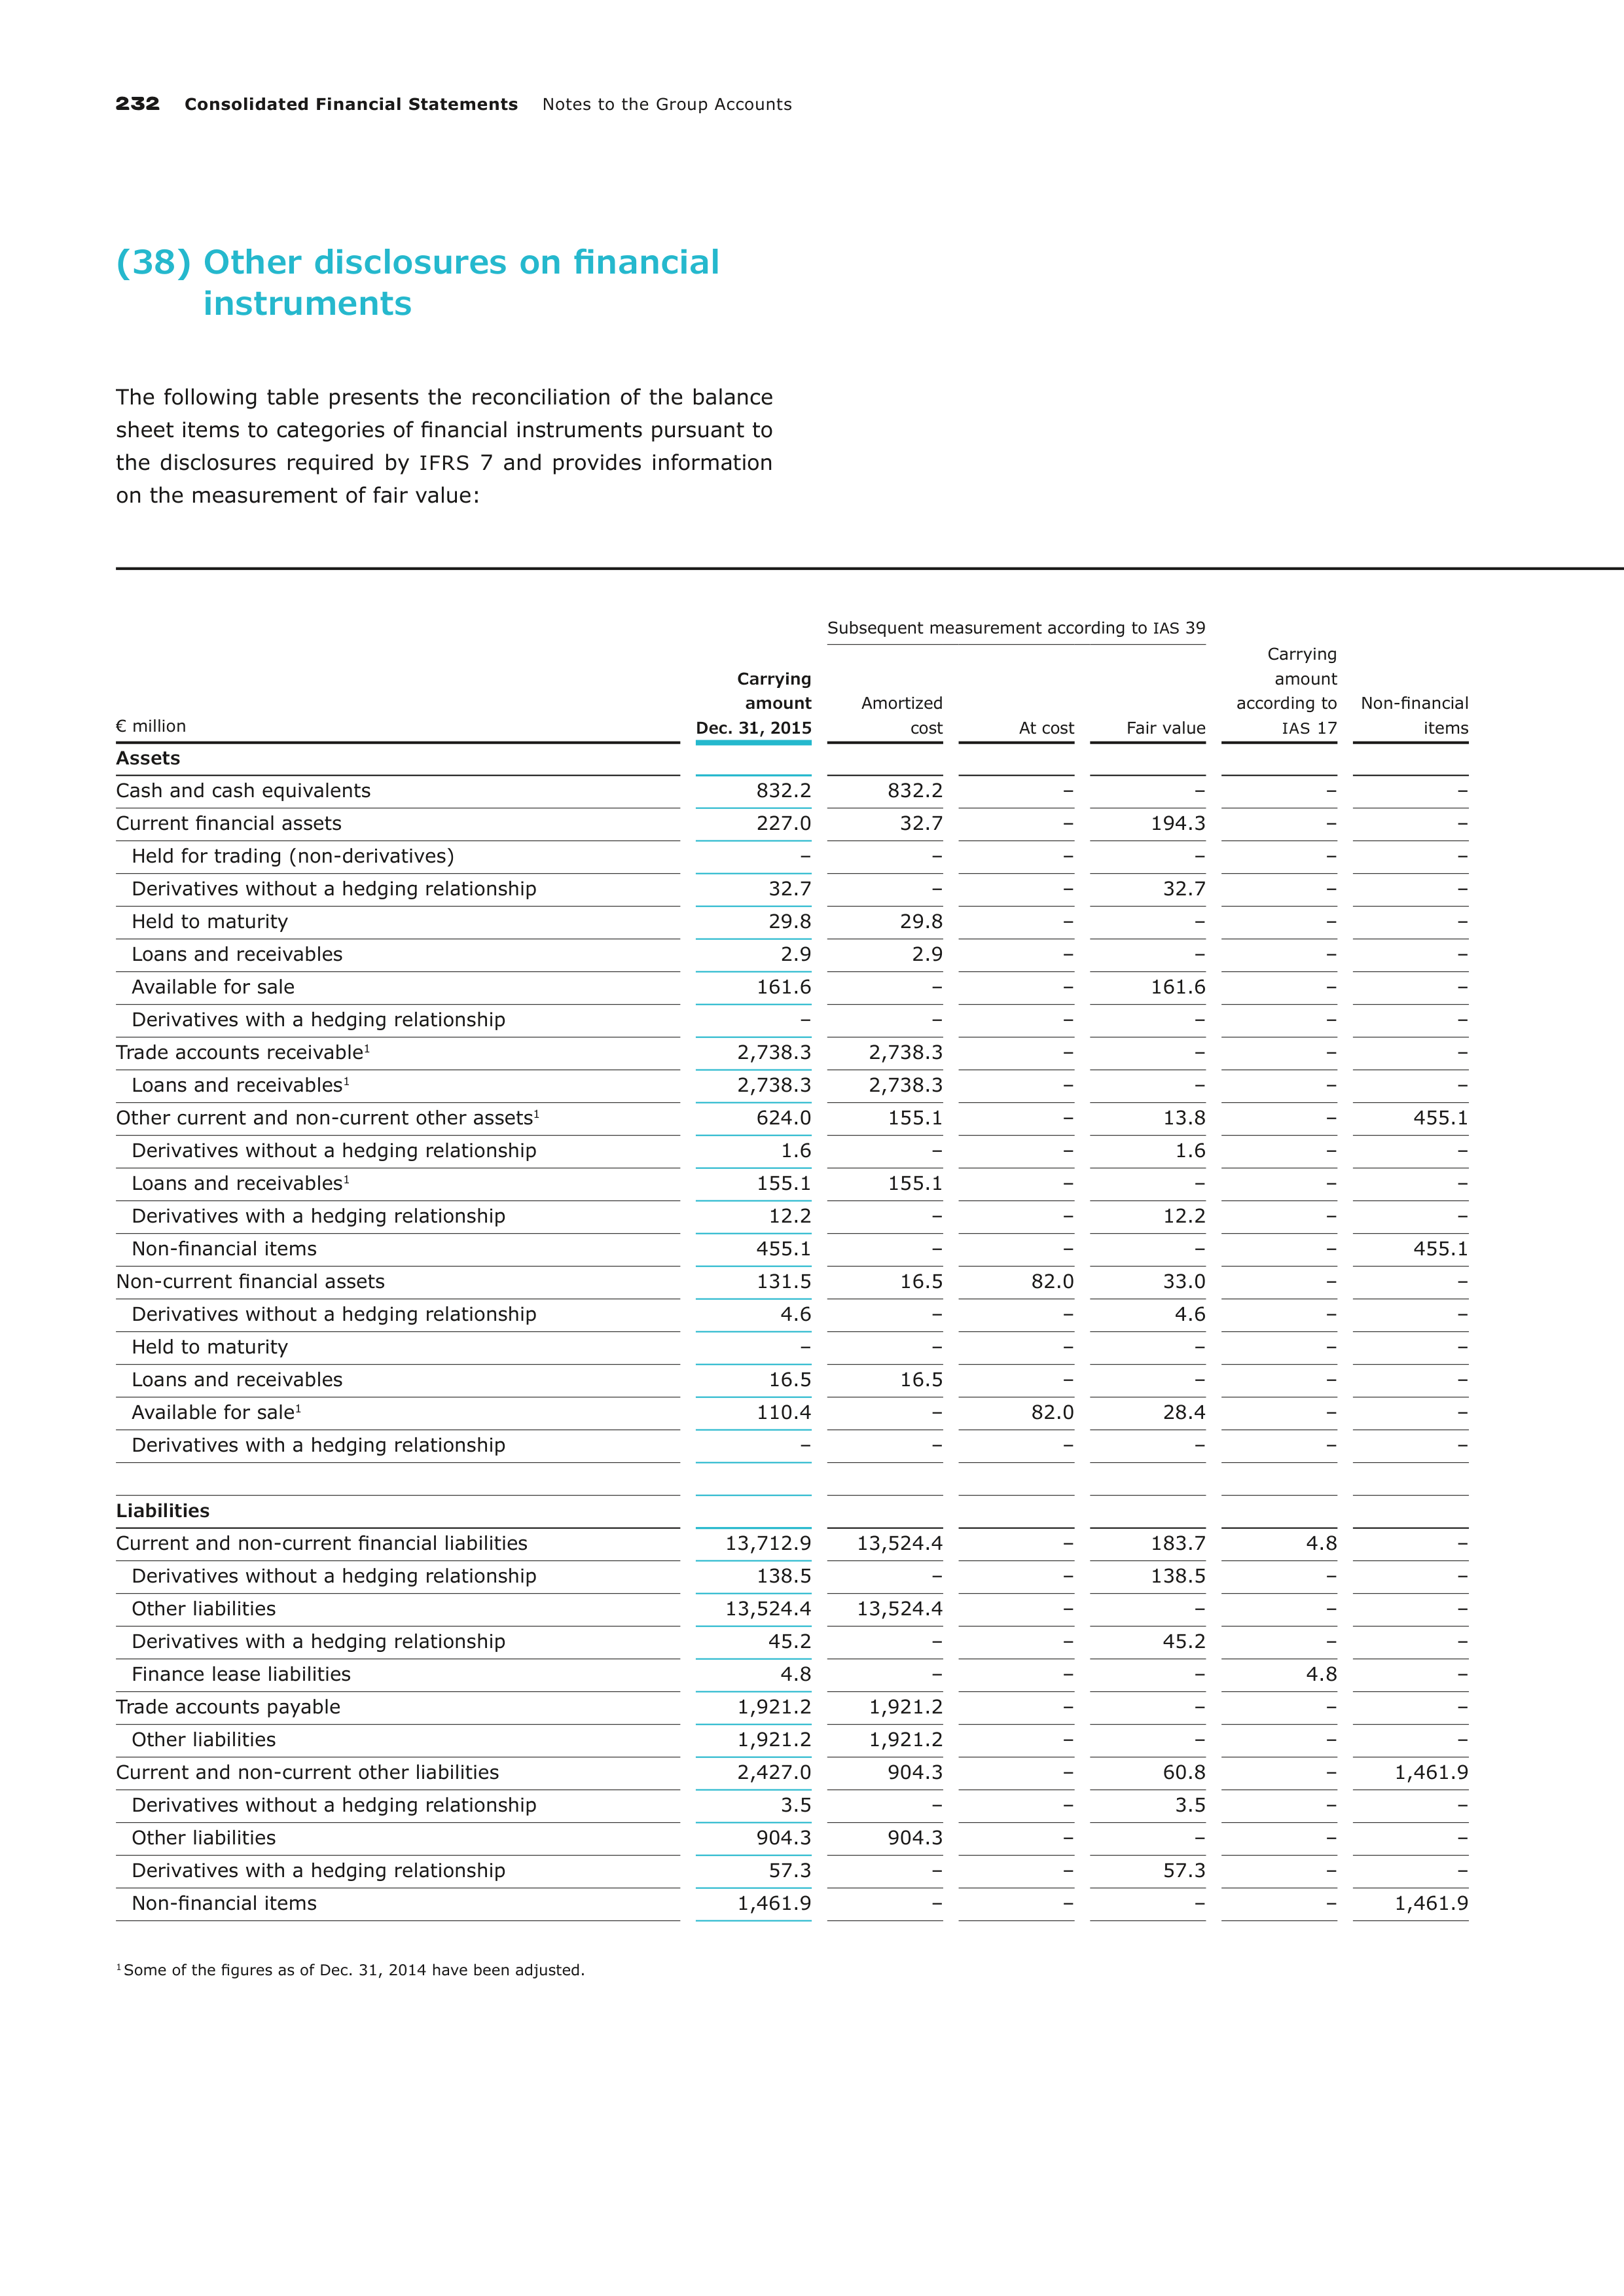
232
Consolidated Financial Statements
Notes to the Group Accounts
(38) Other disclosures on financial
instruments
The following table presents the reconciliation of the balance
sheet items to categories of financial instruments pursuant to
the disclosures required by
IFRS
7 and provides information
on the measurement of fair value:
€ million
Subsequent measurement according to
IAS
39
Carrying
amount
Dec. 31, 2015
Amortized
cost
At cost
Fair value
Carrying
amount
according to
IAS
17
Non-financial
items
Assets
Cash and cash equivalents
832.2
832.2
–
–
–
–
Current financial assets
227.0
32.7
–
194.3
–
–
Held for trading (non-derivatives)
–
–
–
–
–
–
Derivatives without a hedging relationship
32.7
–
–
32.7
–
–
Held to maturity
29.8
29.8
–
–
–
–
Loans and receivables
2.9
2.9
–
–
–
–
Available for sale
161.6
–
–
161.6
–
–
Derivatives with a hedging relationship
–
–
–
–
–
–
Trade accounts receivable
1
2,738.3
2,738.3
–
–
–
–
Loans and receivables
1
2,738.3
2,738.3
–
–
–
–
Other current and non-current other assets
1
624.0
155.1
–
13.8
–
455.1
Derivatives without a hedging relationship
1.6
–
–
1.6
–
–
Loans and receivables
1
155.1
155.1
–
–
–
–
Derivatives with a hedging relationship
12.2
–
–
12.2
–
–
Non-financial items
455.1
–
–
–
–
455.1
Non-current financial assets
131.5
16.5
82.0
33.0
–
–
Derivatives without a hedging relationship
4.6
–
–
4.6
–
–
Held to maturity
–
–
–
–
–
–
Loans and receivables
16.5
16.5
–
–
–
–
Available for sale
1
110.4
–
82.0
28.4
–
–
Derivatives with a hedging relationship
–
–
–
–
–
–
Liabilities
Current and non-current financial liabilities
13,712.9
13,524.4
–
183.7
4.8
–
Derivatives without a hedging relationship
138.5
–
–
138.5
–
–
Other liabilities
13,524.4
13,524.4
–
–
–
–
Derivatives with a hedging relationship
45.2
–
–
45.2
–
–
Finance lease liabilities
4.8
–
–
–
4.8
–
Trade accounts payable
1,921.2
1,921.2
–
–
–
–
Other liabilities
1,921.2
1,921.2
–
–
–
–
Current and non-current other liabilities
2,427.0
904.3
–
60.8
–
1,461.9
Derivatives without a hedging relationship
3.5
–
–
3.5
–
–
Other liabilities
904.3
904.3
–
–
–
–
Derivatives with a hedging relationship
57.3
–
–
57.3
–
–
Non-financial items
1,461.9
–
–
–
–
1,461.9
1
Some of the figures as of Dec. 31, 2014 have been adjusted.
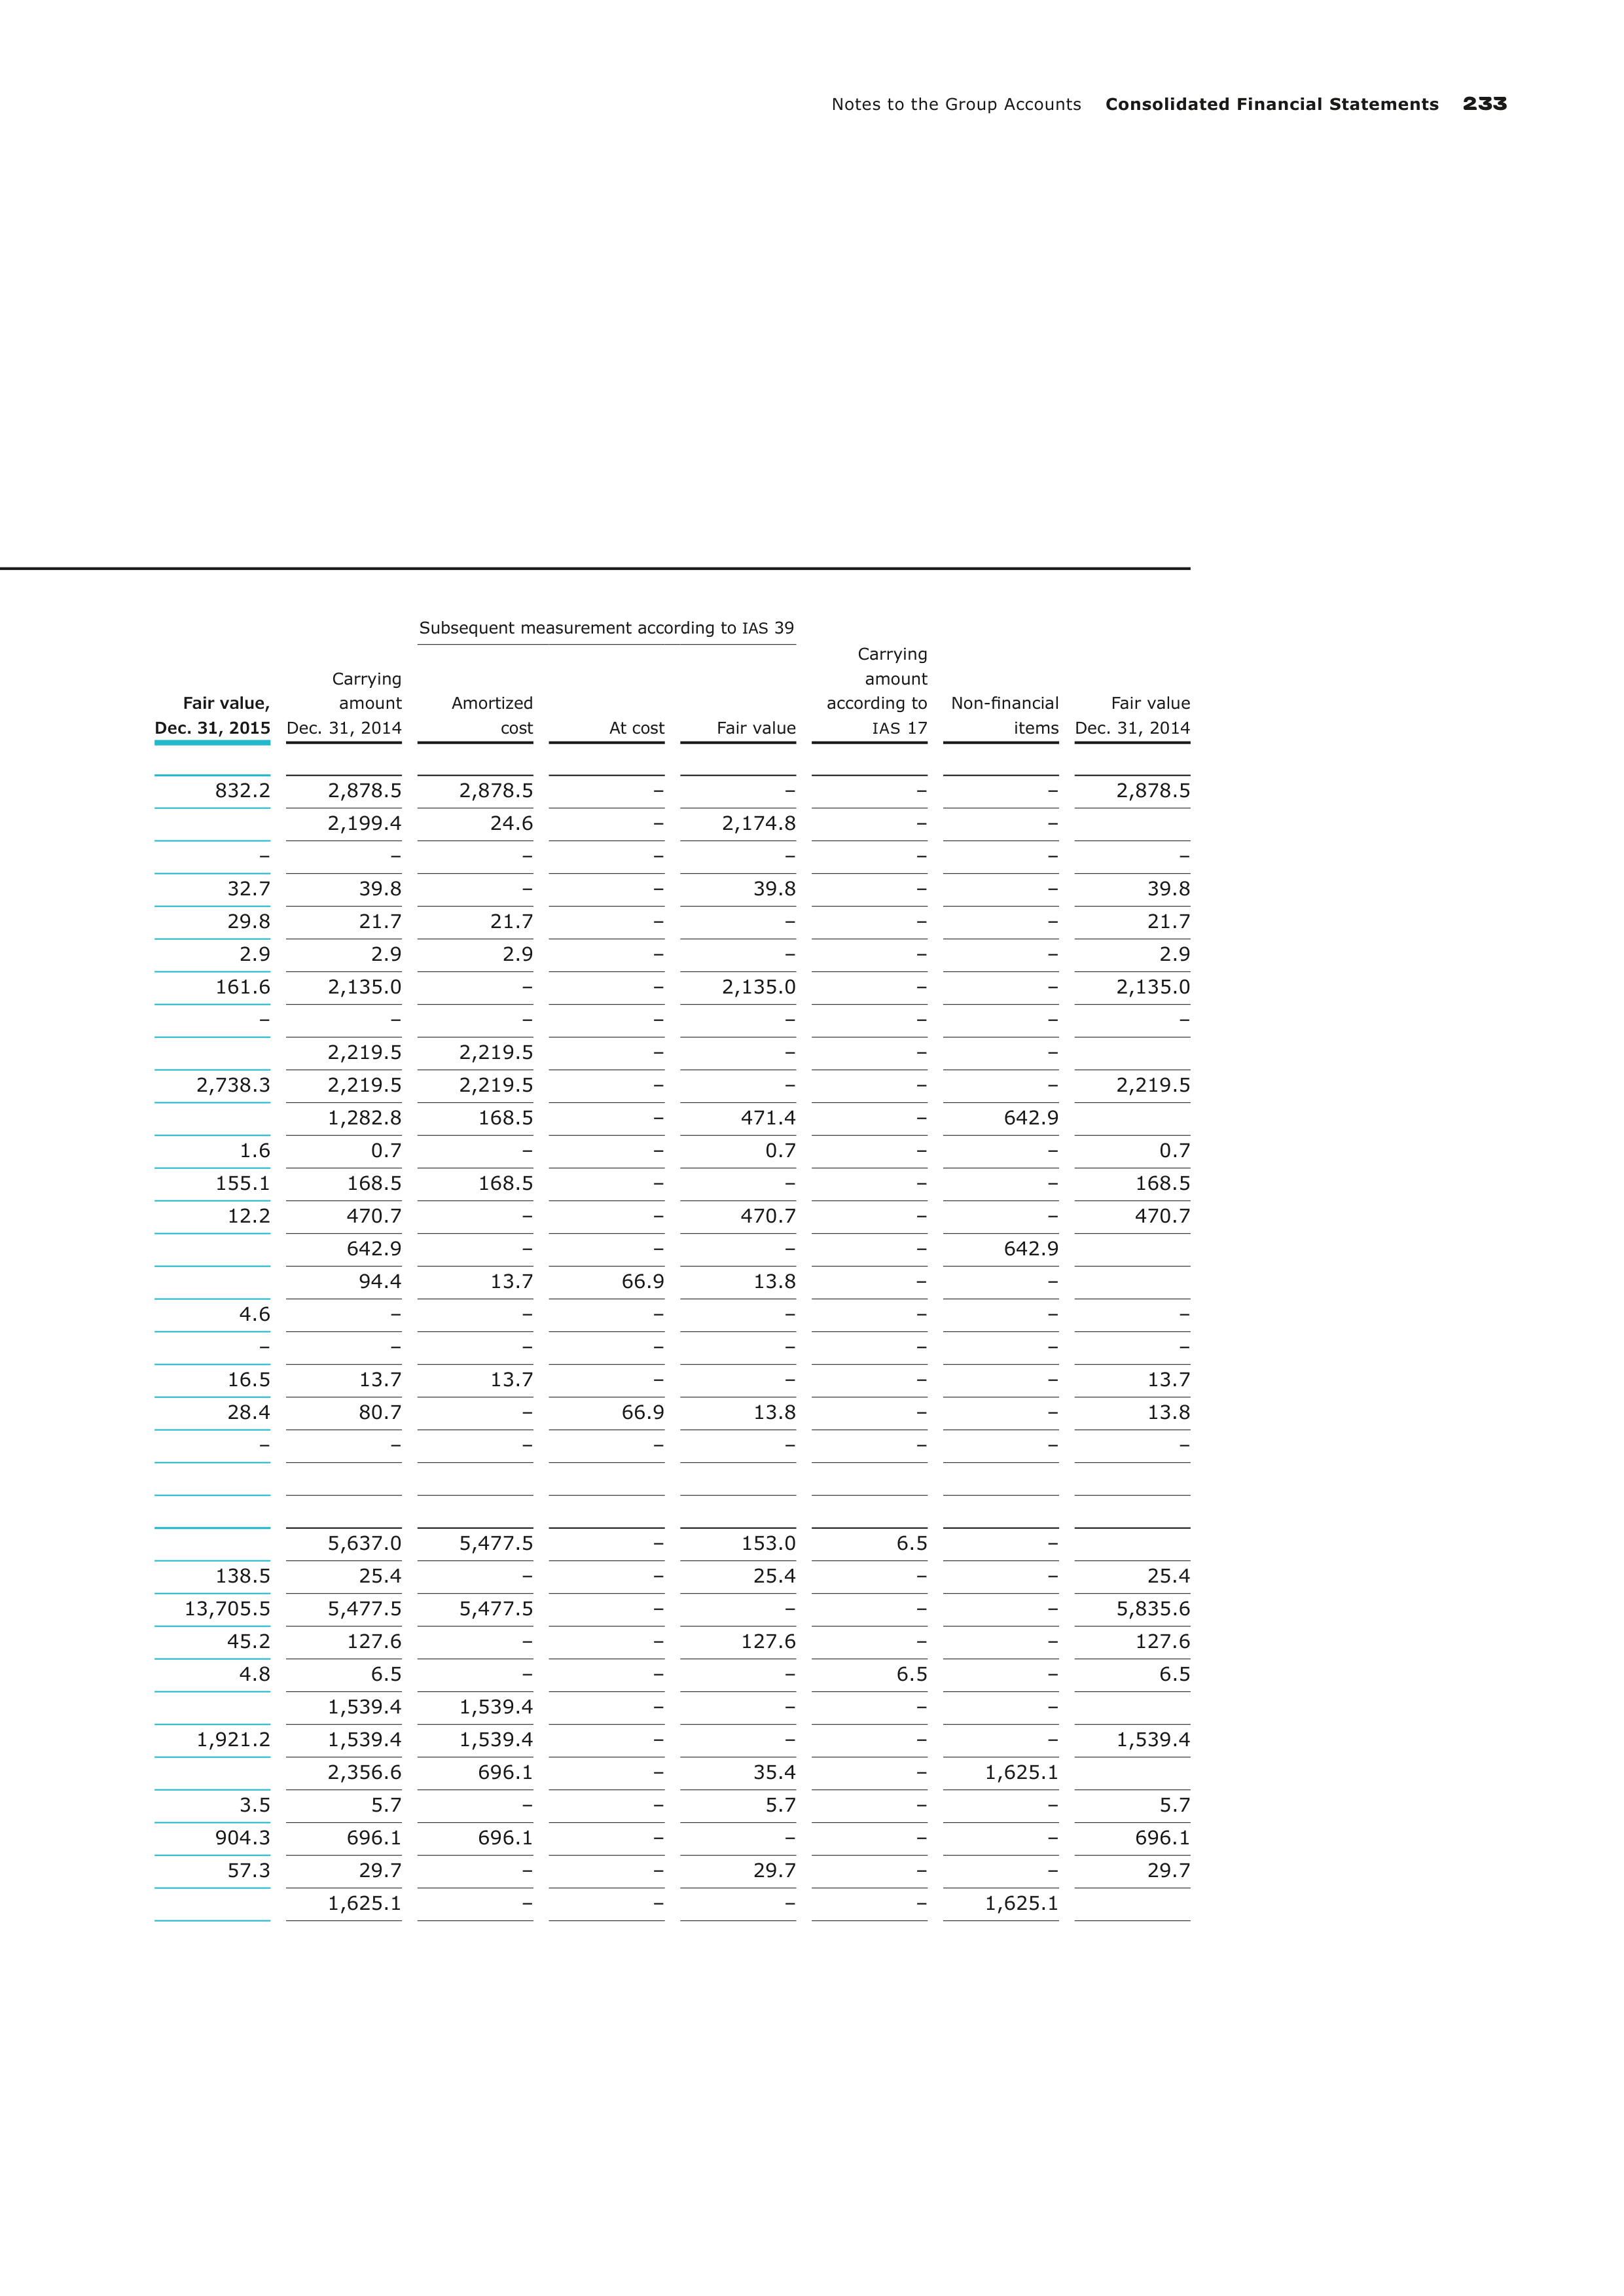
Notes to the Group Accounts
Consolidated Financial Statements
233
Subsequent measurement according to
IAS
39
Fair value,
Dec. 31, 2015
Carrying
amount
Dec. 31, 2014
Amortized
cost
At cost
Fair value
Carrying
amount
according to
IAS
17
Non-financial
items
Fair value
Dec. 31, 2014
832.2
2,878.5
2,878.5
–
–
–
–
2,878.5
2,199.4
24.6
–
2,174.8
–
–
–
–
–
–
–
–
–
–
32.7
39.8
–
–
39.8
–
–
39.8
29.8
21.7
21.7
–
–
–
–
21.7
2.9
2.9
2.9
–
–
–
–
2.9
161.6
2,135.0
–
–
2,135.0
–
–
2,135.0
–
–
–
–
–
–
–
–
2,219.5
2,219.5
–
–
–
–
2,738.3
2,219.5
2,219.5
–
–
–
–
2,219.5
1,282.8
168.5
–
471.4
–
642.9
1.6
0.7
–
–
0.7
–
–
0.7
155.1
168.5
168.5
–
–
–
–
168.5
12.2
470.7
–
–
470.7
–
–
470.7
642.9
–
–
–
–
642.9
94.4
13.7
66.9
13.8
–
–
4.6
–
–
–
–
–
–
–
–
–
–
–
–
–
–
–
16.5
13.7
13.7
–
–
–
–
13.7
28.4
80.7
–
66.9
13.8
–
–
13.8
–
–
–
–
–
–
–
–
5,637.0
5,477.5
–
153.0
6.5
–
138.5
25.4
–
–
25.4
–
–
25.4
13,705.5
5,477.5
5,477.5
–
–
–
–
5,835.6
45.2
127.6
–
–
127.6
–
–
127.6
4.8
6.5
–
–
–
6.5
–
6.5
1,539.4
1,539.4
–
–
–
–
1,921.2
1,539.4
1,539.4
–
–
–
–
1,539.4
2,356.6
696.1
–
35.4
–
1,625.1
3.5
5.7
–
–
5.7
–
–
5.7
904.3
696.1
696.1
–
–
–
–
696.1
57.3
29.7
–
–
29.7
–
–
29.7
1,625.1
–
–
–
–
1,625.1
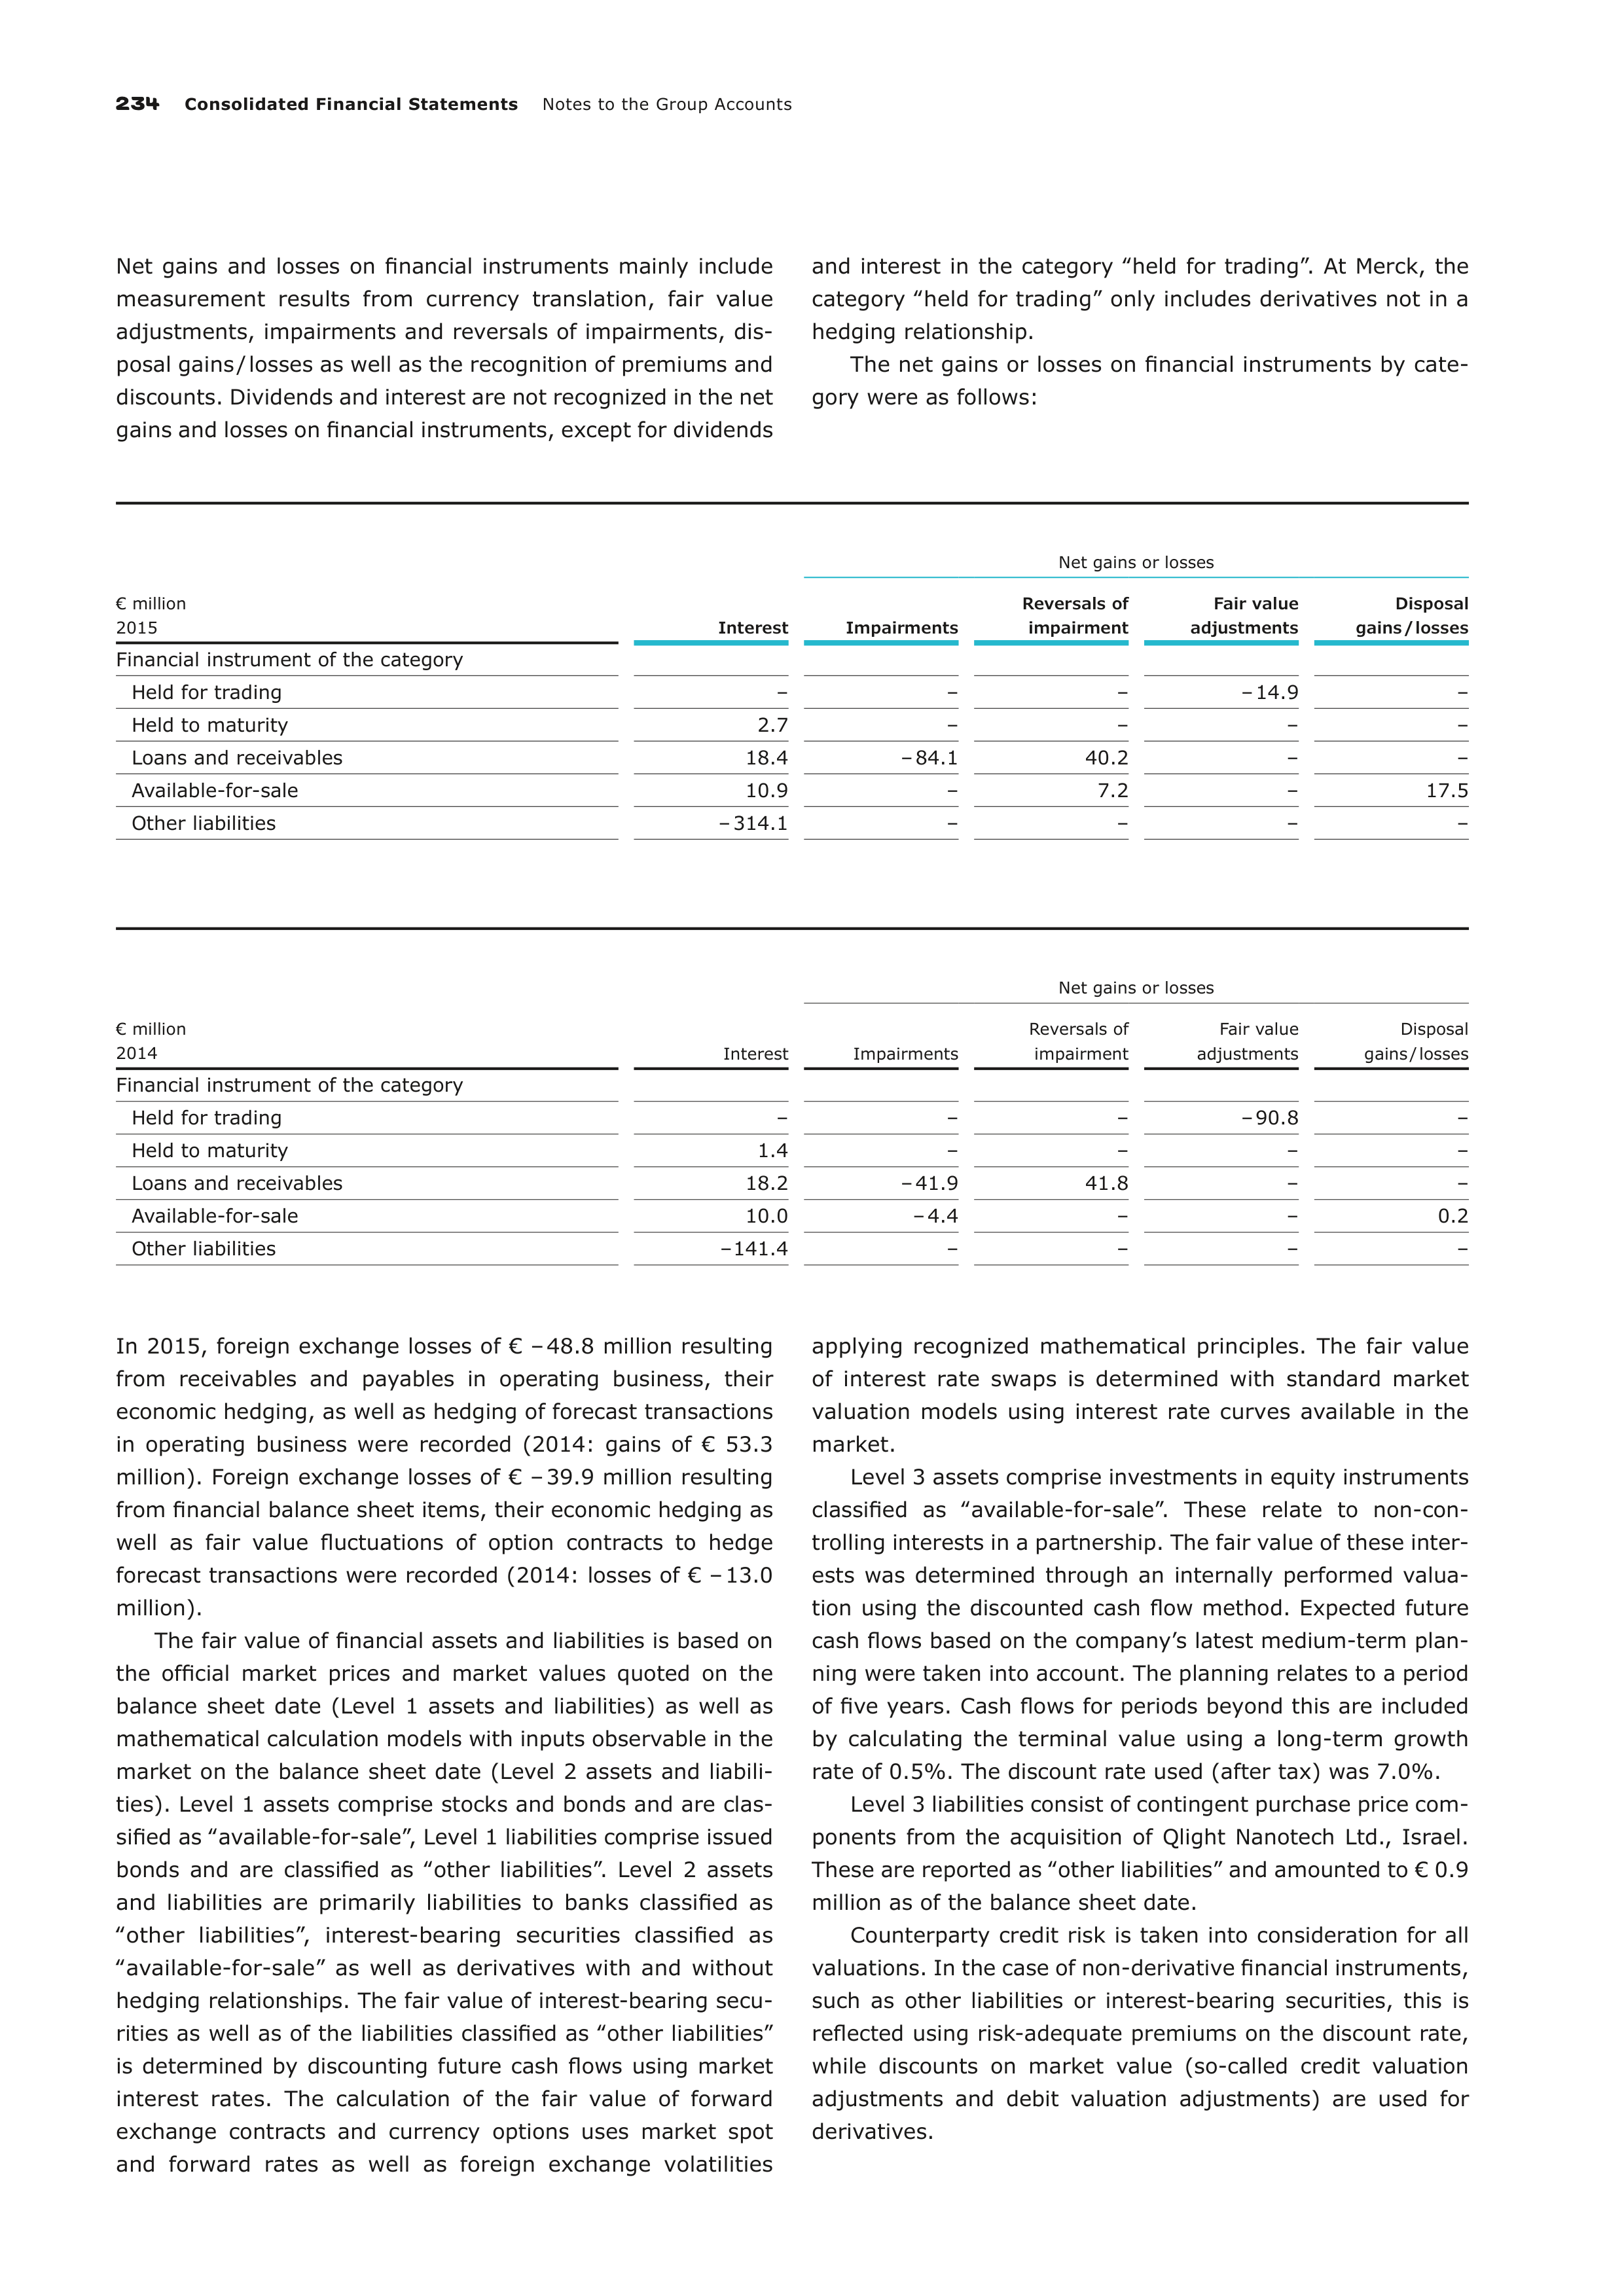
234
Consolidated Financial Statements
Notes to the Group Accounts
Net gains and losses on financial instruments mainly include
measurement results from currency translation, fair value
adjustments, impairments and reversals of impairments, dis-
posal gains / losses as well as the recognition of premiums and
discounts. Dividends and interest are not recognized in the net
gains and losses on financial instruments, except for dividends
and interest in the category ‟held for trading”. At Merck, the
category ‟held for trading” only includes derivatives not in a
hedging relationship.
The net gains or losses on financial instruments by cate-
gory were as follows:
€ million
2015
Net gains or losses
Interest
Impairments
Reversals of
impairment
Fair value
adjustments
Disposal
gains / losses
Financial instrument of the category
Held for trading
–
–
–
– 14.9
–
Held to maturity
2.7
–
–
–
–
Loans and receivables
18.4
– 84.1
40.2
–
–
Available-for-sale
10.9
–
7.2
–
17.5
Other liabilities
– 314.1
–
–
–
–
€ million
2014
Net gains or losses
Interest
Impairments
Reversals of
impairment
Fair value
adjustments
Disposal
gains / losses
Financial instrument of the category
Held for trading
–
–
–
– 90.8
–
Held to maturity
1.4
–
–
–
–
Loans and receivables
18.2
– 41.9
41.8
–
–
Available-for-sale
10.0
– 4.4
–
–
0.2
Other liabilities
– 141.4
–
–
–
–
In 2015, foreign exchange losses of € – 48.8 million resulting
from receivables and payables in operating business, their
economic hedging, as well as hedging of forecast transactions
in operating business were recorded (2014: gains of € 53.3
million). Foreign exchange losses of € – 39.9 million resulting
from financial balance sheet items, their economic hedging as
well as fair value fluctuations of option contracts to hedge
forecast transactions were recorded (2014: losses of € – 13.0
million).
The fair value of financial assets and liabilities is based on
the official market prices and market values quoted on the
balance sheet date (Level 1 assets and liabilities) as well as
mathematical calculation models with inputs observable in the
market on the balance sheet date (Level 2 assets and liabili-
ties). Level 1 assets comprise stocks and bonds and are clas-
sified as ‟available-for-sale”, Level 1 liabilities comprise issued
bonds and are classified as ‟other liabilities”. Level 2 assets
and liabilities are primarily liabilities to banks classified as
‟other liabilities”, interest-bearing securities classified as
‟available-for-sale” as well as derivatives with and without
hedging relationships. The fair value of interest-bearing secu-
rities as well as of the liabilities classified as ‟other liabilities”
is determined by discounting future cash flows using market
interest rates. The calculation of the fair value of forward
exchange contracts and currency options uses market spot
and forward rates as well as foreign exchange volatilities
applying recognized mathematical principles. The fair value
of interest rate swaps is determined with standard market
valuation models using interest rate curves available in the
market.
Level 3 assets comprise investments in equity instruments
classified as ‟available-for-sale”. These relate to non-con-
trolling interests in a partnership. The fair value of these inter-
ests was determined through an internally performed valua-
tion using the discounted cash flow method. Expected future
cash flows based on the company’s latest medium-term plan-
ning were taken into account. The planning relates to a period
of five years. Cash flows for periods beyond this are included
by calculating the terminal value using a long-term growth
rate of 0.5%. The discount rate used (after tax) was 7.0%.
Level 3 liabilities consist of contingent purchase price com-
ponents from the acquisition of Qlight Nanotech Ltd., Israel.
These are reported as ‟other liabilities” and amounted to € 0.9
million as of the balance sheet date.
Counterparty credit risk is taken into consideration for all
valuations. In the case of non-derivative financial instruments,
such as other liabilities or interest-bearing securities, this is
reflected using risk-adequate premiums on the discount rate,
while discounts on market value (so-called credit valuation
adjustments and debit valuation adjustments) are used for
derivatives.
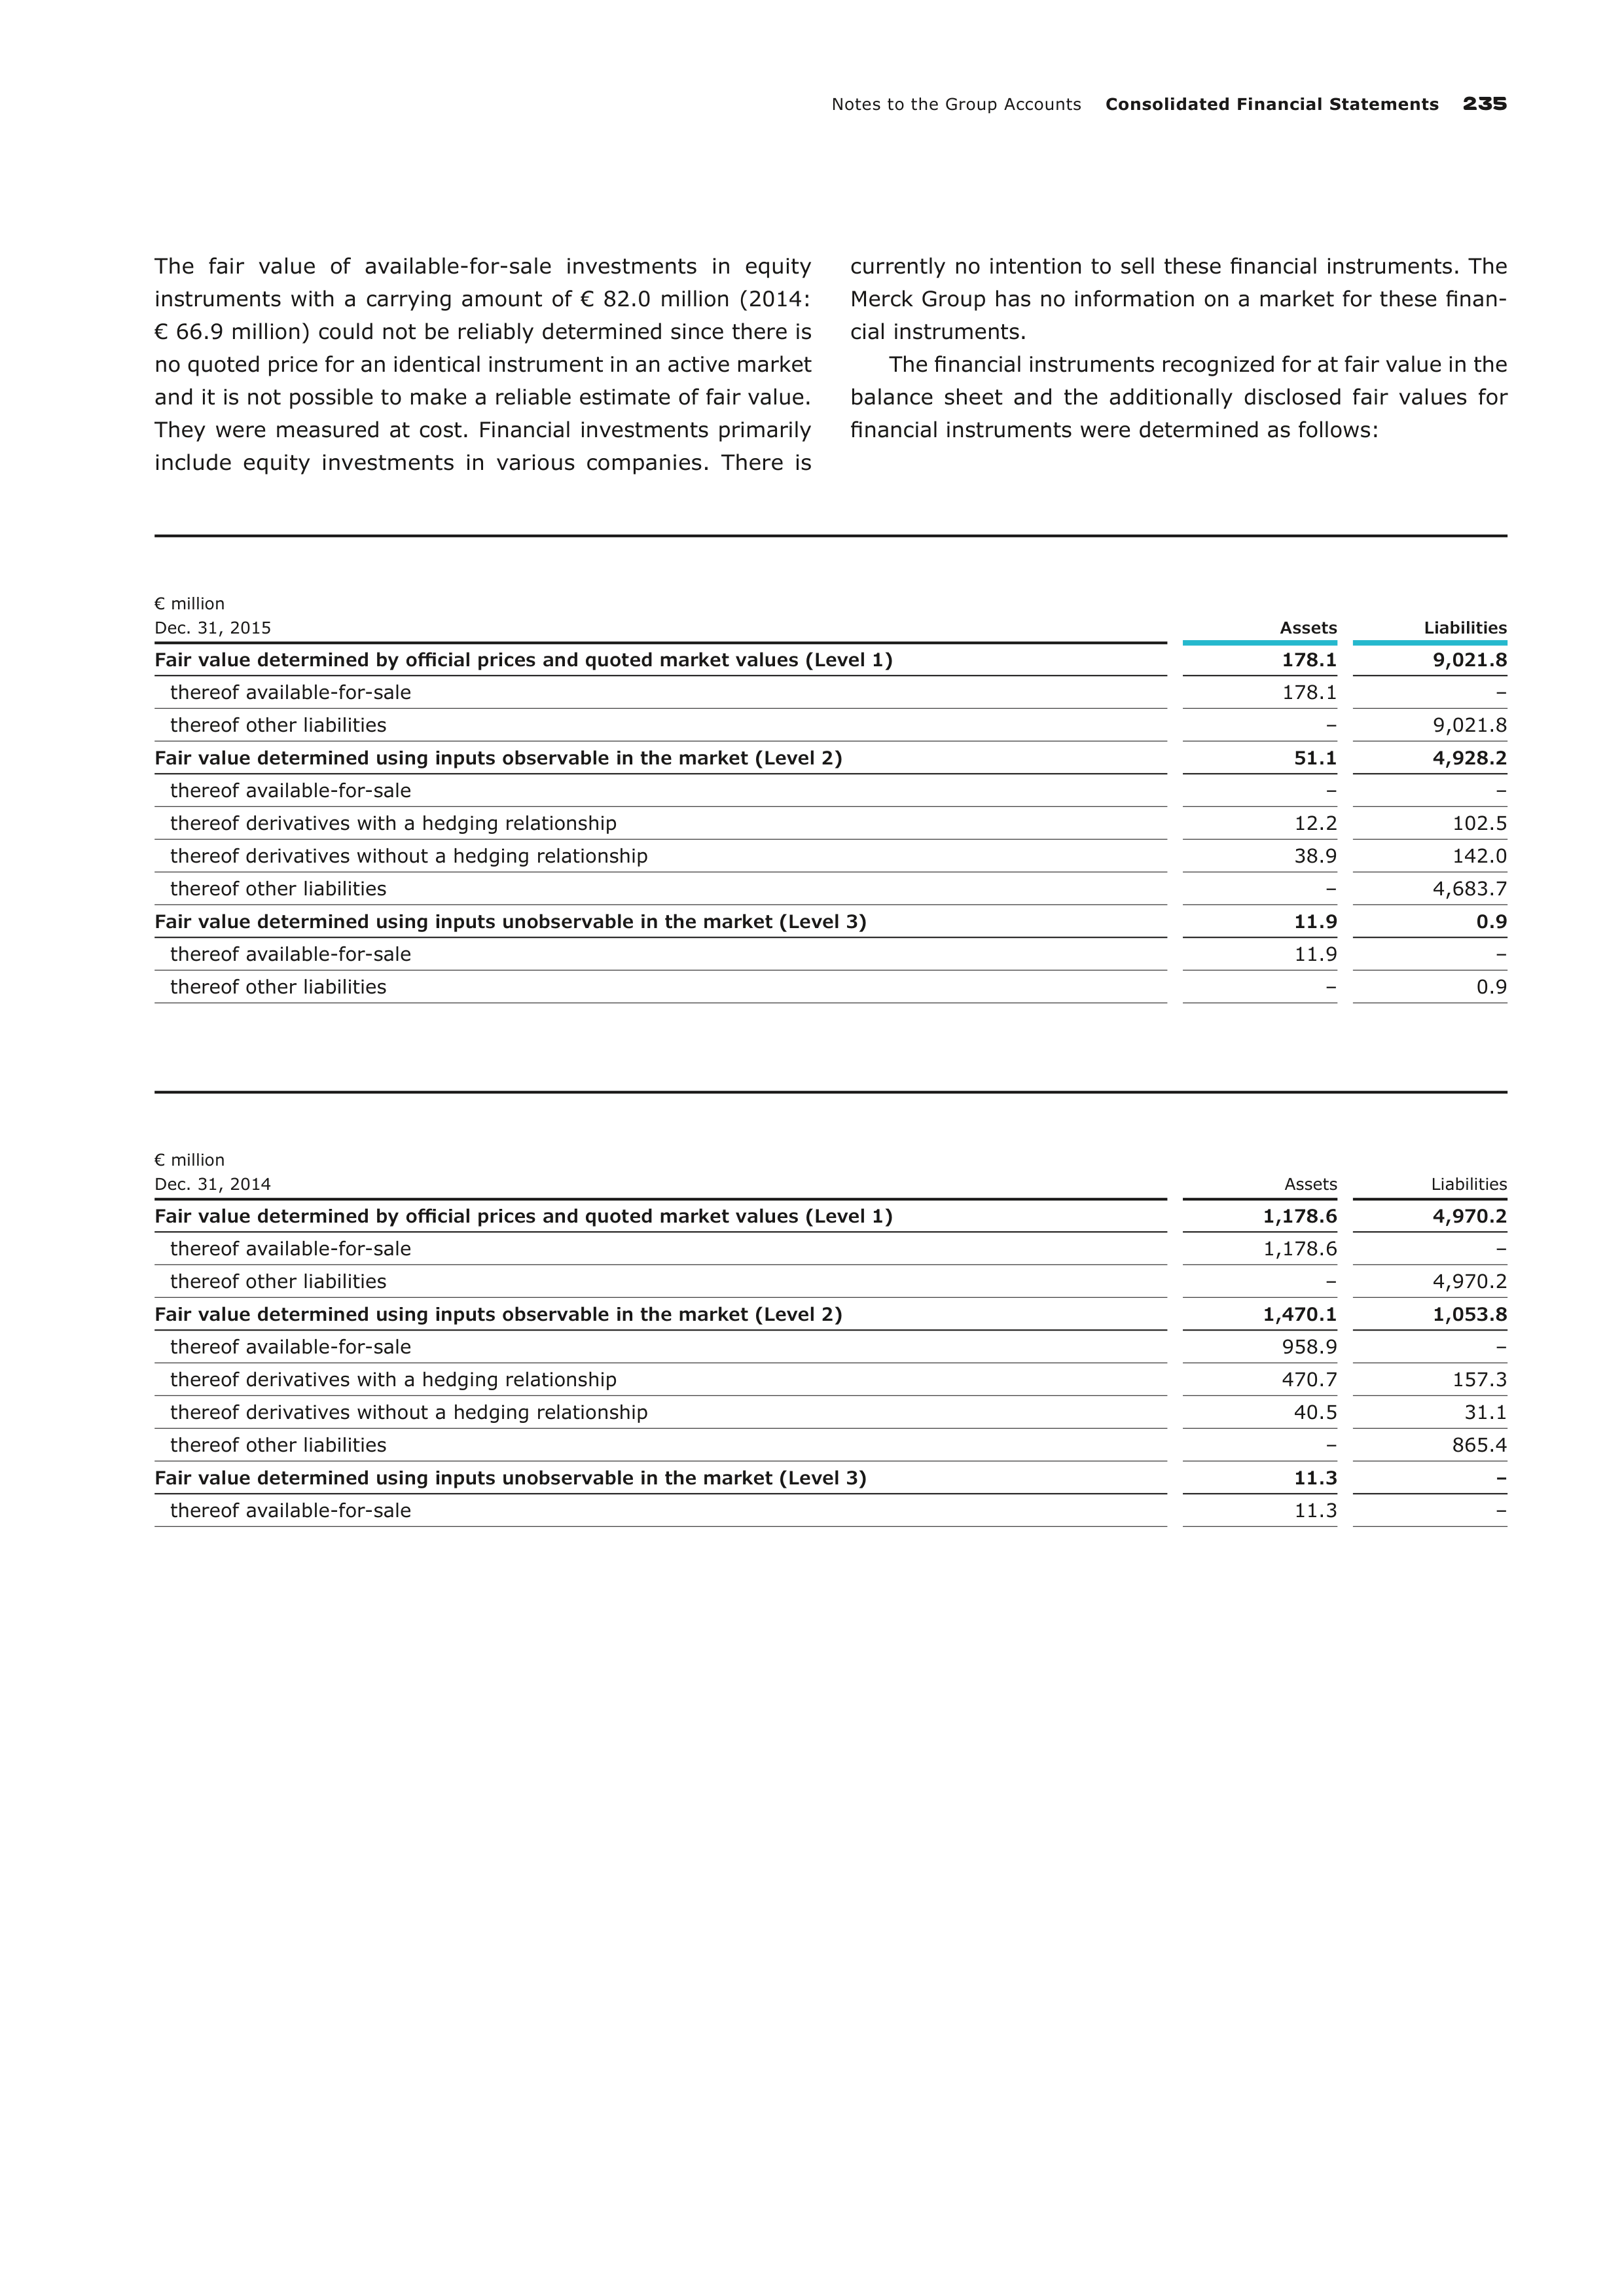
Notes to the Group Accounts
Consolidated Financial Statements
235
The fair value of available-for-sale investments in equity
instruments with a carrying amount of € 82.0 million (2014:
€ 66.9 million) could not be reliably determined since there is
no quoted price for an identical instrument in an active market
and it is not possible to make a reliable estimate of fair value.
They were measured at cost. Financial investments primarily
include equity investments in various companies. There is
cur
rently no intention to sell these financial instruments. The
Merck Group has no information on a market for these finan-
cial instruments.
The financial instruments recognized for at fair value in the
balance sheet and the additionally disclosed fair values for
financial instruments were determined as follows:
€ million
Dec. 31, 2015
Assets
Liabilities
Fair value determined by official prices and quoted market values (Level 1)
178.1
9,021.8
thereof available-for-sale
178.1
–
thereof other liabilities
–
9,021.8
Fair value determined using inputs observable in the market (Level 2)
51.1
4,928.2
thereof available-for-sale
–
–
thereof derivatives with a hedging relationship
12.2
102.5
thereof derivatives without a hedging relationship
38.9
142.0
thereof other liabilities
–
4,683.7
Fair value determined using inputs unobservable in the market (Level 3)
11.9
0.9
thereof available-for-sale
11.9
–
thereof other liabilities
–
0.9
€ million
Dec. 31, 2014
Assets
Liabilities
Fair value determined by official prices and quoted market values (Level 1)
1,178.6
4,970.2
thereof available-for-sale
1,178.6
–
thereof other liabilities
–
4,970.2
Fair value determined using inputs observable in the market (Level 2)
1,470.1
1,053.8
thereof available-for-sale
958.9
–
thereof derivatives with a hedging relationship
470.7
157.3
thereof derivatives without a hedging relationship
40.5
31.1
thereof other liabilities
–
865.4
Fair value determined using inputs unobservable in the market (Level 3)
11.3
–
thereof available-for-sale
11.3
–
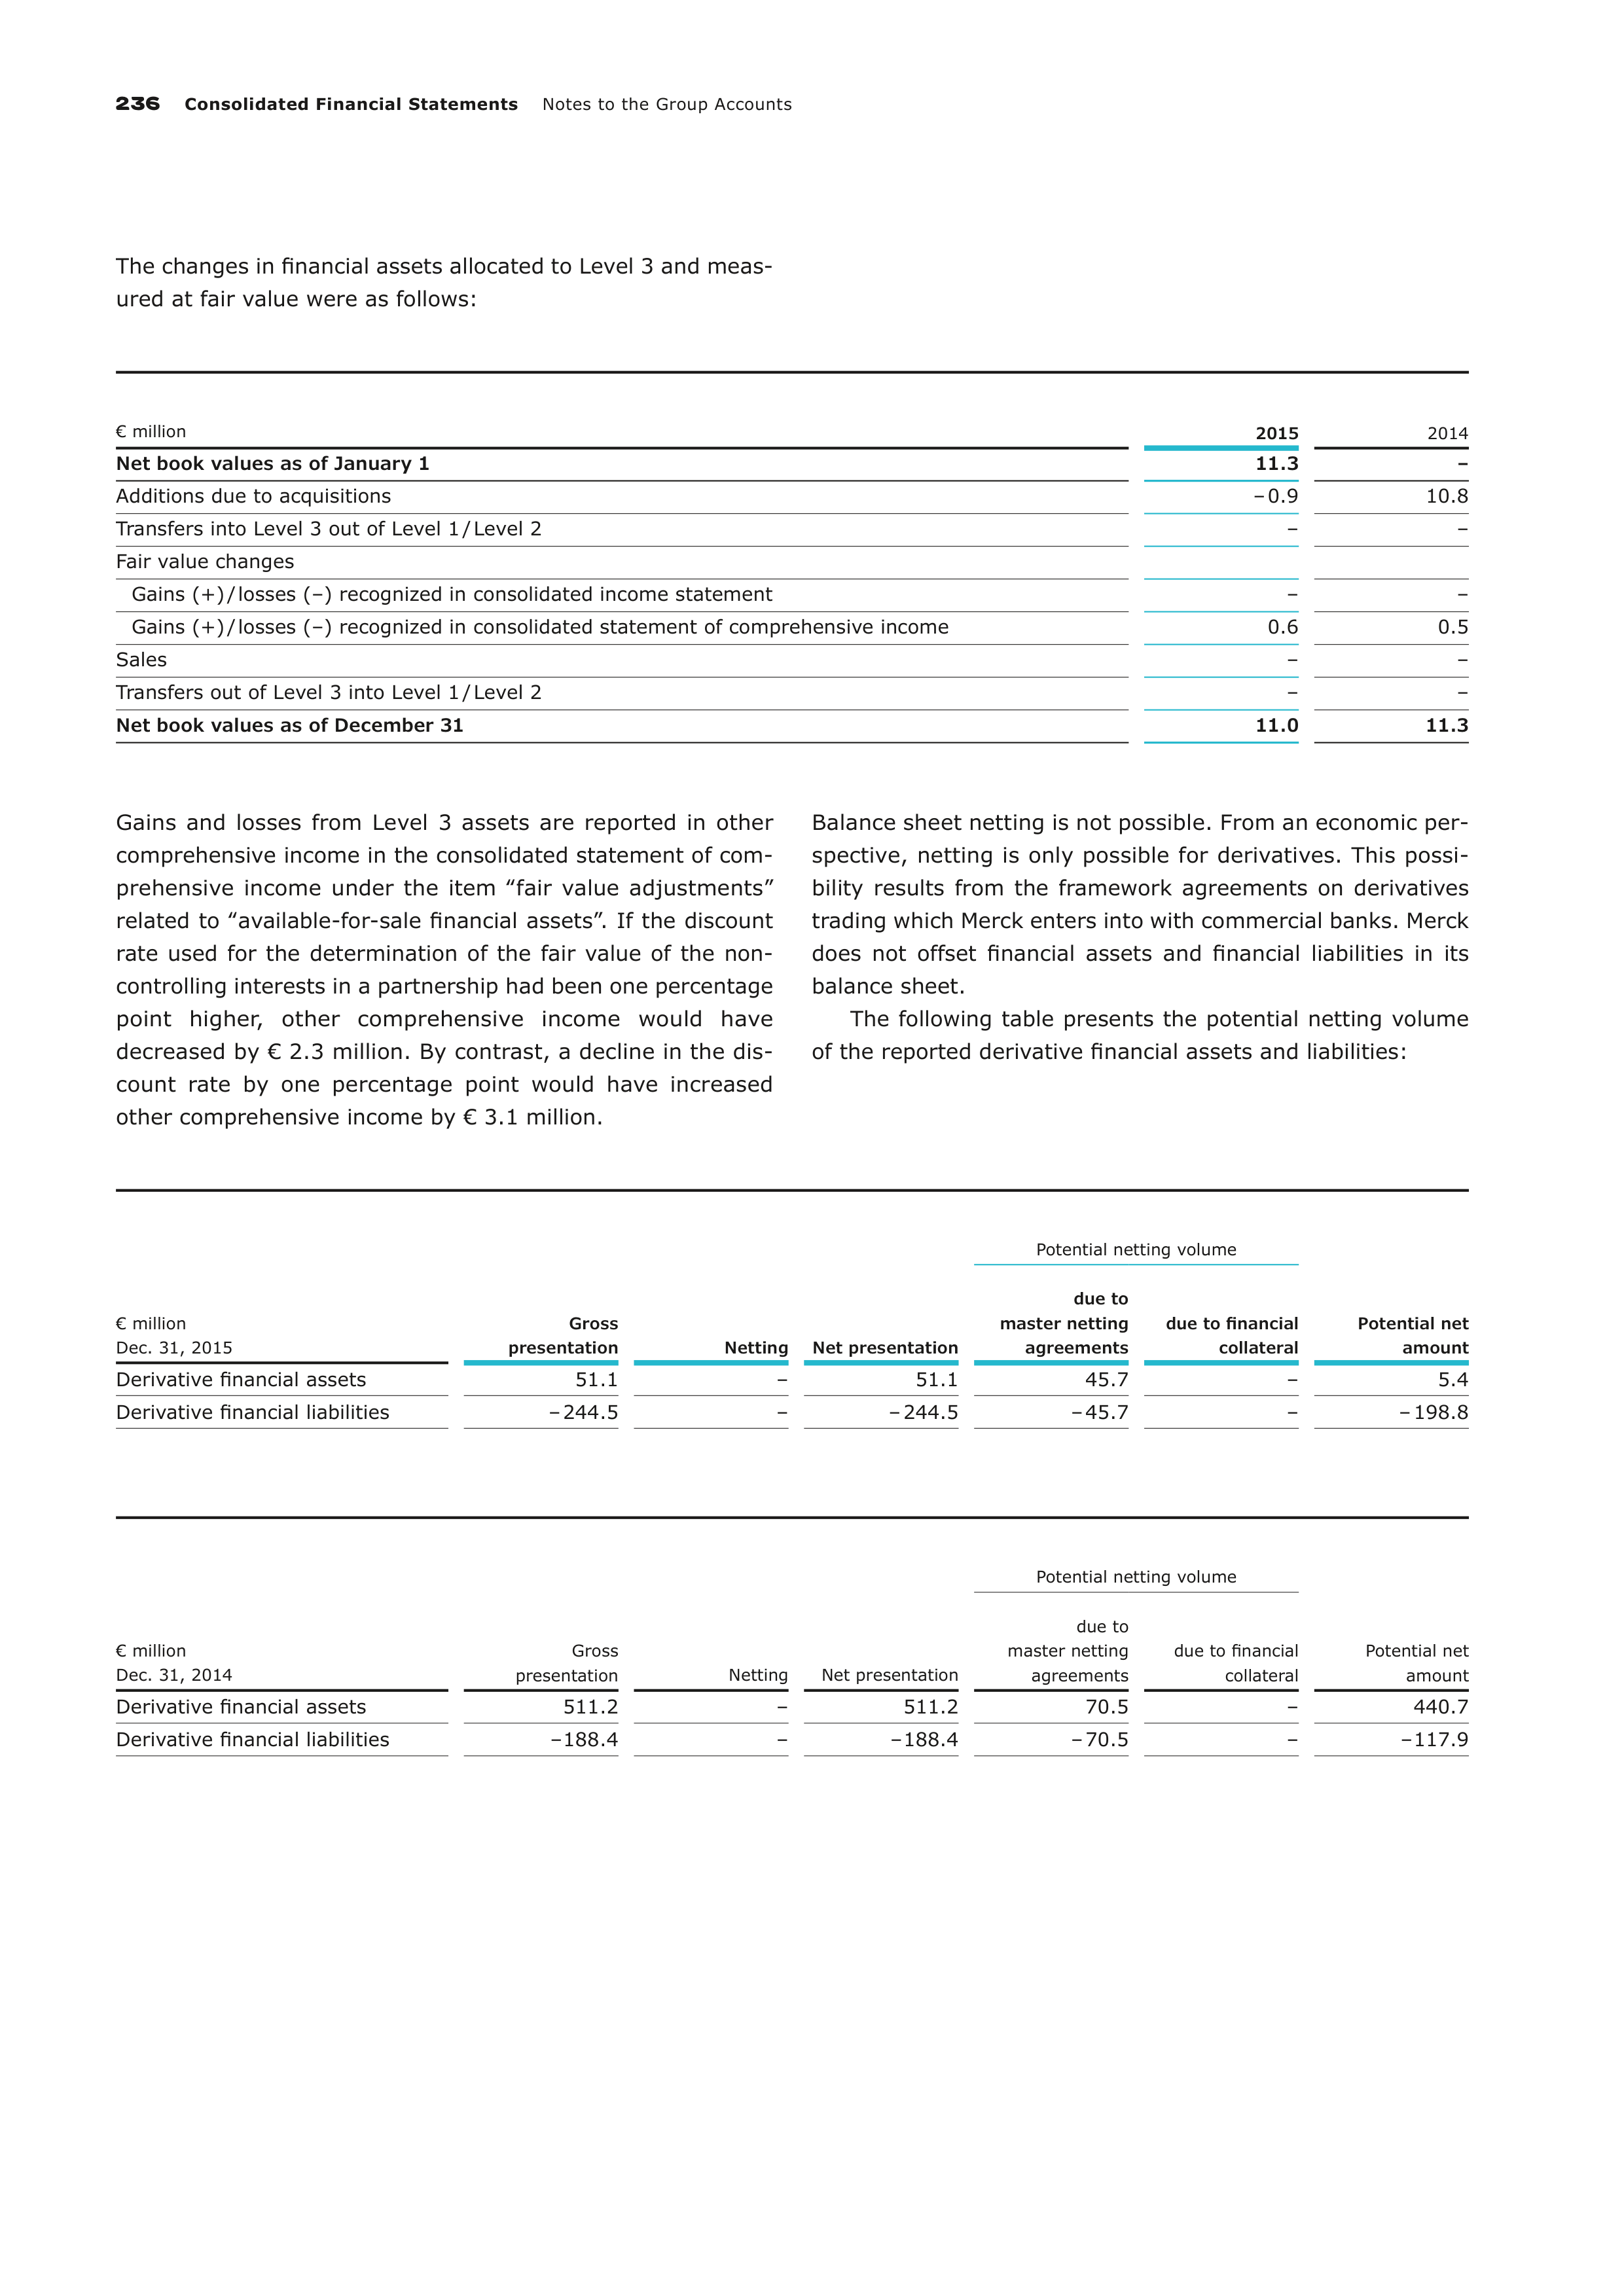
236
Consolidated Financial Statements
Notes to the Group Accounts
The changes in financial assets allocated to Level 3 and meas-
ured at fair value were as follows:
€ million
2015
2014
Net book values as of January 1
11.3
–
Additions due to acquisitions
– 0.9
10.8
Transfers into Level 3 out of Level 1 / Level 2
–
–
Fair value changes
Gains (+) / losses (–) recognized in consolidated income statement
–
–
Gains (+) / losses (–) recognized in consolidated statement of comprehensive income
0.6
0.5
Sales
–
–
Transfers out of Level 3 into Level 1 / Level 2
–
–
Net book values as of December 31
11.0
11.3
Gains and losses from Level 3 assets are reported in other
comprehensive income in the consolidated statement of com-
prehensive income under the item ‟fair value adjustments”
related to ‟available-for-sale financial assets”. If the discount
rate used for the determination of the fair value of the non-
controlling interests in a partnership had been one percentage
point higher, other comprehensive income would have
decreased by € 2.3 million. By contrast, a decline in the dis-
count rate by one percentage point would have increased
other comprehensive income by € 3.1 million.
Balance sheet netting is not possible. From an economic per-
spective, netting is only possible for derivatives. This possi-
bil
ity results from the framework agreements on derivatives
trading which Merck enters into with commercial banks. Merck
does not offset financial assets and financial liabilities in its
balance sheet.
The following table presents the potential netting volume
of the reported derivative financial assets and liabilities:
€ million
Dec. 31, 2015
Potential netting volume
Gross
presentation
Netting
Net presentation
due to
master netting
agreements
due to financial
collateral
Potential net
amount
Derivative financial assets
51.1
–
51.1
45.7
–
5.4
Derivative financial liabilities
– 244.5
–
– 244.5
– 45.7
–
– 198.8
€ million
Dec. 31, 2014
Potential netting volume
Gross
presentation
Netting
Net presentation
due to
master netting
agreements
due to financial
collateral
Potential net
amount
Derivative financial assets
511.2
–
511.2
70.5
–
440.7
Derivative financial liabilities
– 188.4
–
– 188.4
– 70.5
–
– 117.9
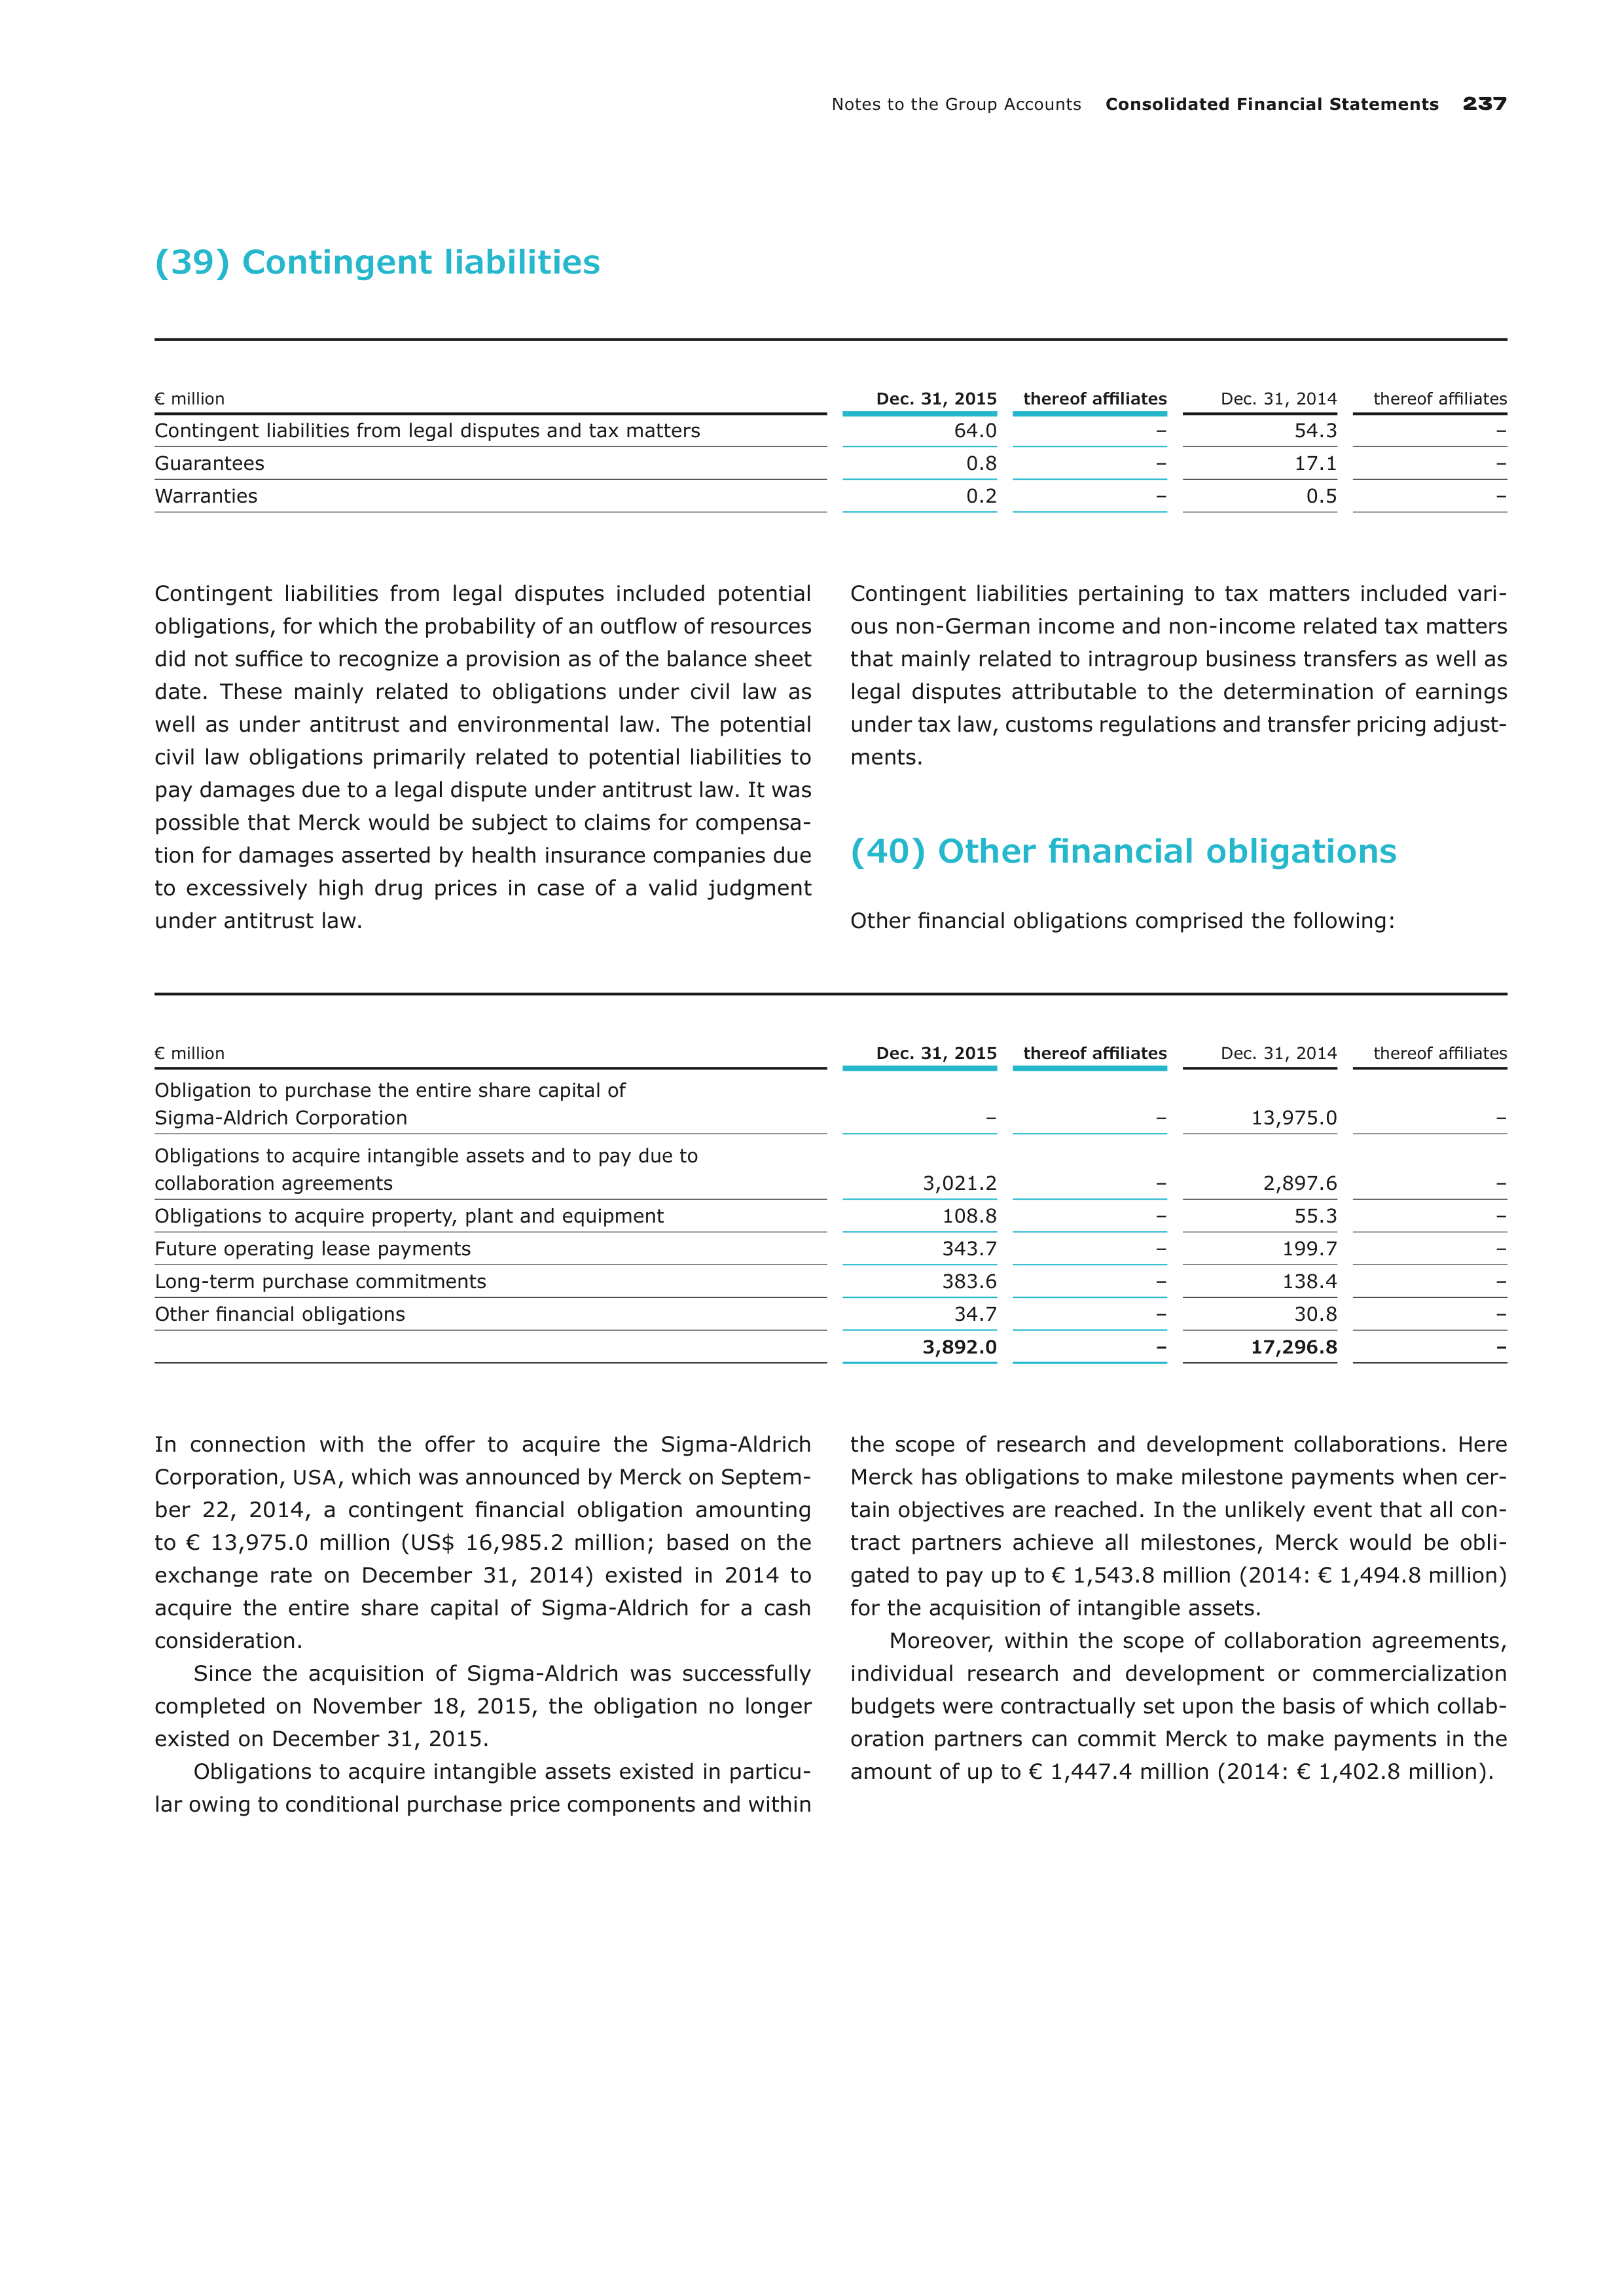
Notes to the Group Accounts
Consolidated Financial Statements
237
(39) Contingent liabilities
€ million
Dec. 31, 2015
thereof affiliates
Dec. 31, 2014
thereof affiliates
Contingent liabilities from legal disputes and tax matters
64.0
–
54.3
–
Guarantees
0.8
–
17.1
–
Warranties
0.2
–
0.5
–
Contingent liabilities from legal disputes included potential
obligations, for which the probability of an outflow of resources
did not suffice to recognize a provision as of the balance sheet
date. These mainly related to obligations under civil law as
well as under antitrust and environmental law. The potential
civil law obligations primarily related to potential liabilities to
pay damages due to a legal dispute under antitrust law. It was
possible that Merck would be subject to claims for compensa-
tion for damages asserted by health insurance companies due
to excessively high drug prices in case of a valid judgment
under antitrust law.
Contingent liabilities pertaining to tax matters included
vari-
ous non-German income and non-income related tax
matters
that mainly related to intragroup business transfers as well as
legal disputes attributable to the determination of earnings
under tax law, customs regulations and transfer pricing adjust-
ments.
(40) Other financial obligations
Other financial obligations comprised the following:
€ million
Dec. 31, 2015
thereof affiliates
Dec. 31, 2014
thereof affiliates
Obligation to purchase the entire share capital of
Sigma-Aldrich Corporation
–
–
13,975.0
–
Obligations to acquire intangible assets and to pay due to
collaboration agreements
3,021.2
–
2,897.6
–
Obligations to acquire property, plant and equipment
108.8
–
55.3
–
Future operating lease payments
343.7
–
199.7
–
Long-term purchase commitments
383.6
–
138.4
–
Other financial obligations
34.7
–
30.8
–
3,892.0
–
17,296.8
–
In connection with the offer to acquire the Sigma-Aldrich
Corporation,
USA
, which was announced by Merck on Septem-
ber 22, 2014, a contingent financial obligation amounting
to € 13,975.0 million (US$ 16,985.2 million; based on the
exchange rate on December 31, 2014) existed in 2014 to
acquire the entire share capital of Sigma-Aldrich for a cash
consideration.
Since the acquisition of Sigma-Aldrich was successfully
completed on November 18, 2015, the obligation no longer
existed on December 31, 2015.
Obligations to acquire intangible assets existed in particu-
lar owing to conditional purchase price components and within
the scope of research and development collaborations. Here
Merck has obligations to make milestone payments when cer-
tain objectives are reached. In the unlikely event that all con-
tract partners achieve all milestones, Merck would be obli-
gated to pay up to € 1,543.8 million (2014: € 1,494.8 million)
for the acquisition of intangible assets.
Moreover, within the scope of collaboration agreements,
individual research and development or commercialization
budgets were contractually set upon the basis of which collab-
oration partners can commit Merck to make payments in the
amount of up to € 1,447.4 million (2014: € 1,402.8 million).
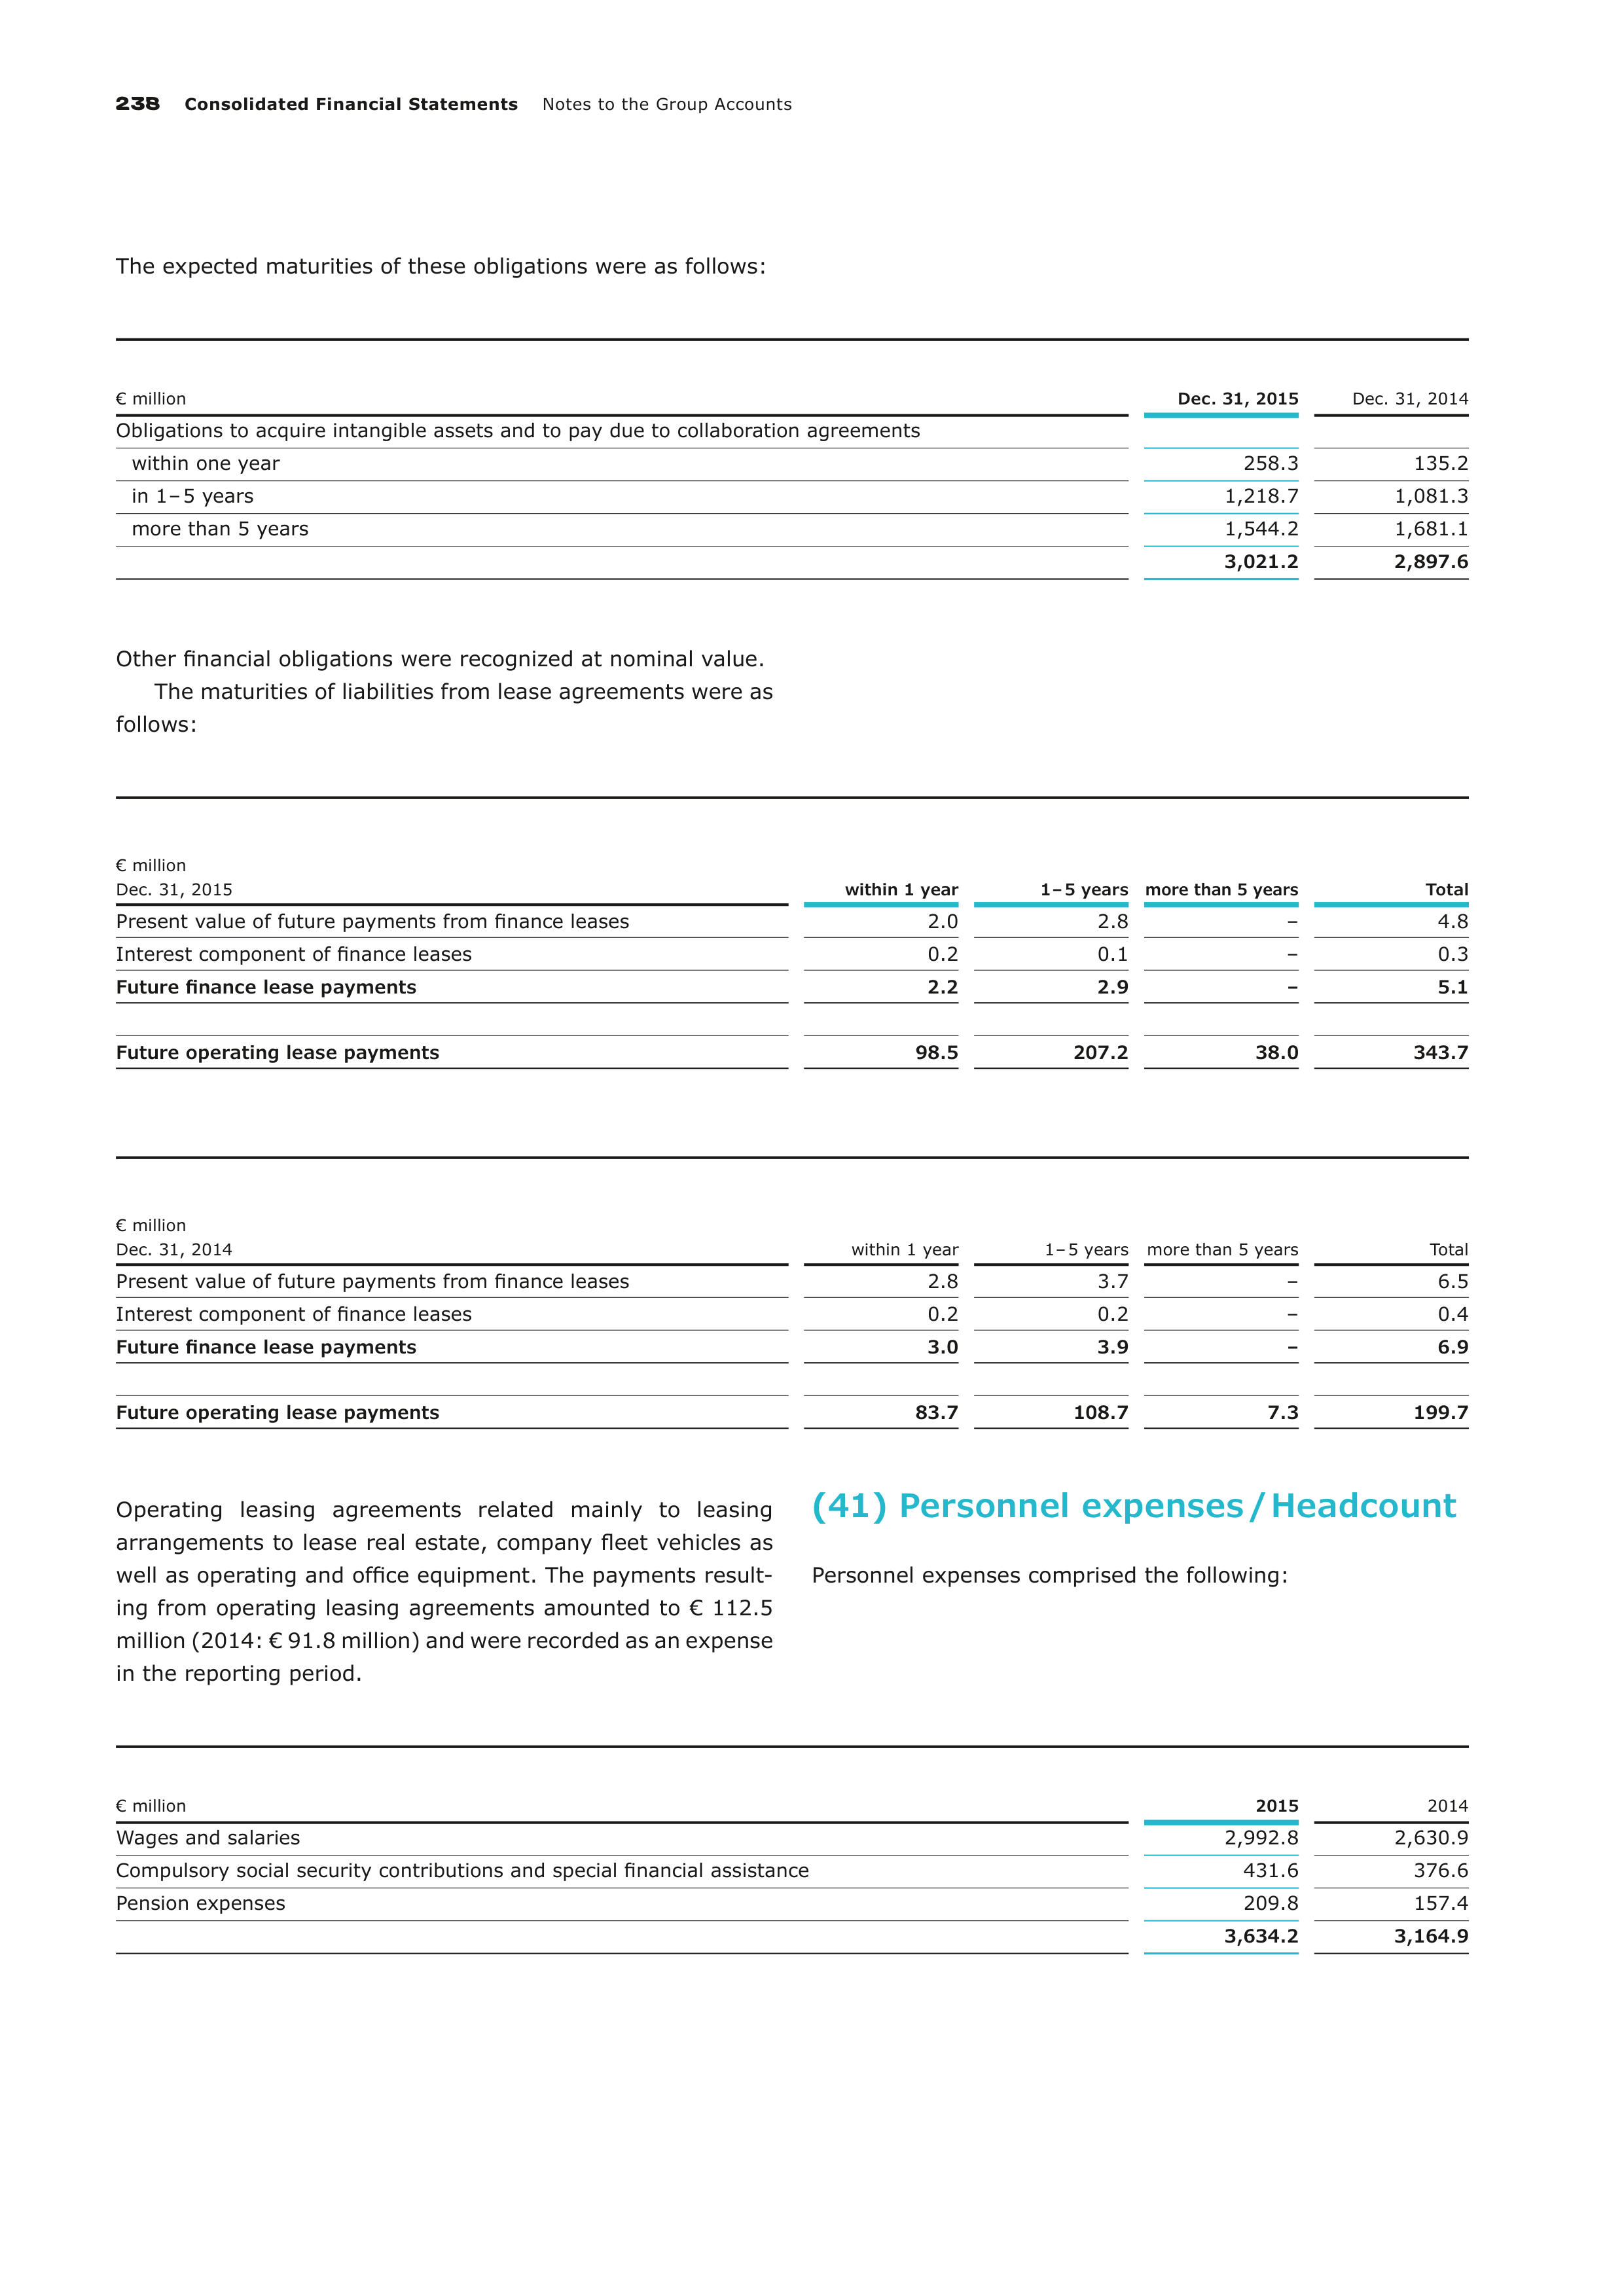
238
Consolidated Financial Statements
Notes to the Group Accounts
The expected maturities of these obligations were as follows:
€ million
Dec. 31, 2015
Dec. 31, 2014
Obligations to acquire intangible assets and to pay due to collaboration agreements
within one year
258.3
135.2
in 1 – 5 years
1,218.7
1,081.3
more than 5 years
1,544.2
1,681.1
3,021.2
2,897.6
Other financial obligations were recognized at nominal value.
The maturities of liabilities from lease agreements were as
follows:
€ million
Dec. 31, 2015
within 1 year
1 – 5 years
more than 5 years
Total
Present value of future payments from finance leases
2.0
2.8
–
4.8
Interest component of finance leases
0.2
0.1
–
0.3
Future finance lease payments
2.2
2.9
–
5.1
Future operating lease payments
98.5
207.2
38.0
343.7
€ million
Dec. 31, 2014
within 1 year
1 – 5 years
more than 5 years
Total
Present value of future payments from finance leases
2.8
3.7
–
6.5
Interest component of finance leases
0.2
0.2
–
0.4
Future finance lease payments
3.0
3.9
–
6.9
Future operating lease payments
83.7
108.7
7.3
199.7
Operating leasing agreements related mainly to leasing
arrangements to lease real estate, company fleet vehicles as
well as operating and office equipment. The payments result-
ing from operating leasing agreements amounted to € 112.5
million (2014: € 91.8 million) and were recorded as an expense
in the reporting period.
(41) Personnel expenses / Headcount
Personnel expenses comprised the following:
€ million
2015
2014
Wages and salaries
2,992.8
2,630.9
Compulsory social security contributions and special financial assistance
431.6
376.6
Pension expenses
209.8
157.4
3,634.2
3,164.9
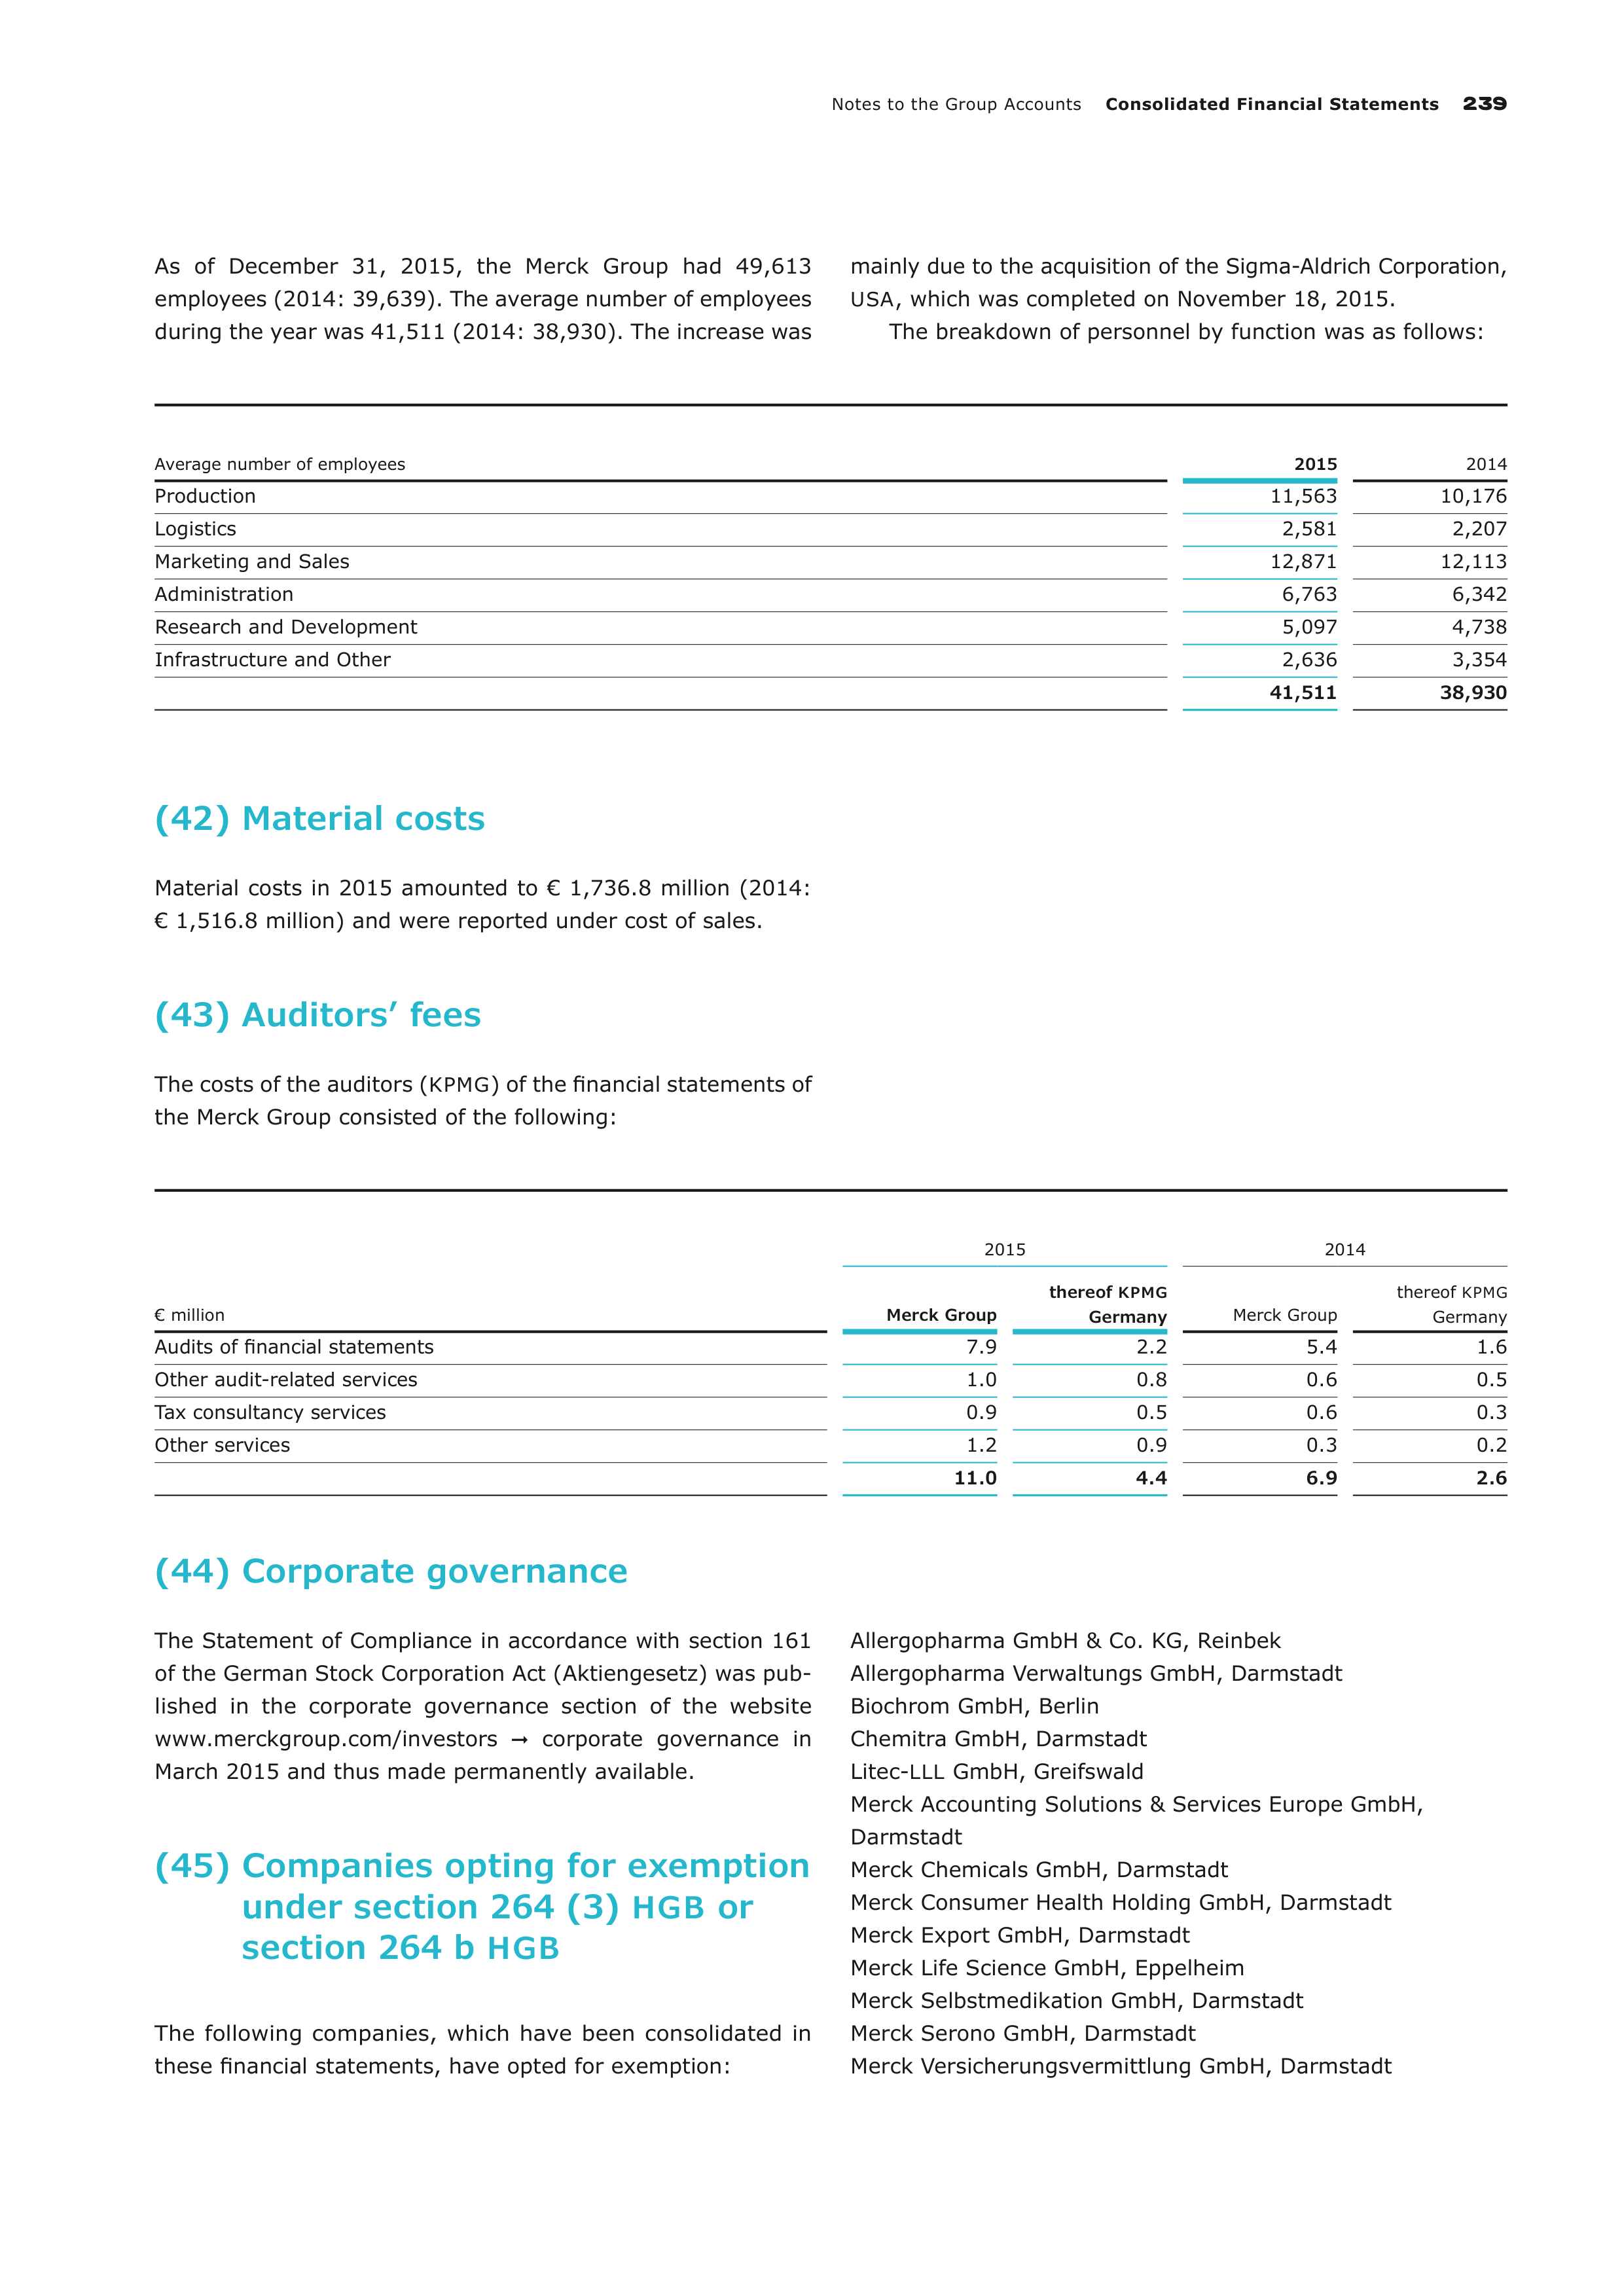
Notes to the Group Accounts
Consolidated Financial Statements
239
As of December 31, 2015, the Merck Group had 49,613
employees (2014: 39,639). The average number of employees
during the year was 41,511 (2014: 38,930). The increase was
mainly due to the acquisition of the Sigma-Aldrich Corporation,
USA
, which was completed on November 18, 2015.
The breakdown of personnel by function was as follows:
Average number of employees
2015
2014
Production
11,563
10,176
Logistics
2,581
2,207
Marketing and Sales
12,871
12,113
Administration
6,763
6,342
Research and Development
5,097
4,738
Infrastructure and Other
2,636
3,354
41,511
38,930
(42) Material costs
Material costs in 2015 amounted to € 1,736.8 million (2014:
€ 1,516.8 million) and were reported under cost of sales.
(43) Auditors’ fees
The costs of the auditors (
KPMG
) of the financial statements of
the Merck Group consisted of the following:
€ million
2015
2014
Merck Group
thereof
KPMG
Germany
Merck Group
thereof
KPMG
Germany
Audits of financial statements
7.9
2.2
5.4
1.6
Other audit-related services
1.0
0.8
0.6
0.5
Tax consultancy services
0.9
0.5
0.6
0.3
Other services
1.2
0.9
0.3
0.2
11.0
4.4
6.9
2.6
(44) Corporate governance
The Statement of Compliance in accordance with section 161
of the German Stock Corporation Act (Aktiengesetz) was pub-
lished in the corporate governance section of the website
www.merckgroup.com/investors
➞
corporate governance in
March 2015 and thus made permanently available.
(45) Companies opting for exemption
under section 264 (3)
HGB
or
section 264 b
HGB
The following companies, which have been consolidated in
these financial statements, have opted for exemption:
Allergopharma GmbH & Co. KG, Reinbek
Allergopharma Verwaltungs GmbH, Darmstadt
Biochrom GmbH, Berlin
Chemitra GmbH, Darmstadt
Litec-
LLL
GmbH, Greifswald
Merck Accounting Solutions & Services Europe GmbH,
Darmstadt
Merck Chemicals GmbH, Darmstadt
Merck Consumer Health Holding GmbH, Darmstadt
Merck Export GmbH, Darmstadt
Merck Life Science GmbH, Eppelheim
Merck Selbstmedikation GmbH, Darmstadt
Merck Serono GmbH, Darmstadt
Merck Versicherungsvermittlung GmbH, Darmstadt
240
Consolidated Financial Statements
Notes to the Group Accounts
(46) Related-party disclosures
Related parties in respect of the Merck Group are E. Merck KG,
Emanuel-Merck-Vermögens-KG and E. Merck Beteiligungen KG.
In principle, direct or indirect subsidiaries of Merck KGaA,
associates of the Merck Group, jointly controlled companies
where the Merck Group is involved, as well as pension funds
that are classified as funded defined benefit plans in accord-
ance with
IAS
19 are also related parties within the meaning
of
IAS
24. Members of the Executive Board and the Supervi-
sory Board of Merck KGaA, the Executive Board and the Board
of Partners of E. Merck KG as well as close members of their
families are also related parties.
As of December 31, 2015, there were liabilities by Merck
Financial Services GmbH, Merck KGaA and Merck & Cie,
Switzerland, to E. Merck KG in the amount of € 1,031.2 million
(2014: € 926.9 million). Merck Financial Services GmbH had
liabilities vis-à-vis Merck Capital Asset Management, Malta,
amounting to € 0.1 million (2014: € 0.1 million). Moreover,
as
of December 31, 2015, Merck KGaA had receivables from
E. Merck Beteiligungen KG in the amount of € 35.4 million
(2014: € 76.5 million). The balances result mainly from the
profit transfers by Merck & Cie, Switzerland, to E. Merck KG as
well as the reciprocal profit transfers between Merck KGaA and
E. Merck KG. They included financial payables of € 577.8 mil-
lion (2014: € 501.4 million) which were subject to standard
market interest rates. Neither collateral nor guarantees existed
for any of the balances either in favor or to the disadvantage
of Merck.
Moreover, as of December 31, 2015 Merck Serono SA,
Switzerland, had a receivable from Calypso Biotech SA, Switzer-
land,
amounting to € 1.2 million (2014: € 0.0 million) stem-
ming from a convertible bond with a volume of
CHF
1,350,000
and an annual coupon of 8% maturing on December 31, 2016.
From January to December 2015, Merck KGaA performed
services for E. Merck KG with a value of € 0.9 million (2014:
€ 1.2 million), for E. Merck Beteiligungen KG with a value of
€ 0.3 million (2014: € 0.3 million), and for Emanuel-Merck-
Vermögens-KG with a value of € 0.2 million (2014: € 0.3 mil-
lion). During the same period, E. Merck KG performed services
for Merck KGaA with a value of € 0.5 million (2014: € 0.5 mil-
lion).
Business transactions with major subsidiaries were elimi-
nated during consolidation. Information on pension funds that
are classified as funded defined benefit plans in accordance
with
IAS
19 can be found in Note [26] ‟Provisions for pensions
and other post-employment benefits”. There were no further
material transactions with these pension funds.
As was the case in 2014, there were no transactions between
companies of the Merck Group and associates from January
to
December 2015. As in the previous year, companies of the
Merck Group had no receivables or liabilities vis-à-vis associ-
ates as of December 31, 2015.
There were no material transactions such as, for example,
the provision of services or the granting of loans, between
companies of the Merck Group and members of the Executive
Board or the Supervisory Board of Merck KGaA, the Executive
Board or the Board of Partners of E. Merck KG or members of
their immediate families.
(47)
Executive Board and Supervisory
Board compensation
The compensation of the Executive Board of Merck KGaA is
paid by the general partner, E. Merck KG, and recorded as an
expense in its income statement. For the period from January
to December 2015, fixed salaries of € 6.5 million (2014: € 5.3
million), variable compensation of € 22.3 million (2014: € 18.3
million), and additional benefits of € 0.3 million (2014: € 0.2
million) were recorded for members of the Executive Board.
Furthermore, additions to the provisions of E. Merck KG for the
Long-Term Incentive Plan totaled € 9.9 million (2014: € 12.7
million), and additions to the pension provisions of E. Merck KG
include current service costs of € 4.2 million (2014: € 2.1 mil-
lion) for members of the Executive Board of Merck KGaA.
The compensation of the Supervisory Board amounting to
€ 881.0 thousand (2014: € 882.1 thousand) consisted of a
fixed portion of € 822.5 thousand (2014: € 823.6 thousand)
and meeting attendance compensation of € 58.5 thousand
(2014: € 58.5 thousand).
Further individualized information and details can be found
in the Compensation Report on pages 150 et seq.
(48) Information on preparation and
approval
The Executive Board of Merck KGaA prepared the consolidated
financial statements on February 18, 2016 and approved them
for forwarding to the Supervisory Board. The Supervisory
Board has the responsibility to examine the consolidated
financial statements and to declare whether it approves them.
Notes to the Group Accounts
Consolidated Financial Statements
241
(49) Subsequent events
At the beginning of January 2016, two contracts entered into
with BioMarin Pharmaceutical Inc.,
USA
(BioMarin), became
effective. Firstly, the sale of the rights to Kuvan
®
, a drug used
to treat the metabolic disorder known as phenylketonuria
(
PKU
) was agreed. And secondly, Merck returned its option to
develop and commercialize Peg-Pal to BioMarin. Based on
these two agreements, in January 2016 Merck received an
upfront payment of € 340 million for the sale of the rights to
Kuvan
®
as well as an entitlement to milestone payments of
up to
€ 185 million. More information can be found in Note [4]
‟Acquisitions, assets held for sale and disposal groups”.
Subsequent to the balance sheet date, no further events of
special importance occurred that could have a material impact
on the net assets, financial position and results of operations
of the Merck Group.
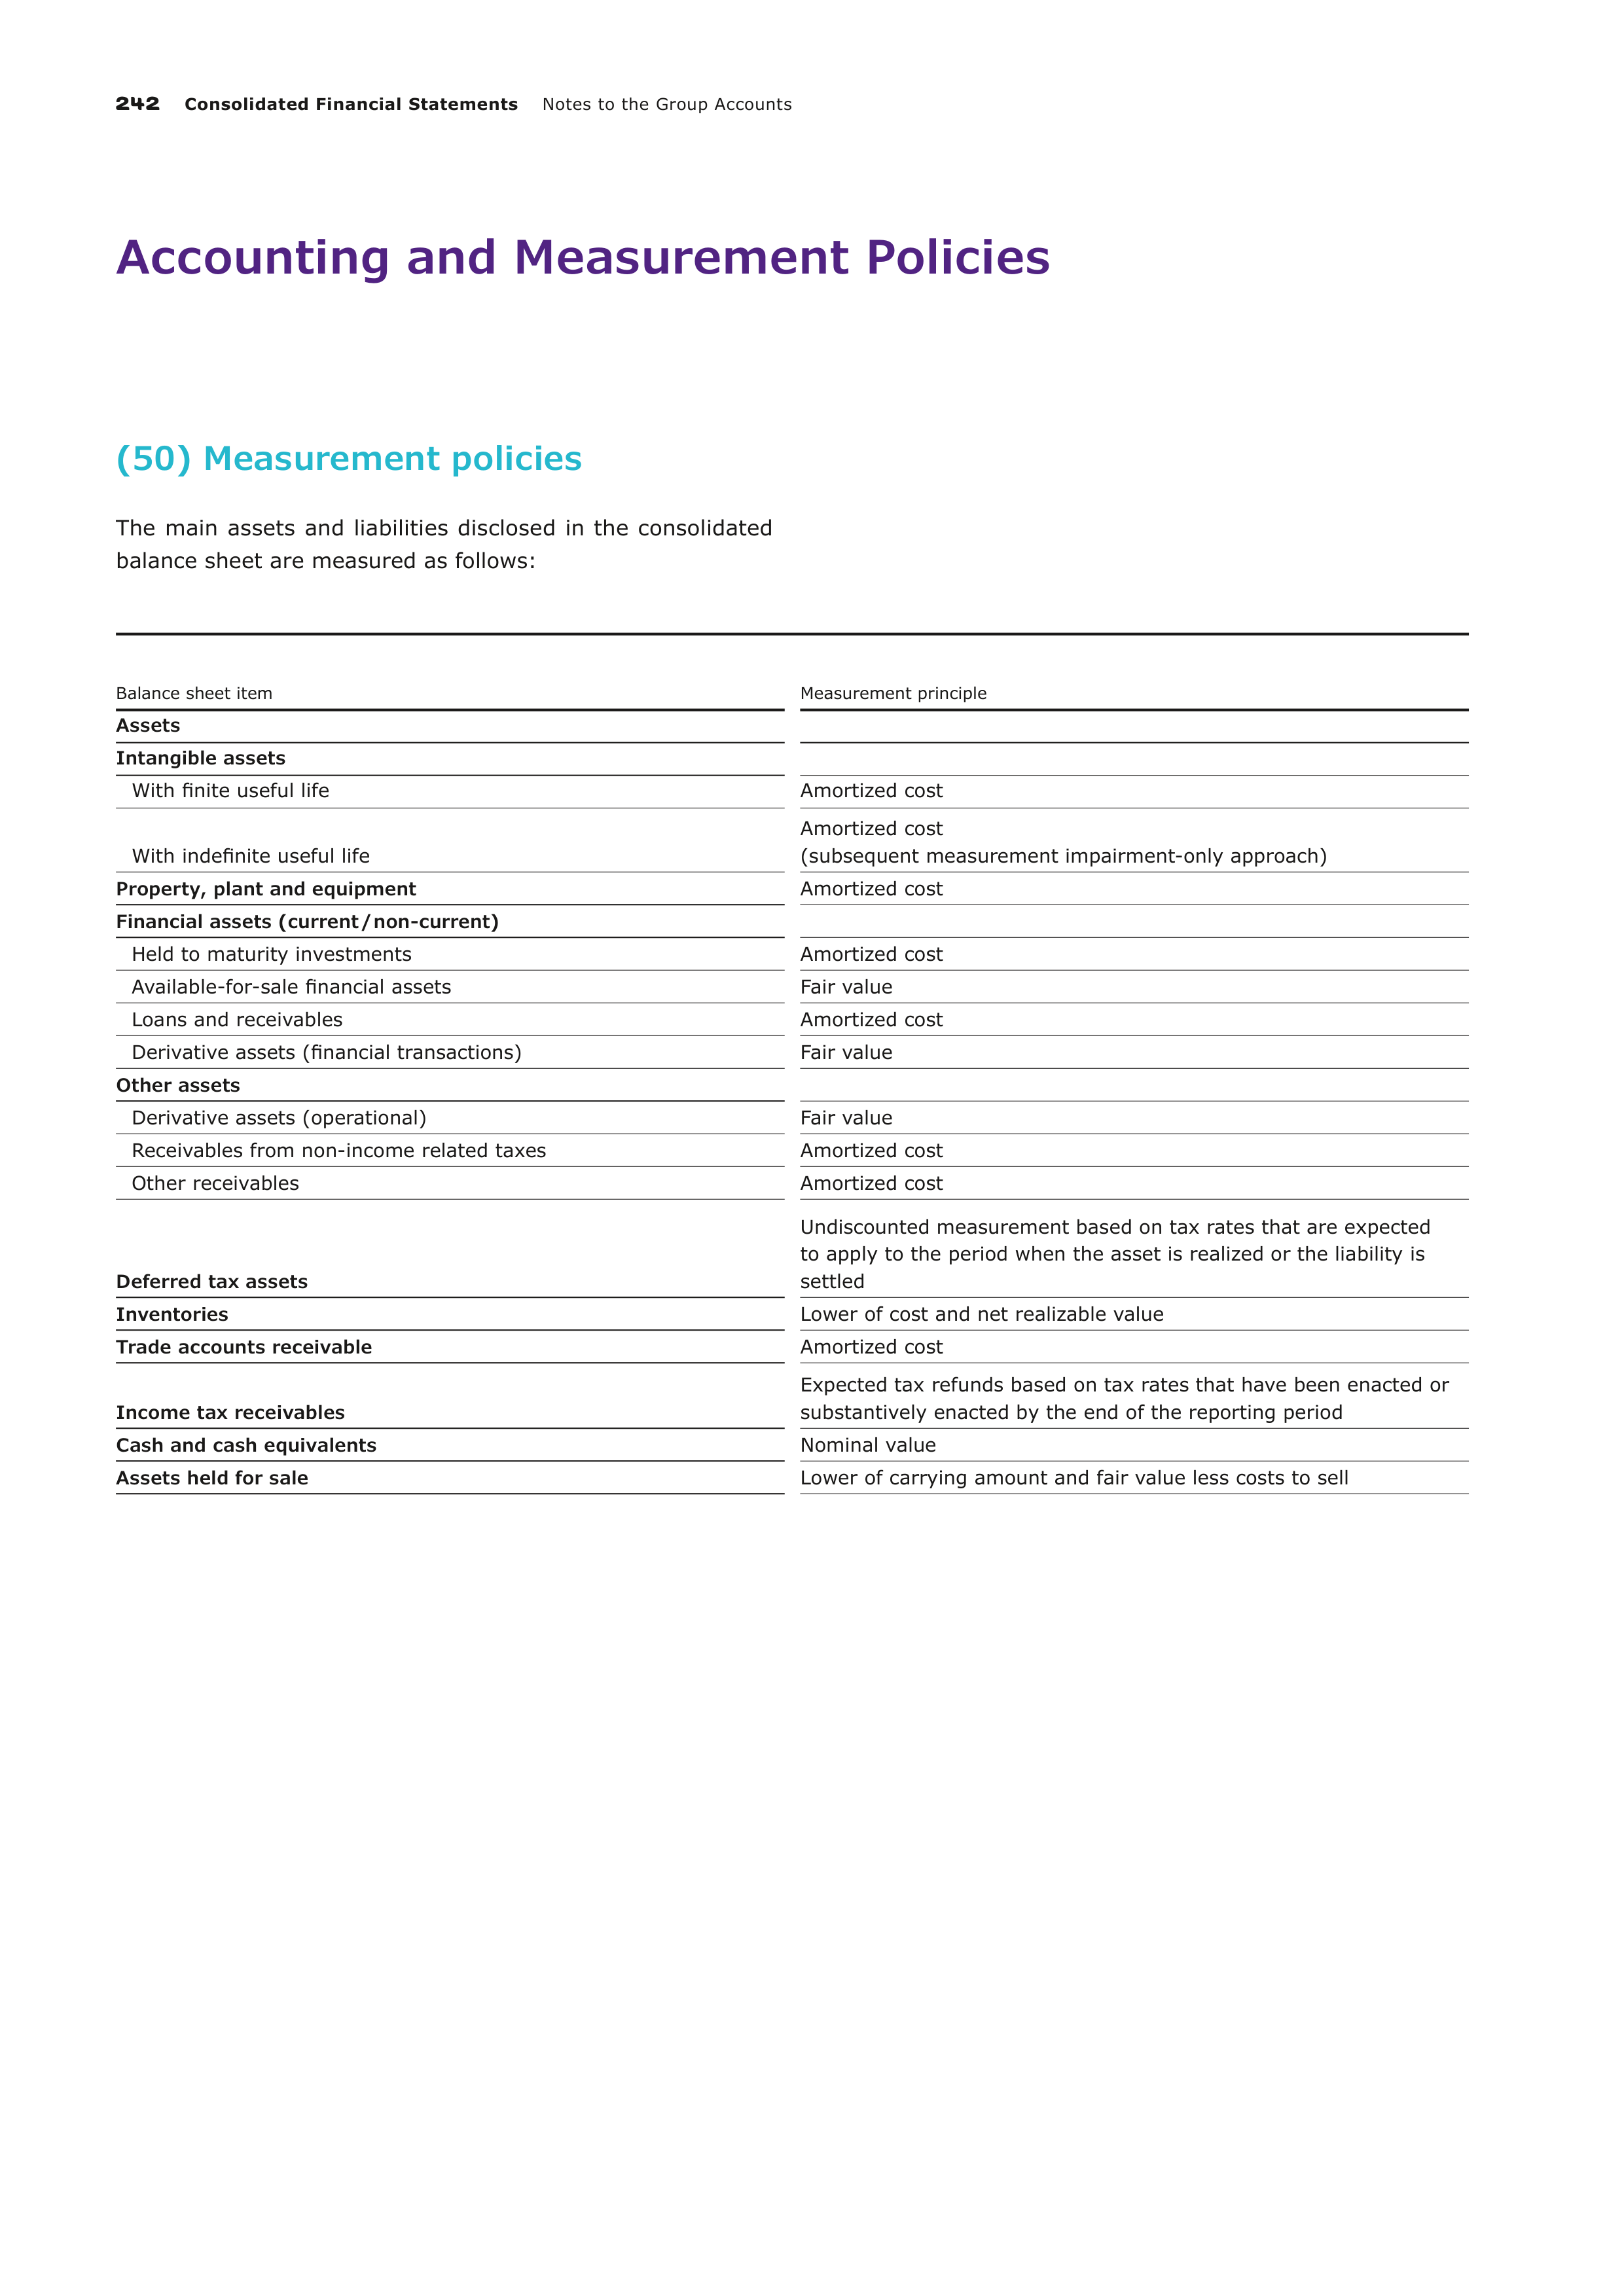
242
Consolidated Financial Statements
Notes to the Group Accounts
Accounting and Measurement Policies
(50) Measurement policies
The main assets and liabilities disclosed in the consolidated
balance sheet are measured as follows:
Balance sheet item
Measurement principle
Assets
Intangible assets
With finite useful life
Amortized cost
With indefinite useful life
Amortized cost
(subsequent measurement impairment-only approach)
Property, plant and equipment
Amortized cost
Financial assets (current / non-current)
Held to maturity investments
Amortized cost
Available-for-sale financial assets
Fair value
Loans and receivables
Amortized cost
Derivative assets (financial transactions)
Fair value
Other assets
Derivative assets (operational)
Fair value
Receivables from non-income related taxes
Amortized cost
Other receivables
Amortized cost
Deferred tax assets
Undiscounted measurement based on tax rates that are expected
to apply to the period when the asset is realized or the liability is
settled
Inventories
Lower of cost and net realizable value
Trade accounts receivable
Amortized cost
Income tax receivables
Expected tax refunds based on tax rates that have been enacted or
substantively enacted by the end of the reporting period
Cash and cash equivalents
Nominal value
Assets held for sale
Lower of carrying amount and fair value less costs to sell
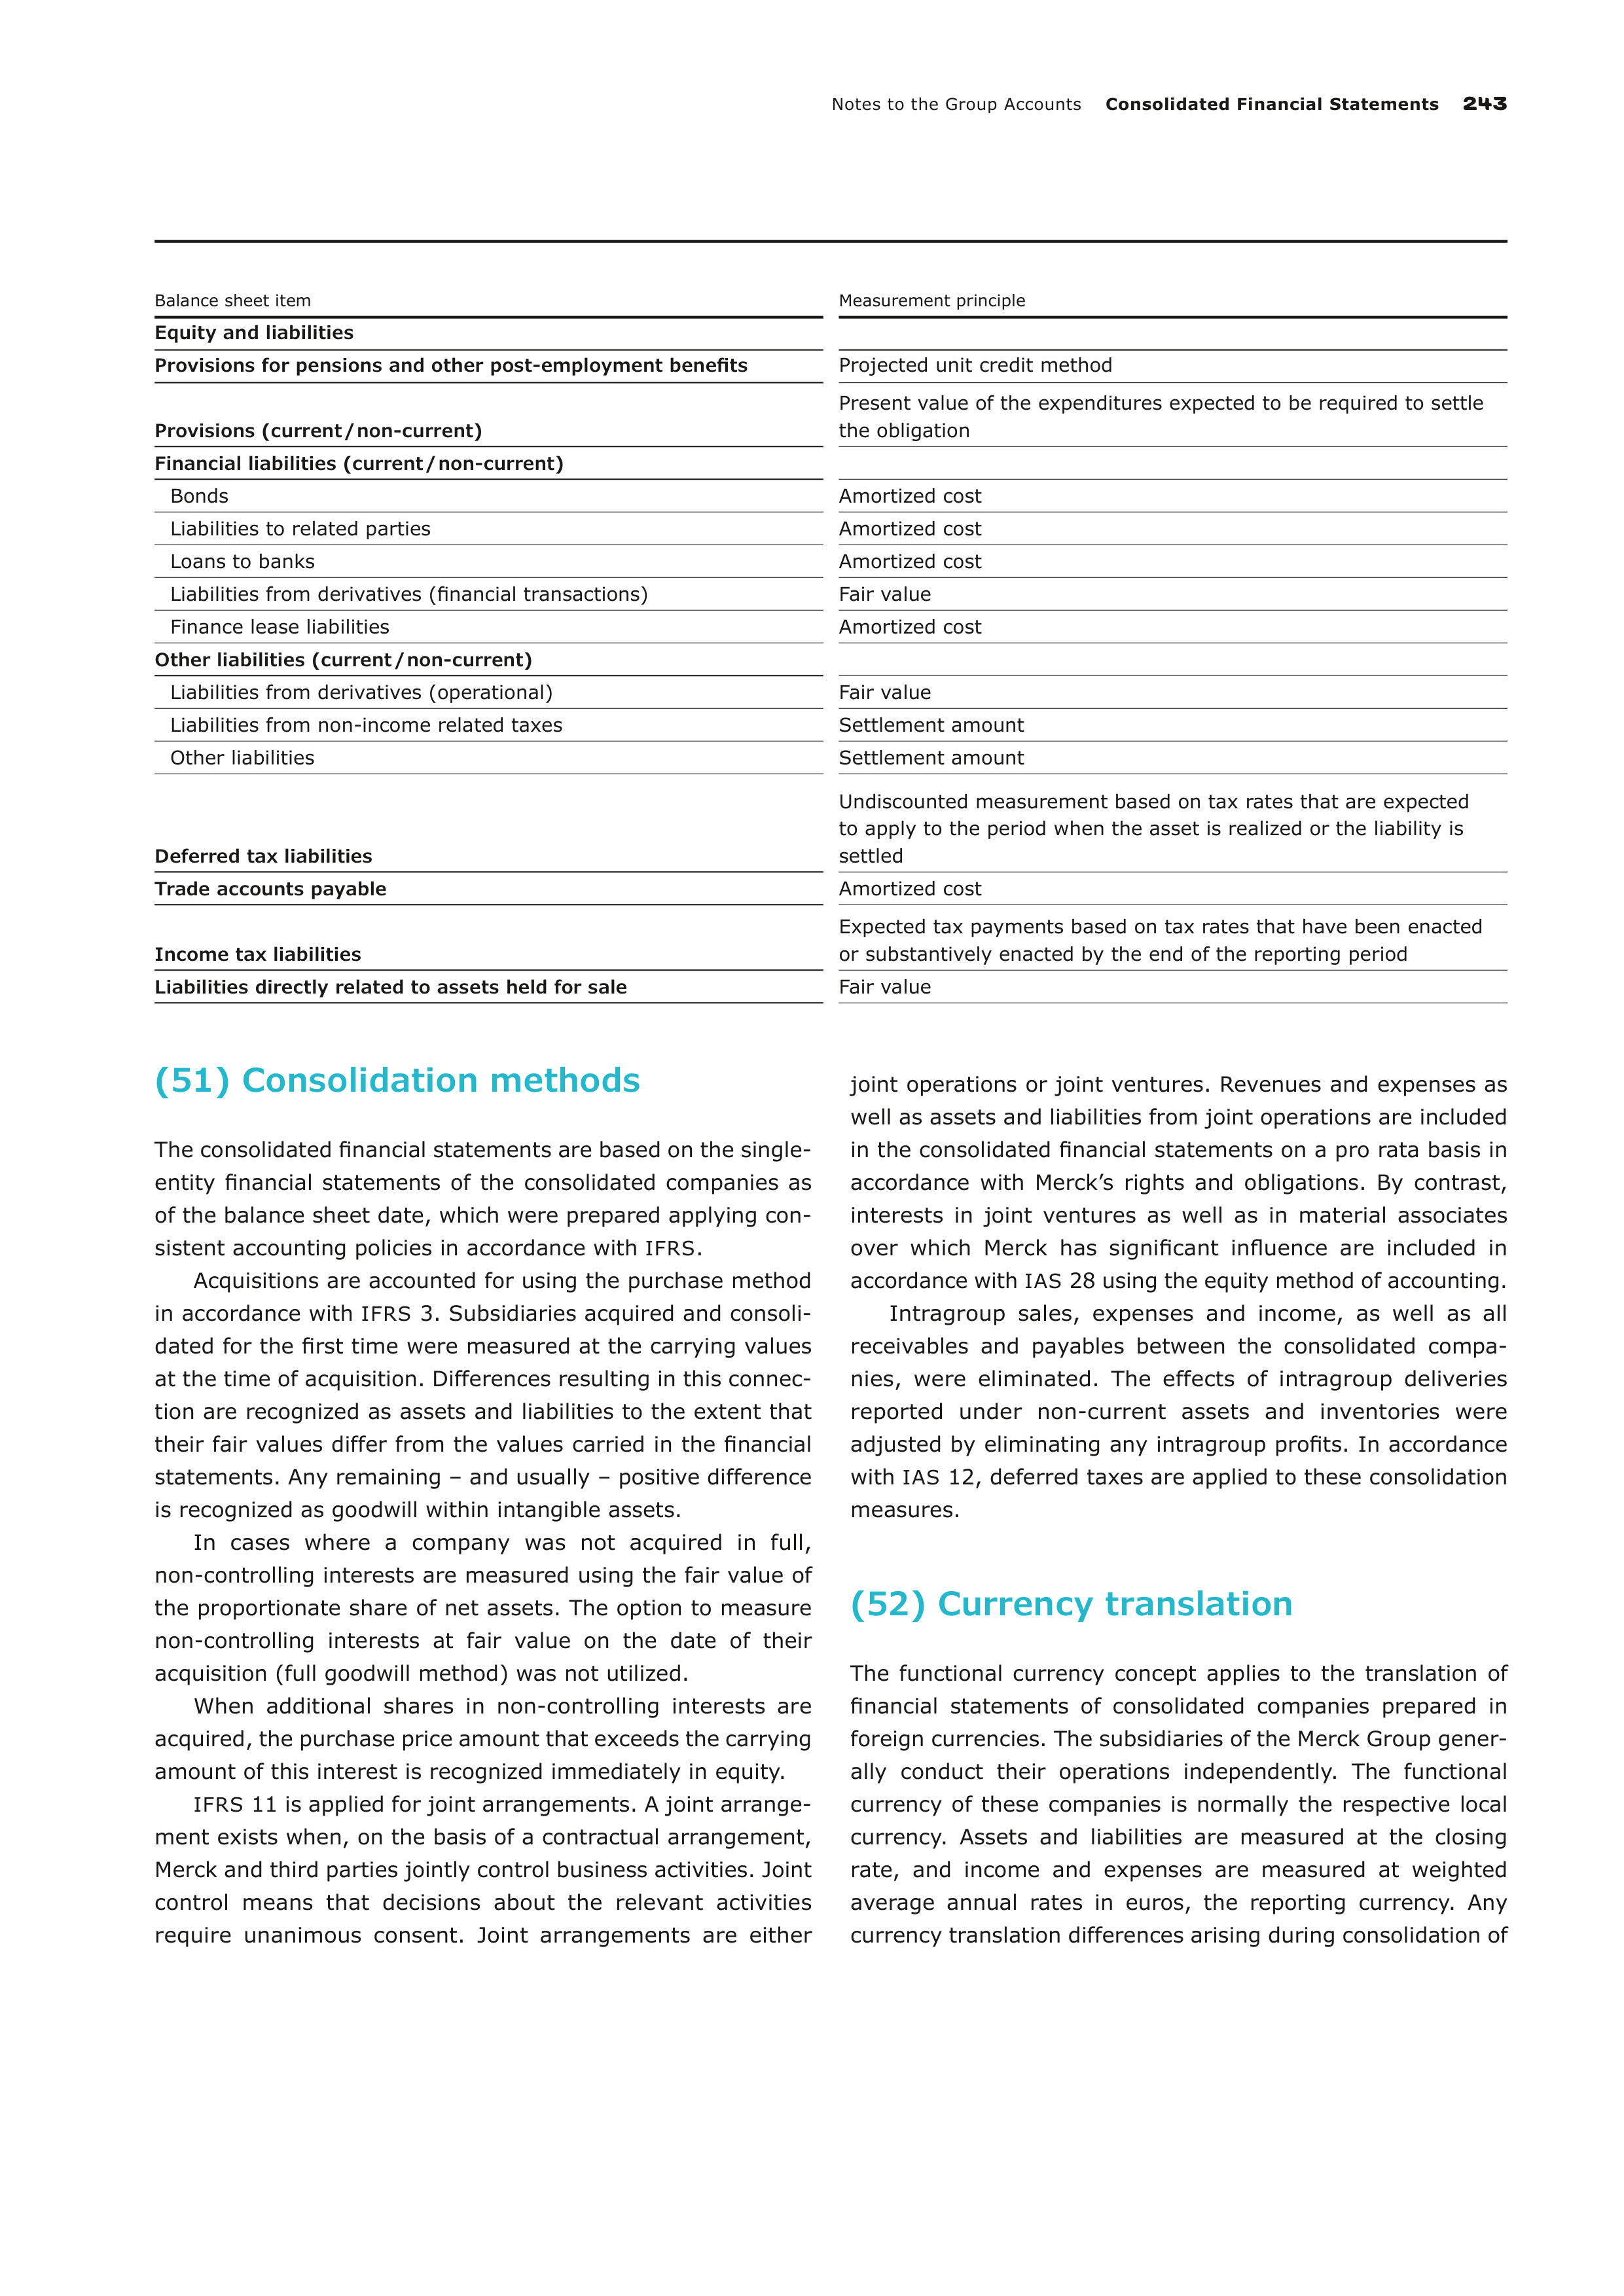
Notes to the Group Accounts
Consolidated Financial Statements
243
Balance sheet item
Measurement principle
Equity and liabilities
Provisions for pensions and other post-employment benefits
Projected unit credit method
Provisions (current / non-current)
Present value of the expenditures expected to be required to settle
the obligation
Financial liabilities (current / non-current)
Bonds
Amortized cost
Liabilities to related parties
Amortized cost
Loans to banks
Amortized cost
Liabilities from derivatives (financial transactions)
Fair value
Finance lease liabilities
Amortized cost
Other liabilities (current / non-current)
Liabilities from derivatives (operational)
Fair value
Liabilities from non-income related taxes
Settlement amount
Other liabilities
Settlement amount
Deferred tax liabilities
Undiscounted measurement based on tax rates that are expected
to apply to the period when the asset is realized or the liability is
settled
Trade accounts payable
Amortized cost
Income tax liabilities
Expected tax payments based on tax rates that have been enacted
or substantively enacted by the end of the reporting period
Liabilities directly related to assets held for sale
Fair value
(51) Consolidation methods
The consolidated financial statements are based on the single-
entity financial statements of the consolidated companies as
of the balance sheet date, which were prepared applying con-
sistent accounting policies in accordance with
IFRS
.
Acquisitions are accounted for using the purchase method
in accordance with
IFRS
3. Subsidiaries acquired and consoli-
dated for the first time were measured at the carrying values
at the time of acquisition. Differences resulting in this connec-
tion are recognized as assets and liabilities to the extent that
their fair values differ from the values carried in the financial
statements. Any remaining – and usually – positive difference
is recognized as goodwill within intangible assets.
In cases where a company was not acquired in full,
non-controlling interests are measured using the fair value of
the proportionate share of net assets. The option to measure
non-controlling interests at fair value on the date of their
acquisition (full goodwill method) was not utilized.
When additional shares in non-controlling interests are
acquired, the purchase price amount that exceeds the carrying
amount of this interest is recognized immediately in equity.
IFRS
11 is applied for joint arrangements. A joint arrange-
ment exists when, on the basis of a contractual arrangement,
Merck and third parties jointly control business activities. Joint
control means that decisions about the relevant activities
require unanimous consent. Joint arrangements are either
joint operations or joint ventures. Revenues and expenses as
well as assets and liabilities from joint operations are included
in the consolidated financial statements on a pro rata basis in
accordance with Merck’s rights and obligations. By contrast,
interests in joint ventures as well as in material associates
over which Merck has significant influence are included in
accordance with
IAS
28 using the equity method of accounting.
Intragroup sales, expenses and income, as well as all
receivables and payables between the consolidated compa-
n
ies, were eliminated. The effects of intragroup deliveries
reported under non-current assets and inventories were
adjusted by eliminating any intragroup profits. In accordance
with
IAS
12, deferred taxes are applied to these consolidation
measures.
(52) Currency translation
The functional currency concept applies to the translation of
financial statements of consolidated companies prepared in
foreign currencies. The subsidiaries of the Merck Group gener-
ally conduct their operations independently. The functional
currency of these companies is normally the respective local
currency. Assets and liabilities are measured at the closing
rate, and income and expenses are measured at weighted
average annual rates in euros, the reporting currency. Any
currency translation differences arising during consolidation of
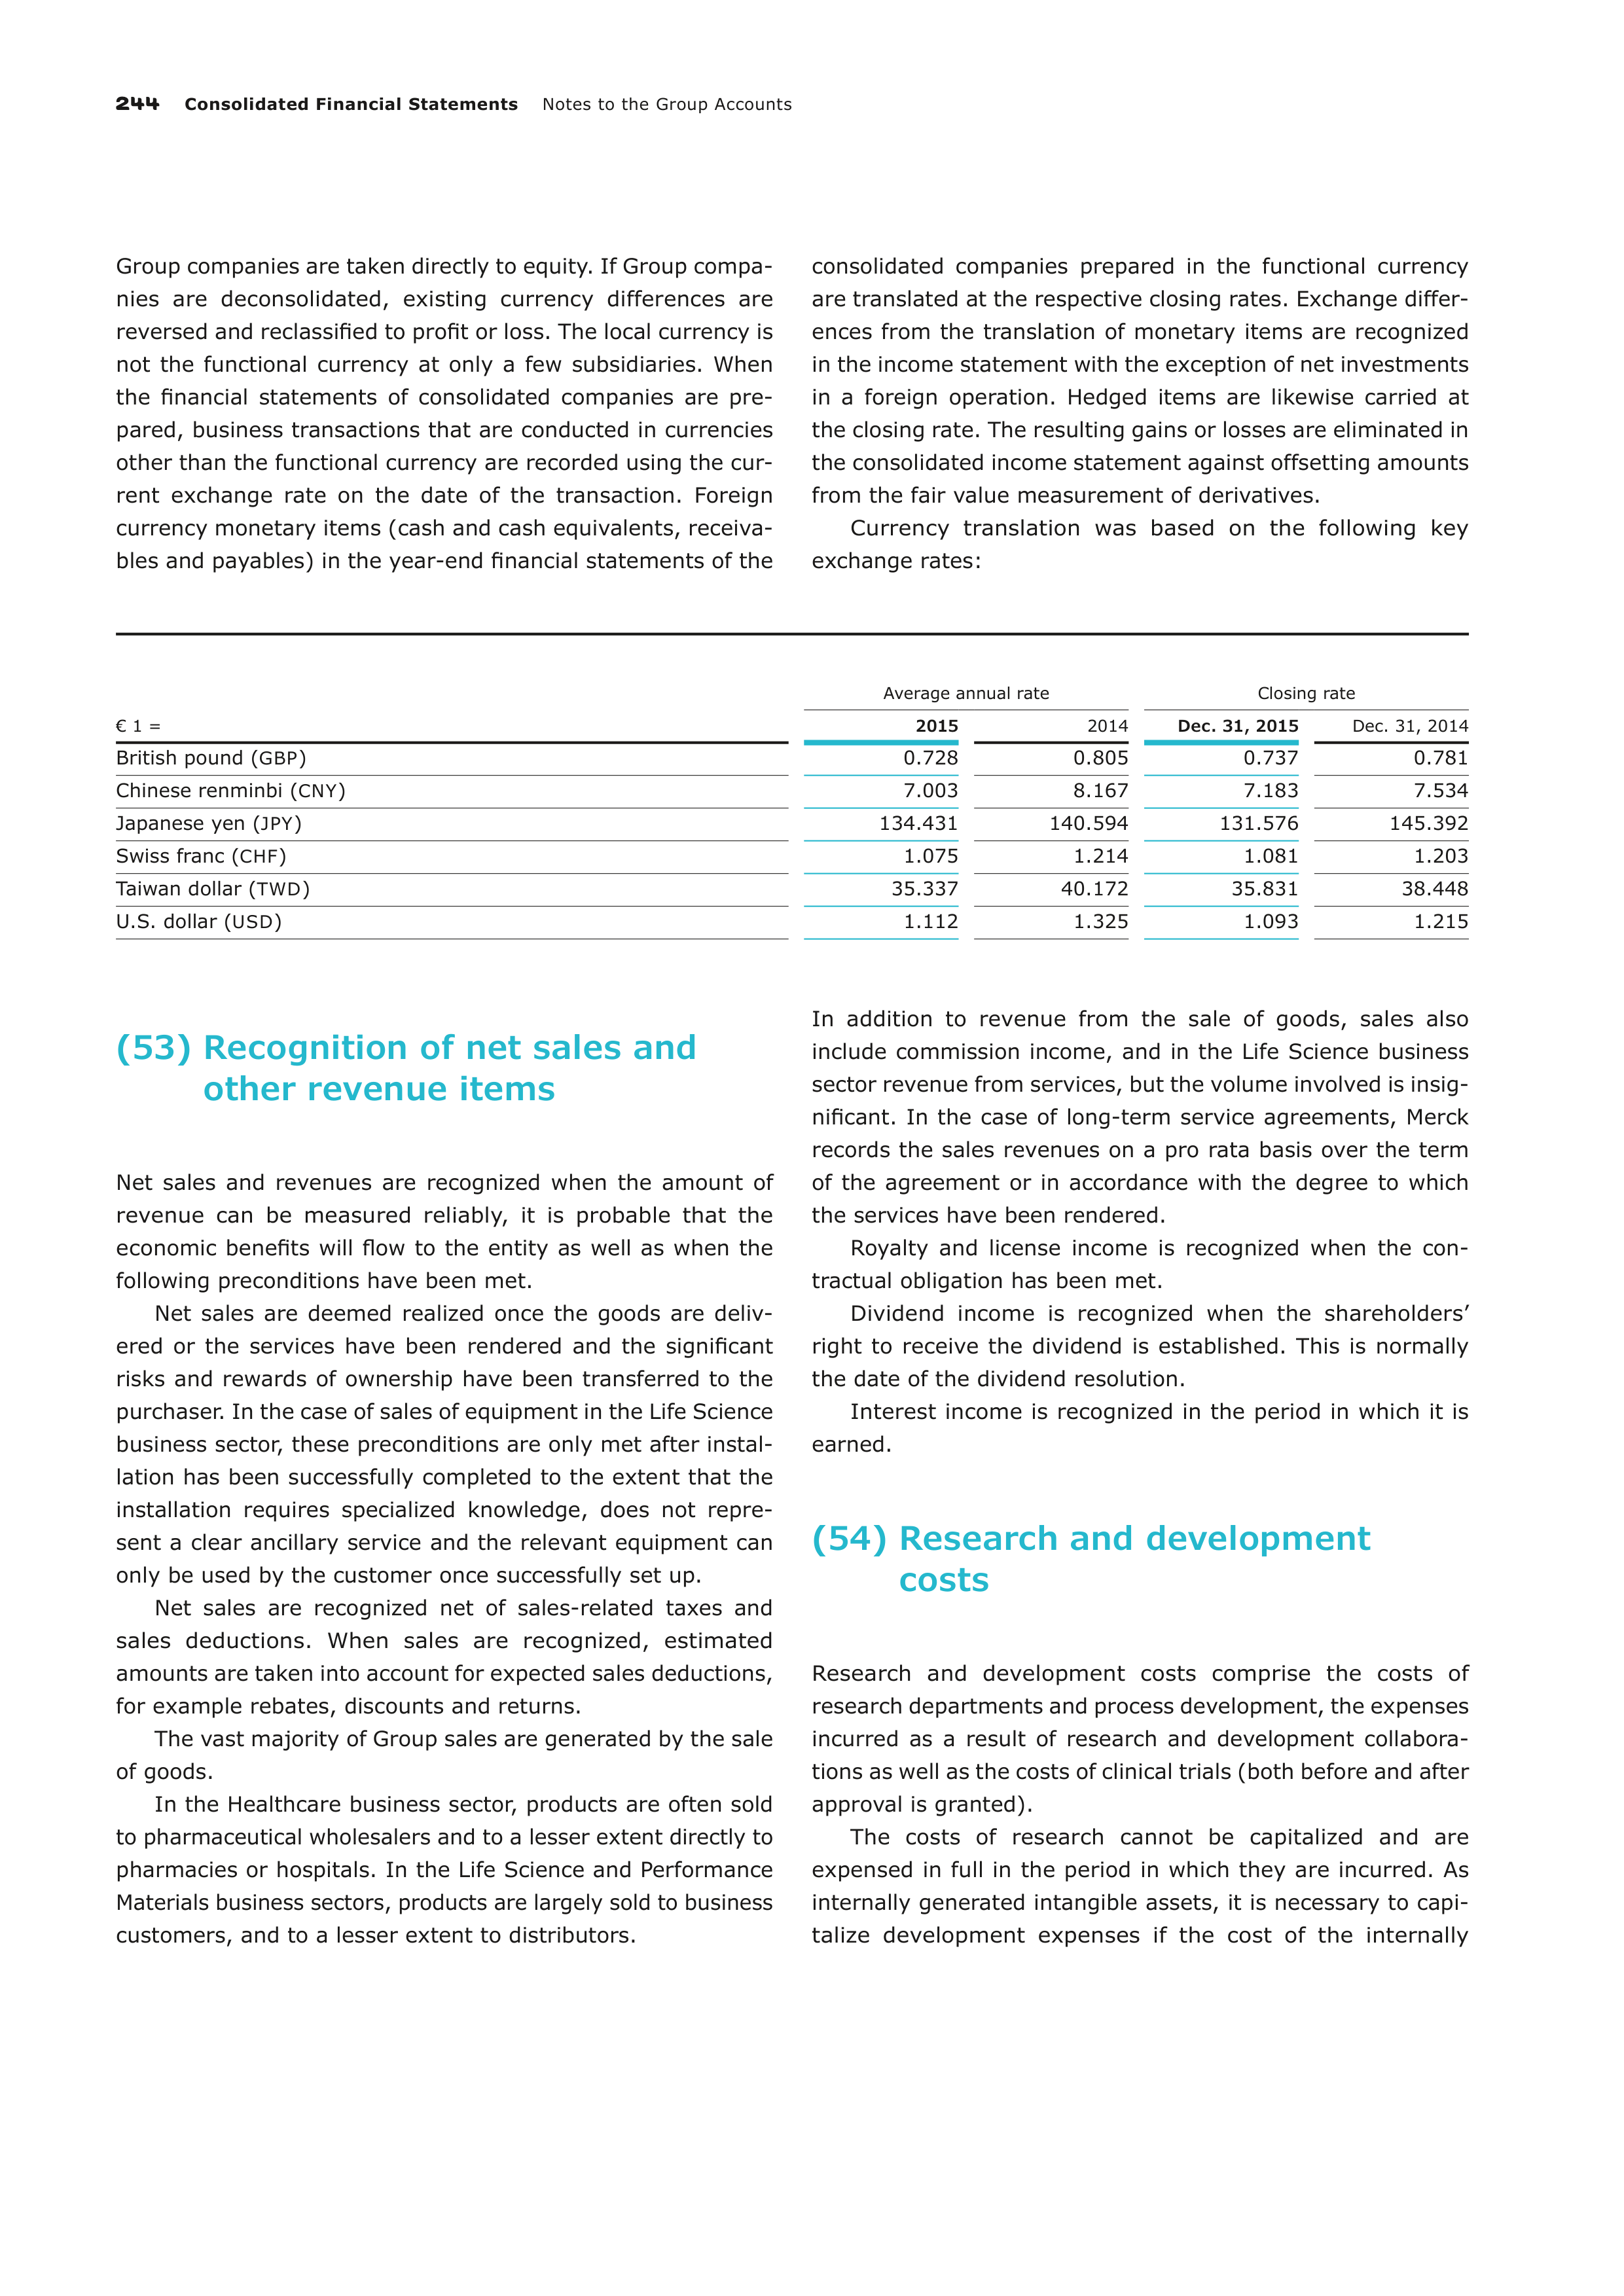
244
Consolidated Financial Statements
Notes to the Group Accounts
Group companies are taken directly to equity. If Group compa-
nies are deconsolidated, existing currency differences are
reversed and reclassified to profit or loss. The local currency is
not the functional currency at only a few subsidiaries. When
the financial statements of consolidated companies are pre-
pared, business transactions that are conducted in currencies
other than the functional currency are recorded using the cur-
rent exchange rate on the date of the transaction. Foreign
currency monetary items (cash and cash equivalents, receiva-
bles and payables) in the year-end financial statements of the
consolidated companies prepared in the functional currency
are translated at the respective closing rates. Exchange differ-
ences from the translation of monetary items are recognized
in the income statement with the exception of net investments
in a foreign operation. Hedged items are likewise carried at
the closing rate. The resulting gains or losses are eliminated in
the consolidated income statement against offsetting amounts
from the fair value measurement of derivatives.
Currency translation was based on the following key
exchange rates:
€ 1 =
Average annual rate
Closing rate
2015
2014
Dec. 31, 2015
Dec. 31, 2014
British pound (
GBP
)
0.728
0.805
0.737
0.781
Chinese renminbi (
CNY
)
7.003
8.167
7.183
7.534
Japanese yen (
JPY
)
134.431
140.594
131.576
145.392
Swiss franc (
CHF
)
1.075
1.214
1.081
1.203
Taiwan dollar (
TWD
)
35.337
40.172
35.831
38.448
U.S. dollar (
USD
)
1.112
1.325
1.093
1.215
(53) Recognition of net sales and
other revenue items
Net sales and revenues are recognized when the amount of
revenue can be measured reliably, it is probable that the
eco
nomic benefits will flow to the entity as well as when the
following preconditions have been met.
Net sales are deemed realized once the goods are deliv-
ered or the services have been rendered and the significant
risks and rewards of ownership have been transferred to the
purchaser. In the case of sales of equipment in the Life Science
business sector, these preconditions are only met after instal-
lation has been successfully completed to the extent that the
installation requires specialized knowledge, does not repre-
sent a clear ancillary service and the relevant equipment can
only be used by the customer once successfully set up.
Net sales are recognized net of sales-related taxes and
sales deductions. When sales are recognized, estimated
amounts are taken into account for expected sales deductions,
for example rebates, discounts and returns.
The vast majority of Group sales are generated by the sale
of goods.
In the Healthcare business sector, products are often sold
to pharmaceutical wholesalers and to a lesser extent directly to
pharmacies or hospitals. In the Life Science and Performance
Materials business sectors, products are largely sold to business
customers, and to a lesser extent to distributors.
In addition to revenue from the sale of goods, sales also
include commission income, and in the Life Science business
sector revenue from services, but the volume involved is insig-
nificant. In the case of long-term service agreements, Merck
records the sales revenues on a pro rata basis over the term
of the agreement or in accordance with the degree to which
the services have been rendered.
Royalty and license income is recognized when the con-
tractual obligation has been met.
Dividend income is recognized when the shareholders’
right to receive the dividend is established. This is normally
the date of the dividend resolution.
Interest income is recognized in the period in which it is
earned.
(54) Research and development
costs
Research and development costs comprise the costs of
research departments and process development, the expenses
incurred as a result of research and development collabora-
tions as well as the costs of clinical trials (both before and after
approval is granted).
The costs of research cannot be capitalized and are
expensed in full in the period in which they are incurred. As
internally generated intangible assets, it is necessary to capi-
talize development expenses if the cost of the internally
Notes to the Group Accounts
Consolidated Financial Statements
245
gen
erated intangible asset can be reliably determined and the
asset can be expected to lead to future economic benefits. The
condition for this is that the necessary resources are available
for the development of the asset, technical feasibility of the
asset is given, its completion and use are intended, and mar-
ketability is given. Owing to the high risks up to the time that
pharmaceutical products are approved, these criteria are not
met in the Healthcare business sector. Costs incurred after
regulatory approval are usually insignificant and are therefore
not recognized as intangible assets. Owing to the risks existing
up until market launch, development expenses in the Life
Science and Performance Materials business sectors can like-
wise not be capitalized.
Reimbursements for R&D are offset against research and
development costs.
(55) Financial instruments: Principles
A financial instrument is a contractual arrangement that gives
rise to a financial asset of one entity and a financial liability or
an equity instrument of another entity. A distinction is made
between non-derivative and derivative financial instruments.
Merck accounts for regular way purchases or sales of non-
derivative financial instruments at the settlement date and of
derivatives at the trade date.
Upon initial recognition, financial assets and financial lia-
bilities are measured at fair value, taking into account any
transaction costs, if necessary.
Financial assets are derecognized in part or in full if the
contractual rights to the cash flows from the financial asset
have expired or have been fulfilled or if control and substan-
tially all the risks and rewards of ownership of the financial
asset have been transferred to a third party. Financial liabili-
ties are derecognized if the contractual obligations have been
discharged, cancelled, or expired. Cash and cash equivalents
are carried at nominal value.
(56) Financial instruments:
Categories and classes of
financial instruments
Financial assets and liabilities are classified into the following
IAS
39 measurement categories and
IFRS
7 classes. The
classes required to be disclosed in accordance with
IFRS
7
consist of the measurement categories set out here. Addition-
ally, cash and cash equivalents with an original maturity of up
to 90 days, finance lease liabilities, and derivatives designated
as hedging instruments are also classes in accordance with
IFRS
7.
Financial assets and financial liabilities at fair value
through profit or loss
‟Financial assets and financial liabilities at fair value through
profit or loss” can be both non-derivative and derivative finan-
cial instruments. Financial instruments in this category are
subsequently measured at fair value. Gains and losses on
financial instruments in this measurement category are recog-
nized directly in the consolidated income statement. This
measurement category includes an option to designate
non-derivative financial instruments as ‟at fair value through
profit or loss” on initial recognition (fair value option) or as
‟financial instruments held for trading”. The fair value option
was applied neither during the fiscal year nor the previous
year. Merck only assigns derivatives to the ‟held for trading”
measurement category. Special accounting rules apply to
derivatives that are designated as hedging instruments in a
hedging relationship.
Held to maturity investments
‟Held to maturity investments” are non-derivative financial
assets with fixed or determinable payments and a fixed matu-
rity that are quoted in an active market. To be able to assign a
financial asset to this measurement category, the entity must
have the positive intention and ability to hold it to maturity.
These investments are subsequently measured at amortized
cost using the effective rate method. If there is objective evi-
dence that such an asset is impaired, an impairment loss is
recognized in profit or loss. Subsequent reversals of impair-
ment losses are also recognized in profit or loss up to the
amount of the amortized cost. At Merck, this measurement
category is used for current financial assets.
Loans and receivables
‟Loans and receivables” are non-derivative financial assets
with fixed or determinable payments that are not quoted in an
active market. They are subsequently measured at amortized
cost using the effective rate method. If there is objective evi-
dence that such assets are impaired, an impairment loss is
recognized in profit or loss. Subsequent reversals of impair-
ment losses are also recognized in profit or loss up to the
amount of amortized cost. Long-term non-interest-bearing
and low-interest receivables are measured at their present
value. Merck primarily assigns trade receivables, loans, and
miscellaneous other current and non-current receivables to
this measurement category. Merck always uses a separate
allowance account for impairment losses on trade and other
receivables. Amounts from the allowance account are recog-
nized in the carrying amount of the corresponding receivable
as soon as this is derecognized due to irrecoverability.
246
Consolidated Financial Statements
Notes to the Group Accounts
Available-for-sale financial assets
‟Available-for-sale financial assets” are those non-derivative
financial assets that are not assigned to the measurement cat-
egories ‟financial assets and financial liabilities at fair value
through profit or loss”, ‟held-to-maturity investments” or
‟loans and receivables”. Financial assets in this category are
subsequently measured at fair value. Changes in fair value are
recognized immediately in equity and are only transferred to
the consolidated income statement when the financial asset is
derecognized.
If there is substantial evidence of an asset impairment, the
accumulated loss recognized immediately in equity is to be
reclassified to the consolidated income statement, even if the
financial asset has not been derecognized. Reversals of impair-
ment losses on previously impaired equity instruments are
recognized immediately in equity. Reversals of impairment
losses on previously impaired debt instruments are recognized
in profit or loss up to the amount of the impairment loss. Any
amount in excess of this is recognized directly in equity. Finan-
cial assets in this category for which no fair value is available
or fair value cannot be reliably determined are measured at
cost less any accumulated impairment losses. Impairment
losses on financial assets carried at cost may not be reversed.
At Merck, this measurement category is used in particular
for
interest-bearing securities, financial assets, and financial
investments in equity instruments as well as interests in sub-
sidiaries that are not consolidated due to secondary impor-
tance (affiliates). Both interests in non-consolidated subsidiar-
ies as well as to some extent financial investments in equity
instruments are measured at cost.
Other liabilities
Other liabilities are non-derivative financial liabilities that
are
subsequently measured at amortized cost. Differences
between the amount received and the amount to be repaid are
amortized to profit or loss over the maturity of the instrument.
Merck primarily assigns financial liabilities such as issued
bonds and liabilities due to banks, trade payables, and miscel-
laneous other non-derivative current and non-current liabili-
ties to this category.
(57) Financial instruments:
Derivatives and hedge
accounting
Merck uses derivatives solely to economically hedge recog-
nized assets or liabilities and forecast transactions. The hedge
accounting rules in accordance with
IFRS
are applied to some
of these hedges. A distinction is made between fair value
hedge accounting and cash flow hedge accounting. Designa-
tion of a hedging relationship requires a hedged item and a
hedging instrument. Merck currently only uses derivatives as
hedging instruments.
The hedging relationship must be effective at all times, i.e.
the change in fair value of the hedging instrument almost fully
offsets changes in the fair value of the hedged item. Merck
uses the dollar offset method as well as regression analyses to
measure hedge effectiveness. Derivatives that do not or no
longer meet the documentation or effectiveness requirements
for hedge accounting, whose hedged item no longer exists, or
for which hedge accounting rules are not applied are classified
as ‟financial assets and liabilities at fair value through profit or
loss”. Changes in fair value are then recognized in profit or
loss.
At Merck, cash flow hedges normally relate to highly prob-
able forecast transactions in foreign currency and to future
interest payments. In cash flow hedges, the effective portion
of the gains and losses on the hedging instrument taking
deferred taxes into consideration is recognized in equity until
the hedged expected cash flows affect profit or loss. This is
also the case if the hedging instrument expires, is sold, or is
terminated before the hedged transaction occurs and the
occurrence of the hedged item remains likely. The ineffective
portion of a cash flow hedge is recognized directly in profit or
loss.
(58) Intangible assets
Acquired intangible assets are recognized at cost and are clas-
sified as assets with finite and indefinite useful lives. Self-
developed intangible assets are only capitalized if the require-
ments specified by
IAS
38 have been met. Intangible assets
acquired in the course of business combinations are recog-
nized at fair value on the acquisition date. If the development
of intangible assets takes a substantial period of time, the
directly attributable borrowing costs incurred up until comple-
tion are capitalized as part of the costs.
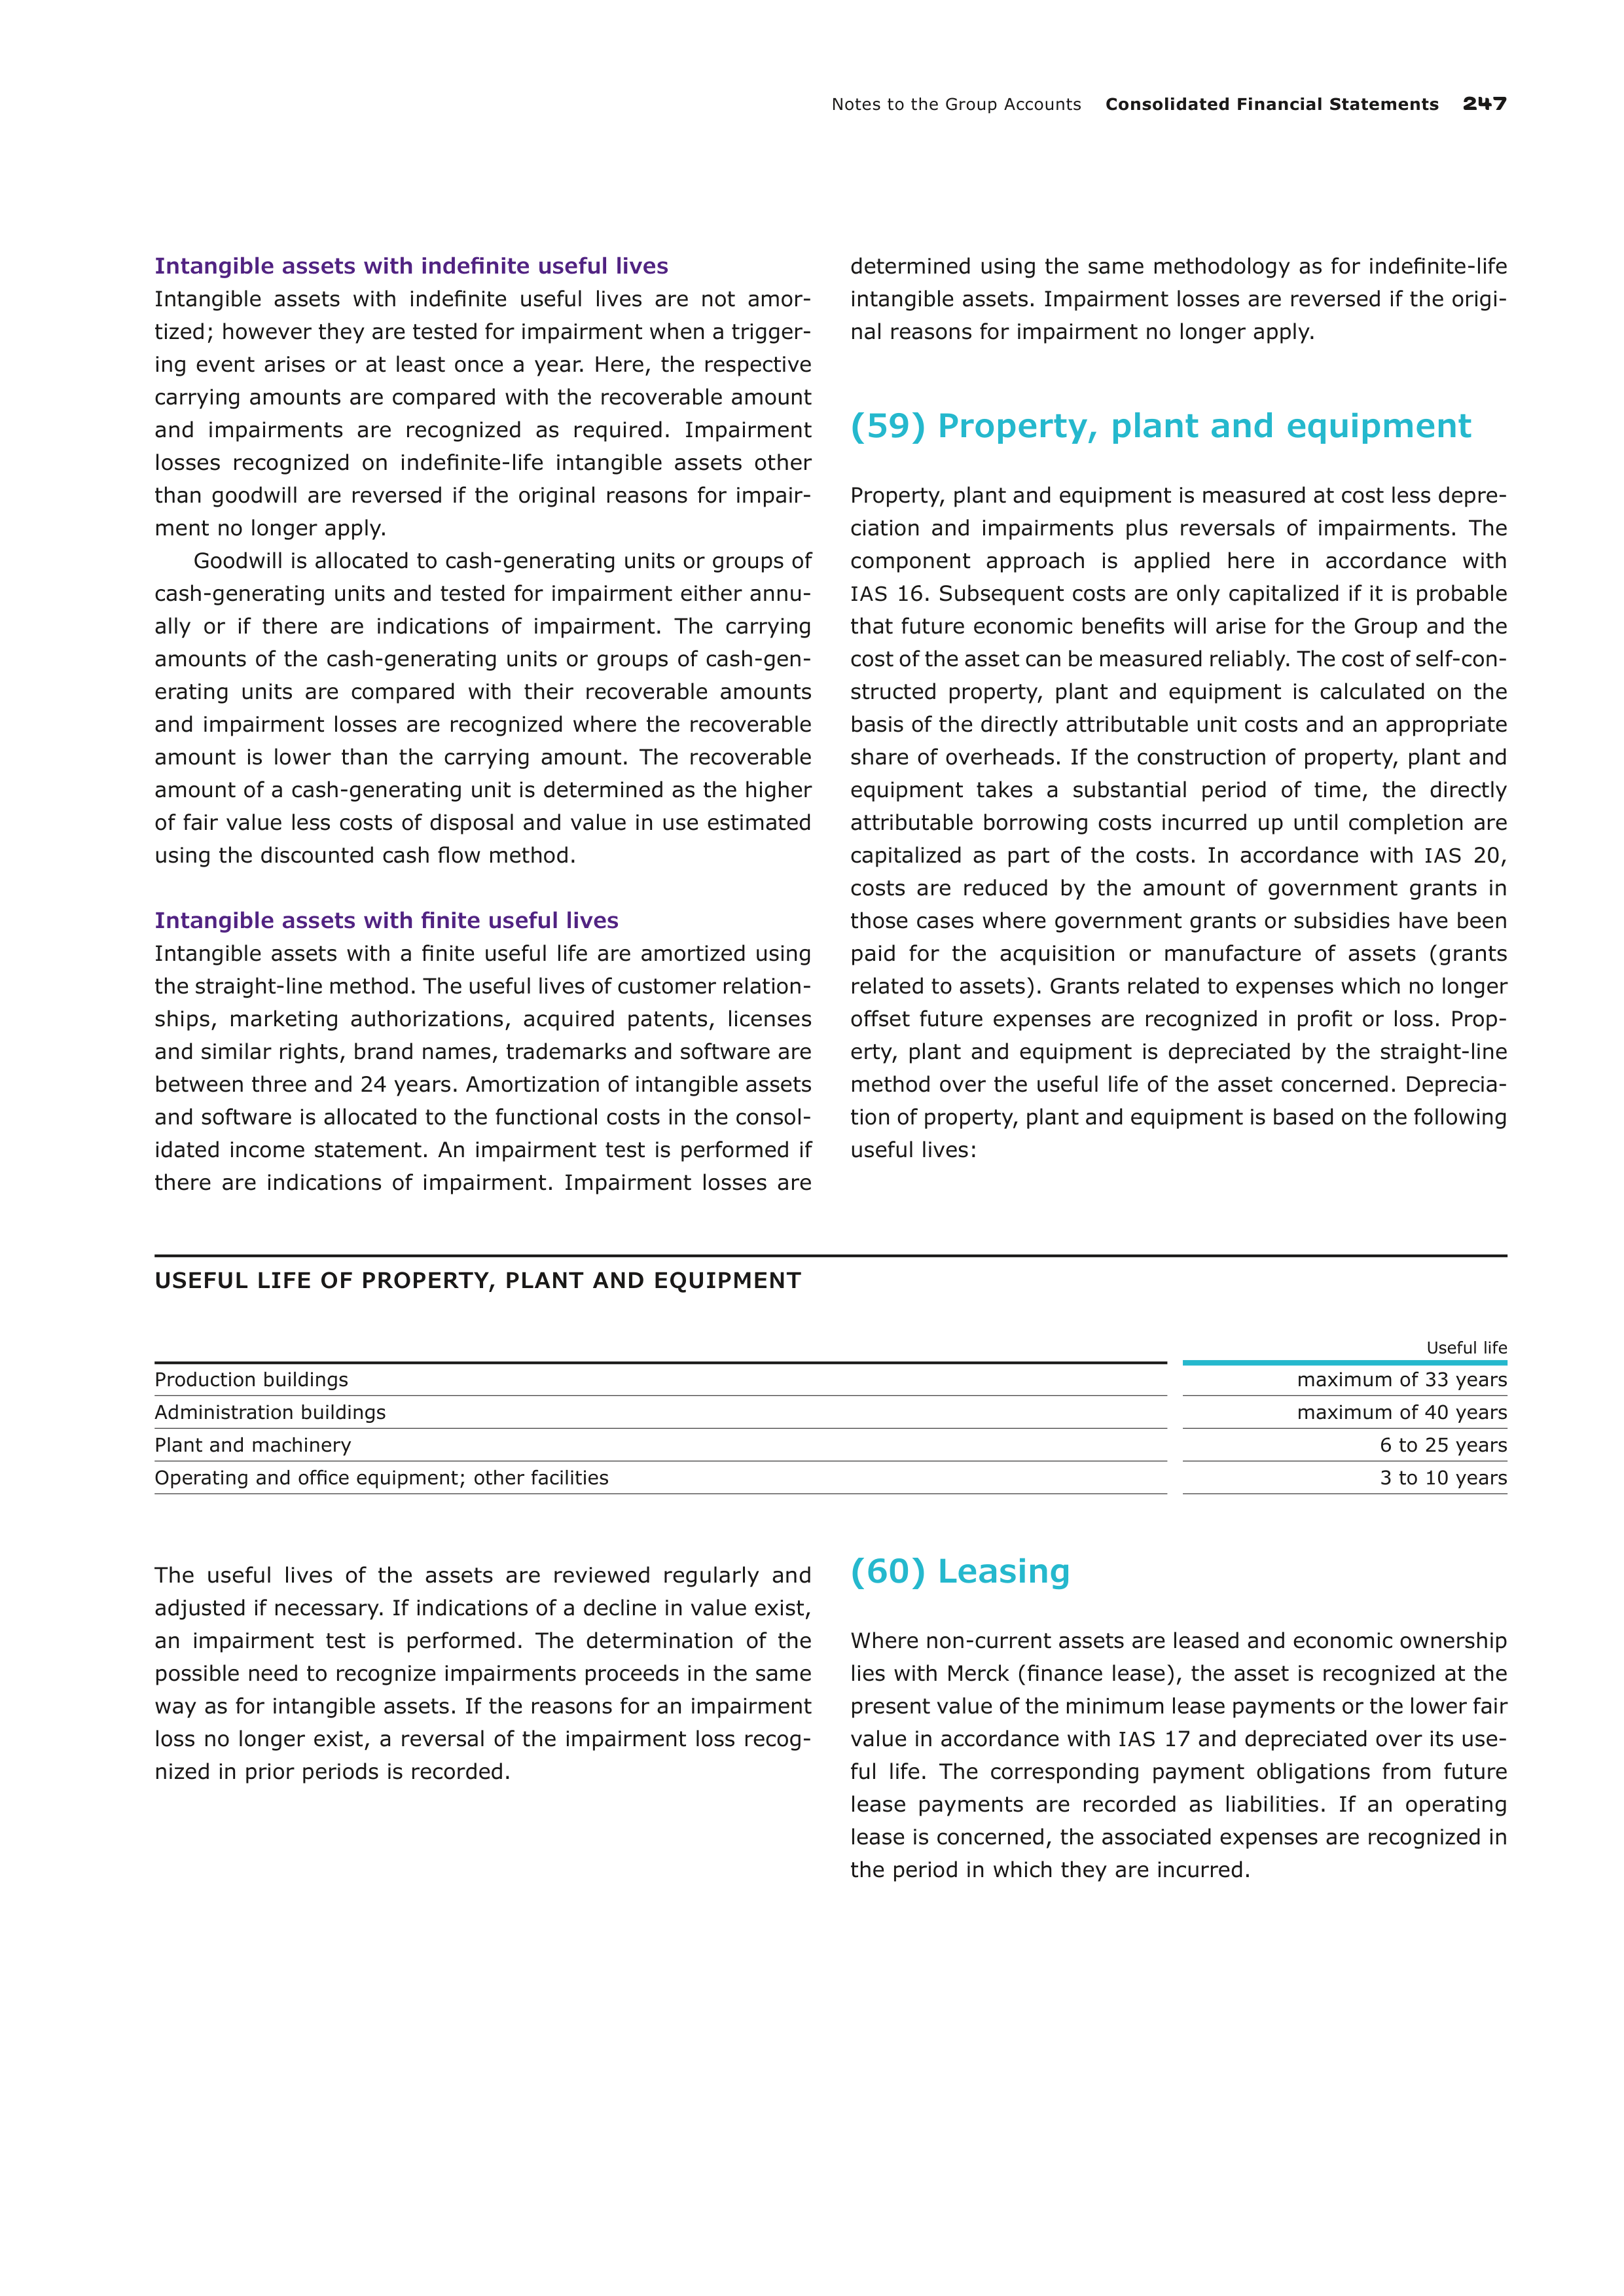
Notes to the Group Accounts
Consolidated Financial Statements
247
Intangible assets with indefinite useful lives
Intangible assets with indefinite useful lives are not amor-
tized; however they are tested for impairment when a trigger-
ing event arises or at least once a year. Here, the respective
carrying amounts are compared with the recoverable amount
and impairments are recognized as required. Impairment
losses recognized on indefinite-life intangible assets other
than goodwill are reversed if the original reasons for impair-
ment no longer apply.
Goodwill is allocated to cash-generating units or groups of
cash-generating units and tested for impairment either annu-
ally or if there are indications of impairment. The carrying
amounts of the cash-generating units or groups of cash-gen-
erating units are compared with their recoverable amounts
and impairment losses are recognized where the recoverable
amount is lower than the carrying amount. The recoverable
amount of a cash-generating unit is determined as the higher
of fair value less costs of disposal and value in use estimated
using the discounted cash flow method.
Intangible assets with finite useful lives
Intangible assets with a finite useful life are amortized using
the straight-line method. The useful lives of customer relation-
ships, marketing authorizations, acquired patents, licenses
and similar rights, brand names, trademarks and software are
between three and 24 years. Amortization of intangible assets
and software is allocated to the functional costs in the consol-
idated income statement. An impairment test is performed if
there are indications of impairment. Impairment losses are
determined using the same methodology as for indefinite-life
intangible assets. Impairment losses are reversed if the origi-
nal reasons for impairment no longer apply.
(59) Property, plant and equipment
Property, plant and equipment is measured at cost less depre-
ciation and impairments plus reversals of impairments. The
component approach is applied here in accordance with
IAS
16. Subsequent costs are only capitalized if it is probable
that future economic benefits will arise for the Group and the
cost of the asset can be measured reliably. The cost of self-con-
structed property, plant and equipment is calculated on the
basis of the directly attributable unit costs and an appropriate
share of overheads. If the construction of property, plant and
equipment takes a substantial period of time, the directly
attributable borrowing costs incurred up until completion are
capitalized as part of the costs. In accordance with
IAS
20,
costs are reduced by the amount of government grants in
those cases where government grants or subsidies have been
paid for the acquisition or manufacture of assets (grants
related to assets). Grants related to expenses which no longer
offset future expenses are recognized in profit or loss. Prop-
erty, plant and equipment is depreciated by the straight-line
method over the useful life of the asset concerned. Deprecia-
tion of property, plant and equipment is based on the following
useful lives:
USEFUL LIFE OF PROPERTY, PLANT AND EQUIPMENT
Useful life
Production buildings
maximum of 33 years
Administration buildings
maximum of 40 years
Plant and machinery
6 to 25 years
Operating and office equipment; other facilities
3 to 10 years
The useful lives of the assets are reviewed regularly and
adjusted if necessary. If indications of a decline in value exist,
an impairment test is performed. The determination of the
possible need to recognize impairments proceeds in the same
way as for intangible assets. If the reasons for an impairment
loss no longer exist, a reversal of the impairment loss recog-
nized in prior periods is recorded.
(60) Leasing
Where non-current assets are leased and economic ownership
lies with Merck (finance lease), the asset is recognized at the
present value of the minimum lease payments or the lower fair
value in accordance with
IAS
17 and depreciated over its use-
ful life. The corresponding payment obligations from future
lease payments are recorded as liabilities. If an operating
lease is concerned, the associated expenses are recognized in
the period in which they are incurred.
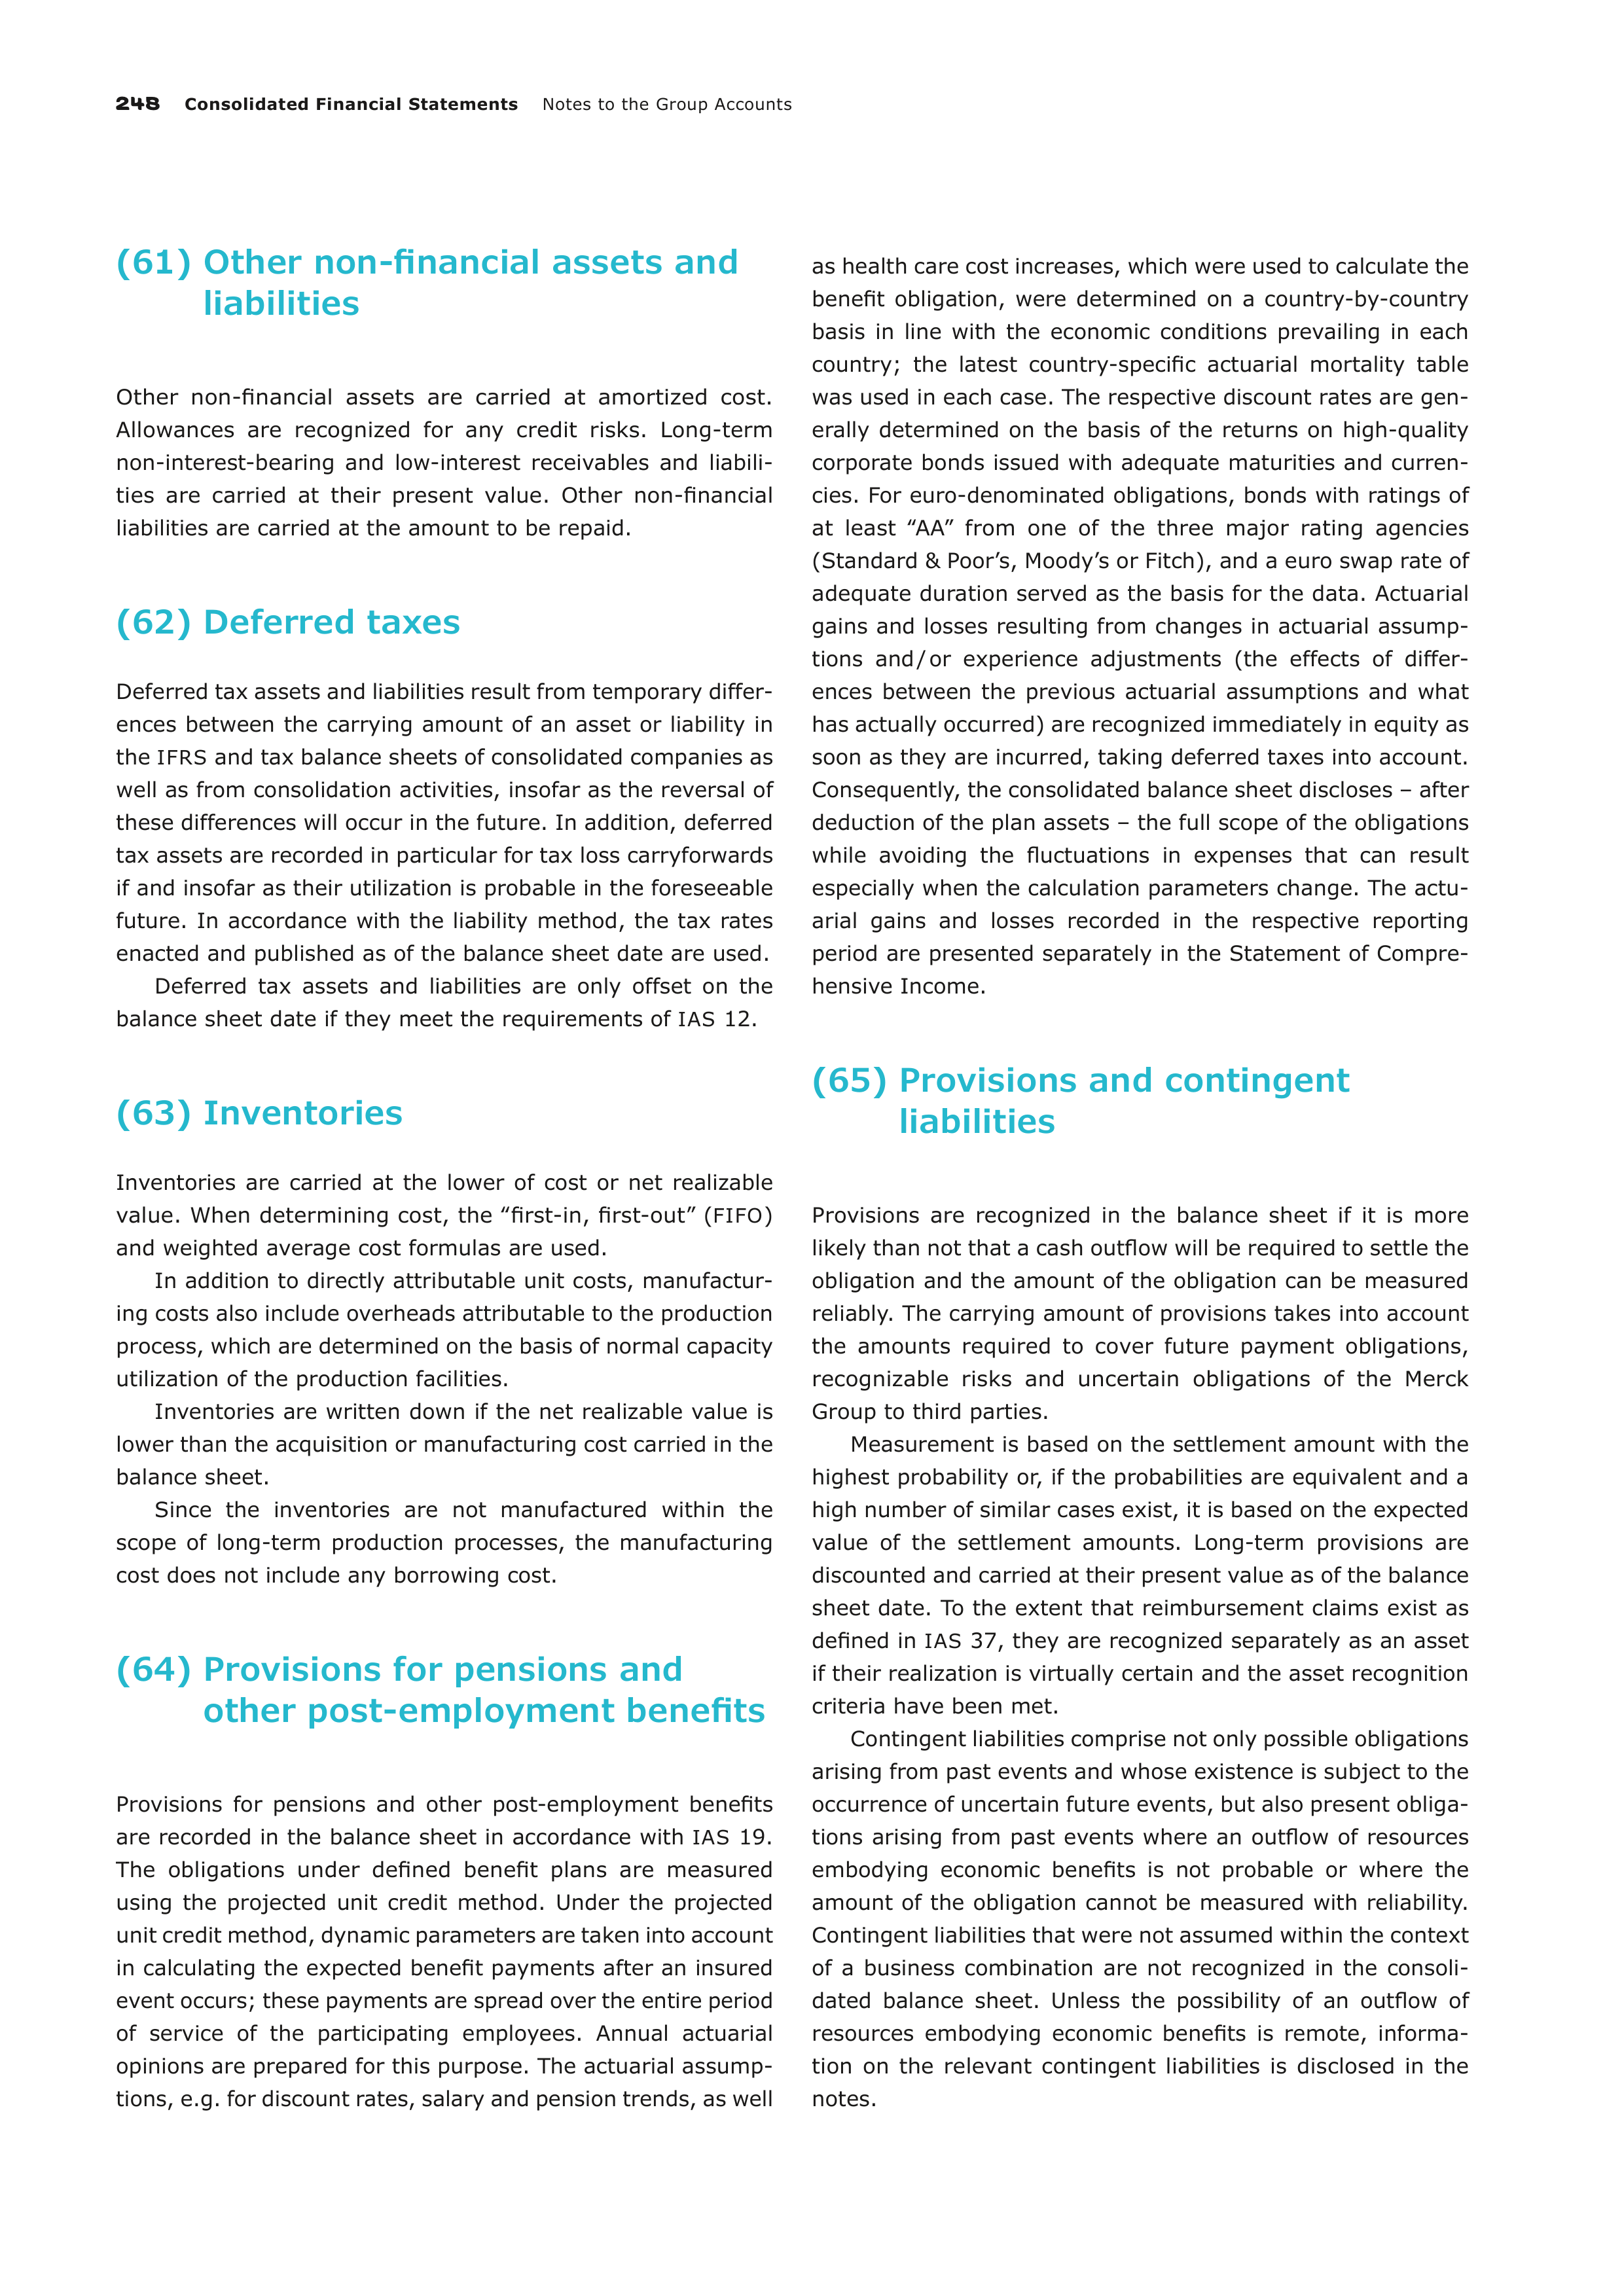
248
Consolidated Financial Statements
Notes to the Group Accounts
(61) Other non-financial assets and
liabilities
Other non-financial assets are carried at amortized cost.
Allowances are recognized for any credit risks. Long-term
non-interest-bearing and low-interest receivables and liabili-
ties are carried at their present value. Other non-financial
liabilities are carried at the amount to be repaid.
(62) Deferred taxes
Deferred tax assets and liabilities result from temporary differ-
ences between the carrying amount of an asset or liability in
the
IFRS
and tax balance sheets of consolidated companies as
well as from consolidation activities, insofar as the reversal of
these differences will occur in the future. In addition, deferred
tax assets are recorded in particular for tax loss carryforwards
if and insofar as their utilization is probable in the foreseeable
future. In accordance with the liability method, the tax rates
enacted and published as of the balance sheet date are used.
Deferred tax assets and liabilities are only offset on the
balance sheet date if they meet the requirements of
IAS
12.
(63) Inventories
Inventories are carried at the lower of cost or net realizable
value. When determining cost, the ‟first-in, first-out”
(
FIFO
)
and weighted average cost formulas are used.
In addition to directly attributable unit costs, manufactur-
ing costs also include overheads attributable to the production
process, which are determined on the basis of normal capacity
utilization of the production facilities.
Inventories are written down if the net realizable value is
lower than the acquisition or manufacturing cost carried in the
balance sheet.
Since the inventories are not manufactured within the
scope of long-term production processes, the manufacturing
cost does not include any borrowing cost.
(64) Provisions for pensions and
other post-employment benefits
Provisions for pensions and other post-employment benefits
are recorded in the balance sheet in accordance with
IAS
19.
The obligations under defined benefit plans are measured
using the projected unit credit method. Under the projected
unit credit method, dynamic parameters are taken into account
in calculating the expected benefit payments after an insured
event occurs; these payments are spread over the entire period
of service of the participating employees. Annual actuarial
opinions are prepared for this purpose. The actuarial assump-
tions, e.g. for discount rates, salary and pension trends, as well
as health care cost increases, which were used to calculate the
benefit obligation, were determined on a country-by-country
basis in line with the economic conditions prevailing in each
country; the latest country-specific actuarial mortality table
was used in each case. The respective discount rates are gen-
erally determined on the basis of the returns on high-quality
corporate bonds issued with adequate maturities and curren-
cies. For euro-denominated obligations, bonds with ratings of
at least ‟AA” from one of the three major rating agencies
(Standard & Poor’s, Moody’s or Fitch), and a euro swap rate of
adequate duration served as the basis for the data. Actuarial
gains and losses resulting from changes in actuarial assump-
tions and / or experience adjustments (the effects of differ-
ences between the previous actuarial assumptions and what
has actually occurred) are recognized immediately in equity as
soon as they are incurred, taking deferred taxes into account.
Consequently, the consolidated balance sheet discloses – after
deduction of the plan assets – the full scope of the obligations
while avoiding the fluctuations in expenses that can result
especially when the calculation parameters change. The actu-
arial gains and losses recorded in the respective reporting
period are presented separately in the Statement of Compre-
hensive Income.
(65) Provisions and contingent
liabilities
Provisions are recognized in the balance sheet if it is more
likely than not that a cash outflow will be required to settle the
obligation and the amount of the obligation can be measured
reliably. The carrying amount of provisions takes into account
the amounts required to cover future payment obligations,
recognizable risks and uncertain obligations of the Merck
Group to third parties.
Measurement is based on the settlement amount with the
highest probability or, if the probabilities are equivalent and a
high number of similar cases exist, it is based on the expected
value of the settlement amounts. Long-term provisions are
discounted and carried at their present value as of the balance
sheet date. To the extent that reimbursement claims exist as
defined in
IAS
37, they are recognized separately as an asset
if their realization is virtually certain and the asset recognition
criteria have been met.
Contingent liabilities comprise not only possible obligations
arising from past events and whose existence is subject to the
occurrence of uncertain future events, but also present obliga-
tions arising from past events where an outflow of resources
embodying economic benefits is not probable or where the
amount of the obligation cannot be measured with reliability.
Contingent liabilities that were not assumed within the context
of a business combination are not recognized in the consoli-
dated balance sheet. Unless the possibility of an outflow of
resources embodying economic benefits is remote, informa-
tion on the relevant contingent liabilities is disclosed in the
notes.
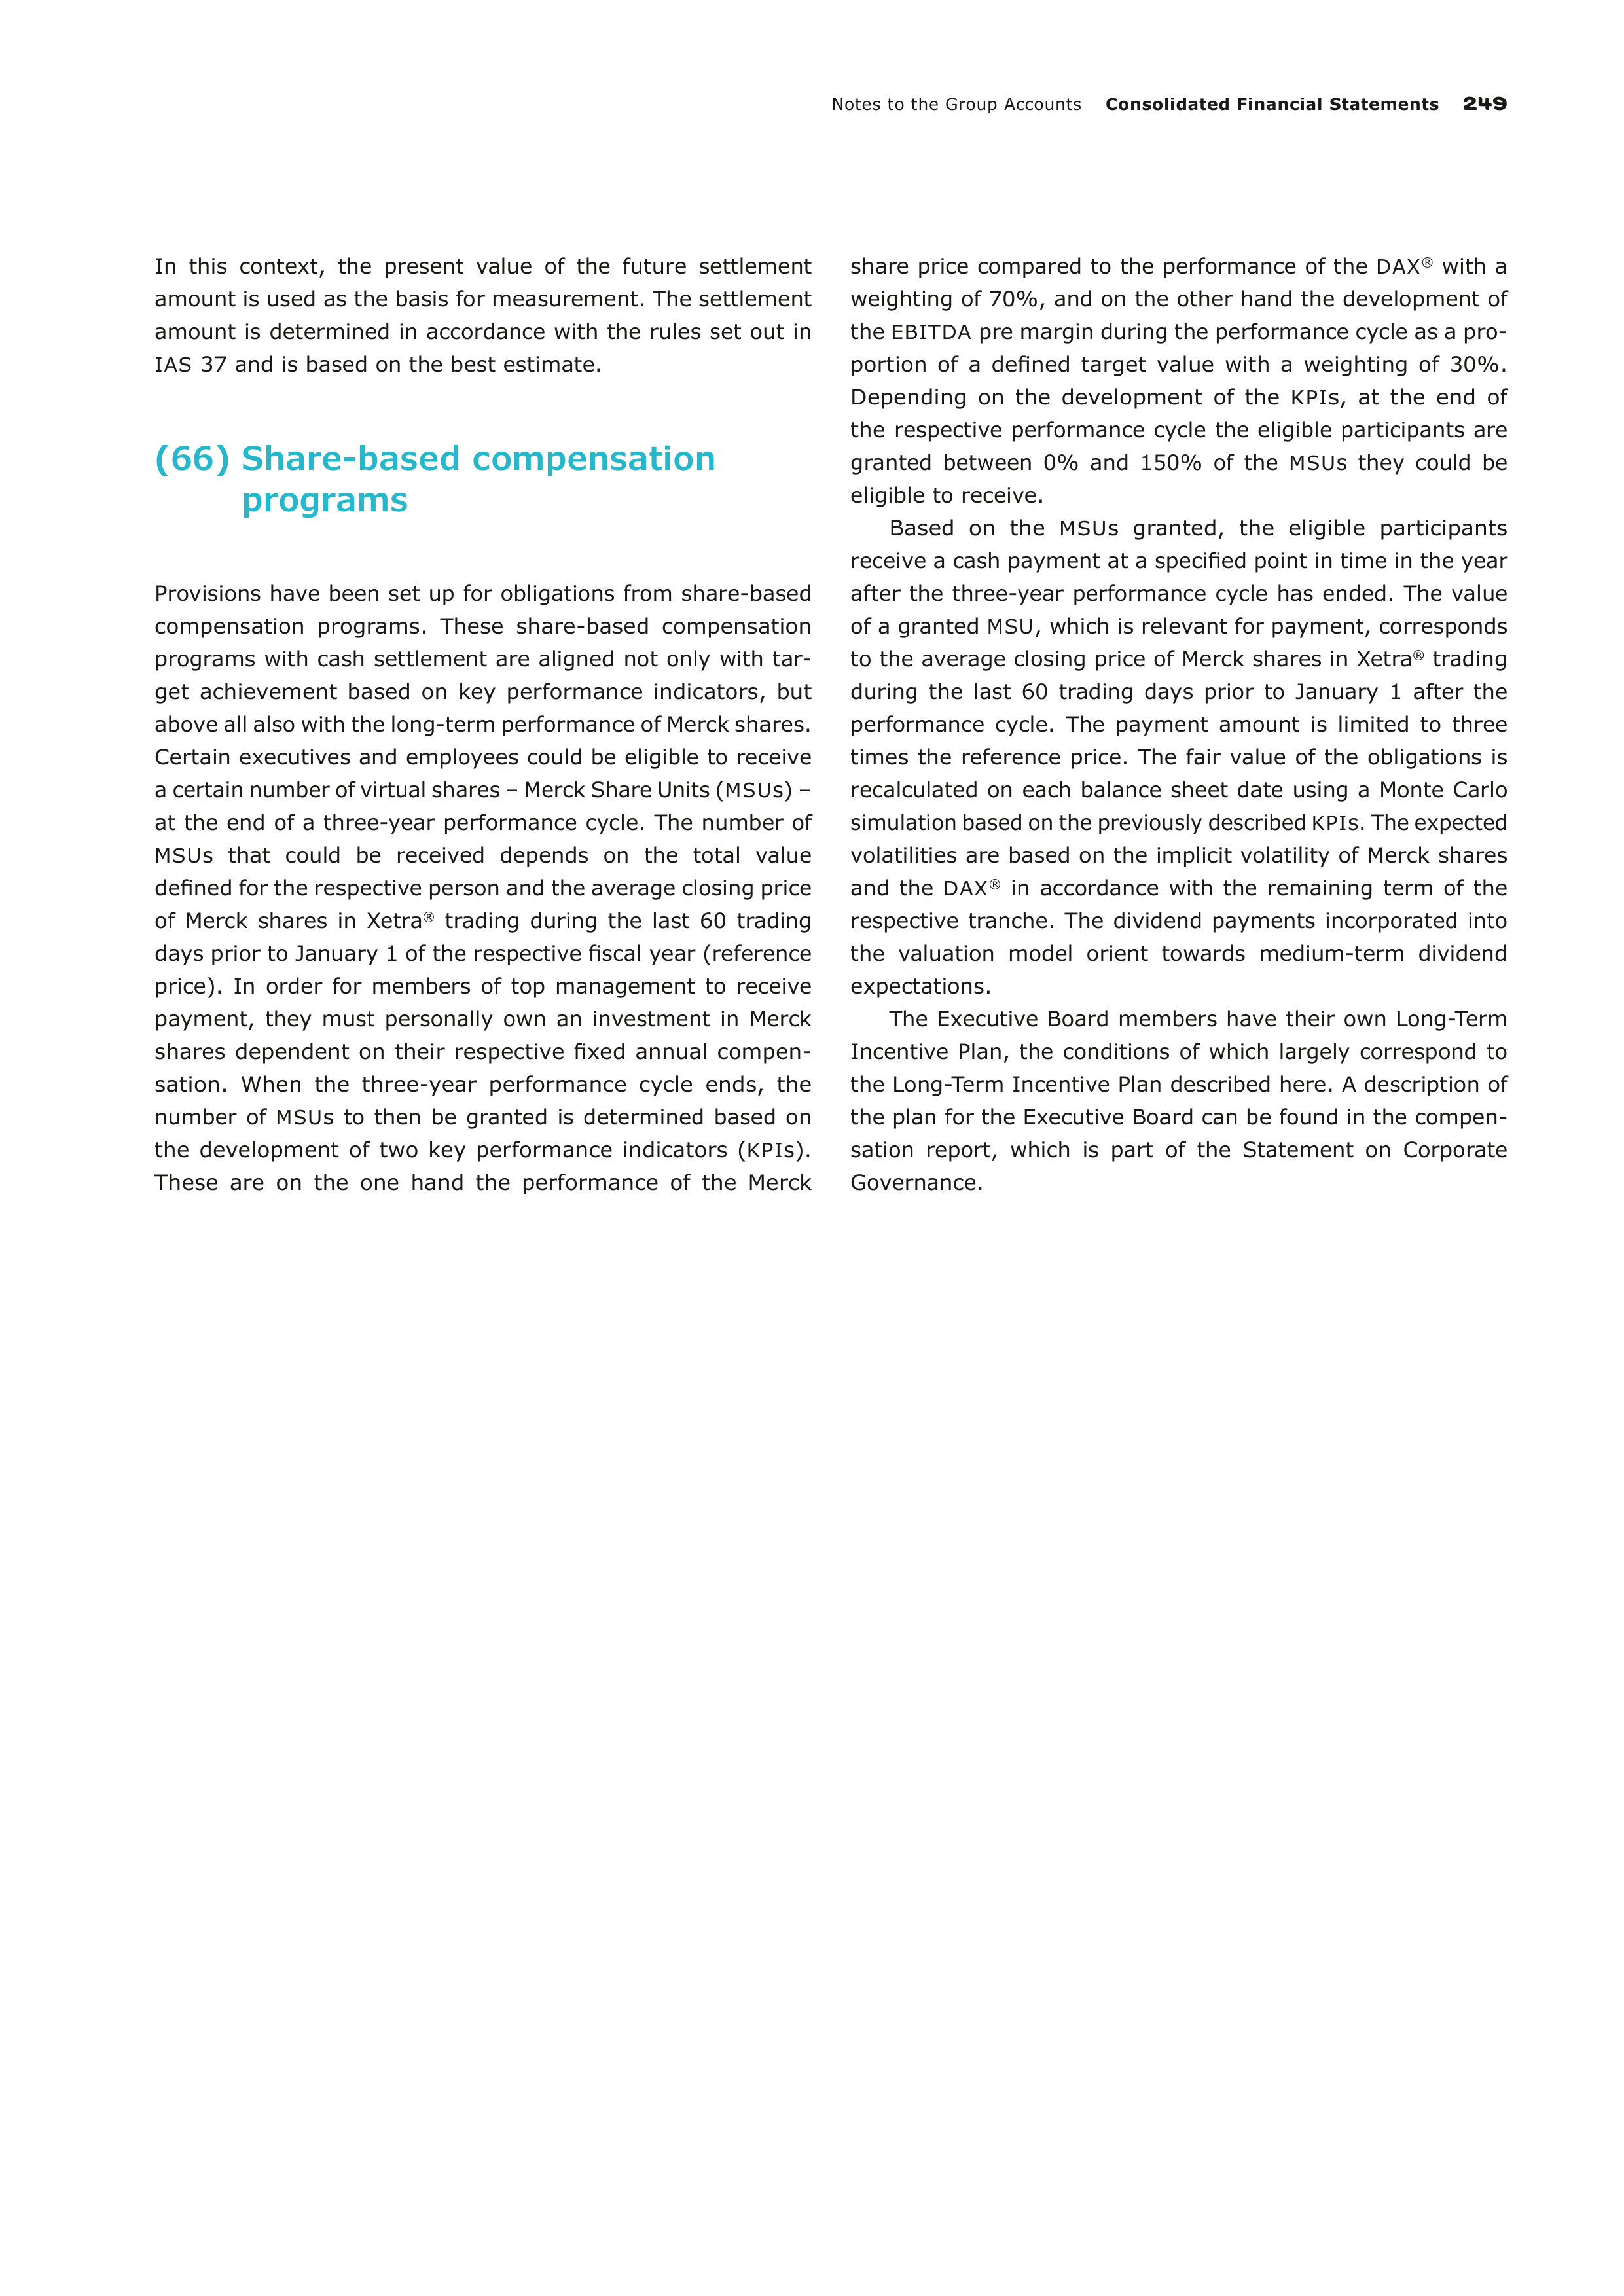
Notes to the Group Accounts
Consolidated Financial Statements
249
In this context, the present value of the future settlement
amount is used as the basis for measurement. The settlement
amount is determined in accordance with the rules set out in
IAS
37 and is based on the best estimate.
(66) Share-based compensation
programs
Provisions have been set up for obligations from share-based
compensation programs. These share-based compensation
programs with cash settlement are aligned not only with tar-
get achievement based on key performance indicators, but
above all also with the long-term performance of Merck shares.
Certain executives and employees could be eligible to receive
a certain number of virtual shares – Merck Share Units
(
MSU
s) –
at the end of a three-year performance cycle. The number of
MSU
s that could be received depends on the total value
defined for the respective person and the average closing price
of Merck shares in Xetra
®
trading during the last 60 trading
days prior to January 1 of the respective fiscal year (reference
price). In order for members of top management to receive
payment, they must personally own an investment in Merck
shares dependent on their respective fixed annual compen-
sation. When the three-year performance cycle ends, the
number of
MSU
s to then be granted is determined based on
the development of two key performance indicators
(
KPI
s).
These are on the one hand the performance of the Merck
share price compared to the performance of the
DAX
®
with a
weighting of 70%, and on the other hand the development of
the
EBITDA
pre margin during the performance cycle as a pro-
portion of a defined target value with a weighting of 30%.
Depending on the development of the
KPI
s, at the end of
the
respective performance cycle the eligible participants are
granted between 0% and 150% of the
MSU
s they could be
eligible to receive.
Based on the
MSU
s granted, the eligible participants
receive a cash payment at a specified point in time in the year
after the three-year performance cycle has ended. The value
of a granted
MSU
, which is relevant for payment, corresponds
to the average closing price of Merck shares in Xetra
®
trading
during the last 60 trading days prior to January 1 after the
performance cycle. The payment amount is limited to three
times the reference price. The fair value of the obligations is
recalculated on each balance sheet date using a Monte Carlo
simulation based on the previously described
KPI
s. The expected
volatilities are based on the implicit volatility of Merck shares
and the
DAX
®
in accordance with the remaining term of the
respective tranche. The dividend payments incorporated into
the valuation model orient towards medium-term dividend
expectations.
The Executive Board members have their own Long-Term
Incentive Plan, the conditions of which largely correspond to
the Long-Term Incentive Plan described here. A description of
the plan for the Executive Board can be found in the compen-
sation report, which is part of the Statement on Corporate
Governance.
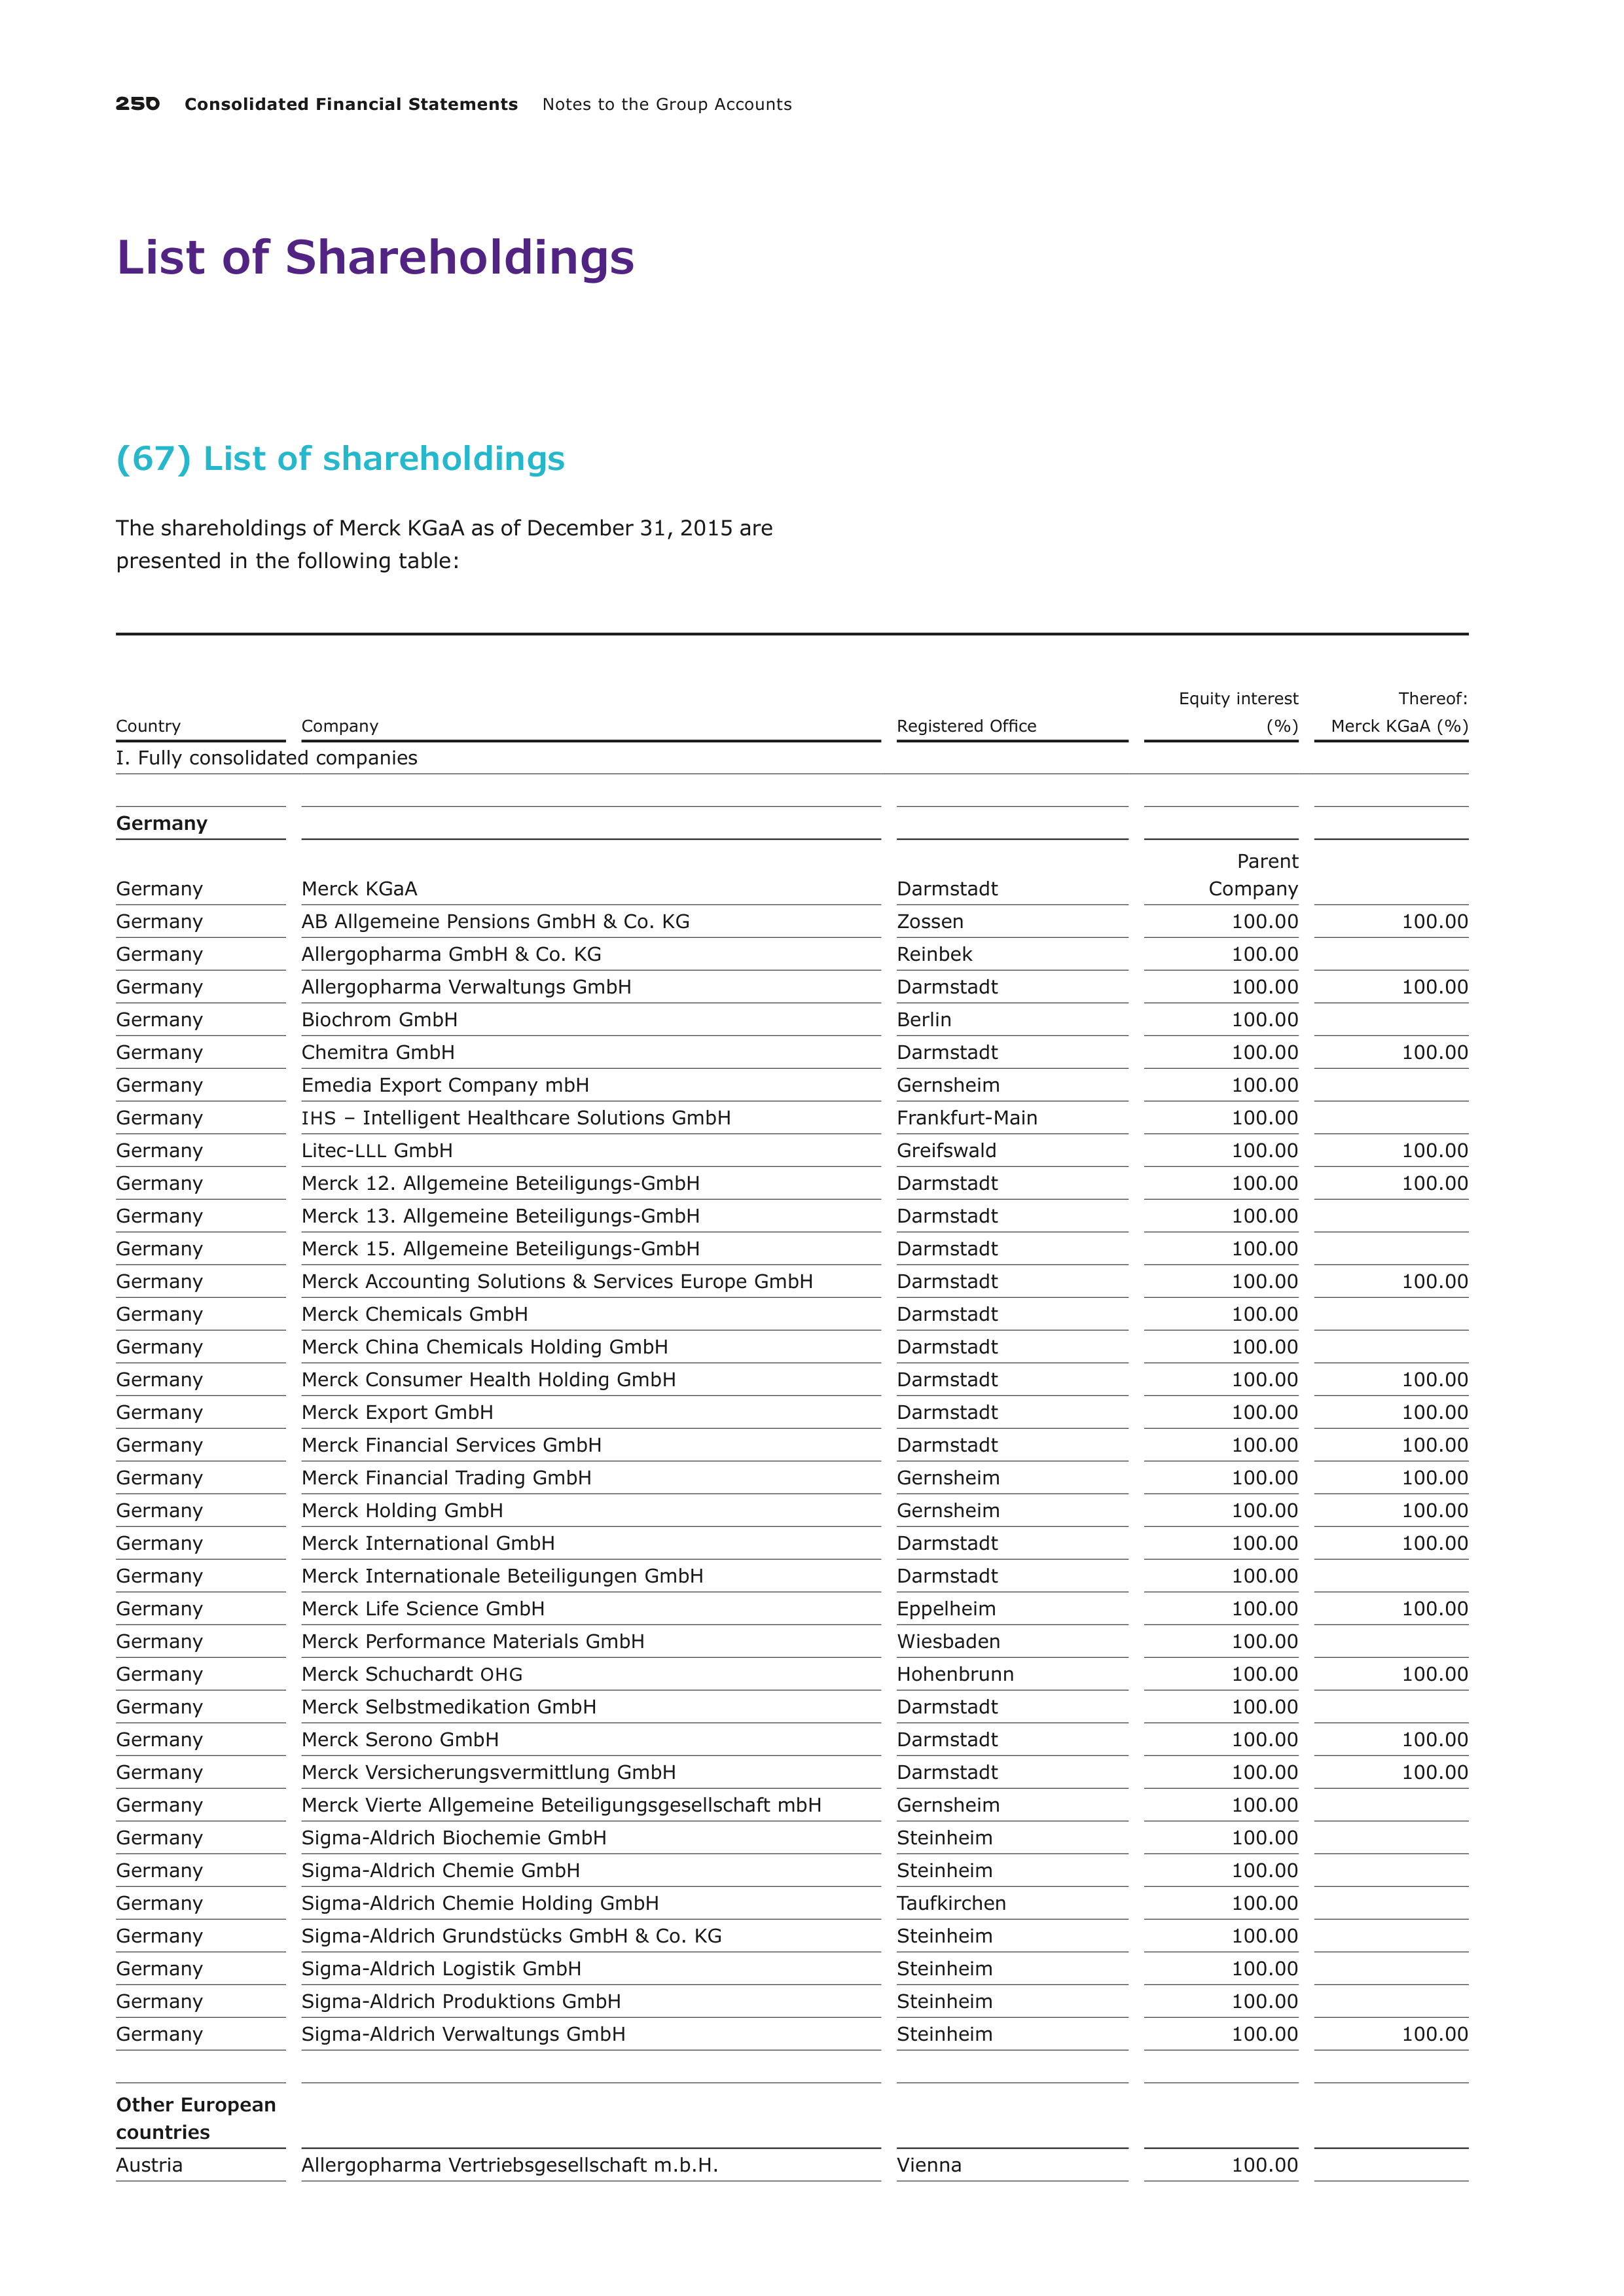
250
Consolidated Financial Statements
Notes to the Group Accounts
List of Shareholdings
(67) List of shareholdings
The shareholdings of Merck KGaA as of December 31, 2015 are
presented in the following table:
Country
Company
Registered Office
Equity interest
(%)
Thereof:
Merck KGaA (%)
I. Fully consolidated companies
Germany
Germany
Merck KGaA
Darmstadt
Parent
Company
Germany
AB Allgemeine Pensions GmbH & Co. KG
Zossen
100.00
100.00
Germany
Allergopharma GmbH & Co. KG
Reinbek
100.00
Germany
Allergopharma Verwaltungs GmbH
Darmstadt
100.00
100.00
Germany
Biochrom GmbH
Berlin
100.00
Germany
Chemitra GmbH
Darmstadt
100.00
100.00
Germany
Emedia Export Company mbH
Gernsheim
100.00
Germany
IHS
– Intelligent Healthcare Solutions GmbH
Frankfurt-Main
100.00
Germany
Litec-
LLL
GmbH
Greifswald
100.00
100.00
Germany
Merck 12. Allgemeine Beteiligungs-GmbH
Darmstadt
100.00
100.00
Germany
Merck 13. Allgemeine Beteiligungs-GmbH
Darmstadt
100.00
Germany
Merck 15. Allgemeine Beteiligungs-GmbH
Darmstadt
100.00
Germany
Merck Accounting Solutions & Services Europe GmbH
Darmstadt
100.00
100.00
Germany
Merck Chemicals GmbH
Darmstadt
100.00
Germany
Merck China Chemicals Holding GmbH
Darmstadt
100.00
Germany
Merck Consumer Health Holding GmbH
Darmstadt
100.00
100.00
Germany
Merck Export GmbH
Darmstadt
100.00
100.00
Germany
Merck Financial Services GmbH
Darmstadt
100.00
100.00
Germany
Merck Financial Trading GmbH
Gernsheim
100.00
100.00
Germany
Merck Holding GmbH
Gernsheim
100.00
100.00
Germany
Merck International GmbH
Darmstadt
100.00
100.00
Germany
Merck Internationale Beteiligungen GmbH
Darmstadt
100.00
Germany
Merck Life Science GmbH
Eppelheim
100.00
100.00
Germany
Merck Performance Materials GmbH
Wiesbaden
100.00
Germany
Merck Schuchardt
OHG
Hohenbrunn
100.00
100.00
Germany
Merck Selbstmedikation GmbH
Darmstadt
100.00
Germany
Merck Serono GmbH
Darmstadt
100.00
100.00
Germany
Merck Versicherungsvermittlung GmbH
Darmstadt
100.00
100.00
Germany
Merck Vierte Allgemeine Beteiligungsgesellschaft mbH
Gernsheim
100.00
Germany
Sigma-Aldrich Biochemie GmbH
Steinheim
100.00
Germany
Sigma-Aldrich Chemie GmbH
Steinheim
100.00
Germany
Sigma-Aldrich Chemie Holding GmbH
Taufkirchen
100.00
Germany
Sigma-Aldrich Grundstücks GmbH & Co. KG
Steinheim
100.00
Germany
Sigma-Aldrich Logistik GmbH
Steinheim
100.00
Germany
Sigma-Aldrich Produktions GmbH
Steinheim
100.00
Germany
Sigma-Aldrich Verwaltungs GmbH
Steinheim
100.00
100.00
Other European
countries
Austria
Allergopharma Vertriebsgesellschaft m.b.H.
Vienna
100.00
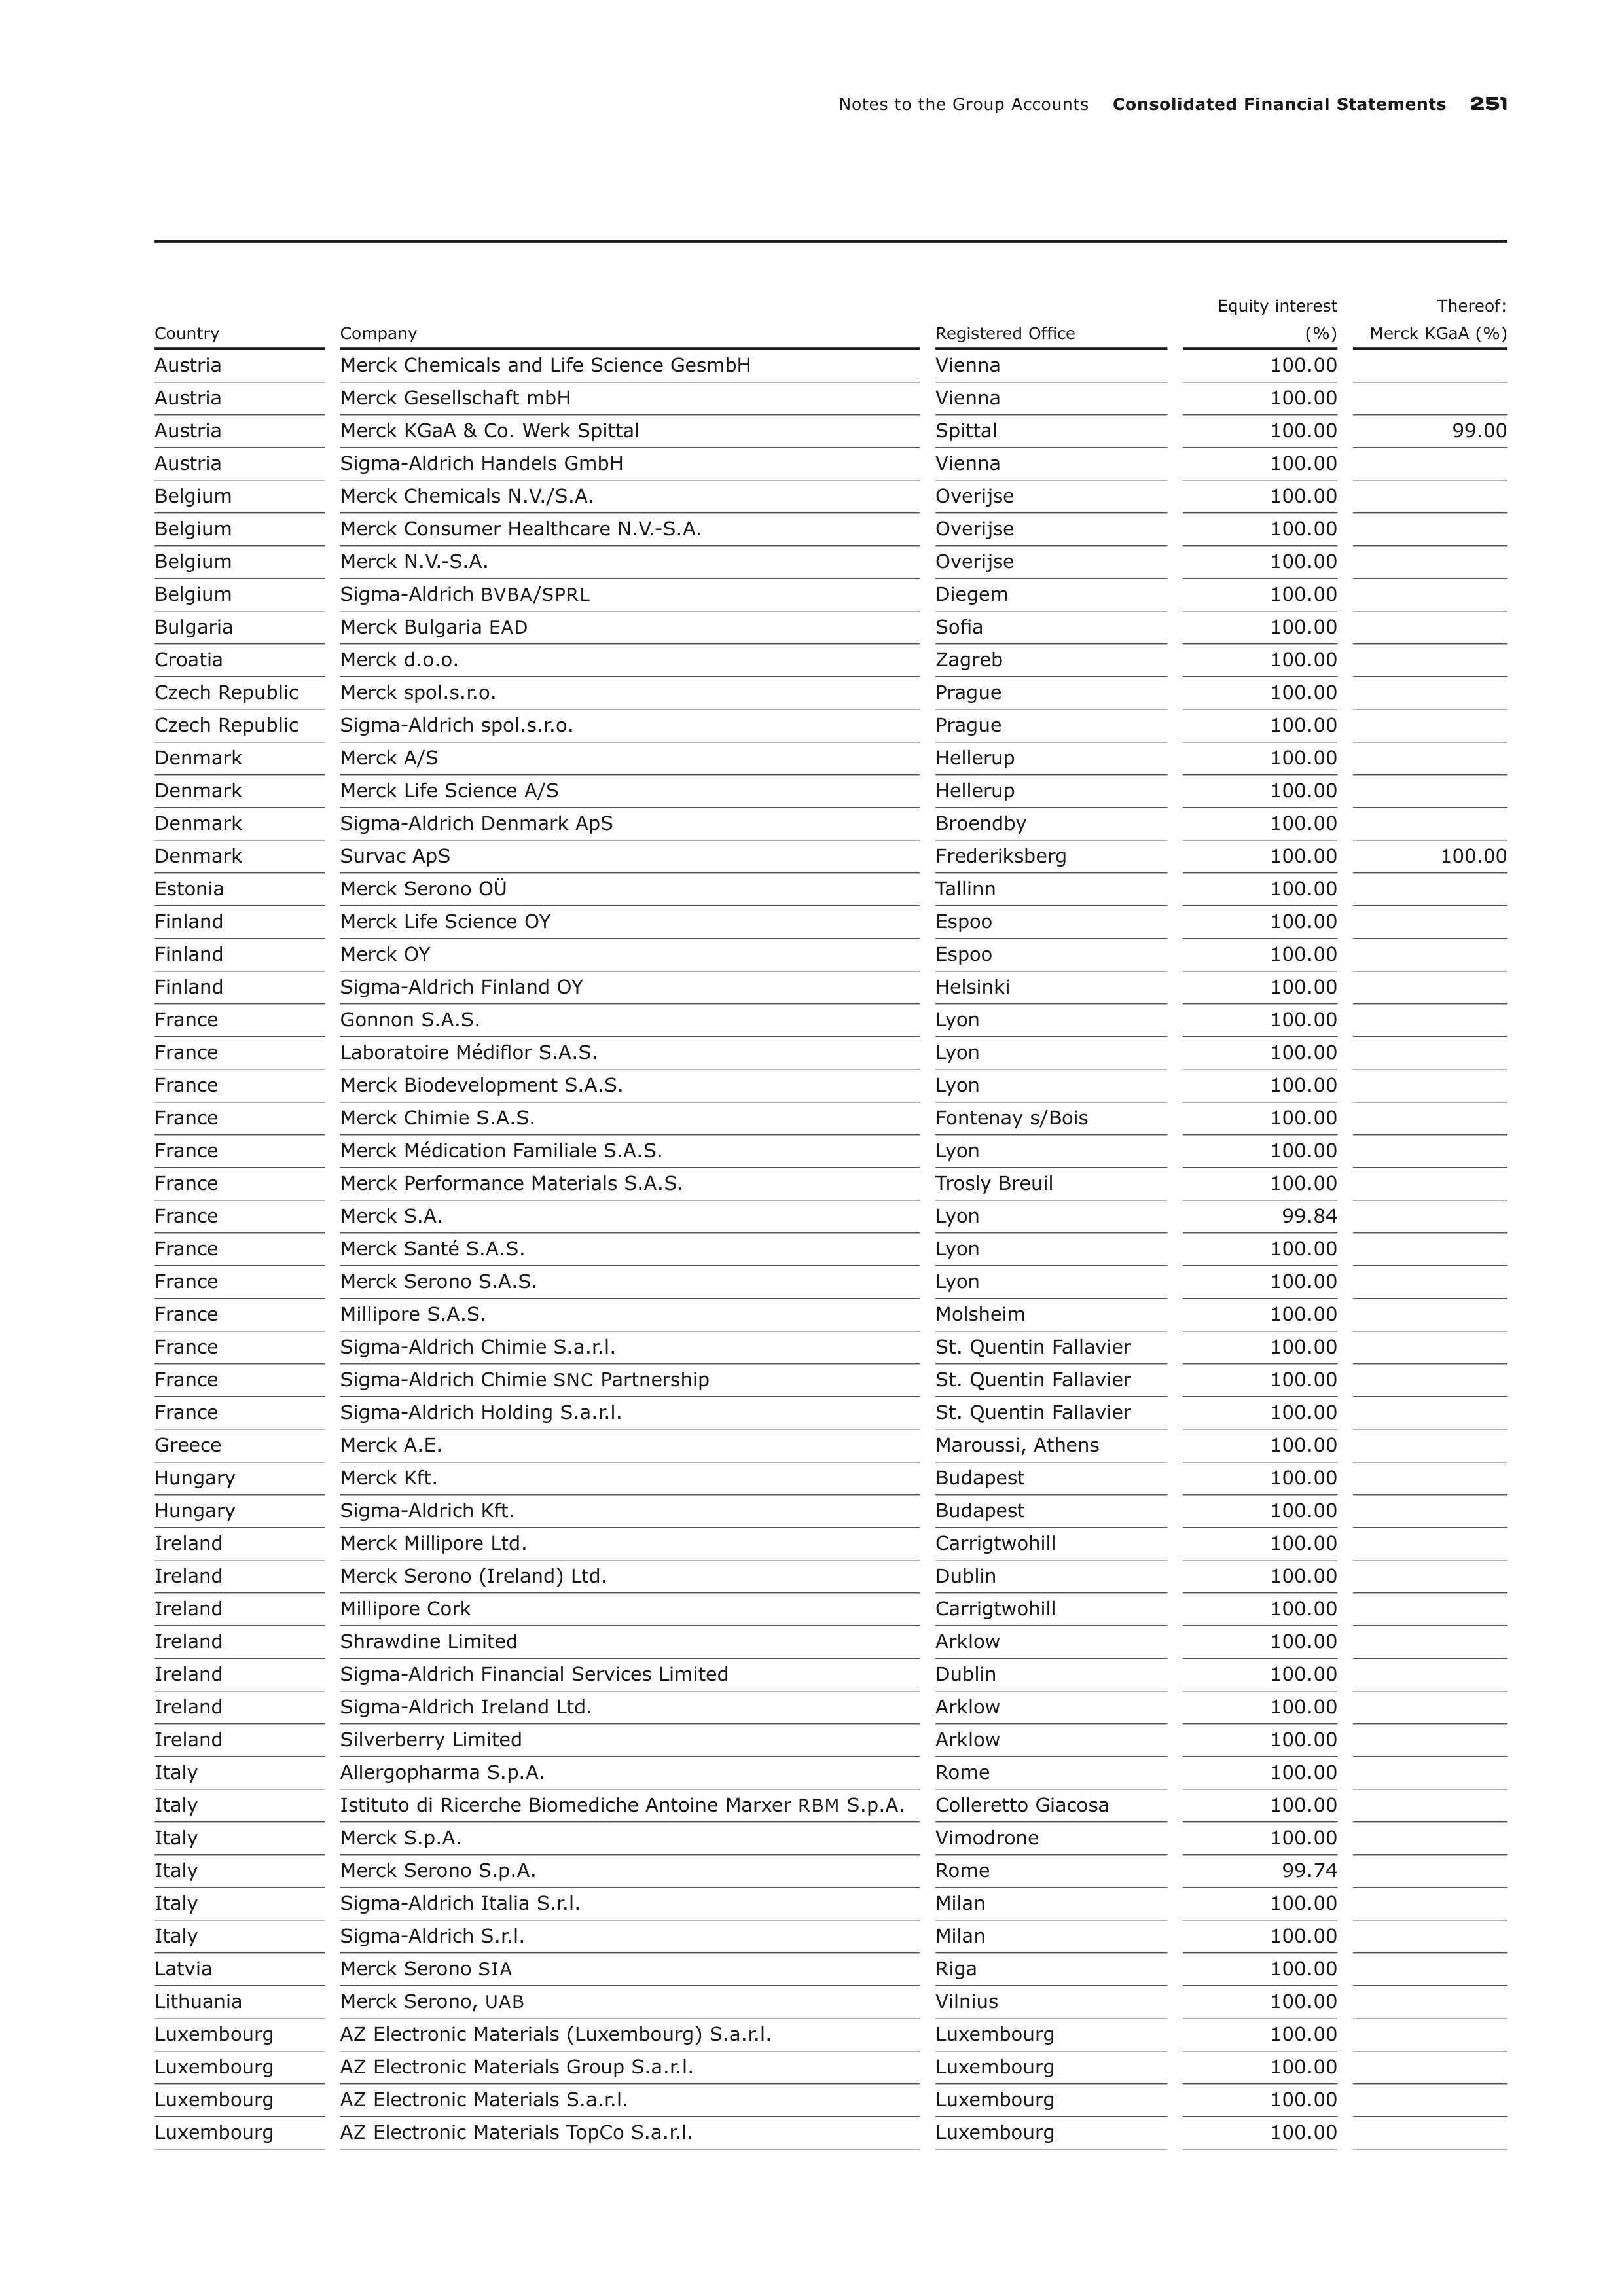
Notes to the Group Accounts
Consolidated Financial Statements
251
Country
Company
Registered Office
Equity interest
(%)
Thereof:
Merck KGaA (%)
Austria
Merck Chemicals and Life Science GesmbH
Vienna
100.00
Austria
Merck Gesellschaft mbH
Vienna
100.00
Austria
Merck KGaA & Co. Werk Spittal
Spittal
100.00
99.00
Austria
Sigma-Aldrich Handels GmbH
Vienna
100.00
Belgium
Merck Chemicals N.V./S.A.
Overijse
100.00
Belgium
Merck Consumer Healthcare N.V.-S.A.
Overijse
100.00
Belgium
Merck N.V.-S.A.
Overijse
100.00
Belgium
Sigma-Aldrich
BVBA
/
SPRL
Diegem
100.00
Bulgaria
Merck Bulgaria
EAD
Sofia
100.00
Croatia
Merck d.o.o.
Zagreb
100.00
Czech Republic
Merck spol.s.r.o.
Prague
100.00
Czech Republic
Sigma-Aldrich spol.s.r.o.
Prague
100.00
Denmark
Merck A/S
Hellerup
100.00
Denmark
Merck Life Science A/S
Hellerup
100.00
Denmark
Sigma-Aldrich Denmark ApS
Broendby
100.00
Denmark
Survac ApS
Frederiksberg
100.00
100.00
Estonia
Merck Serono OÜ
Tallinn
100.00
Finland
Merck Life Science OY
Espoo
100.00
Finland
Merck OY
Espoo
100.00
Finland
Sigma-Aldrich Finland OY
Helsinki
100.00
France
Gonnon S.A.S.
Lyon
100.00
France
Laboratoire Médiflor S.A.S.
Lyon
100.00
France
Merck Biodevelopment S.A.S.
Lyon
100.00
France
Merck Chimie S.A.S.
Fontenay s/Bois
100.00
France
Merck Médication Familiale S.A.S.
Lyon
100.00
France
Merck Performance Materials S.A.S.
Trosly Breuil
100.00
France
Merck S.A.
Lyon
99.84
France
Merck Santé S.A.S.
Lyon
100.00
France
Merck Serono S.A.S.
Lyon
100.00
France
Millipore S.A.S.
Molsheim
100.00
France
Sigma-Aldrich Chimie S.a.r.l.
St. Quentin Fallavier
100.00
France
Sigma-Aldrich Chimie
SNC
Partnership
St. Quentin Fallavier
100.00
France
Sigma-Aldrich Holding S.a.r.l.
St. Quentin Fallavier
100.00
Greece
Merck A.E.
Maroussi, Athens
100.00
Hungary
Merck Kft.
Budapest
100.00
Hungary
Sigma-Aldrich Kft.
Budapest
100.00
Ireland
Merck Millipore Ltd.
Carrigtwohill
100.00
Ireland
Merck Serono (Ireland) Ltd.
Dublin
100.00
Ireland
Millipore Cork
Carrigtwohill
100.00
Ireland
Shrawdine Limited
Arklow
100.00
Ireland
Sigma-Aldrich Financial Services Limited
Dublin
100.00
Ireland
Sigma-Aldrich Ireland Ltd.
Arklow
100.00
Ireland
Silverberry Limited
Arklow
100.00
Italy
Allergopharma S.p.A.
Rome
100.00
Italy
Istituto di Ricerche Biomediche Antoine Marxer
RBM
S.p.A.
Colleretto Giacosa
100.00
Italy
Merck S.p.A.
Vimodrone
100.00
Italy
Merck Serono S.p.A.
Rome
99.74
Italy
Sigma-Aldrich Italia S.r.l.
Milan
100.00
Italy
Sigma-Aldrich S.r.l.
Milan
100.00
Latvia
Merck Serono
SIA
Riga
100.00
Lithuania
Merck Serono,
UAB
Vilnius
100.00
Luxembourg
AZ Electronic Materials (Luxembourg) S.a.r.l.
Luxembourg
100.00
Luxembourg
AZ Electronic Materials Group S.a.r.l.
Luxembourg
100.00
Luxembourg
AZ Electronic Materials S.a.r.l.
Luxembourg
100.00
Luxembourg
AZ Electronic Materials TopCo S.a.r.l.
Luxembourg
100.00
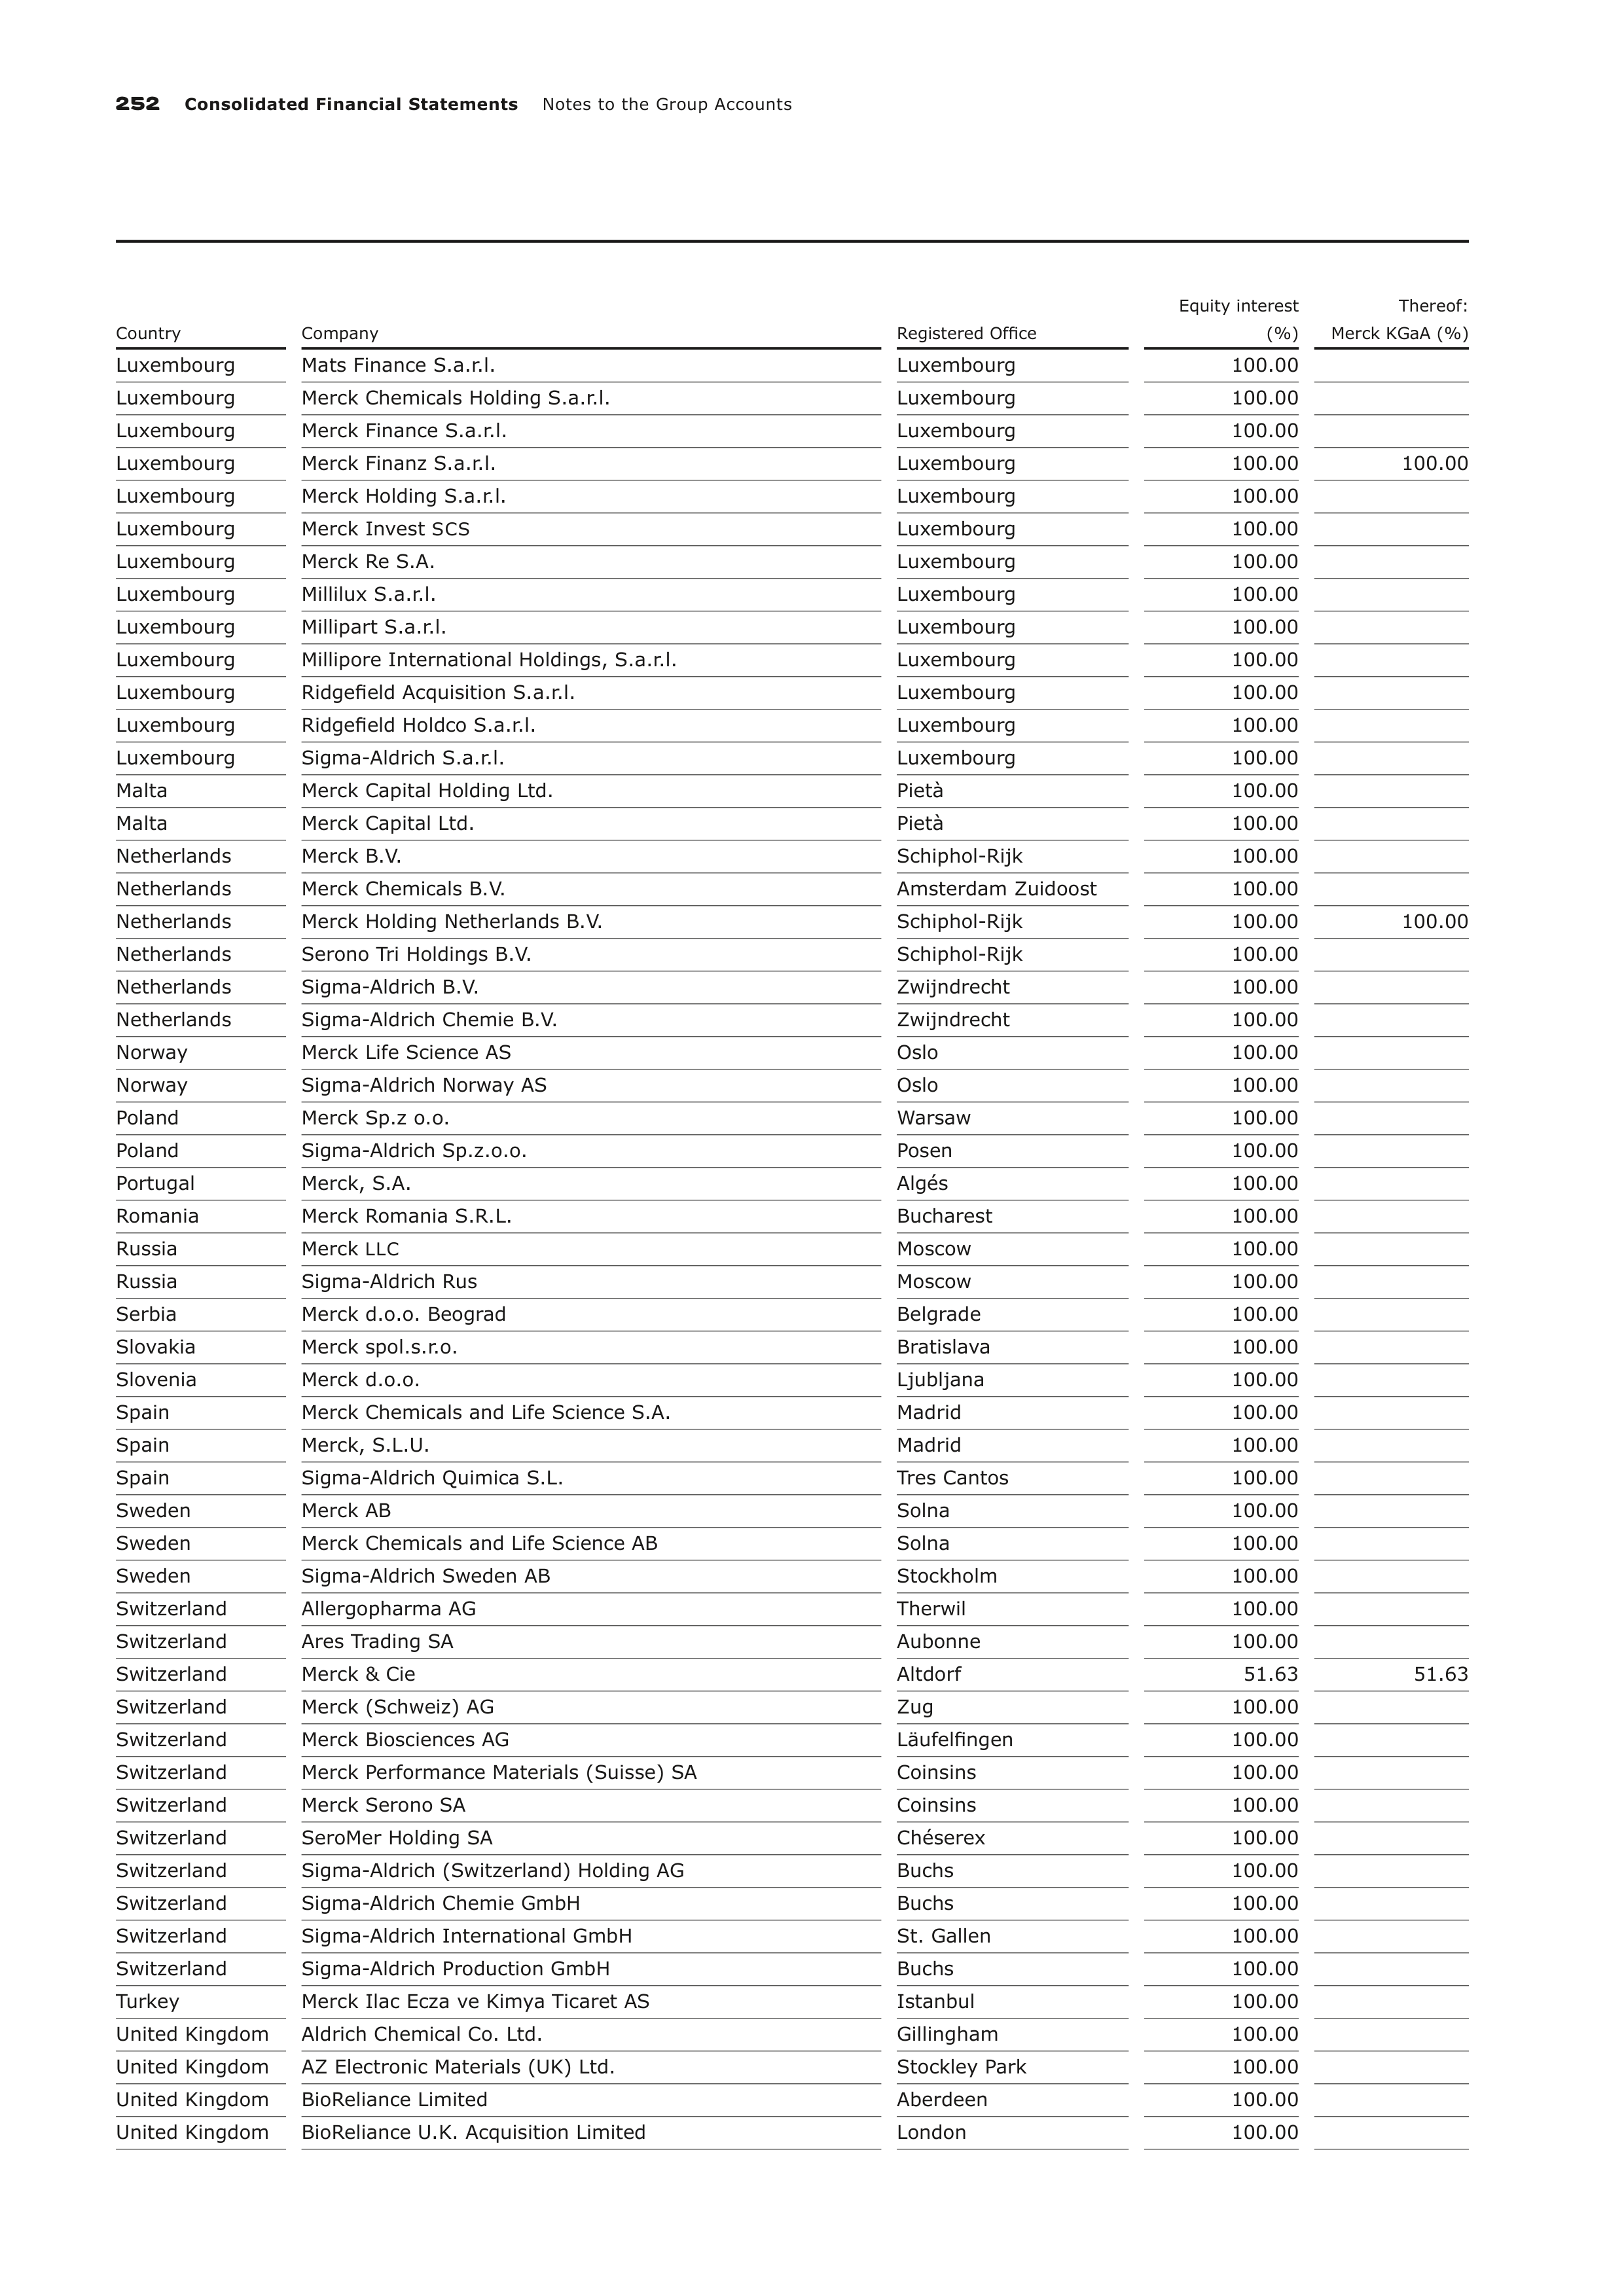
252
Consolidated Financial Statements
Notes to the Group Accounts
Country
Company
Registered Office
Equity interest
(%)
Thereof:
Merck KGaA (%)
Luxembourg
Mats Finance S.a.r.l.
Luxembourg
100.00
Luxembourg
Merck Chemicals Holding S.a.r.l.
Luxembourg
100.00
Luxembourg
Merck Finance S.a.r.l.
Luxembourg
100.00
Luxembourg
Merck Finanz S.a.r.l.
Luxembourg
100.00
100.00
Luxembourg
Merck Holding S.a.r.l.
Luxembourg
100.00
Luxembourg
Merck Invest
SCS
Luxembourg
100.00
Luxembourg
Merck Re S.A.
Luxembourg
100.00
Luxembourg
Millilux S.a.r.l.
Luxembourg
100.00
Luxembourg
Millipart S.a.r.l.
Luxembourg
100.00
Luxembourg
Millipore International Holdings, S.a.r.l.
Luxembourg
100.00
Luxembourg
Ridgefield Acquisition S.a.r.l.
Luxembourg
100.00
Luxembourg
Ridgefield Holdco S.a.r.l.
Luxembourg
100.00
Luxembourg
Sigma-Aldrich S.a.r.l.
Luxembourg
100.00
Malta
Merck Capital Holding Ltd.
Pietà
100.00
Malta
Merck Capital Ltd.
Pietà
100.00
Netherlands
Merck B.V.
Schiphol-Rijk
100.00
Netherlands
Merck Chemicals B.V.
Amsterdam Zuidoost
100.00
Netherlands
Merck Holding Netherlands B.V.
Schiphol-Rijk
100.00
100.00
Netherlands
Serono Tri Holdings B.V.
Schiphol-Rijk
100.00
Netherlands
Sigma-Aldrich B.V.
Zwijndrecht
100.00
Netherlands
Sigma-Aldrich Chemie B.V.
Zwijndrecht
100.00
Norway
Merck Life Science AS
Oslo
100.00
Norway
Sigma-Aldrich Norway AS
Oslo
100.00
Poland
Merck Sp.z o.o.
Warsaw
100.00
Poland
Sigma-Aldrich Sp.z.o.o.
Posen
100.00
Portugal
Merck, S.A.
Algés
100.00
Romania
Merck Romania S.R.L.
Bucharest
100.00
Russia
Merck
LLC
Moscow
100.00
Russia
Sigma-Aldrich Rus
Moscow
100.00
Serbia
Merck d.o.o. Beograd
Belgrade
100.00
Slovakia
Merck spol.s.r.o.
Bratislava
100.00
Slovenia
Merck d.o.o.
Ljubljana
100.00
Spain
Merck Chemicals and Life Science S.A.
Madrid
100.00
Spain
Merck, S.L.U.
Madrid
100.00
Spain
Sigma-Aldrich Quimica S.L.
Tres Cantos
100.00
Sweden
Merck AB
Solna
100.00
Sweden
Merck Chemicals and Life Science AB
Solna
100.00
Sweden
Sigma-Aldrich Sweden AB
Stockholm
100.00
Switzerland
Allergopharma AG
Therwil
100.00
Switzerland
Ares Trading SA
Aubonne
100.00
Switzerland
Merck & Cie
Altdorf
51.63
51.63
Switzerland
Merck (Schweiz) AG
Zug
100.00
Switzerland
Merck Biosciences AG
Läufelfingen
100.00
Switzerland
Merck Performance Materials (Suisse) SA
Coinsins
100.00
Switzerland
Merck Serono SA
Coinsins
100.00
Switzerland
SeroMer Holding SA
Chéserex
100.00
Switzerland
Sigma-Aldrich (Switzerland) Holding AG
Buchs
100.00
Switzerland
Sigma-Aldrich Chemie GmbH
Buchs
100.00
Switzerland
Sigma-Aldrich International GmbH
St. Gallen
100.00
Switzerland
Sigma-Aldrich Production GmbH
Buchs
100.00
Turkey
Merck Ilac Ecza ve Kimya Ticaret AS
Istanbul
100.00
United Kingdom
Aldrich Chemical Co. Ltd.
Gillingham
100.00
United Kingdom
AZ Electronic Materials (UK) Ltd.
Stockley Park
100.00
United Kingdom
BioReliance Limited
Aberdeen
100.00
United Kingdom
BioReliance U.K. Acquisition Limited
London
100.00
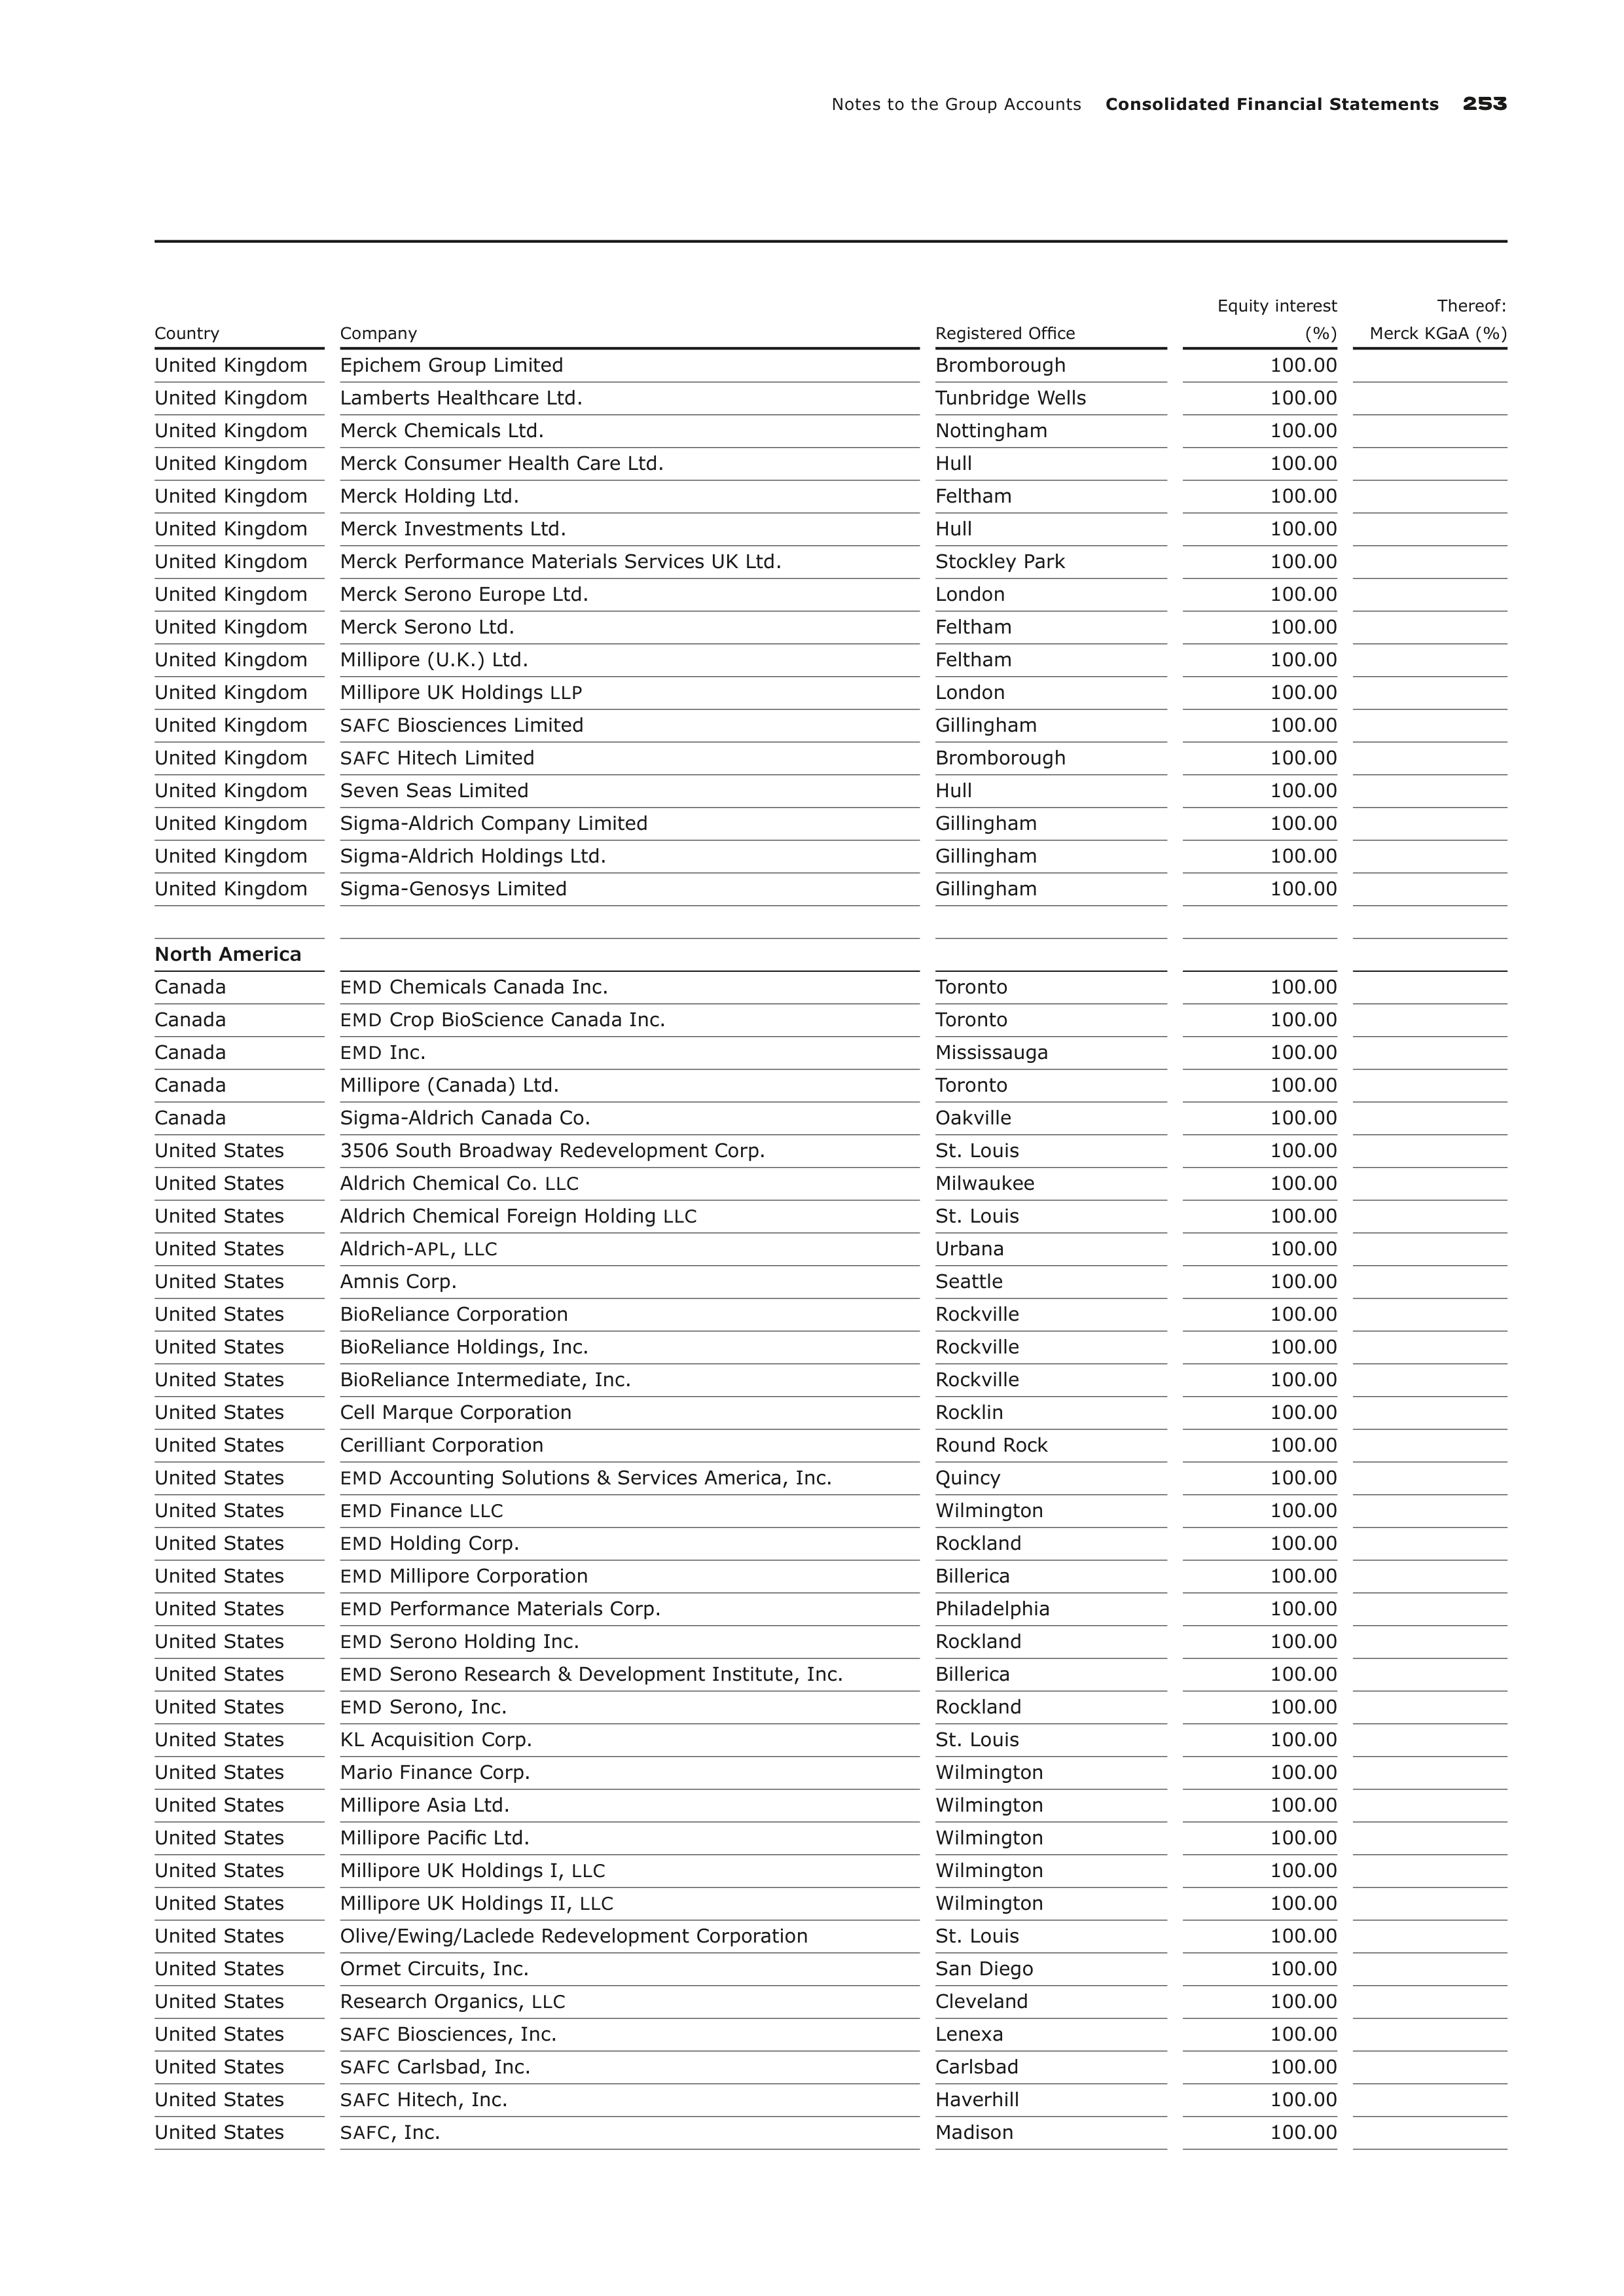
Notes to the Group Accounts
Consolidated Financial Statements
253
Country
Company
Registered Office
Equity interest
(%)
Thereof:
Merck KGaA (%)
United Kingdom
Epichem Group Limited
Bromborough
100.00
United Kingdom
Lamberts Healthcare Ltd.
Tunbridge Wells
100.00
United Kingdom
Merck Chemicals Ltd.
Nottingham
100.00
United Kingdom
Merck Consumer Health Care Ltd.
Hull
100.00
United Kingdom
Merck Holding Ltd.
Feltham
100.00
United Kingdom
Merck Investments Ltd.
Hull
100.00
United Kingdom
Merck Performance Materials Services UK Ltd.
Stockley Park
100.00
United Kingdom
Merck Serono Europe Ltd.
London
100.00
United Kingdom
Merck Serono Ltd.
Feltham
100.00
United Kingdom
Millipore (U.K.) Ltd.
Feltham
100.00
United Kingdom
Millipore UK Holdings
LLP
London
100.00
United Kingdom
SAFC
Biosciences Limited
Gillingham
100.00
United Kingdom
SAFC
Hitech Limited
Bromborough
100.00
United Kingdom
Seven Seas Limited
Hull
100.00
United Kingdom
Sigma-Aldrich Company Limited
Gillingham
100.00
United Kingdom
Sigma-Aldrich Holdings Ltd.
Gillingham
100.00
United Kingdom
Sigma-Genosys Limited
Gillingham
100.00
North America
Canada
EMD
Chemicals Canada Inc.
Toronto
100.00
Canada
EMD
Crop BioScience Canada Inc.
Toronto
100.00
Canada
EMD
Inc.
Mississauga
100.00
Canada
Millipore (Canada) Ltd.
Toronto
100.00
Canada
Sigma-Aldrich Canada Co.
Oakville
100.00
United States
3506 South Broadway Redevelopment Corp.
St. Louis
100.00
United States
Aldrich Chemical Co.
LLC
Milwaukee
100.00
United States
Aldrich Chemical Foreign Holding
LLC
St. Louis
100.00
United States
Aldrich-
APL
,
LLC
Urbana
100.00
United States
Amnis Corp.
Seattle
100.00
United States
BioReliance Corporation
Rockville
100.00
United States
BioReliance Holdings, Inc.
Rockville
100.00
United States
BioReliance Intermediate, Inc.
Rockville
100.00
United States
Cell Marque Corporation
Rocklin
100.00
United States
Cerilliant Corporation
Round Rock
100.00
United States
EMD
Accounting Solutions & Services America, Inc.
Quincy
100.00
United States
EMD
Finance
LLC
Wilmington
100.00
United States
EMD
Holding Corp.
Rockland
100.00
United States
EMD
Millipore Corporation
Billerica
100.00
United States
EMD
Performance Materials Corp.
Philadelphia
100.00
United States
EMD
Serono Holding Inc.
Rockland
100.00
United States
EMD
Serono Research & Development Institute, Inc.
Billerica
100.00
United States
EMD
Serono, Inc.
Rockland
100.00
United States
KL Acquisition Corp.
St. Louis
100.00
United States
Mario Finance Corp.
Wilmington
100.00
United States
Millipore Asia Ltd.
Wilmington
100.00
United States
Millipore Pacific Ltd.
Wilmington
100.00
United States
Millipore UK Holdings I,
LLC
Wilmington
100.00
United States
Millipore UK Holdings II,
LLC
Wilmington
100.00
United States
Olive/Ewing/Laclede Redevelopment Corporation
St. Louis
100.00
United States
Ormet Circuits, Inc.
San Diego
100.00
United States
Research Organics,
LLC
Cleveland
100.00
United States
SAFC
Biosciences, Inc.
Lenexa
100.00
United States
SAFC
Carlsbad, Inc.
Carlsbad
100.00
United States
SAFC
Hitech, Inc.
Haverhill
100.00
United States
SAFC
, Inc.
Madison
100.00
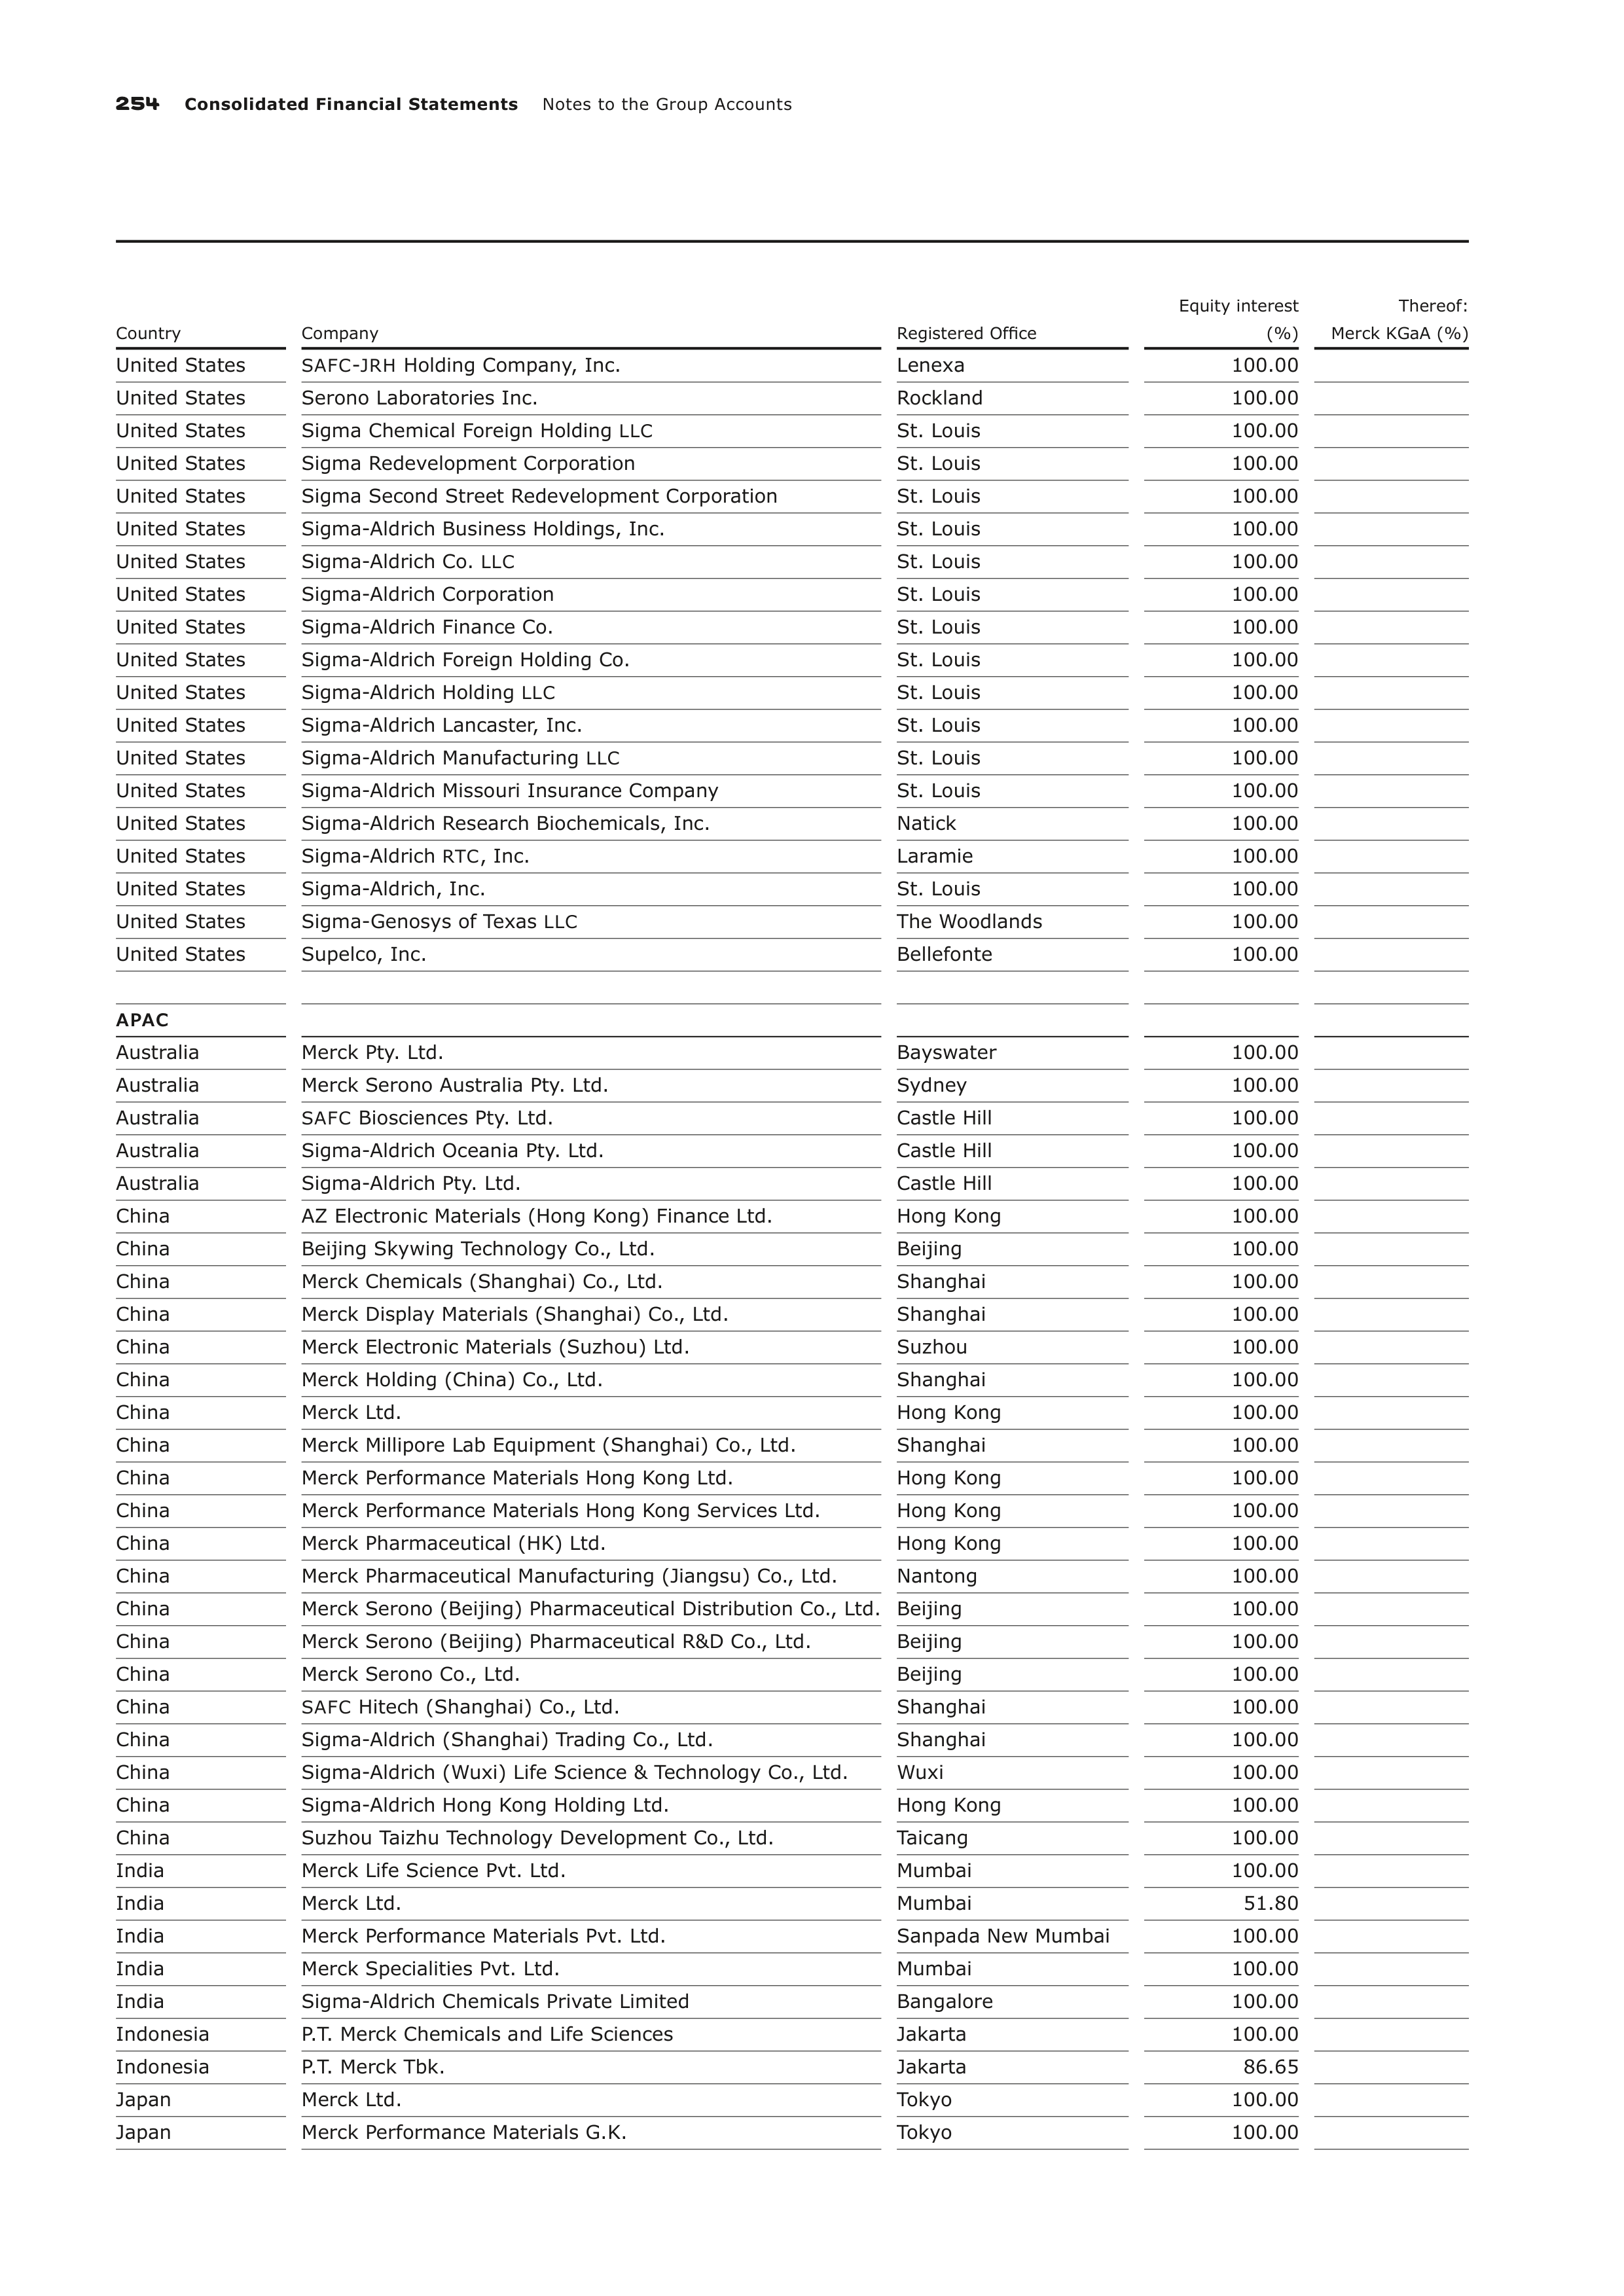
254
Consolidated Financial Statements
Notes to the Group Accounts
Country
Company
Registered Office
Equity interest
(%)
Thereof:
Merck KGaA (%)
United States
SAFC
-
JRH
Holding Company, Inc.
Lenexa
100.00
United States
Serono Laboratories Inc.
Rockland
100.00
United States
Sigma Chemical Foreign Holding
LLC
St. Louis
100.00
United States
Sigma Redevelopment Corporation
St. Louis
100.00
United States
Sigma Second Street Redevelopment Corporation
St. Louis
100.00
United States
Sigma-Aldrich Business Holdings, Inc.
St. Louis
100.00
United States
Sigma-Aldrich Co.
LLC
St. Louis
100.00
United States
Sigma-Aldrich Corporation
St. Louis
100.00
United States
Sigma-Aldrich Finance Co.
St. Louis
100.00
United States
Sigma-Aldrich Foreign Holding Co.
St. Louis
100.00
United States
Sigma-Aldrich Holding
LLC
St. Louis
100.00
United States
Sigma-Aldrich Lancaster, Inc.
St. Louis
100.00
United States
Sigma-Aldrich Manufacturing
LLC
St. Louis
100.00
United States
Sigma-Aldrich Missouri Insurance Company
St. Louis
100.00
United States
Sigma-Aldrich Research Biochemicals, Inc.
Natick
100.00
United States
Sigma-Aldrich
RTC
, Inc.
Laramie
100.00
United States
Sigma-Aldrich, Inc.
St. Louis
100.00
United States
Sigma-Genosys of Texas
LLC
The Woodlands
100.00
United States
Supelco, Inc.
Bellefonte
100.00
APAC
Australia
Merck Pty. Ltd.
Bayswater
100.00
Australia
Merck Serono Australia Pty. Ltd.
Sydney
100.00
Australia
SAFC
Biosciences Pty. Ltd.
Castle Hill
100.00
Australia
Sigma-Aldrich Oceania Pty. Ltd.
Castle Hill
100.00
Australia
Sigma-Aldrich Pty. Ltd.
Castle Hill
100.00
China
AZ Electronic Materials (Hong Kong) Finance Ltd.
Hong Kong
100.00
China
Beijing Skywing Technology Co., Ltd.
Beijing
100.00
China
Merck Chemicals (Shanghai) Co., Ltd.
Shanghai
100.00
China
Merck Display Materials (Shanghai) Co., Ltd.
Shanghai
100.00
China
Merck Electronic Materials (Suzhou) Ltd.
Suzhou
100.00
China
Merck Holding (China) Co., Ltd.
Shanghai
100.00
China
Merck Ltd.
Hong Kong
100.00
China
Merck Millipore Lab Equipment (Shanghai) Co., Ltd.
Shanghai
100.00
China
Merck Performance Materials Hong Kong Ltd.
Hong Kong
100.00
China
Merck Performance Materials Hong Kong Services Ltd.
Hong Kong
100.00
China
Merck Pharmaceutical (HK) Ltd.
Hong Kong
100.00
China
Merck Pharmaceutical Manufacturing (Jiangsu) Co., Ltd.
Nantong
100.00
China
Merck Serono (Beijing) Pharmaceutical Distribution Co., Ltd.
Beijing
100.00
China
Merck Serono (Beijing) Pharmaceutical R&D Co., Ltd.
Beijing
100.00
China
Merck Serono Co., Ltd.
Beijing
100.00
China
SAFC
Hitech (Shanghai) Co., Ltd.
Shanghai
100.00
China
Sigma-Aldrich (Shanghai) Trading Co., Ltd.
Shanghai
100.00
China
Sigma-Aldrich (Wuxi) Life Science & Technology Co., Ltd.
Wuxi
100.00
China
Sigma-Aldrich Hong Kong Holding Ltd.
Hong Kong
100.00
China
Suzhou Taizhu Technology Development Co., Ltd.
Taicang
100.00
India
Merck Life Science Pvt. Ltd.
Mumbai
100.00
India
Merck Ltd.
Mumbai
51.80
India
Merck Performance Materials Pvt. Ltd.
Sanpada New Mumbai
100.00
India
Merck Specialities Pvt. Ltd.
Mumbai
100.00
India
Sigma-Aldrich Chemicals Private Limited
Bangalore
100.00
Indonesia
P.T. Merck Chemicals and Life Sciences
Jakarta
100.00
Indonesia
P.T. Merck Tbk.
Jakarta
86.65
Japan
Merck Ltd.
Tokyo
100.00
Japan
Merck Performance Materials G.K.
Tokyo
100.00
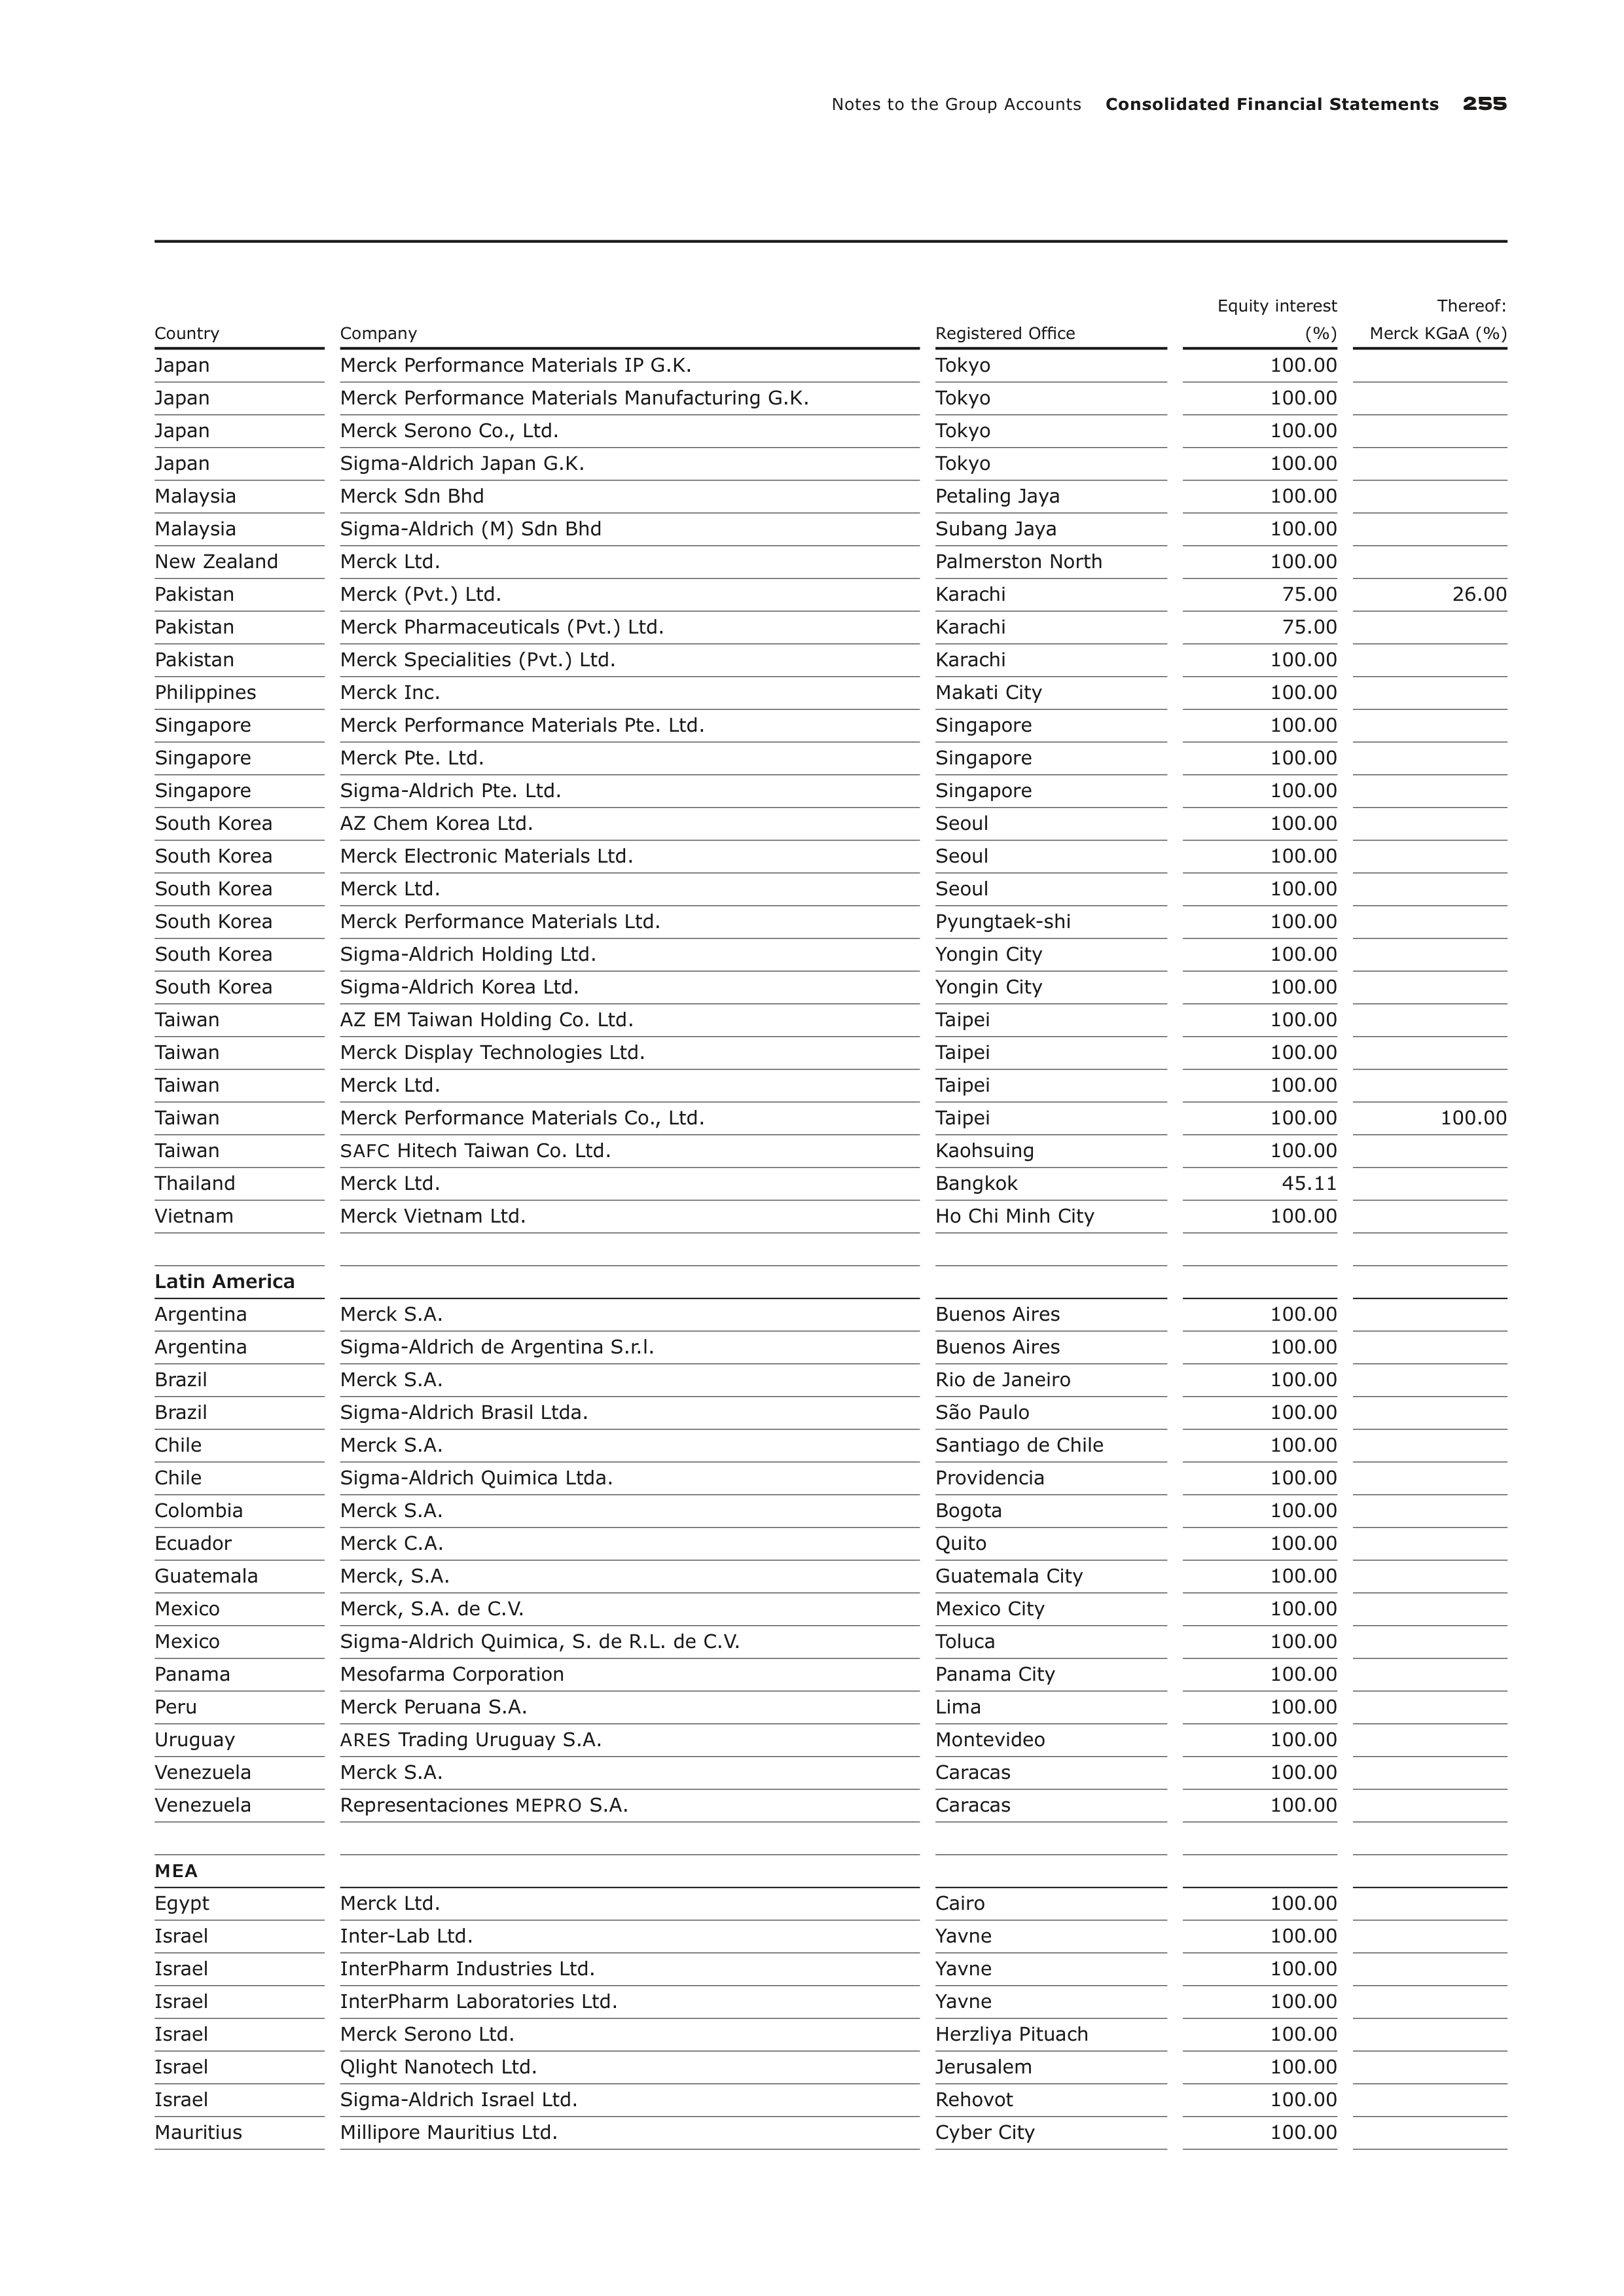
Notes to the Group Accounts
Consolidated Financial Statements
255
Country
Company
Registered Office
Equity interest
(%)
Thereof:
Merck KGaA (%)
Japan
Merck Performance Materials IP G.K.
Tokyo
100.00
Japan
Merck Performance Materials Manufacturing G.K.
Tokyo
100.00
Japan
Merck Serono Co., Ltd.
Tokyo
100.00
Japan
Sigma-Aldrich Japan G.K.
Tokyo
100.00
Malaysia
Merck Sdn Bhd
Petaling Jaya
100.00
Malaysia
Sigma-Aldrich (M) Sdn Bhd
Subang Jaya
100.00
New Zealand
Merck Ltd.
Palmerston North
100.00
Pakistan
Merck (Pvt.) Ltd.
Karachi
75.00
26.00
Pakistan
Merck Pharmaceuticals (Pvt.) Ltd.
Karachi
75.00
Pakistan
Merck Specialities (Pvt.) Ltd.
Karachi
100.00
Philippines
Merck Inc.
Makati City
100.00
Singapore
Merck Performance Materials Pte. Ltd.
Singapore
100.00
Singapore
Merck Pte. Ltd.
Singapore
100.00
Singapore
Sigma-Aldrich Pte. Ltd.
Singapore
100.00
South Korea
AZ Chem Korea Ltd.
Seoul
100.00
South Korea
Merck Electronic Materials Ltd.
Seoul
100.00
South Korea
Merck Ltd.
Seoul
100.00
South Korea
Merck Performance Materials Ltd.
Pyungtaek-shi
100.00
South Korea
Sigma-Aldrich Holding Ltd.
Yongin City
100.00
South Korea
Sigma-Aldrich Korea Ltd.
Yongin City
100.00
Taiwan
AZ EM Taiwan Holding Co. Ltd.
Taipei
100.00
Taiwan
Merck Display Technologies Ltd.
Taipei
100.00
Taiwan
Merck Ltd.
Taipei
100.00
Taiwan
Merck Performance Materials Co., Ltd.
Taipei
100.00
100.00
Taiwan
SAFC
Hitech Taiwan Co. Ltd.
Kaohsuing
100.00
Thailand
Merck Ltd.
Bangkok
45.11
Vietnam
Merck Vietnam Ltd.
Ho Chi Minh City
100.00
Latin America
Argentina
Merck S.A.
Buenos Aires
100.00
Argentina
Sigma-Aldrich de Argentina S.r.l.
Buenos Aires
100.00
Brazil
Merck S.A.
Rio de Janeiro
100.00
Brazil
Sigma-Aldrich Brasil Ltda.
São Paulo
100.00
Chile
Merck S.A.
Santiago de Chile
100.00
Chile
Sigma-Aldrich Quimica Ltda.
Providencia
100.00
Colombia
Merck S.A.
Bogota
100.00
Ecuador
Merck C.A.
Quito
100.00
Guatemala
Merck, S.A.
Guatemala City
100.00
Mexico
Merck, S.A. de C.V.
Mexico City
100.00
Mexico
Sigma-Aldrich Quimica, S. de R.L. de C.V.
Toluca
100.00
Panama
Mesofarma Corporation
Panama City
100.00
Peru
Merck Peruana S.A.
Lima
100.00
Uruguay
ARES
Trading Uruguay S.A.
Montevideo
100.00
Venezuela
Merck S.A.
Caracas
100.00
Venezuela
Representaciones
MEPRO
S.A.
Caracas
100.00
MEA
Egypt
Merck Ltd.
Cairo
100.00
Israel
Inter-Lab Ltd.
Yavne
100.00
Israel
InterPharm Industries Ltd.
Yavne
100.00
Israel
InterPharm Laboratories Ltd.
Yavne
100.00
Israel
Merck Serono Ltd.
Herzliya Pituach
100.00
Israel
Qlight Nanotech Ltd.
Jerusalem
100.00
Israel
Sigma-Aldrich Israel Ltd.
Rehovot
100.00
Mauritius
Millipore Mauritius Ltd.
Cyber City
100.00
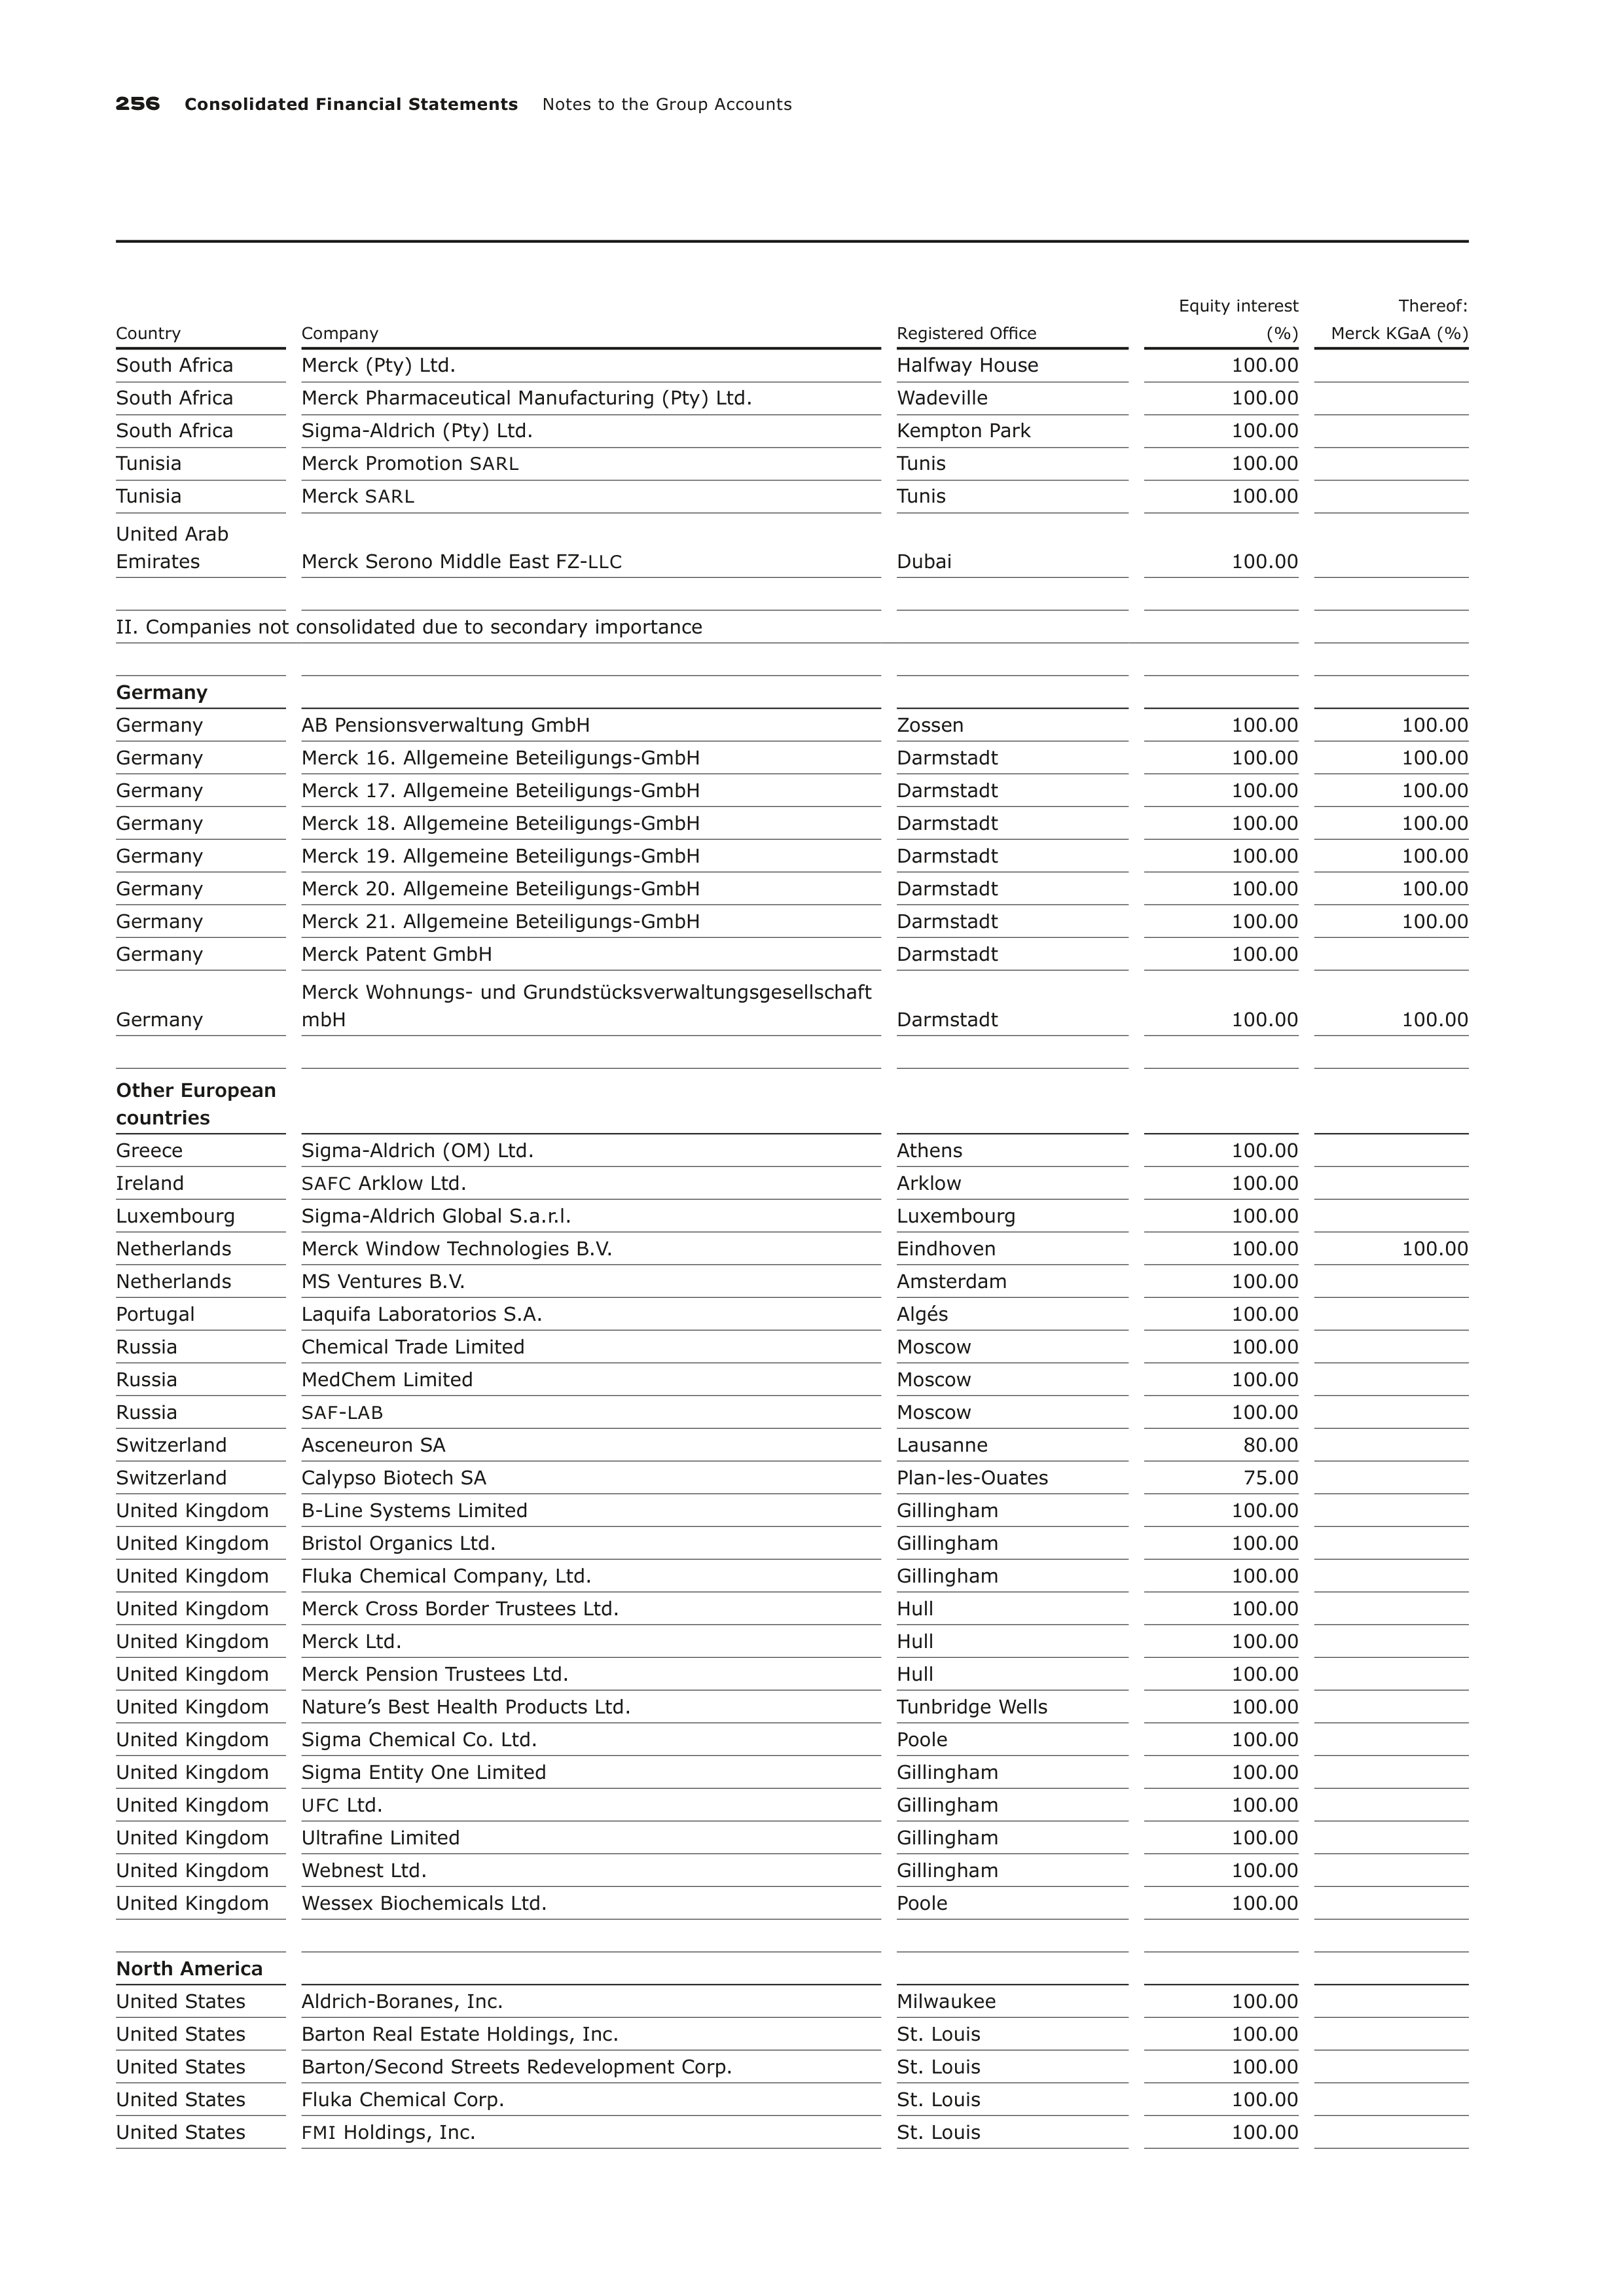
256
Consolidated Financial Statements
Notes to the Group Accounts
Country
Company
Registered Office
Equity interest
(%)
Thereof:
Merck KGaA (%)
South Africa
Merck (Pty) Ltd.
Halfway House
100.00
South Africa
Merck Pharmaceutical Manufacturing (Pty) Ltd.
Wadeville
100.00
South Africa
Sigma-Aldrich (Pty) Ltd.
Kempton Park
100.00
Tunisia
Merck Promotion
SARL
Tunis
100.00
Tunisia
Merck
SARL
Tunis
100.00
United Arab
Emirates
Merck Serono Middle East FZ-
LLC
Dubai
100.00
II. Companies not consolidated due to secondary importance
Germany
Germany
AB Pensionsverwaltung GmbH
Zossen
100.00
100.00
Germany
Merck 16. Allgemeine Beteiligungs-GmbH
Darmstadt
100.00
100.00
Germany
Merck 17. Allgemeine Beteiligungs-GmbH
Darmstadt
100.00
100.00
Germany
Merck 18. Allgemeine Beteiligungs-GmbH
Darmstadt
100.00
100.00
Germany
Merck 19. Allgemeine Beteiligungs-GmbH
Darmstadt
100.00
100.00
Germany
Merck 20. Allgemeine Beteiligungs-GmbH
Darmstadt
100.00
100.00
Germany
Merck 21. Allgemeine Beteiligungs-GmbH
Darmstadt
100.00
100.00
Germany
Merck Patent GmbH
Darmstadt
100.00
Germany
Merck Wohnungs- und Grundstücksverwaltungsgesellschaft
mbH
Darmstadt
100.00
100.00
Other European
countries
Greece
Sigma-Aldrich (OM) Ltd.
Athens
100.00
Ireland
SAFC
Arklow Ltd.
Arklow
100.00
Luxembourg
Sigma-Aldrich Global S.a.r.l.
Luxembourg
100.00
Netherlands
Merck Window Technologies B.V.
Eindhoven
100.00
100.00
Netherlands
MS Ventures B.V.
Amsterdam
100.00
Portugal
Laquifa Laboratorios S.A.
Algés
100.00
Russia
Chemical Trade Limited
Moscow
100.00
Russia
MedChem Limited
Moscow
100.00
Russia
SAF
-
LAB
Moscow
100.00
Switzerland
Asceneuron SA
Lausanne
80.00
Switzerland
Calypso Biotech SA
Plan-les-Ouates
75.00
United Kingdom
B-Line Systems Limited
Gillingham
100.00
United Kingdom
Bristol Organics Ltd.
Gillingham
100.00
United Kingdom
Fluka Chemical Company, Ltd.
Gillingham
100.00
United Kingdom
Merck Cross Border Trustees Ltd.
Hull
100.00
United Kingdom
Merck Ltd.
Hull
100.00
United Kingdom
Merck Pension Trustees Ltd.
Hull
100.00
United Kingdom
Nature’s Best Health Products Ltd.
Tunbridge Wells
100.00
United Kingdom
Sigma Chemical Co. Ltd.
Poole
100.00
United Kingdom
Sigma Entity One Limited
Gillingham
100.00
United Kingdom
UFC
Ltd.
Gillingham
100.00
United Kingdom
Ultrafine Limited
Gillingham
100.00
United Kingdom
Webnest Ltd.
Gillingham
100.00
United Kingdom
Wessex Biochemicals Ltd.
Poole
100.00
North America
United States
Aldrich-Boranes, Inc.
Milwaukee
100.00
United States
Barton Real Estate Holdings, Inc.
St. Louis
100.00
United States
Barton/Second Streets Redevelopment Corp.
St. Louis
100.00
United States
Fluka Chemical Corp.
St. Louis
100.00
United States
FMI
Holdings, Inc.
St. Louis
100.00
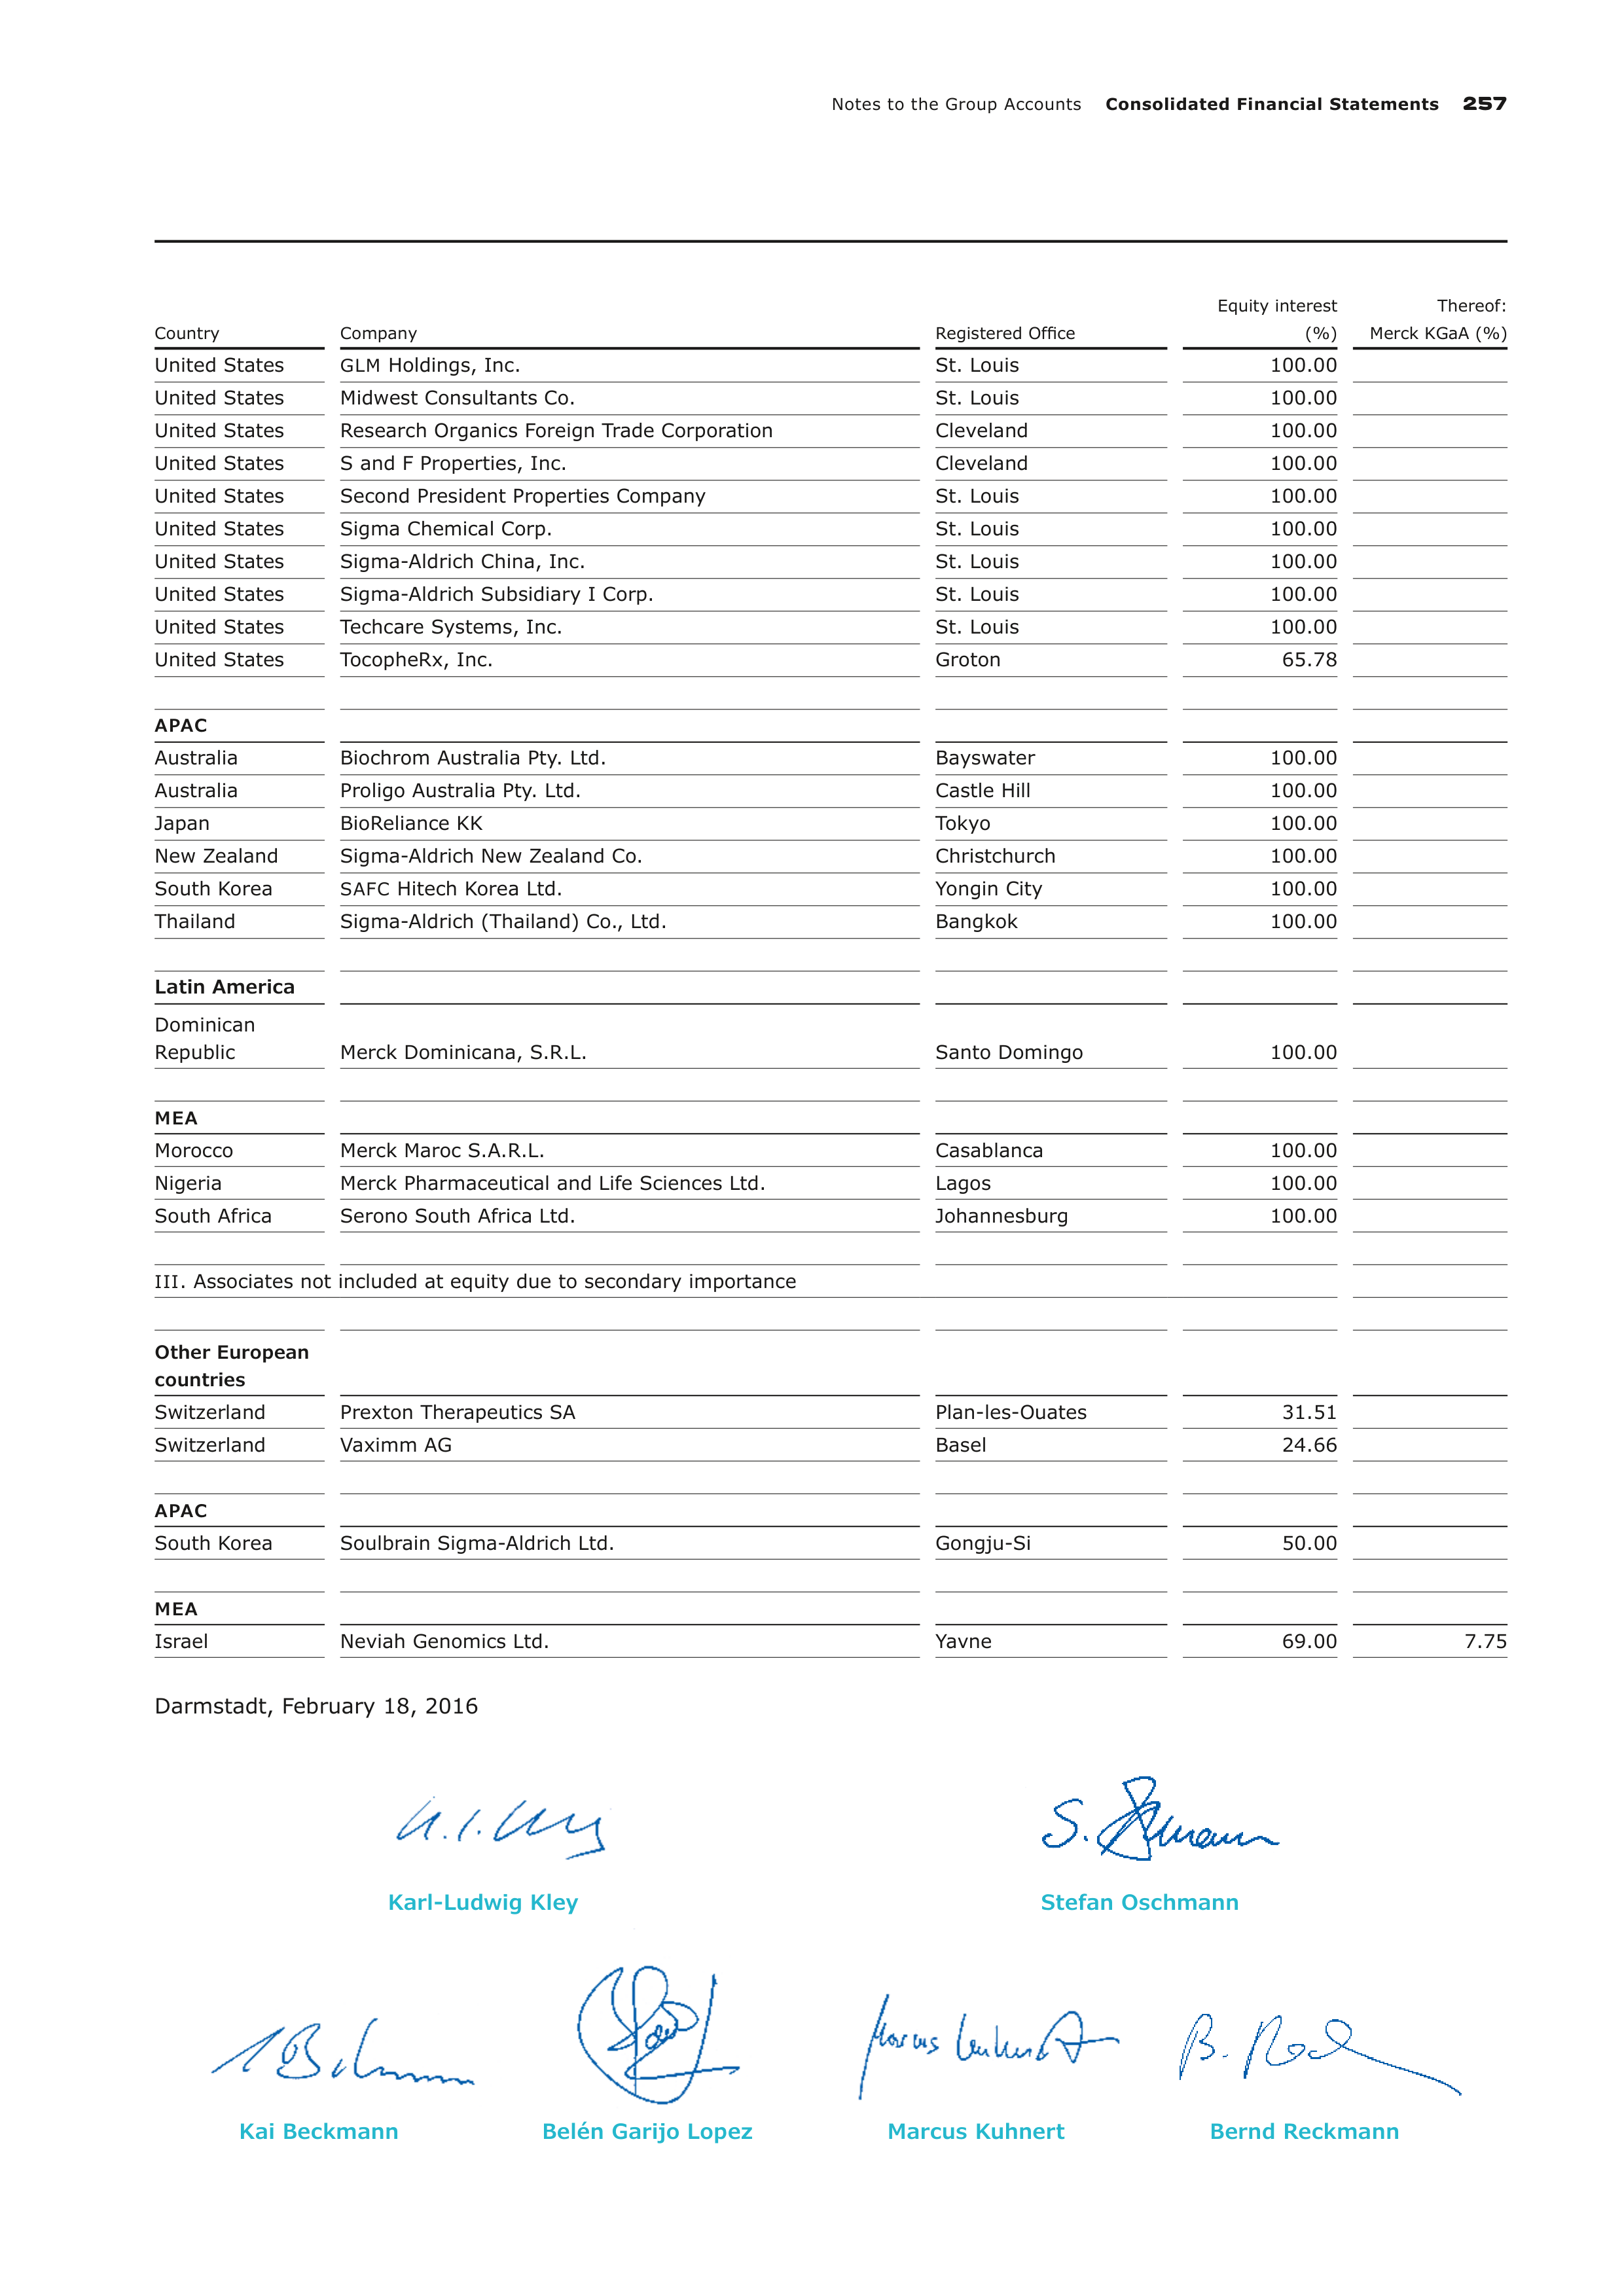
Notes to the Group Accounts
Consolidated Financial Statements
257
Country
Company
Registered Office
Equity interest
(%)
Thereof:
Merck KGaA (%)
United States
GLM
Holdings, Inc.
St. Louis
100.00
United States
Midwest Consultants Co.
St. Louis
100.00
United States
Research Organics Foreign Trade Corporation
Cleveland
100.00
United States
S and F Properties, Inc.
Cleveland
100.00
United States
Second President Properties Company
St. Louis
100.00
United States
Sigma Chemical Corp.
St. Louis
100.00
United States
Sigma-Aldrich China, Inc.
St. Louis
100.00
United States
Sigma-Aldrich Subsidiary I Corp.
St. Louis
100.00
United States
Techcare Systems, Inc.
St. Louis
100.00
United States
TocopheRx, Inc.
Groton
65.78
APAC
Australia
Biochrom Australia Pty. Ltd.
Bayswater
100.00
Australia
Proligo Australia Pty. Ltd.
Castle Hill
100.00
Japan
BioReliance KK
Tokyo
100.00
New Zealand
Sigma-Aldrich New Zealand Co.
Christchurch
100.00
South Korea
SAFC
Hitech Korea Ltd.
Yongin City
100.00
Thailand
Sigma-Aldrich (Thailand) Co., Ltd.
Bangkok
100.00
Latin America
Dominican
Republic
Merck Dominicana, S.R.L.
Santo Domingo
100.00
MEA
Morocco
Merck Maroc S.A.R.L.
Casablanca
100.00
Nigeria
Merck Pharmaceutical and Life Sciences Ltd.
Lagos
100.00
South Africa
Serono South Africa Ltd.
Johannesburg
100.00
III
. Associates not included at equity due to secondary importance
Other European
countries
Switzerland
Prexton Therapeutics SA
Plan-les-Ouates
31.51
Switzerland
Vaximm AG
Basel
24.66
APAC
South Korea
Soulbrain Sigma-Aldrich Ltd.
Gongju-Si
50.00
MEA
Israel
Neviah Genomics Ltd.
Yavne
69.00
7.75
Darmstadt, February 18, 2016
Karl-Ludwig Kley
Stefan Oschmann
Kai Beckmann
Belén Garijo Lopez
Marcus Kuhnert
Bernd Reckmann
258
Responsibility Statement
RESPONSIBILITY STATEMENT
To the best of our knowledge, and in accordance with the applicable reporting principles, the consolidated financial statements
of the Merck Group give a true and fair view of the assets, liabilities, financial position and profit or loss of the Group, and the
combined management report includes a fair review of the development and performance of the business and the position of
the
Group, together with a description of the material opportunities and risks associated with the expected development of the
Group.
Darmstadt, February 18, 2016
Karl-Ludwig Kley
Stefan Oschmann
Kai Beckmann
Belén Garijo Lopez
Marcus Kuhnert
Bernd Reckmann
Auditor’s Report
259
AUDITOR’S REPORT
We have audited the consolidated financial statements prepared by MERCK Kommanditgesellschaft auf Aktien, Darmstadt, com-
prising the Consolidated Income Statement, the Consolidated Statement of Comprehensive Income, the Consolidated Balance
Sheet, the Consolidated Cash Flow Statement, the Consolidated Statement of Changes in Net Equity, and the Notes to the Group
accounts, together with the Combined Management Report for the business year from January 1 to December 31, 2015. The
preparation of the consolidated financial statements and the Combined Management Report in accordance with IFRSs, as adopt-
ed by the EU, and the additional requirements of German commercial law pursuant to § 315a (1) HGB [Handelsgesetzbuch
‟German Commercial Code”] and supplementary provisions of the articles of association are the responsibility of the parent
company`s management. Our responsibility is to express an opinion on the consolidated financial statements and on the
Combined Management Report based on our audit.
We conducted our audit of the consolidated financial statements in accordance with § 317 HGB [Handelsgesetzbuch ‟German
Commercial Code”] and German generally accepted standards for the audit of financial statements promulgated by the Institut
der Wirtschaftsprüfer [Institute of Public Auditors in Germany] (IDW). Those standards require that we plan and perform the
audit such that misstatements materially affecting the presentation of the net assets, financial position and results of operations
in the consolidated financial statements in accordance with the applicable financial reporting framework and in the Combined
Management Report are detected with reasonable assurance. Knowledge of the business activities and the economic and legal
environment of the Group and expectations as to possible misstatements are taken into account in the determination of audit
procedures. The effectiveness of the accounting related internal control system and the evidence supporting the disclosures in
the consolidated financial statements and the Combined Management Report are examined primarily on a test basis within the
framework of the audit. The audit includes assessing the annual financial statements of those entities included in consolidation,
the determination of entities to be included in consolidation, the accounting and consolidation principles used and significant
estimates made by management, as well as evaluating the overall presentation of the consolidated financial statements and
Combined Management Report. We believe that our audit provides a reasonable basis for our opinion.
Our audit has not led to any reservations.
In our opinion, based on the findings of our audit, the consolidated financial statements comply with IFRSs, as adopted by the
EU, the additional requirements of German commercial law pursuant to § 315a (1) HGB and supplementary provisions of the
articles of association and give a true and fair view of the net assets, financial position and results of operations of the Group in
accordance with these requirements. The Combined Management Report is consistent with the consolidated financial statements
and as a whole provides a suitable view of the Group’s position and suitably presents the opportunities and risks of future
development.
Frankfurt / Main, February 19, 2016
KPMG AG
Wirtschaftsprüfungsgesellschaft
Original German version signed by
Braun
Rackwitz
Wirtschaftsprüfer
Wirtschaftsprüfer
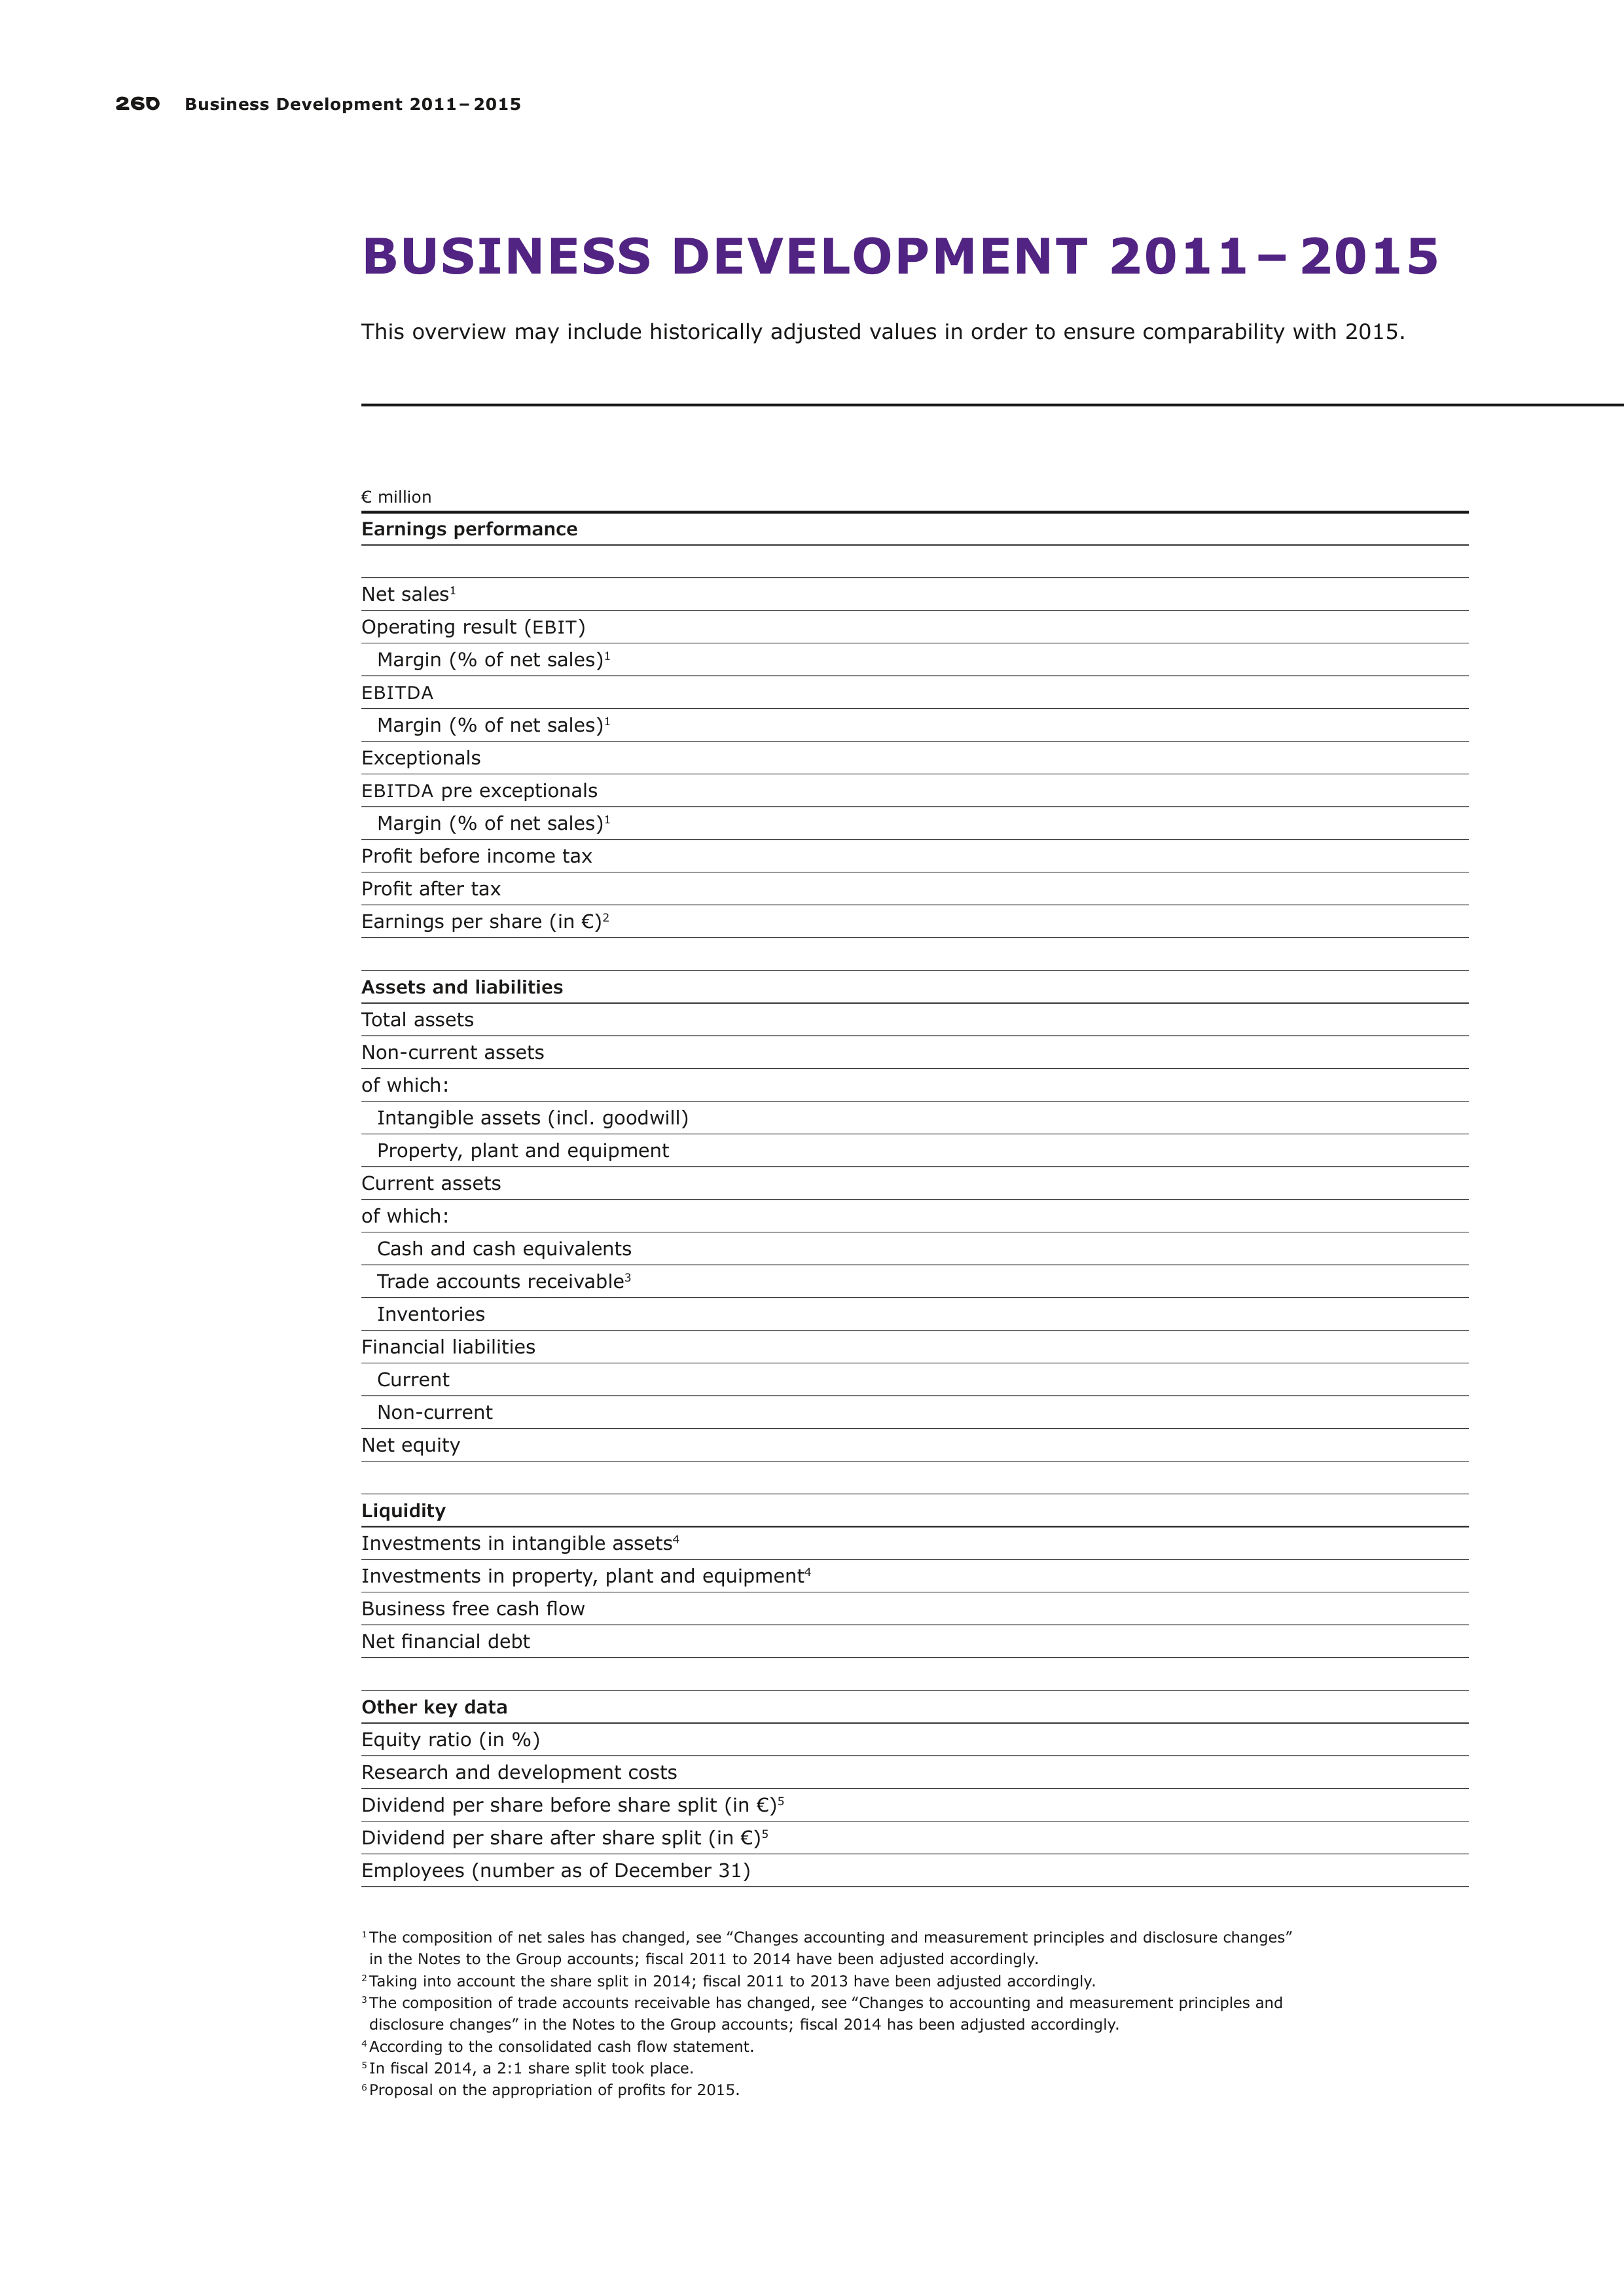
260
Business Development 2011 – 2015
BUSINESS DEVELOPMENT 2011 – 2015
This overview may include historically adjusted values in order to ensure comparability with 2015.
€ million
Earnings performance
Net sales
1
Operating result (
EBIT
)
Margin (% of net sales)
1
EBITDA
Margin (% of net sales)
1
Exceptionals
EBITDA
pre exceptionals
Margin (% of net sales)
1
Profit before income tax
Profit after tax
Earnings per share (in €)
2
Assets and liabilities
Total assets
Non-current assets
of which:
Intangible assets (incl. goodwill)
Property, plant and equipment
Current assets
of which:
Cash and cash equivalents
Trade accounts receivable
3
Inventories
Financial liabilities
Current
Non-current
Net equity
Liquidity
Investments in intangible assets
4
Investments in property, plant and equipment
4
Business free cash flow
Net financial debt
Other key data
Equity ratio (in %)
Research and development costs
Dividend per share before share split (in €)
5
Dividend per share after share split (in €)
5
Employees (number as of December 31)
1
The composition of net sales has changed, see ‟Changes accounting and measurement principles and disclosure changes”
in the Notes to the Group accounts; fiscal 2011 to 2014 have been adjusted accordingly.
2
Taking into account the share split in 2014; fiscal 2011 to 2013 have been adjusted accordingly.
3
The composition of trade accounts receivable has changed, see ‟Changes to accounting and measurement principles and
disclosure changes” in the Notes to the Group accounts; fiscal 2014 has been adjusted accordingly.
4
According to the consolidated cash flow statement.
5
In fiscal 2014, a 2:1 share split took place.
6
Proposal on the appropriation of profits for 2015.
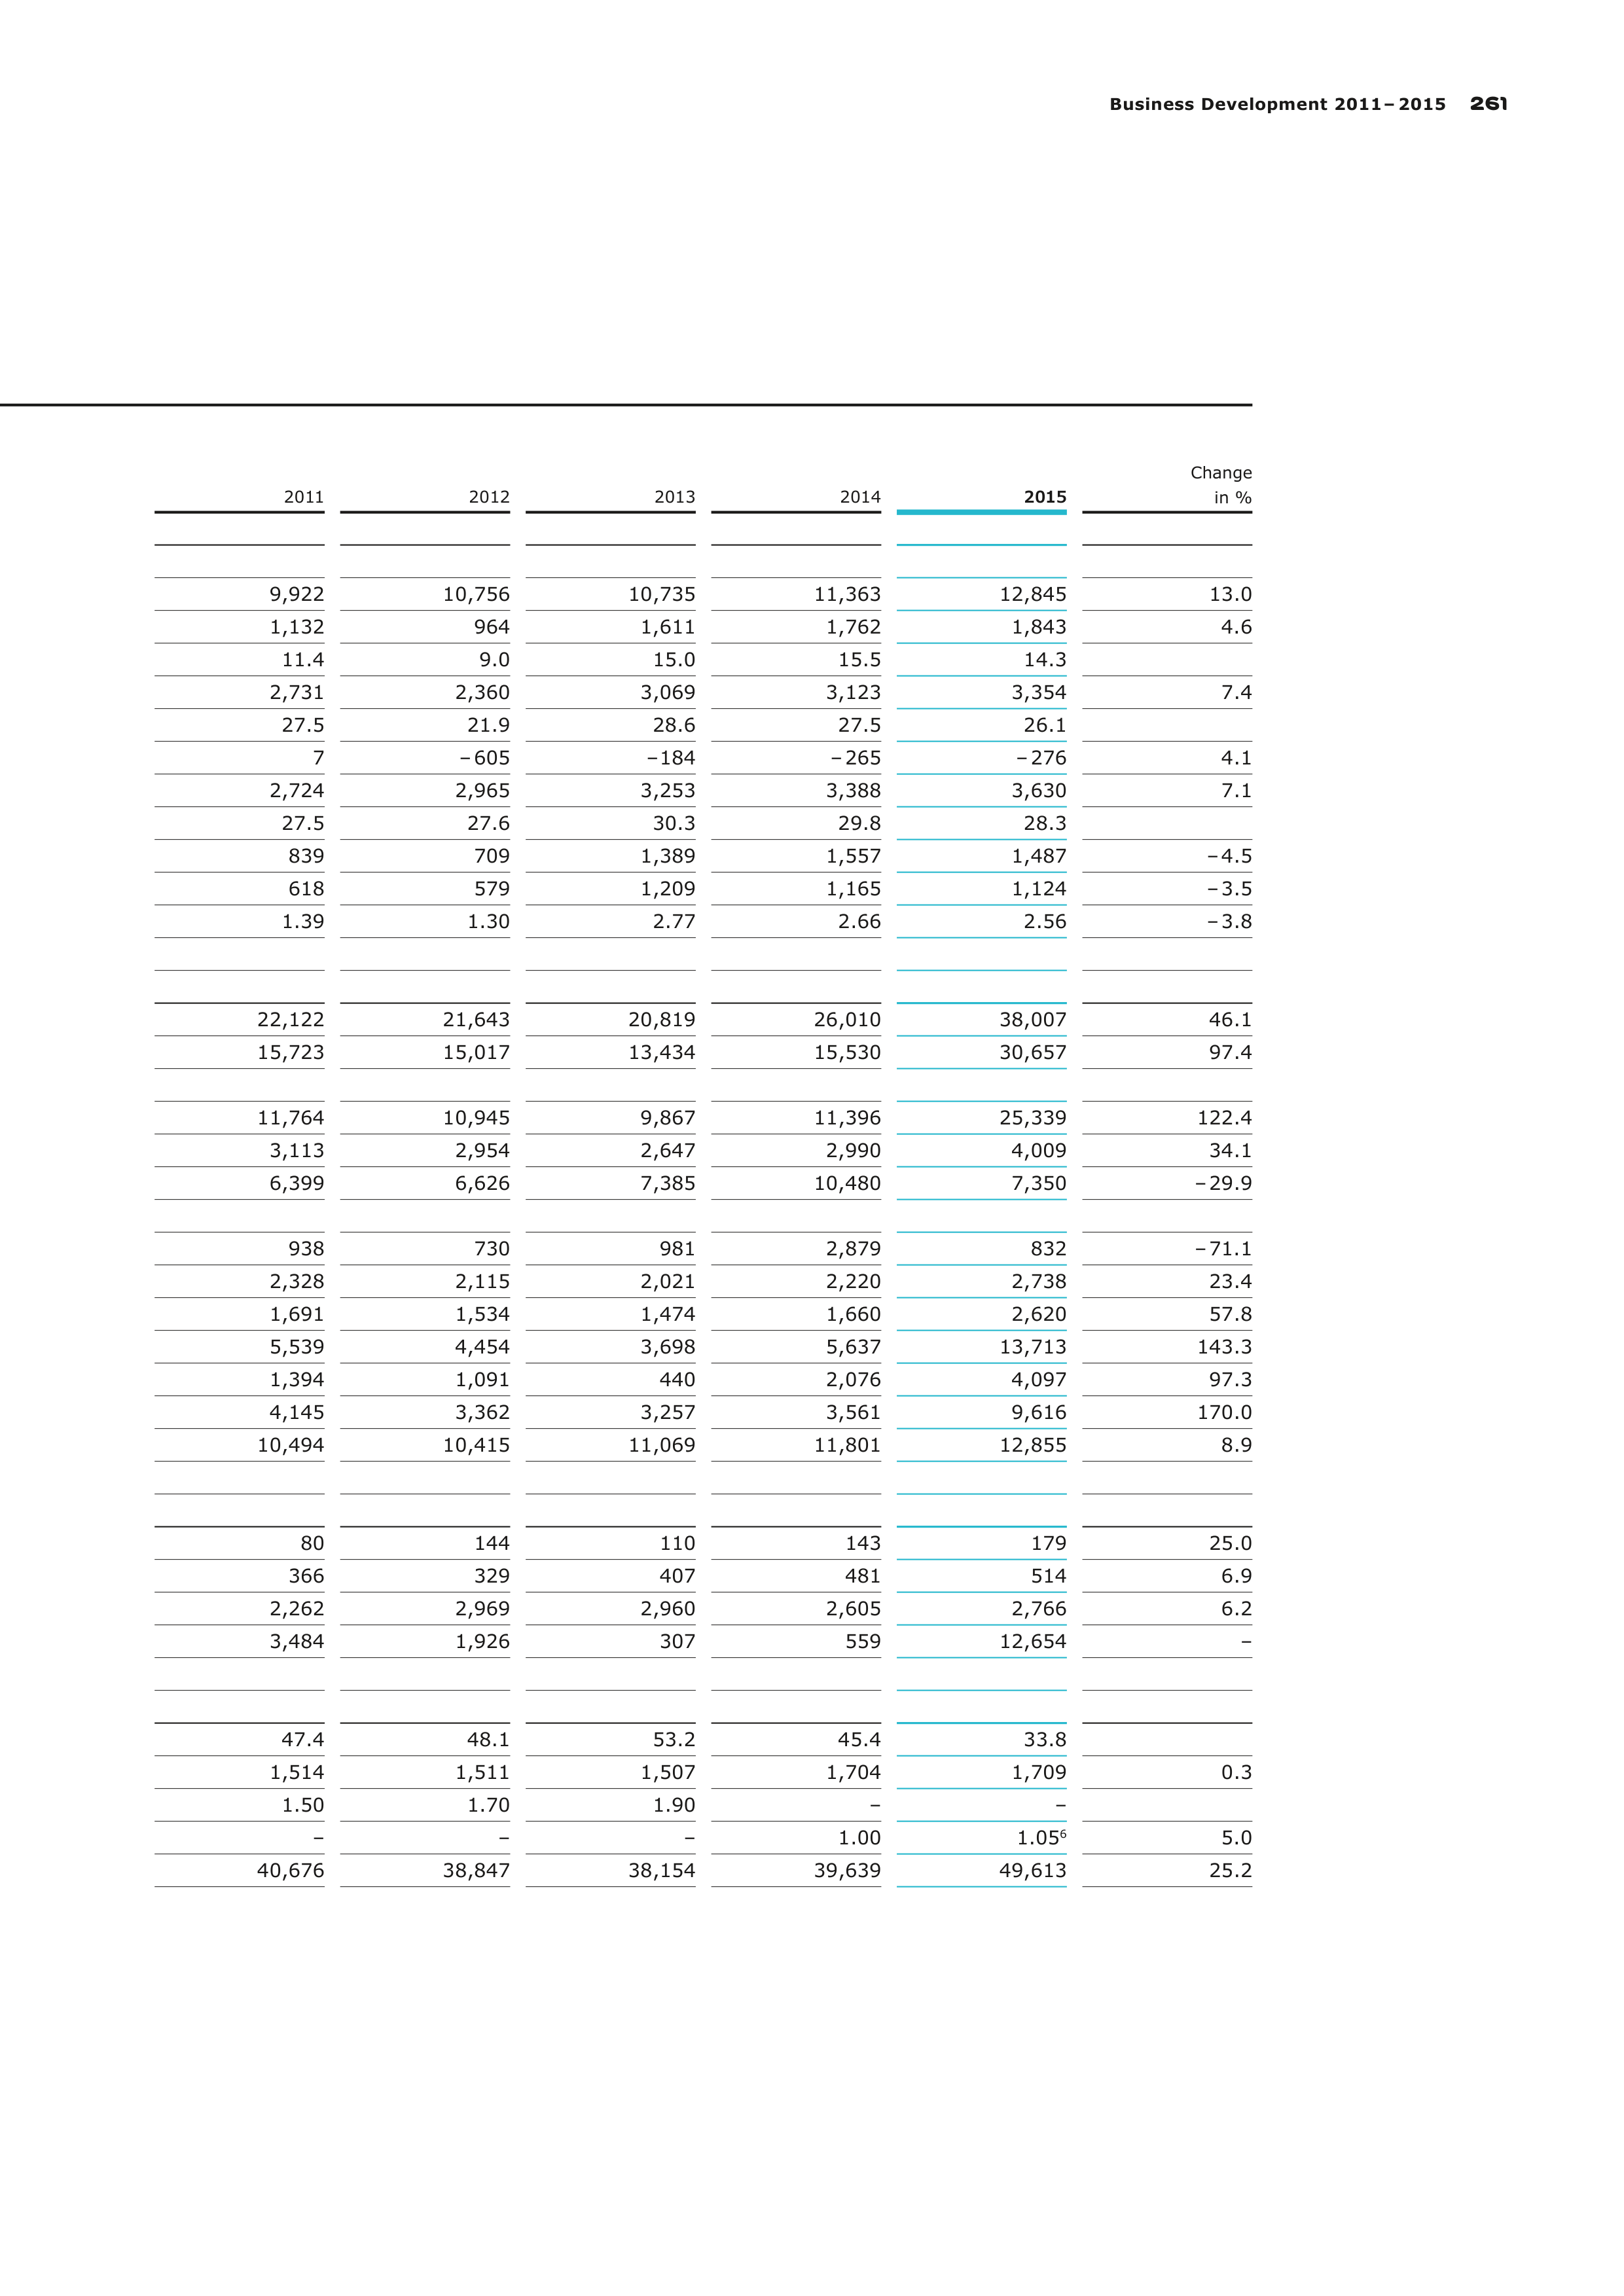
Business Development 2011 – 2015
261
2011
2012
2013
2014
2015
Change
in %
9,922
10,756
10,735
11,363
12,845
13.0
1,132
964
1,611
1,762
1,843
4.6
11.4
9.0
15.0
15.5
14.3
2,731
2,360
3,069
3,123
3,354
7.4
27.5
21.9
28.6
27.5
26.1
7
– 605
– 184
– 265
– 276
4.1
2,724
2,965
3,253
3,388
3,630
7.1
27.5
27.6
30.3
29.8
28.3
839
709
1,389
1,557
1,487
– 4.5
618
579
1,209
1,165
1,124
– 3.5
1.39
1.30
2.77
2.66
2.56
– 3.8
22,122
21,643
20,819
26,010
38,007
46.1
15,723
15,017
13,434
15,530
30,657
97.4
11,764
10,945
9,867
11,396
25,339
122.4
3,113
2,954
2,647
2,990
4,009
34.1
6,399
6,626
7,385
10,480
7,350
– 29.9
938
730
981
2,879
832
– 71.1
2,328
2,115
2,021
2,220
2,738
23.4
1,691
1,534
1,474
1,660
2,620
57.8
5,539
4,454
3,698
5,637
13,713
143.3
1,394
1,091
440
2,076
4,097
97.3
4,145
3,362
3,257
3,561
9,616
170.0
10,494
10,415
11,069
11,801
12,855
8.9
80
144
110
143
179
25.0
366
329
407
481
514
6.9
2,262
2,969
2,960
2,605
2,766
6.2
3,484
1,926
307
559
12,654
–
47.4
48.1
53.2
45.4
33.8
1,514
1,511
1,507
1,704
1,709
0.3
1.50
1.70
1.90
–
–
–
–
–
1.00
1.05
6
5.0
40,676
38,847
38,154
39,639
49,613
25.2
W840589
262
Information and Service
Information and Service
The Annual Report for 2015 was published in German and
English. A fully navigable online version of the report along with
the consolidated financial statements is available on the Web at
ar2015.merckgroup.com. It has been optimized for mobile devices.
More information about Merck can be found on the Web at
www.merckgroup.com and in the brochure ‟Merck – Who we are”,
which you may read or order at www.merckgroup.com/publications.
You can order all publications from Group Communications,
Merck KGaA, 64271 Darmstadt, comms@merckgroup.com.
Published on March 8, 2016 by
Merck KGaA, Group Communications
Frankfurter Strasse 250,
64293 Darmstadt, Germany
Telephone: + 49 6151 72– 0
Fax: + 49 6151 72–5577
E-Mail: comms@merckgroup.com
Website: www.merckgroup.com
Concept and design
3st kommunikation GmbH, Mainz
www.3st.de
Photos
Getty (pages 20 – 22)
Hartmut Nägele (pages 34, 38 – 39)
Urban Zintel (pages 12, 14 – 19)
Shutterstock (pages 8 – 9)
Merck
Printing
gutenberg beuys feindruckerei gmbh
Paper
Druckfein
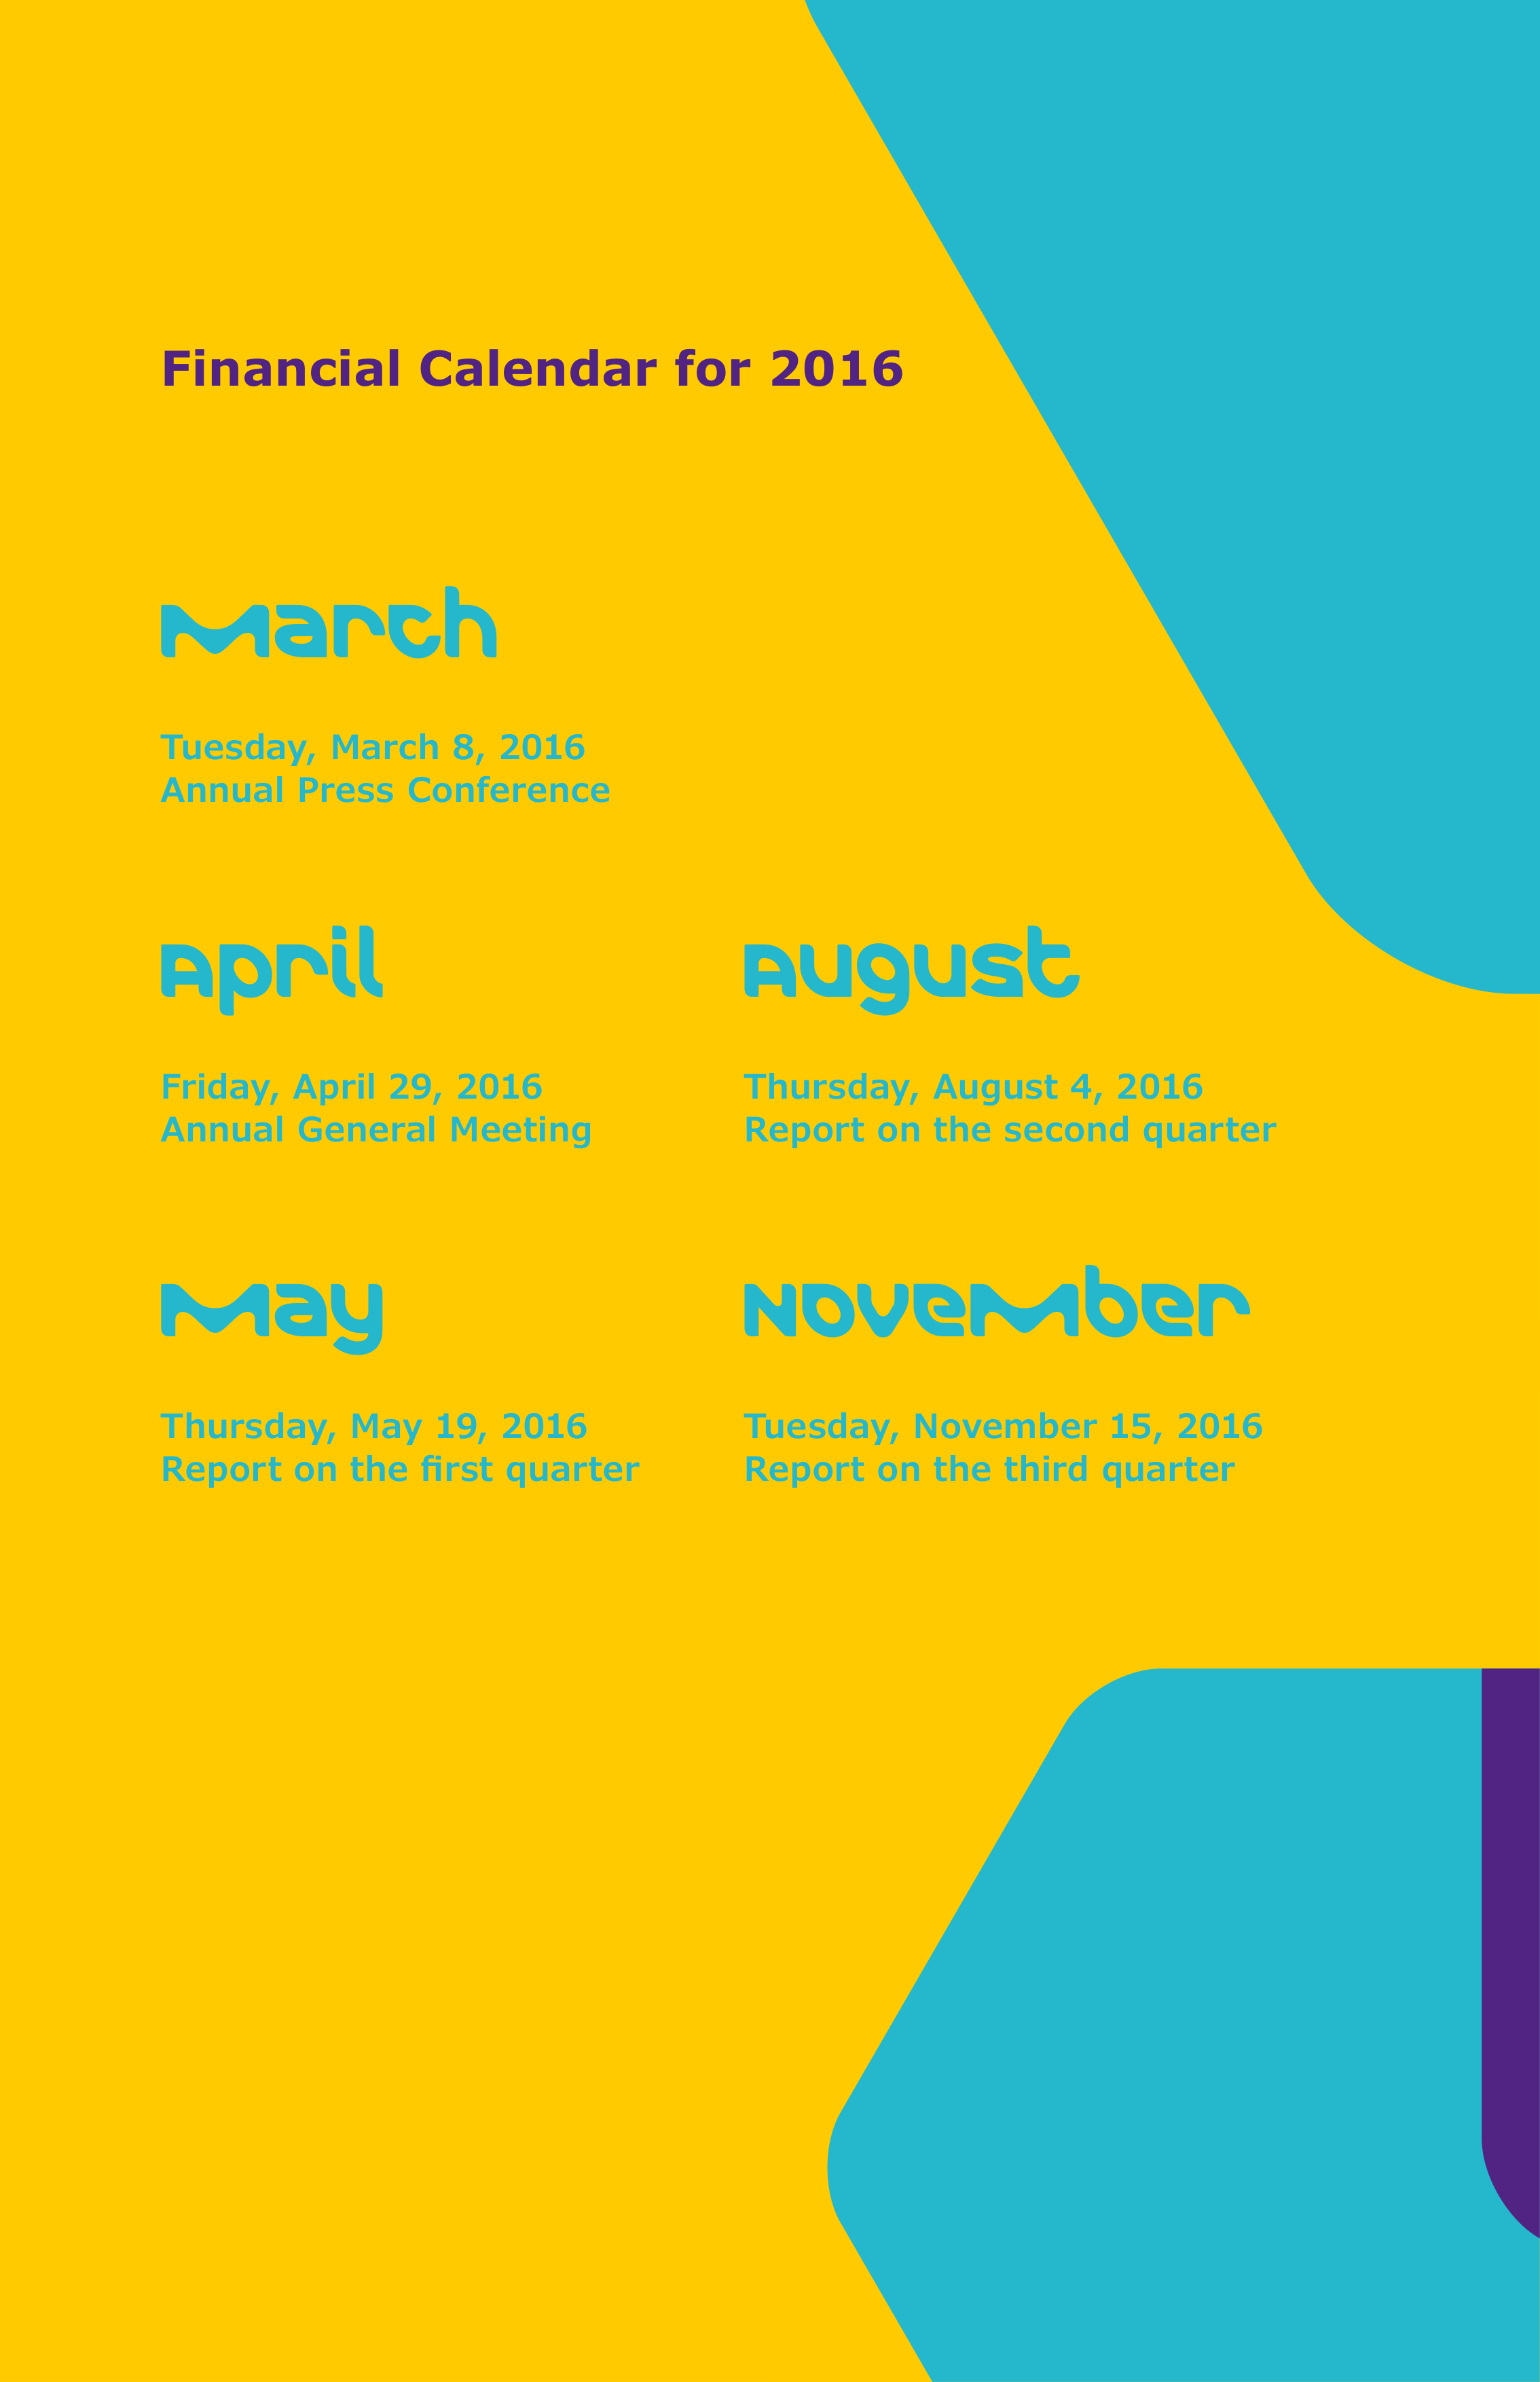
March
Tuesday, March 8, 2016
Annual Press Conference
April
Friday, April 29, 2016
Annual General Meeting
May
Thursday, May 19, 2016
Report on the first quarter
Financial Calendar for 2016
August
Thursday, August 4, 2016
Report on the second quarter
November
Tuesday, November 15, 2016
Report on the third quarter

www.merckgroup.com