
Published as a conference paper at ICLR 2021
BERT
OLOGY
M
EETS
B
IOLOGY
:
I
NTERPRETING
A
TTENTION
IN
P
ROTEIN
L
ANGUAGE
M
ODELS
Jesse Vig
1
Ali Madani
1
Lav R. Varshney
1,2
Caiming Xiong
1
Richard Socher
1
Nazneen Fatema Rajani
1
1
Salesforce Research,
2
University of Illinois at Urbana-Champaign
{jvig,amadani,cxiong,rsocher,nazneen.rajani}@salesforce.com
varshney@illinois.edu
A
BSTRACT
Transformer
architectures
have
proven
to
learn
useful
representations
for
pro-
tein classification and generation tasks.
However,
these representations present
challenges in interpretability.
In this work, we demonstrate a set of methods for
analyzing protein Transformer models through the lens of attention.
We show that
attention: (1) captures the folding structure of proteins, connecting amino acids that
are far apart in the underlying sequence, but spatially close in the three-dimensional
structure, (2) targets binding sites, a key functional component of proteins, and
(3) focuses on progressively more complex biophysical properties with increas-
ing layer depth.
We find this behavior to be consistent across three Transformer
architectures
(BERT,
ALBERT,
XLNet)
and
two
distinct
protein
datasets.
We
also
present
a
three-dimensional
visualization
of
the
interaction
between
atten-
tion
and
protein
structure.
Code
for
visualization
and
analysis
is
available
at
https://github.com/salesforce/provis
.
1
I
NTRODUCTION
The study of proteins, the fundamental macromolecules governing biology and life itself, has led to
remarkable advances in understanding human health and the development of disease therapies.
The
decreasing cost of sequencing technology has enabled vast databases of naturally occurring proteins
(El-Gebali et al., 2019a), which are rich in information for developing powerful machine learning
models of protein sequences.
For example, sequence models leveraging principles of co-evolution,
whether
modeling
pairwise
or
higher-order
interactions,
have
enabled
prediction
of
structure
or
function (Rollins et al., 2019).
Proteins, as a sequence of amino acids, can be viewed precisely as a language and therefore modeled
using neural architectures developed for natural language.
In particular, the Transformer (Vaswani
et al., 2017),
which has revolutionized unsupervised learning for text,
shows promise for similar
impact on protein sequence modeling.
However, the strong performance of the Transformer comes
at the cost of interpretability, and this lack of transparency can hide underlying problems such as
model bias and spurious correlations (Niven & Kao, 2019; Tan & Celis, 2019; Kurita et al., 2019).
In
response, much NLP research now focuses on interpreting the Transformer, e.g., the subspecialty of
“BERTology” (Rogers et al., 2020), which specifically studies the BERT model (Devlin et al., 2019).
In
this
work,
we
adapt
and
extend
this
line
of
interpretability
research
to
protein
sequences.
We
analyze Transformer protein models through the lens of attention, and present a set of interpretability
methods that capture the unique functional and structural characteristics of proteins.
We also compare
the knowledge encoded in attention weights to that captured by hidden-state representations.
Finally,
we present a visualization of attention contextualized within three-dimensional protein structure.
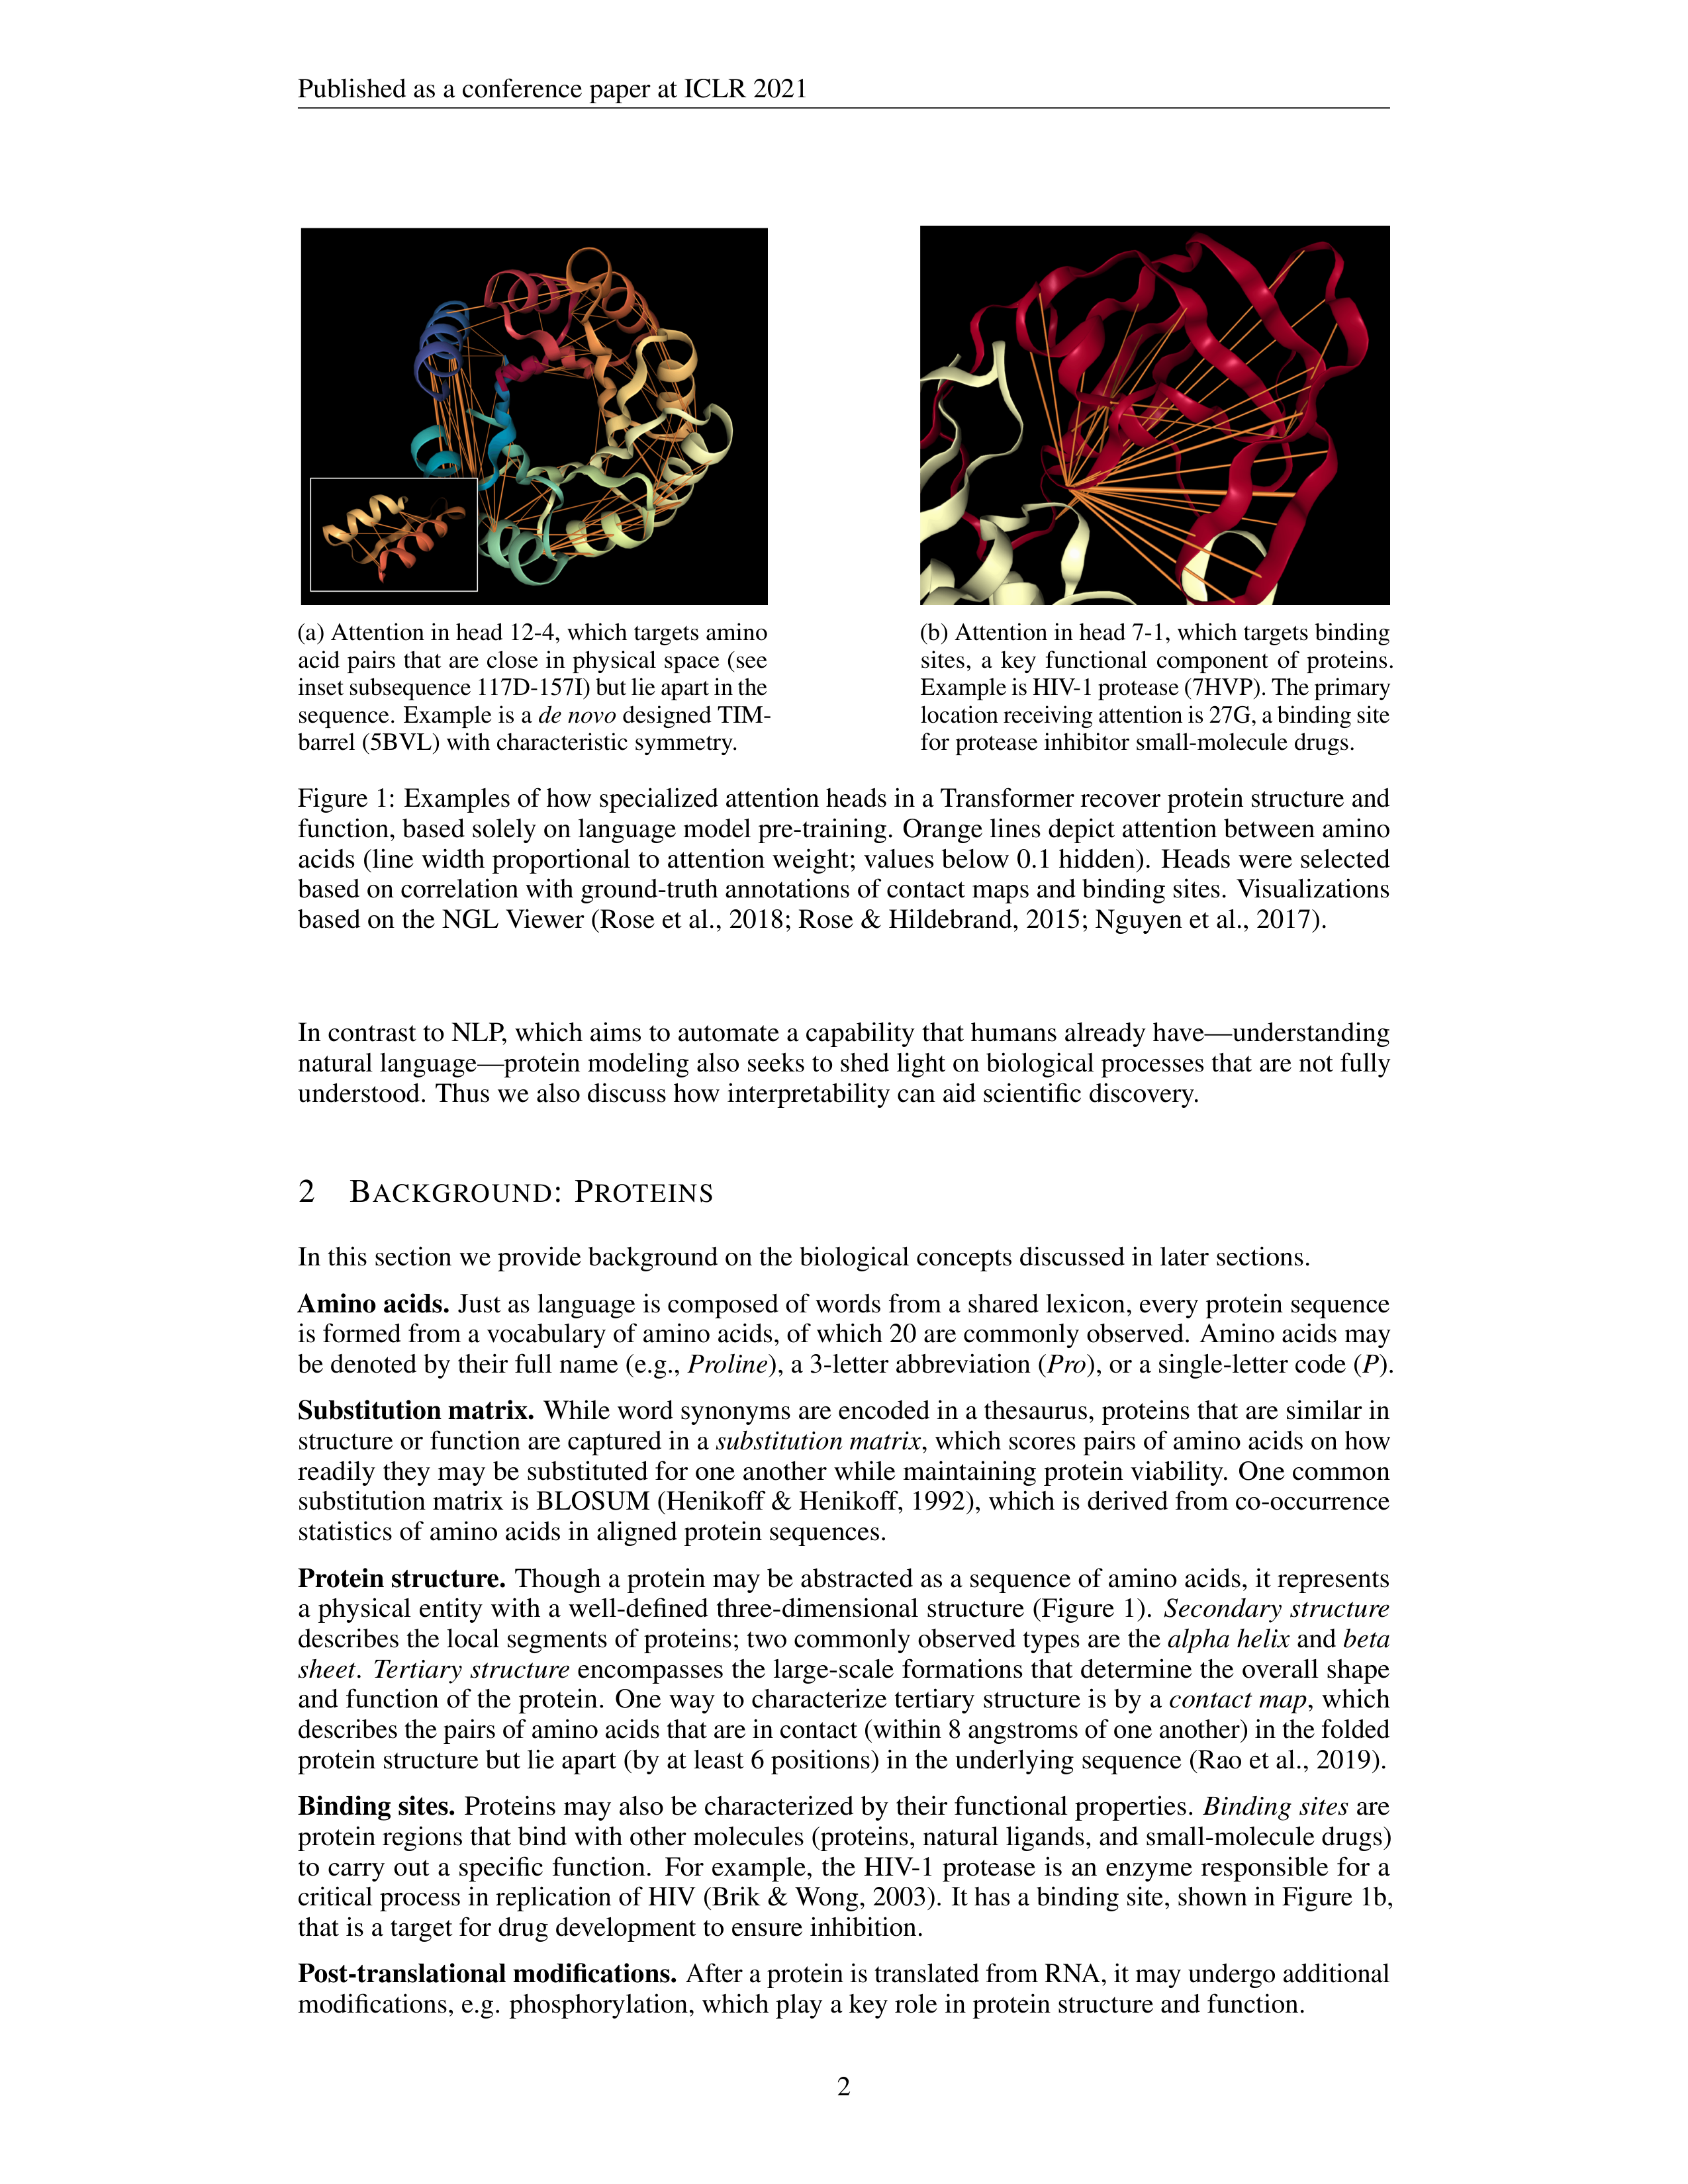
Our analysis reveals that attention captures high-level structural properties of proteins, connecting
amino acids that are spatially close in three-dimensional structure, but apart in the underlying sequence
(Figure 1a).
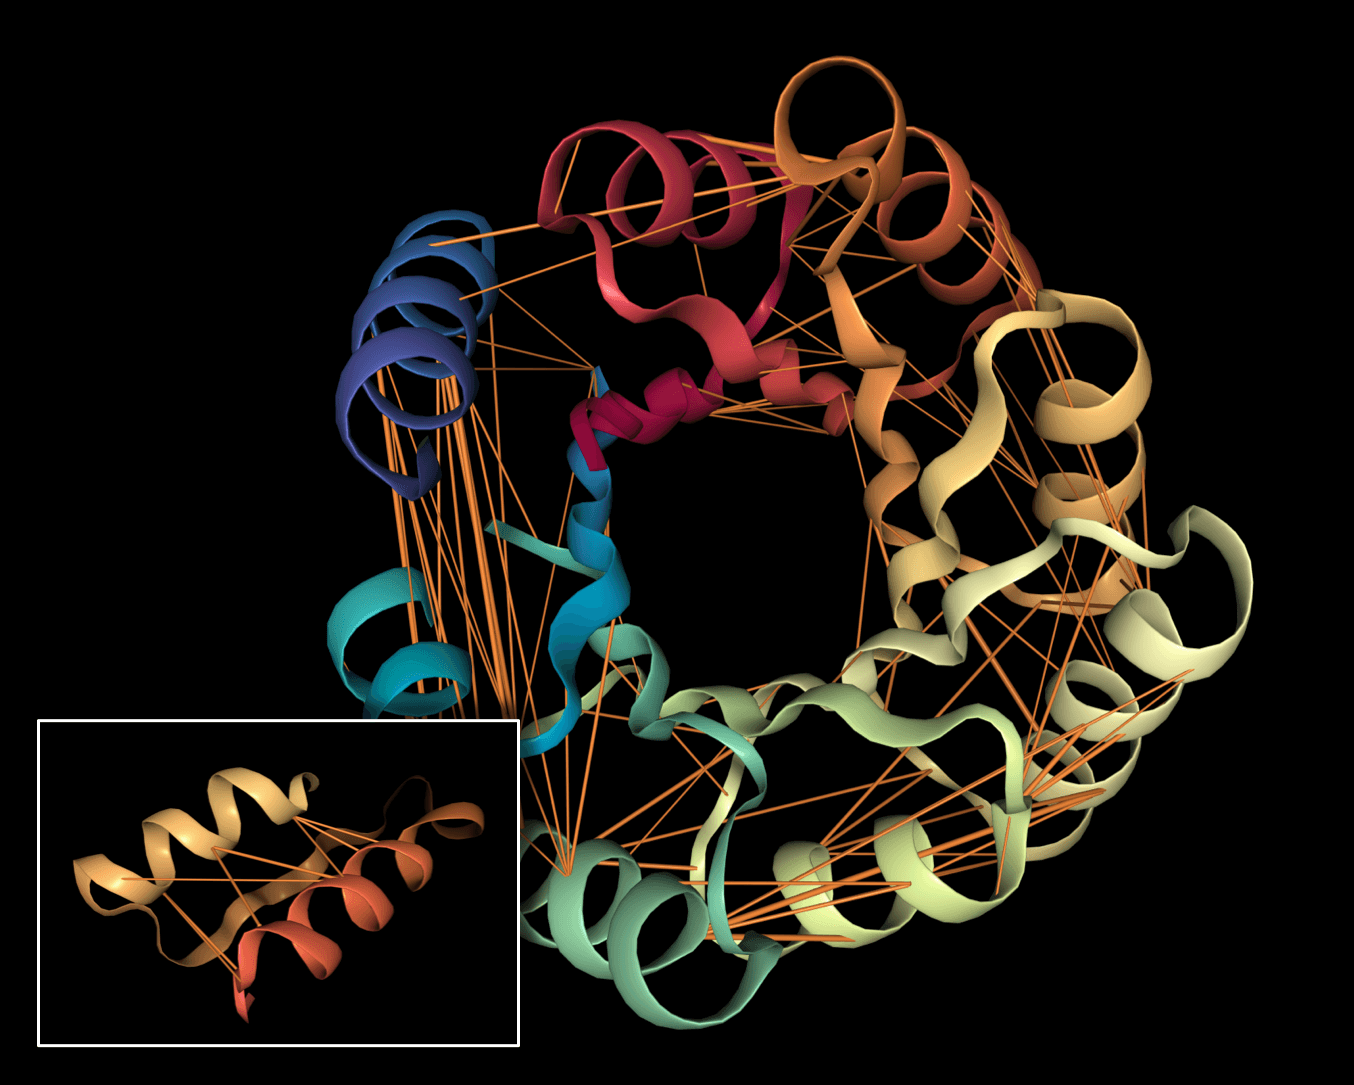
We also find that attention targets binding sites, a key functional component of proteins
(Figure 1b).
Further, we show how attention is consistent with a classic measure of similarity between
amino acids—the substitution matrix.
Finally, we demonstrate that attention captures progressively
higher-level representations of structure and function with increasing layer depth.
1
arXiv:2006.15222v3 [cs.CL] 28 Mar 2021
Published as a conference paper at ICLR 2021
(a) Attention in head 12-4, which targets amino
acid pairs that are close in physical space (see
inset subsequence 117D-157I) but lie apart in the
sequence.
Example is a
de novo
designed TIM-
barrel (5BVL) with characteristic symmetry.
(b) Attention in head 7-1, which targets binding
sites,
a
key
functional
component
of
proteins.
Example is HIV-1 protease (7HVP). The primary
location receiving attention is 27G, a binding site
for protease inhibitor small-molecule drugs.
Figure 1:
Examples of how specialized attention heads in a Transformer recover protein structure and
function, based solely on language model pre-training.
Orange lines depict attention between amino
acids (line width proportional to attention weight; values below 0.1 hidden).
Heads were selected
based on correlation with ground-truth annotations of contact maps and binding sites.
Visualizations
based on the NGL Viewer (Rose et al., 2018; Rose & Hildebrand, 2015; Nguyen et al., 2017).
In contrast to NLP, which aims to automate a capability that humans already have—understanding
natural language—protein modeling also seeks to shed light on biological processes that are not fully
understood.
Thus we also discuss how interpretability can aid scientific discovery.
2
B
ACKGROUND
:
P
ROTEINS
In this section we provide background on the biological concepts discussed in later sections.
Amino acids.
Just as language is composed of words from a shared lexicon, every protein sequence
is formed from a vocabulary of amino acids, of which 20 are commonly observed.
Amino acids may
be denoted by their full name (e.g.,
Proline
), a 3-letter abbreviation (
Pro
), or a single-letter code (
P
).
Substitution matrix.
While word synonyms are encoded in a thesaurus, proteins that are similar in
structure or function are captured in a
substitution matrix
, which scores pairs of amino acids on how
readily they may be substituted for one another while maintaining protein viability.
One common
substitution matrix is BLOSUM (Henikoff & Henikoff, 1992), which is derived from co-occurrence
statistics of amino acids in aligned protein sequences.
Protein structure.
Though a protein may be abstracted as a sequence of amino acids, it represents
a physical entity with a well-defined three-dimensional structure (Figure 1).
Secondary structure
describes the local segments of proteins; two commonly observed types are the
alpha helix
and
beta
sheet
.
Tertiary structure
encompasses the large-scale formations that determine the overall shape
and function of the protein.
One way to characterize tertiary structure is by a
contact map
, which
describes the pairs of amino acids that are in contact (within 8 angstroms of one another) in the folded
protein structure but lie apart (by at least 6 positions) in the underlying sequence (Rao et al., 2019).
Binding sites.
Proteins may also be characterized by their functional properties.
Binding sites
are
protein regions that bind with other molecules (proteins, natural ligands, and small-molecule drugs)
to carry out a specific function.
For example,
the HIV-1 protease is an enzyme responsible for a
critical process in replication of HIV (Brik & Wong, 2003).
It has a binding site, shown in Figure 1b,
that is a target for drug development to ensure inhibition.
Post-translational modifications.
After a protein is translated from RNA, it may undergo additional
modifications, e.g.
phosphorylation, which play a key role in protein structure and function.
2
Published as a conference paper at ICLR 2021
3
M
ETHODOLOGY
Model.
We demonstrate our interpretability methods on five Transformer models that were pretrained
through language modeling of amino acid sequences.
We primarily focus on the BERT-Base model
from TAPE (Rao et al., 2019), which was pretrained on Pfam, a dataset of 31M protein sequences (El-
Gebali et al., 2019b).
We refer to this model as
TapeBert
.
We also analyze 4 pre-trained Transformer
models
from
ProtTrans
(Elnaggar
et
al.,
2020):
ProtBert
and
ProtBert-BFD
,
which
are
30-layer,
16-head
BERT
models;
ProtAlbert
,
a
12-layer,
64-head
ALBERT
(Lan
et
al.,
2020)
model;
and
ProtXLNet
, a 30-layer, 16-head XLNet (Yang et al., 2019) model.
ProtBert-BFD
was pretrained on
BFD (Steinegger & Söding, 2018), a dataset of 2.1B protein sequences, while the other ProtTrans
models were pretrained on UniRef100 (Suzek et al., 2014), which includes 216M protein sequences.
A summary of these 5 models is presented in Appendix A.1.
Here we present an overview of BERT, with additional details on all models in Appendix A.2.
BERT
inputs a sequence of amino acids
x
= (
x
1
, . . . , x
n
)
and applies a series of encoders.
Each encoder
layer
ℓ
outputs a sequence of continuous embeddings
(
h
(
ℓ
)
1
, . . . ,
h
(
ℓ
)
n
)
using a multi-headed attention
mechanism.
Each attention head in a layer produces a set of attention weights
α
for an input, where
α
i,j
> 0 is the attention from token
i
to token
j
, such that
P
j
α
i,j
= 1
.
Intuitively, attention weights
define the influence of every token on the next layer’s representation for the current token.
We denote
a particular head by
-
, e.g. head
3-7
for the 3rd layer’s 7th head.
Attention analysis.
We analyze how attention aligns with various protein properties.
For properties
of token pairs, e.g.
contact maps, we define an indicator function
f
(
i, j
)
that returns 1 if the property
is
present
in
token
pair
(
i, j
)
(e.g.,
if
amino
acids
i
and
j
are
in
contact),
and
0
otherwise.
We
then compute the proportion of high-attention token pairs (
α
i,j
> θ
) where the property is present,
aggregated over a dataset
X
:
p
α
(
f
) =
X
x
∈
X
|
x
|
X
i
=1
|
x
|
X
j
=1
f
(
i, j
)
·
1
α
i,j
>θ
X
x
∈
X
|
x
|
X
i
=1
|
x
|
X
j
=1
1
α
i,j
>θ
(1)
where
θ
is a threshold to select for high-confidence attention weights.
We also present an alternative,
continuous version of this metric in Appendix B.1.
For properties of
individual tokens
, e.g.
binding sites, we define
f
(
i, j
)
to return 1 if the property is
present in token
j
(e.g. if
j
is a binding site).
In this case,
p
α
(
f
)
equals the proportion of attention
that is directed
to
the property (e.g.
the proportion of attention focused on binding sites).
When
applying
these
metrics,
we
include
two
types
of
checks
to
ensure
that
the
results
are
not
due to chance.
First, we test that the proportion of attention that aligns with particular properties
is significantly higher than the background frequency of these properties, taking into account the
Bonferroni correction for multiple hypotheses corresponding to multiple attention heads.
Second,
we compare the results to a null model, which is an instance of the model with randomly shuffled
attention weights.
We describe these methods in detail in Appendix B.2.
Probing tasks.
We also perform
probing tasks
on the model, which test the knowledge contained
in model representations by using them as inputs to a classifier that predicts a property of interest
(Veldhoen
et
al.,
2016;
Conneau
et
al.,
2018;
Adi
et
al.,
2016).
The
performance
of
the
probing
classifier serves as a measure of the knowledge of the property that is encoded in the representation.
We run both
embedding probes
, which assess the knowledge encoded in the output embeddings of
each layer, and
attention probes
(Reif et al., 2019; Clark et al., 2019), which measure the knowledge
contained in the attention weights for pairwise features.
Details are provided in Appendix B.3.
Datasets.
For our analyses of amino acids and contact maps, we use a curated dataset from TAPE
based on ProteinNet (AlQuraishi, 2019; Fox et al., 2013; Berman et al., 2000; Moult et al., 2018),
which contains amino acid sequences annotated with spatial coordinates (used for the contact map
analysis).
For the analysis of secondary structure and binding sites we use the Secondary Structure
dataset (Rao et al., 2019; Berman et al., 2000; Moult et al., 2018; Klausen et al., 2019) from TAPE.
We employed a taxonomy of secondary structure with three categories:
Helix
,
Strand
, and
Turn/Bend
,
with the last two belonging to the higher-level
beta sheet
category (Sec. 2).
We used this taxonomy to
study how the model understood structurally distinct regions of beta sheets.
We obtained token-level
binding
site
and
protein
modification
labels
from
the
Protein
Data
Bank
(Berman
et
al.,
2000).
For analyzing attention, we used a random subset of 5000 sequences from the training split of the
3
Published as a conference paper at ICLR 2021
2
4
6
8
10
12
Head
2
4
6
8
10
12
Layer
% Attention
0
25%
Max
0%
10%
20%
30%
40%
(a) TapeBert
2
4
6
8
10
12
14
16
18
20
22
24
26
28
30
32
34
36
38
40
42
44
46
48
50
52
54
56
58
60
62
64
Head
2
4
6
8
10
12
Layer
% Attention
0
50%
Max
0%
15%
30%
45%
(b) ProtAlbert
2
4
6
8
10
12
14
16
Head
2
4
6
8
10
12
14
16
18
20
22
24
26
28
30
Layer
% Attention
0
50%
Max
0%
15%
30%
45%
(c) ProtBert
2
4
6
8
10
12
14
16
Head
2
4
6
8
10
12
14
16
18
20
22
24
26
28
30
Layer
% Attention
0
50%
Max
0%
15%
30%
45%
60%
(d) ProtBert-BFD
2
4
6
8
10
12
14
16
Head
2
4
6
8
10
12
14
16
18
20
22
24
26
28
30
Layer
% Attention
0
25%
Max
0%
10%
20%
30%
40%
(e) ProtXLNet
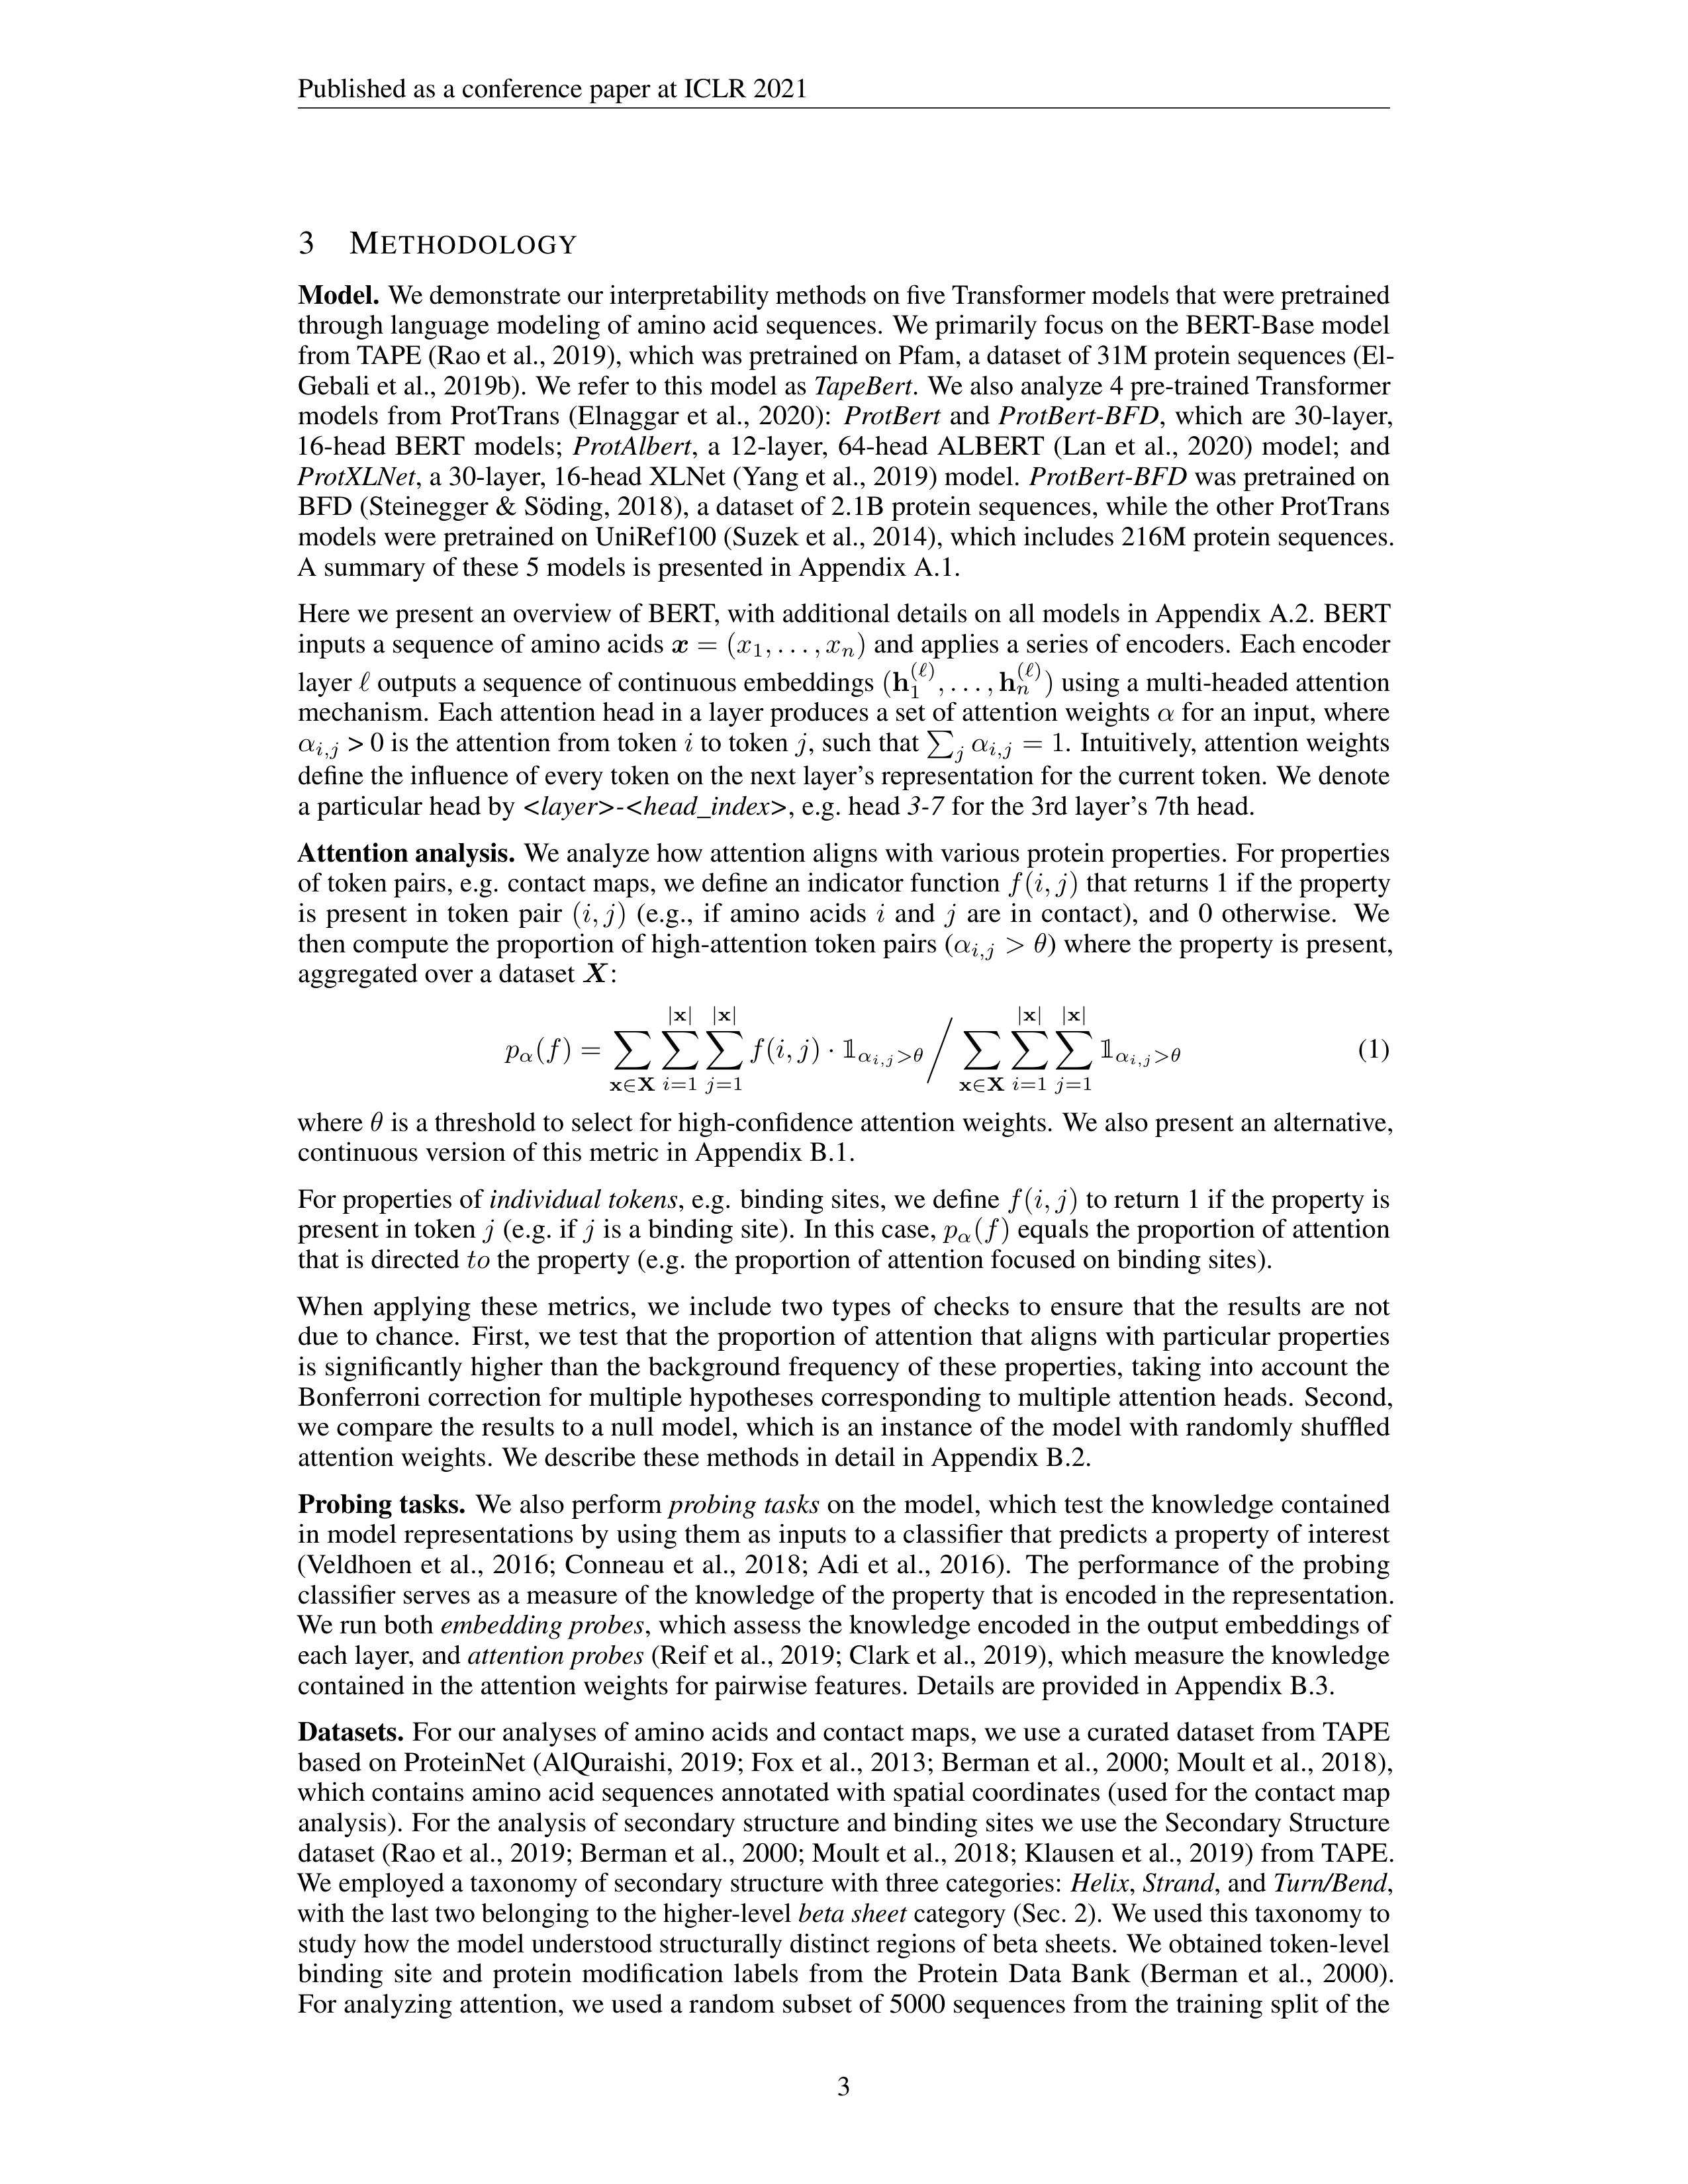
Figure 2:
Agreement between attention and contact maps across five pretrained Transformer models
from TAPE (a) and ProtTrans (b–e).
The heatmaps show the proportion of high-confidence attention
weights (
α
i,j
>
θ
) from each head that connects pairs of amino acids that are in contact with one
another.
In TapeBert (a), for example, we can see that 45% of attention in head 12-4 (the 12th layer’s
4th head) maps to contacts.
The bar plots show the maximum value from each layer.
Note that the
vertical striping in ProtAlbert (b) is likely due to cross-layer parameter sharing (see Appendix A.3).
respective datasets (note that none of the aforementioned annotations were used in model training).
For the diagnostic classifier, we used the respective training splits for training and the validation splits
for evaluation.
See Appendix B.4 for additional details.
Experimental details
We exclude attention to the
[SEP]
delimiter token, as it has been shown to
be a “no-op” attention token (Clark et al., 2019), as well as attention to the
[CLS]
token, which is
not explicitly used in language modeling.
We only include results for attention heads where at least
100 high-confidence attention arcs are available for analysis.
We set the attention threshold
θ
to 0.3
to select for high-confidence attention while retaining sufficient data for analysis.
We truncate all
protein sequences to a length of 512 to reduce memory requirements.
1
We note that all of the above analyses are purely associative and do not attempt to establish a causal
link between attention and model behavior (Vig et al., 2020; Grimsley et al., 2020), nor to
explain
model predictions (Jain & Wallace, 2019; Wiegreffe & Pinter, 2019).
4
W
HAT
DOES
ATTENTION
UNDERSTAND
ABOUT
PROTEINS
?
4.1
P
ROTEIN
S
TRUCTURE
Here we explore the relationship between attention and tertiary structure, as characterized by contact
maps (see Section 2).
Secondary structure results are included in Appendix C.1.
Attention aligns strongly with contact maps in the deepest layers.
Figure 2 shows how attention
aligns with contact maps across the heads of the five models evaluated
2
, based on the metric defined in
Equation 1.
The most aligned heads are found in the deepest layers and focus up to 44.7% (TapeBert),
55.7% (ProtAlbert), 58.5% (ProtBert), 63.2% (ProtBert-BFD), and 44.5% (ProtXLNet) of attention
on contacts, whereas the background frequency of contacts among all amino acid pairs in the dataset
is 1.3%.
Figure 1a shows an example of the induced attention from the top head in TapeBert.
We note
that the model with the single most aligned head—ProtBert-BFD—is the largest model (same size as
ProteinBert) at 420M parameters (Appendix A.1) and it was also the only model pre-trained on the
1
94% of sequences had length less than 512.
Experiments performed on single 16GB Tesla V-100 GPU.
2
Heads with fewer than 100 high-confidence attention weights across the dataset are grayed out.
4
Published as a conference paper at ICLR 2021
2
4
6
8
10
12
Head
2
4
6
8
10
12
Layer
% Attention
0
50%
Max
10%
20%
30%
40%
(a) TapeBert
2
4
6
8
10
12
14
16
18
20
22
24
26
28
30
32
34
36
38
40
42
44
46
48
50
52
54
56
58
60
62
64
Head
2
4
6
8
10
12
Layer
% Attention
0
50%
Max
0%
15%
30%
45%
(b) ProtAlbert
2
4
6
8
10
12
14
16
Head
2
4
6
8
10
12
14
16
18
20
22
24
26
28
30
Layer
% Attention
0
50%
Max
10%
20%
30%
40%
50%
(c) ProtBert
2
4
6
8
10
12
14
16
Head
2
4
6
8
10
12
14
16
18
20
22
24
26
28
30
Layer
% Attention
0
25%
Max
10%
20%
30%
40%
(d) ProtBert-BFD
2
4
6
8
10
12
14
16
Head
2
4
6
8
10
12
14
16
18
20
22
24
26
28
30
Layer
% Attention
0
10%
Max
0%
4%
8%
12%
(e) ProtXLNet
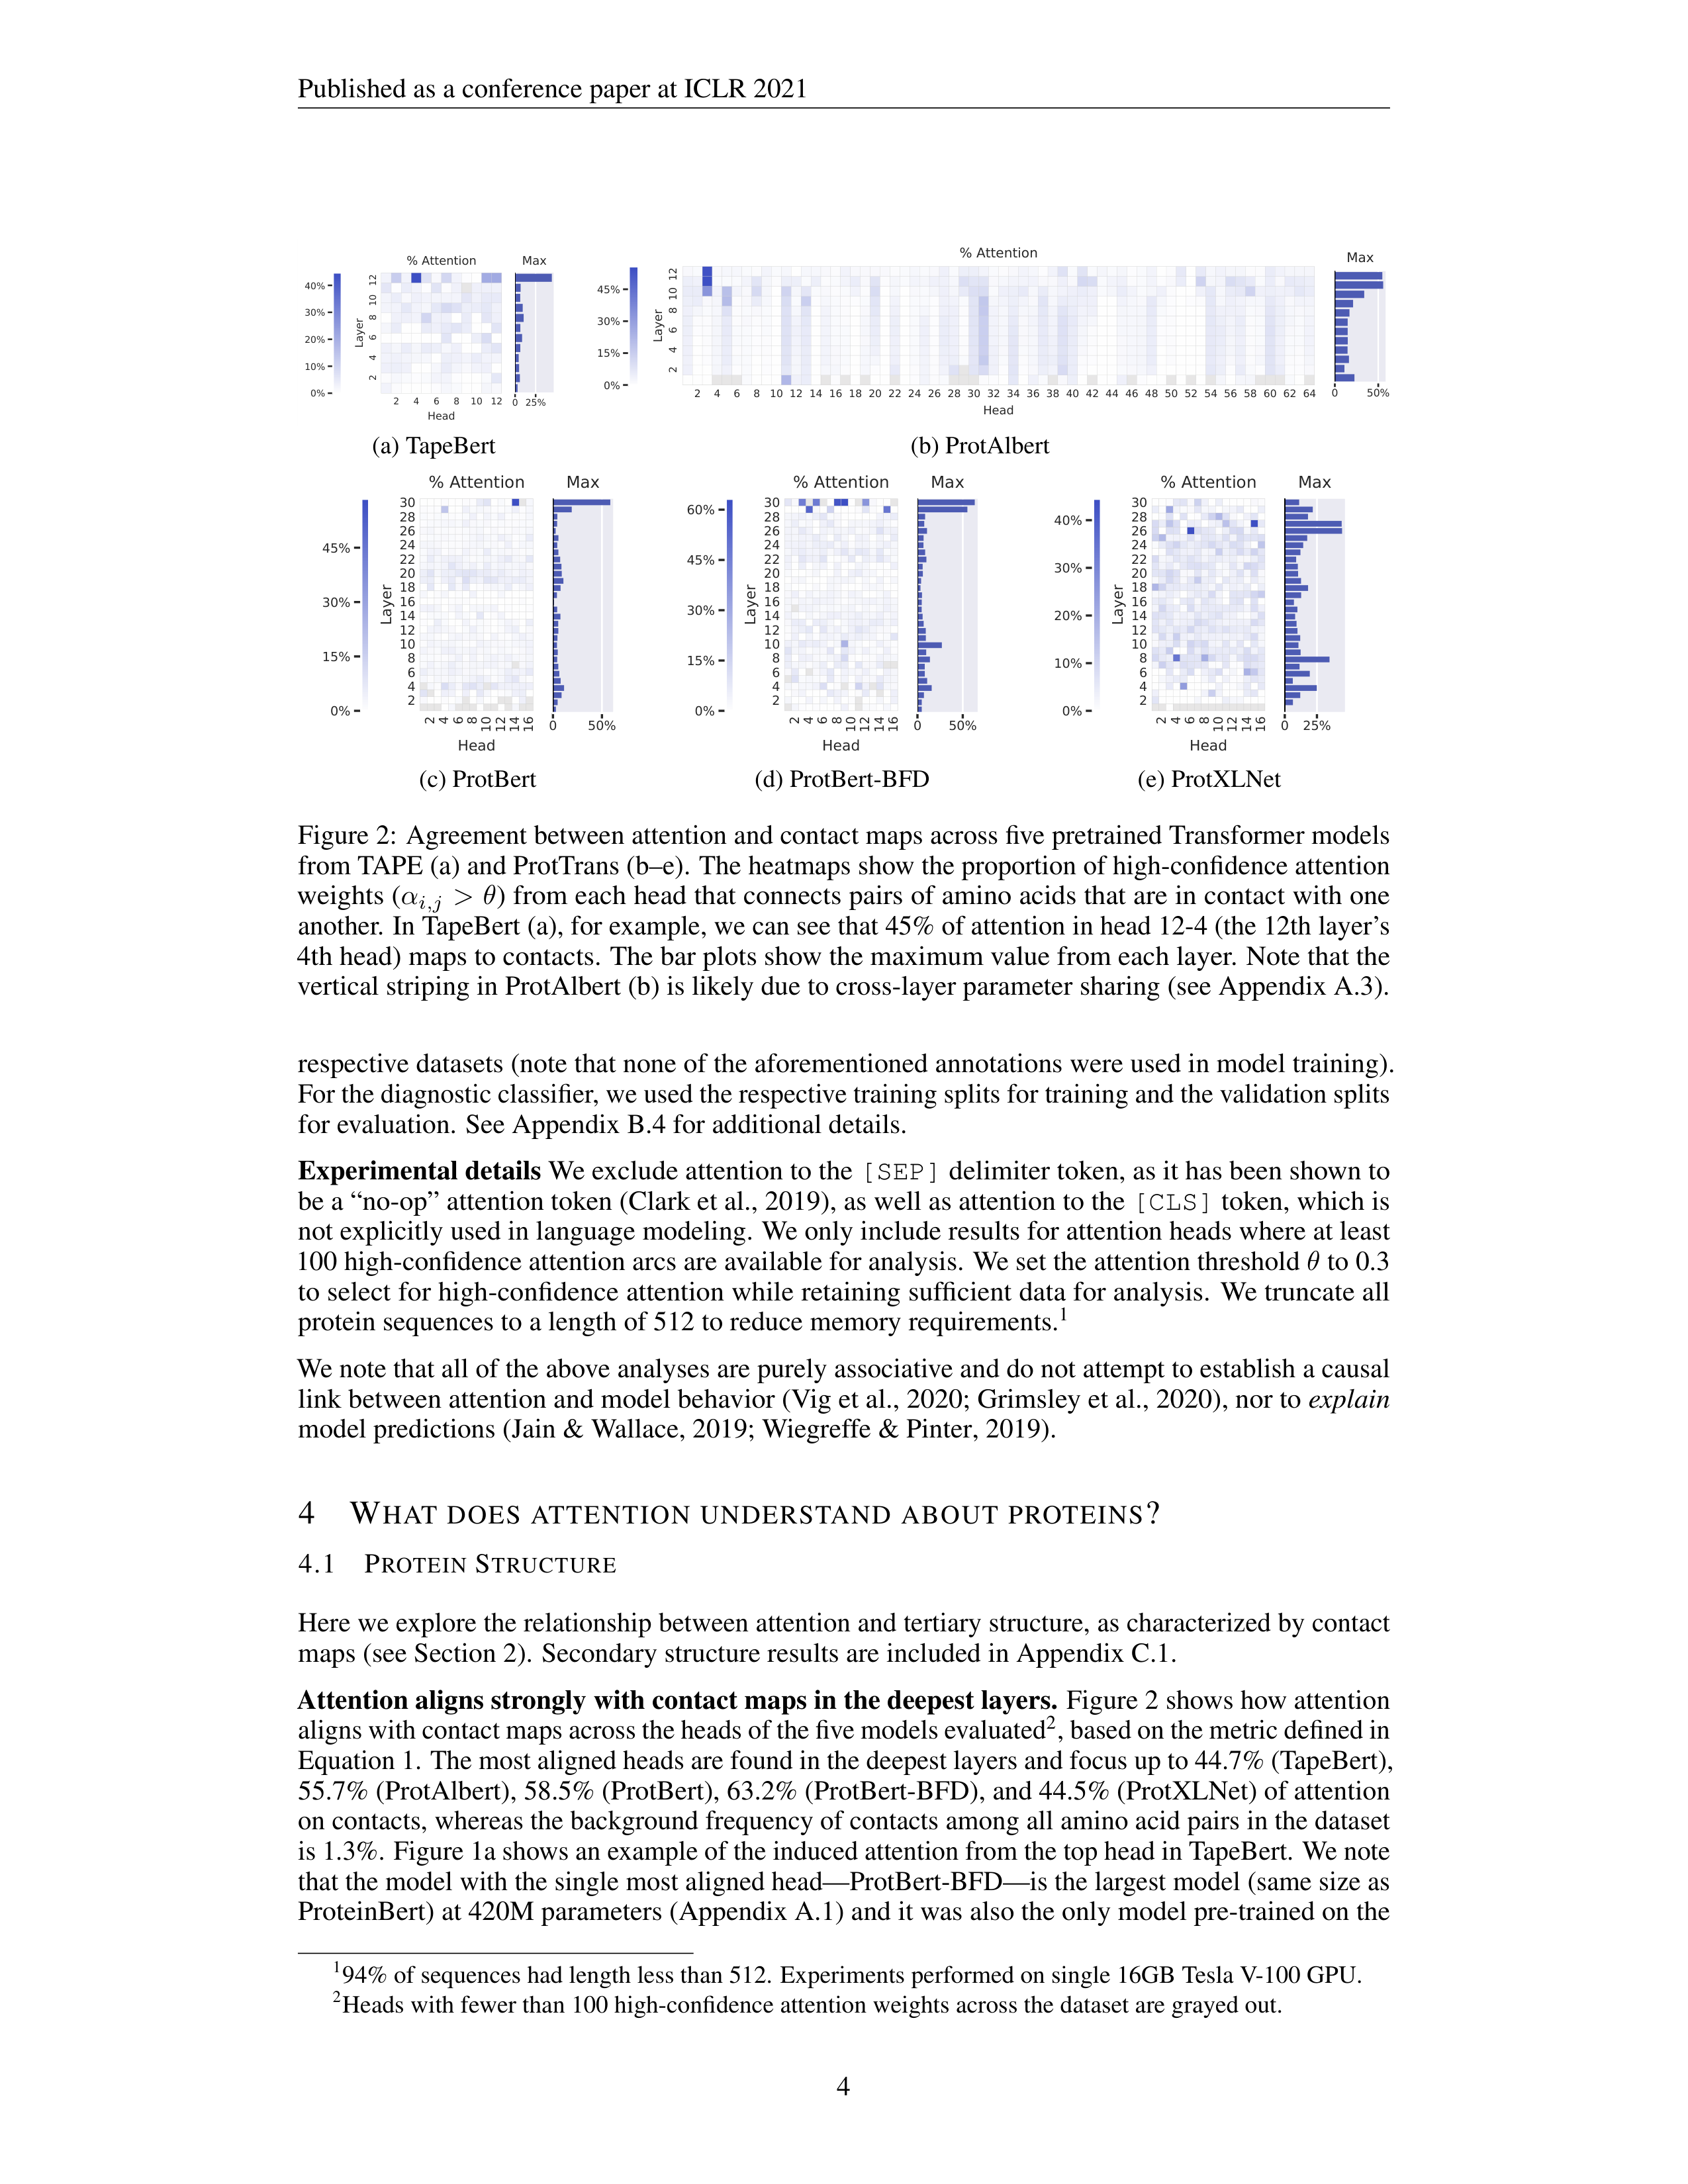
Figure 3: Proportion of attention focused on binding sites across five pretrained models. The heatmaps
show the proportion of high-confidence attention (
α
i,j
> θ
) from each head that is directed to binding
sites.
In TapeBert (a), for example, we can see that 49% of attention in head 11-6 (the 11th layer’s
6th head) is directed to binding sites.
The bar plots show the maximum value from each layer.
largest dataset, BFD. It’s possible that both factors helped the model learn more structurally-aligned
attention patterns.
Statistical significance tests and null models are reported in Appendix C.2.
Considering the models were trained on language modeling tasks without any spatial information,
the presence of these structurally-aware attention heads is intriguing.
One possible reason for this
emergent behavior is that contacts are more likely to biochemically interact with one another, creating
statistical dependencies between the amino acids in contact.
By focusing attention on the contacts of
a masked position, the language models may acquire valuable context for token prediction.
While there seems to be a strong correlation between the attention head output and classically-defined
contacts, there are also differences.
The models may have learned differing contextualized or nuanced
formulations that describe amino acid interactions.
These learned interactions could then be used for
further discovery and investigation or repurposed for prediction tasks similar to how principles of
coevolution enabled a powerful representation for structure prediction.
4.2
B
INDING
S
ITES
AND
P
OST
-T
RANSLATIONAL
M
ODIFICATIONS
We
also
analyze
how
attention
interacts
with
binding
sites
and
post-translational
modifications
(PTMs), which both play a key role in protein function.
Attention targets binding sites throughout most layers of the models.
Figure 3 shows the propor-
tion of attention focused on binding sites (Eq. 1) across the heads of the 5 models studied.
Attention
to binding sites is most pronounced in the ProtAlbert model (Figure 3b), which has 22 heads that
focus over 50% of attention on bindings sites, whereas the background frequency of binding sites in
the dataset is 4.8%.
The three BERT models (Figures 3a,
3c, and
3d) also attend strongly to binding
sites, with attention heads focusing up to 48.2%, 50.7%, and 45.6% of attention on binding sites,
respectively.
Figure 1b visualizes the attention in one strongly-aligned head from the TapeBert model.
Statistical significance tests and a comparison to a null model are provided in Appendix C.3.
ProtXLNet (Figure 3e) also targets binding sites, but not as strongly as the other models:
the most
aligned head focuses 15.1% of attention on binding sites, and the average head directs just 6.2% of
attention to binding sites, compared to 13.2%, 19.8%, 16.0%, and 15.1% for the first four models
in Figure 3.
It’s unclear whether this disparity is due to differences in architectures or pre-training
objectives;
for
example,
ProtXLNet
uses
a
bidirectional
auto-regressive
pretraining
method
(see
Appendix A.2), whereas the other 4 models all use masked language modeling objectives.
5
Published as a conference paper at ICLR 2021
0%
10%
20%
30%
Helix
0%
10%
20%
Turn/Bend
0%
10%
20%
Strand
0%
10%
20%
Binding Site
1
2
3
4
5
6
7
8
9
10
11
12
Layer
0%
5%
10%
Contact
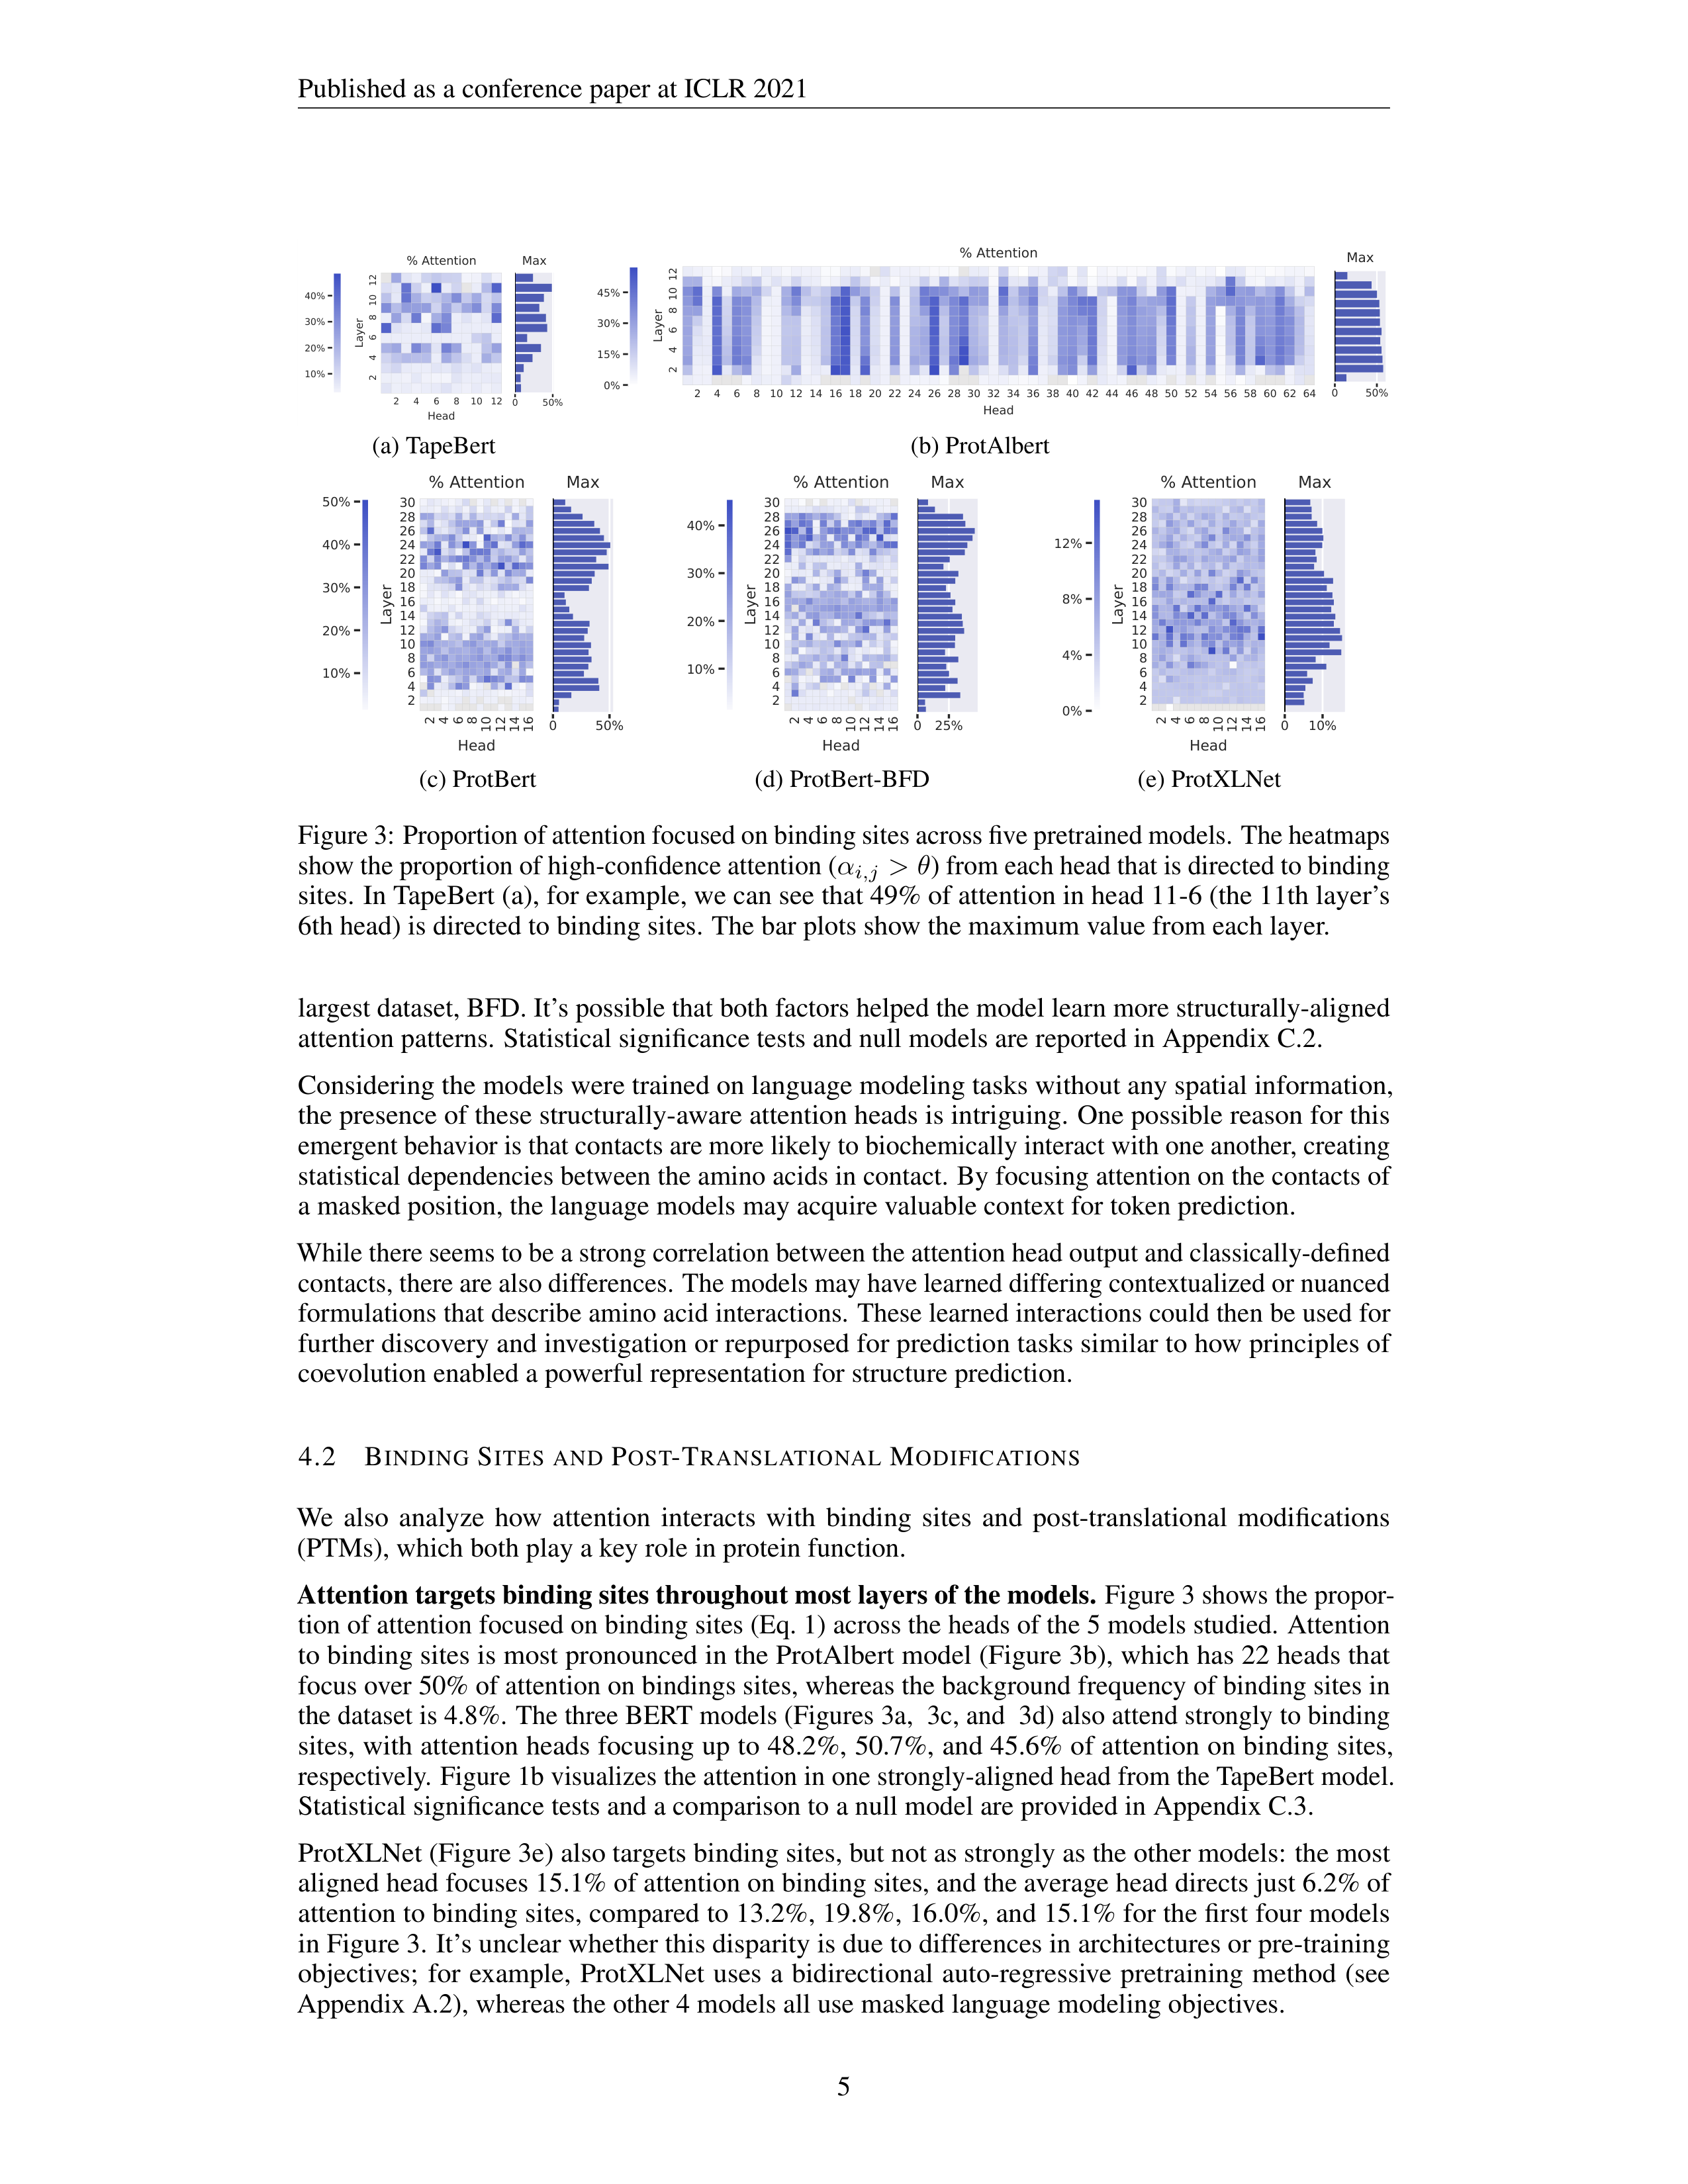
Figure 4:
Each plot shows the percentage of
attention
focused
on
the
given
property,
av-
eraged over all heads within each layer.
The
plots, sorted by center of gravity (red dashed
line), show that heads in deeper layers focus
relatively more attention on binding sites and
contacts,
whereas
attention
toward
specific
secondary structures is more even across lay-
ers.
0.6
0.7
Helix
0.1
0.2
Turn/Bend
0.2
0.4
0.6
Strand
0.10
0.12
0.14
0.16
Binding Site
1
2
3
4
5
6
7
8
9
10
11
12
Layer
0.05
0.10
0.15
Contact
Embedding probe
Attention probe
Figure 5:
Performance of probing classifiers
by
layer,
sorted
by
task
order
in
Figure
4.
The embedding probes (orange) quantify the
knowledge
of
the
given
property
that
is
en-
coded in each layer’s output embeddings.
The
attention probe (blue), show the amount of in-
formation encoded in attention weights for the
(pairwise) contact feature.
Additional details
are provided in Appendix B.3.
Why
does
attention
target
binding
sites?
In
contrast
to
contact
maps,
which
reveal
relationships
within
proteins, binding sites describe how a protein interacts with other molecules.
These external
interactions ultimately define the high-level function of the protein, and thus binding sites remain
conserved even when the sequence as a whole evolves (Kinjo & Nakamura, 2009).
Further, structural
motifs in binding sites are mainly restricted to specific families or superfamilies of proteins (Kinjo &
Nakamura, 2009), and binding sites can reveal evolutionary relationships among proteins (Lee et al.,
2017).
Thus binding sites may provide the model with a high-level characterization of the protein
that is robust to individual sequence variation.
By attending to these regions, the model can leverage
this higher-level context when predicting masked tokens throughout the sequence.
Attention targets PTMs in a small number of heads.
A small number of heads in each model con-
centrate their attention very strongly on amino acids associated with post-translational modifications
(PTMs).
For example, Head 11-6 in TapeBert focused 64% of attention on PTM positions, though
these occur at only 0.8% of sequence positions in the dataset.
3
Similar to our discussion on binding
sites, PTMs are critical to protein function (Rubin & Rosen, 1975) and thereby are likely to exhibit
behavior that is conserved across the sequence space.
See Appendix C.4 for full results.
4.3
C
ROSS
-L
AYER
A
NALYSIS
We
analyze
how
attention
captures
properties
of
varying
complexity
across
different
layers
of
TapeBert, and compare this to a probing analysis of embeddings and attention weights (see Section 3).
Attention targets higher-level properties in deeper layers.
As shown in Figure 4, deeper layers
focus relatively more attention on binding sites and contacts (high-level concept), whereas secondary
structure (low- to mid-level concept) is targeted more evenly across layers.
The probing analysis
of attention (Figure
5, blue) similarly shows that knowledge of contact maps (a pairwise feature)
3
This head also targets binding sites (Fig. 3a) but at a percentage of 49%.
6


Published as a conference paper at ICLR 2021
2
4
6
8
10
12
Head
2
4
6
8
10
12
Layer
% Attention
0
100%
Max
0%
20%
40%
60%
80%
2
4
6
8
10
12
Head
2
4
6
8
10
12
Layer
% Attention
0
20%
Max
0%
5%
10%
15%
20%
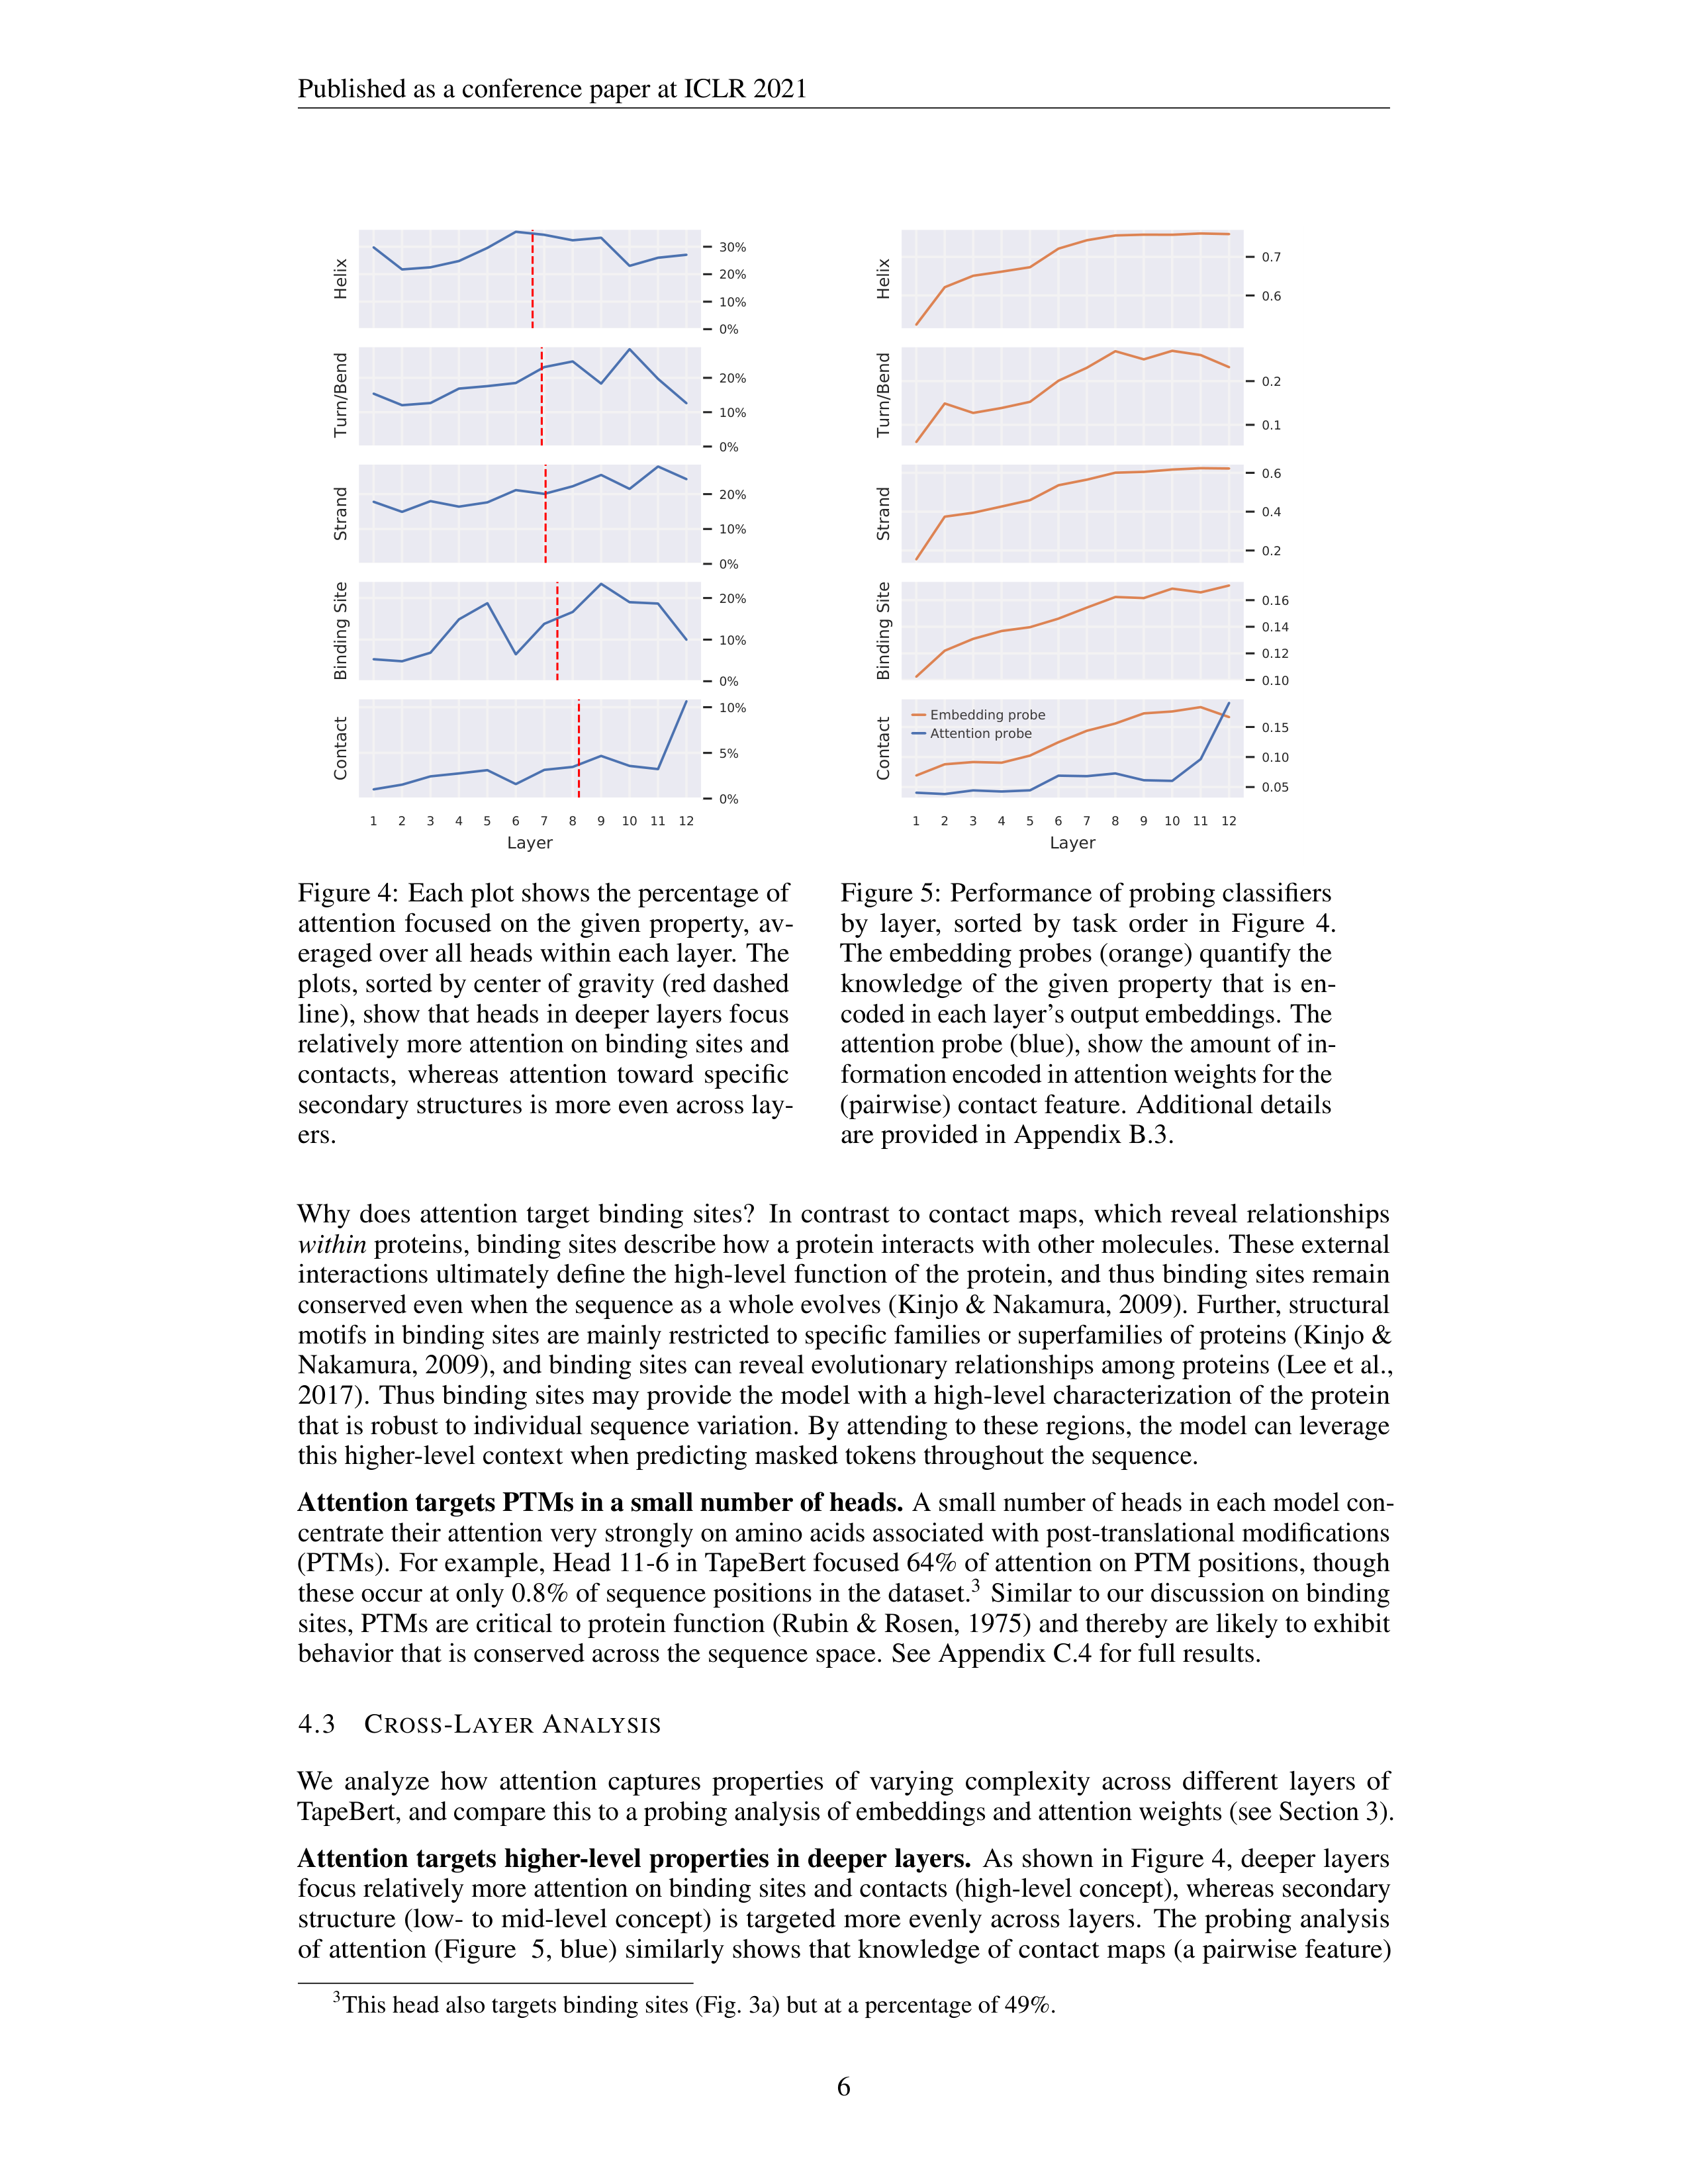
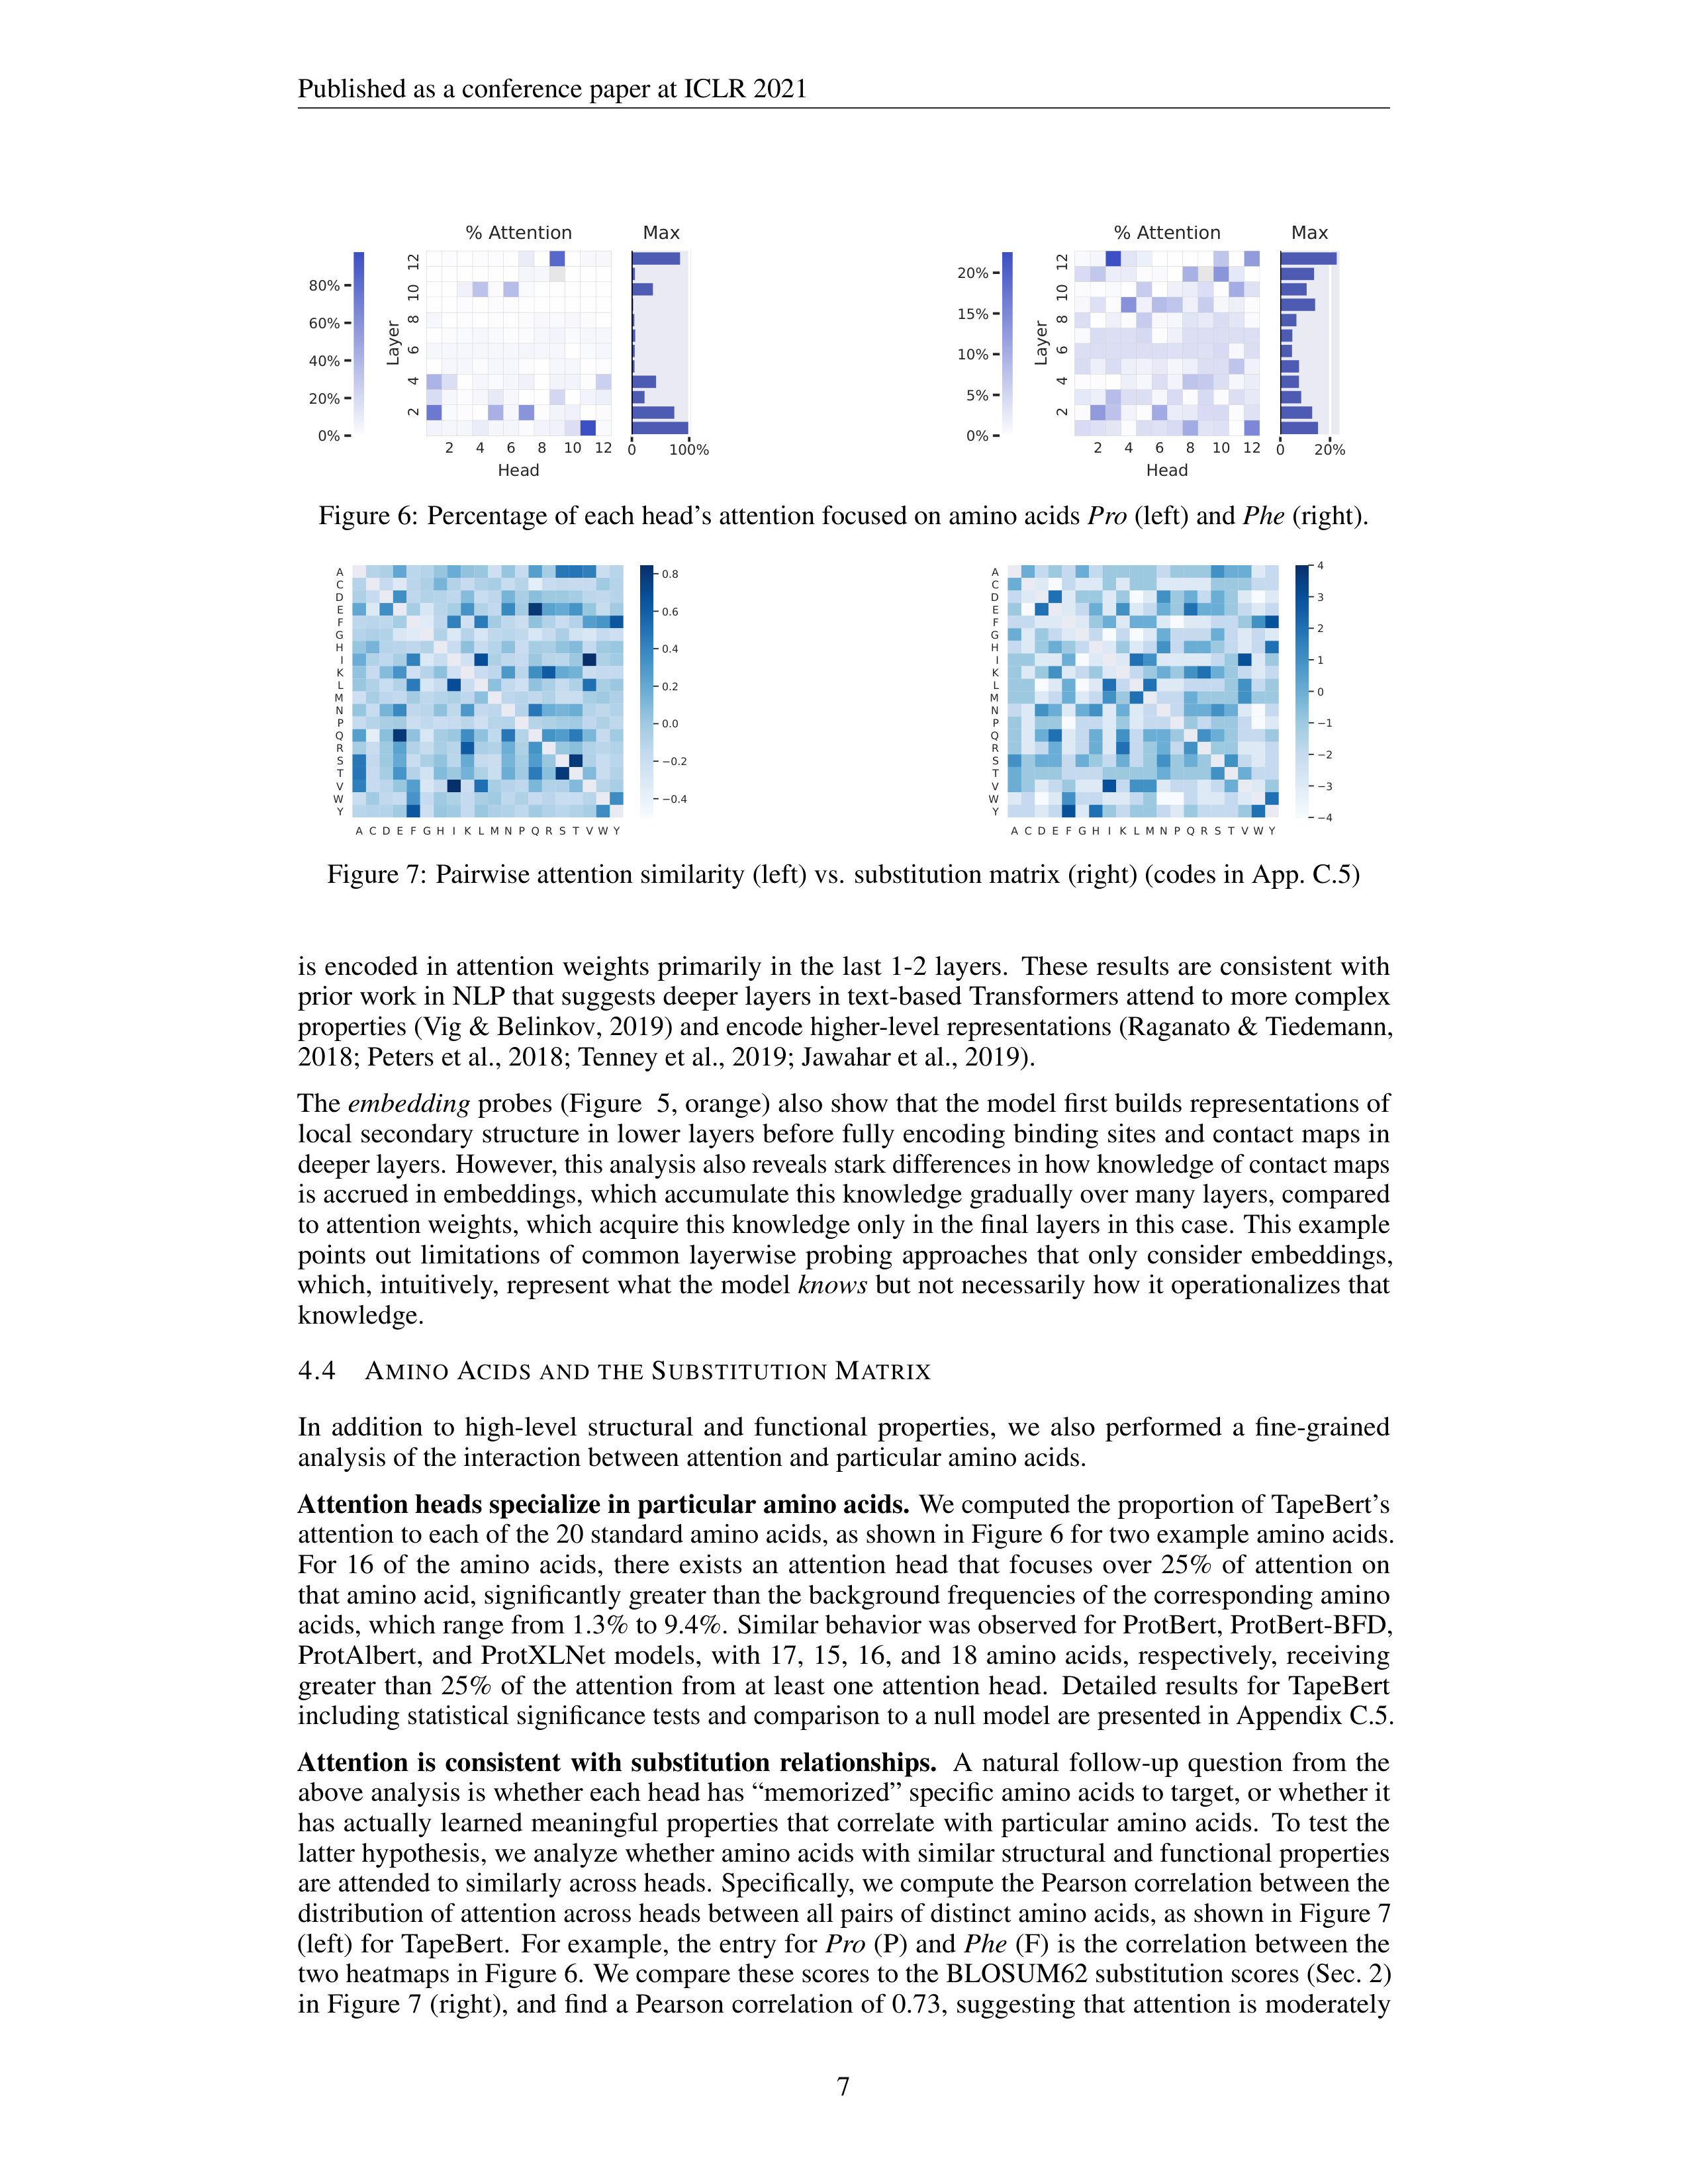
Figure 6:
Percentage of each head’s attention focused on amino acids
Pro
(left) and
Phe
(right).
A
C
D
E
F
G
H
I
K
L
M
N
P
Q
R
S
T
V
W
Y
A
C
D
E
F
G
H
I
K
L
M
N
P
Q
R
S
T
V
W
Y
0.4
0.2
0.0
0.2
0.4
0.6
0.8
A
C
D
E
F
G
H
I
K
L
M
N
P
Q
R
S
T
V
W
Y
A
C
D
E
F
G
H
I
K
L
M
N
P
Q
R
S
T
V
W
Y
4
3
2
1
0
1
2
3
4
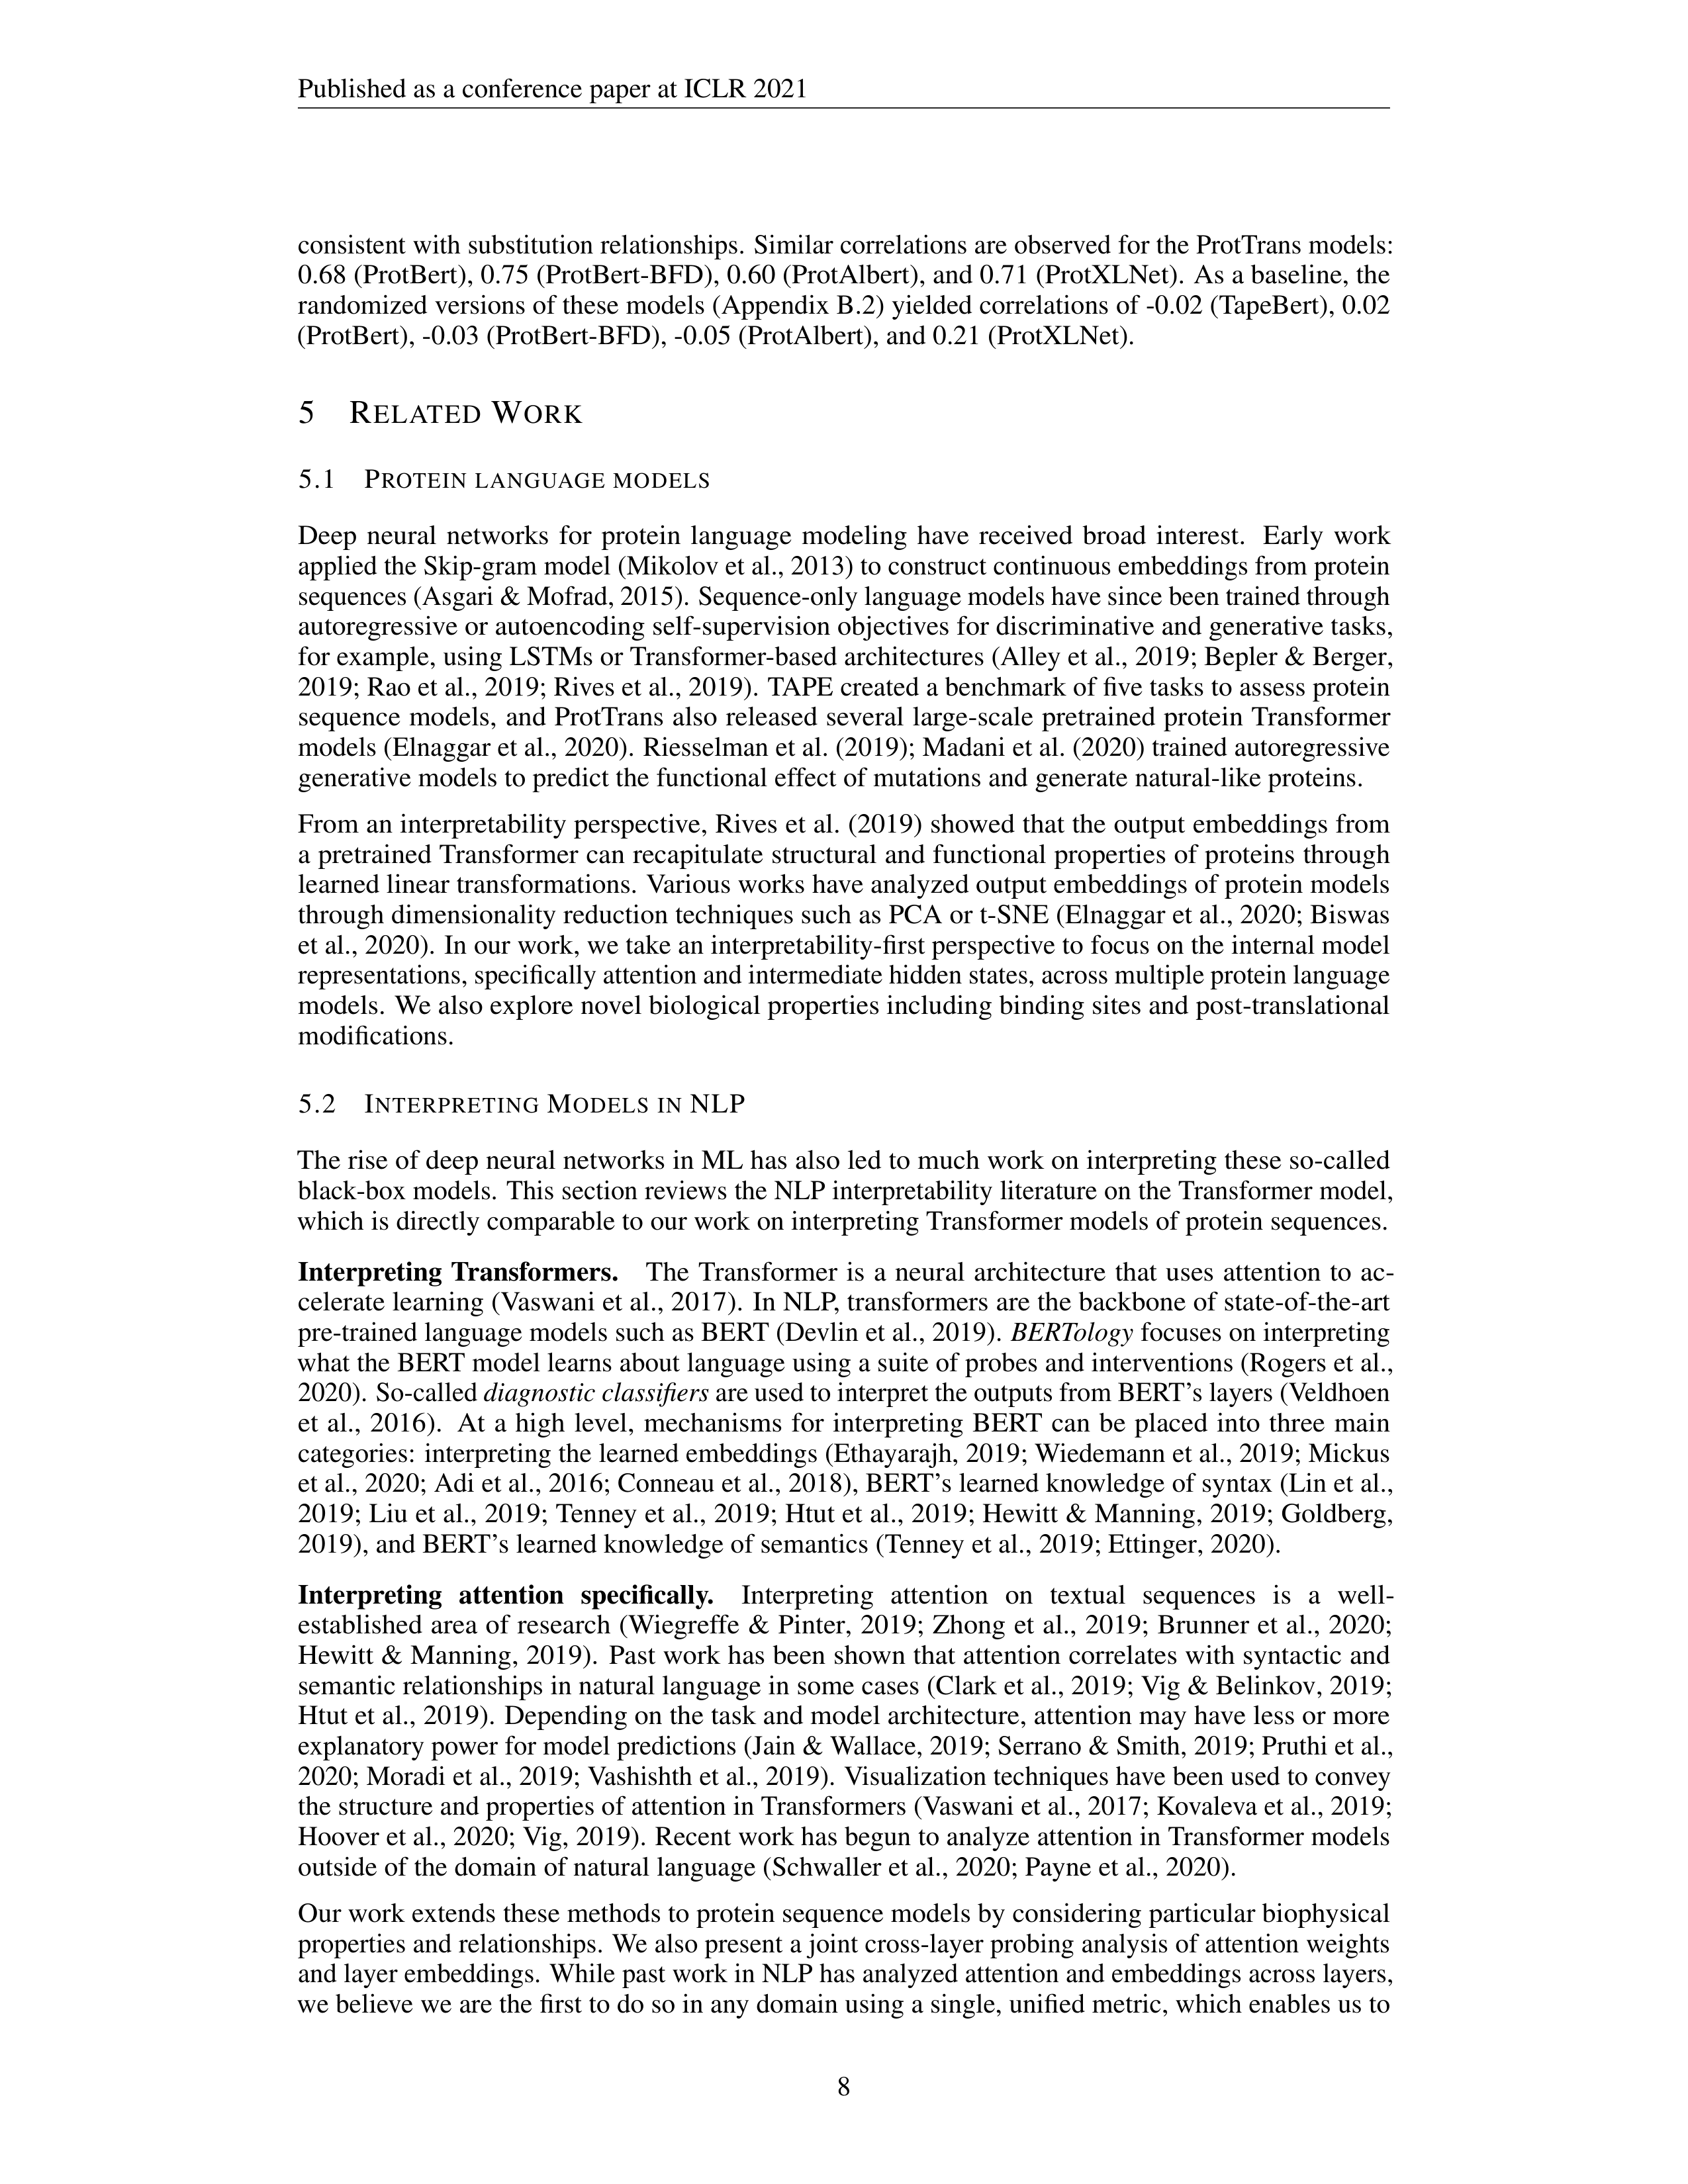
Figure 7:
Pairwise attention similarity (left) vs.
substitution matrix (right) (codes in App. C.5)
is encoded in attention weights primarily in the last 1-2 layers.
These results are consistent with
prior work in NLP that suggests deeper layers in text-based Transformers attend to more complex
properties (Vig & Belinkov, 2019) and encode higher-level representations (Raganato & Tiedemann,
2018; Peters et al., 2018; Tenney et al., 2019; Jawahar et al., 2019).
The
embedding
probes (Figure
5, orange) also show that the model first builds representations of
local secondary structure in lower layers before fully encoding binding sites and contact maps in
deeper layers.
However, this analysis also reveals stark differences in how knowledge of contact maps
is accrued in embeddings, which accumulate this knowledge gradually over many layers, compared
to attention weights, which acquire this knowledge only in the final layers in this case.
This example
points
out
limitations
of
common
layerwise
probing
approaches
that
only
consider
embeddings,
which, intuitively, represent what the model
knows
but not necessarily how it operationalizes that
knowledge.
4.4
A
MINO
A
CIDS
AND
THE
S
UBSTITUTION
M
ATRIX
In
addition
to
high-level
structural
and
functional
properties,
we
also
performed
a
fine-grained
analysis of the interaction between attention and particular amino acids.
Attention heads specialize in particular amino acids.
We computed the proportion of TapeBert’s
attention to each of the 20 standard amino acids, as shown in Figure 6 for two example amino acids.
For
16
of
the
amino
acids,
there
exists
an
attention
head
that
focuses
over
25%
of
attention
on
that amino acid, significantly greater than the background frequencies of the corresponding amino
acids, which range from 1.3% to 9.4%.
Similar behavior was observed for ProtBert, ProtBert-BFD,
ProtAlbert,
and
ProtXLNet
models,
with
17,
15,
16,
and
18
amino
acids,
respectively,
receiving
greater
than
25%
of
the
attention
from
at
least
one
attention
head.
Detailed
results
for
TapeBert
including statistical significance tests and comparison to a null model are presented in Appendix C.5.
Attention
is
consistent
with
substitution
relationships.
A
natural
follow-up
question
from
the
above analysis is whether each head has “memorized” specific amino acids to target, or whether it
has actually learned meaningful properties that correlate with particular amino acids.
To test the
latter hypothesis, we analyze whether amino acids with similar structural and functional properties
are attended to similarly across heads.
Specifically, we compute the Pearson correlation between the
distribution of attention across heads between all pairs of distinct amino acids, as shown in Figure 7
(left) for TapeBert.
For example, the entry for
Pro
(P) and
Phe
(F) is the correlation between the
two heatmaps in Figure 6.
We compare these scores to the BLOSUM62 substitution scores (Sec. 2)
in Figure 7 (right), and find a Pearson correlation of 0.73, suggesting that attention is moderately
7
Published as a conference paper at ICLR 2021
consistent with substitution relationships.
Similar correlations are observed for the ProtTrans models:
0.68 (ProtBert), 0.75 (ProtBert-BFD), 0.60 (ProtAlbert), and 0.71 (ProtXLNet).
As a baseline, the
randomized versions of these models (Appendix B.2) yielded correlations of -0.02 (TapeBert), 0.02
(ProtBert), -0.03 (ProtBert-BFD), -0.05 (ProtAlbert), and 0.21 (ProtXLNet).
5
R
ELATED
W
ORK
5.1
P
ROTEIN
LANGUAGE
MODELS
Deep
neural
networks
for
protein
language
modeling
have
received
broad
interest.
Early
work
applied the Skip-gram model (Mikolov et al., 2013) to construct continuous embeddings from protein
sequences (Asgari & Mofrad, 2015).
Sequence-only language models have since been trained through
autoregressive or autoencoding self-supervision objectives for discriminative and generative tasks,
for example, using LSTMs or Transformer-based architectures (Alley et al., 2019; Bepler & Berger,
2019; Rao et al., 2019; Rives et al., 2019).
TAPE created a benchmark of five tasks to assess protein
sequence models,
and ProtTrans also released
several large-scale pretrained protein Transformer
models (Elnaggar et al., 2020).
Riesselman et al. (2019); Madani et al. (2020) trained autoregressive
generative models to predict the functional effect of mutations and generate natural-like proteins.
From an interpretability perspective, Rives et al. (2019) showed that the output embeddings from
a pretrained Transformer can recapitulate structural and functional properties of proteins through
learned linear transformations.
Various works have analyzed output embeddings of protein models
through dimensionality reduction techniques such as PCA or t-SNE (Elnaggar et al., 2020; Biswas
et al., 2020).
In our work, we take an interpretability-first perspective to focus on the internal model
representations, specifically attention and intermediate hidden states, across multiple protein language
models.
We also explore novel biological properties including binding sites and post-translational
modifications.
5.2
I
NTERPRETING
M
ODELS
IN
NLP
The rise of deep neural networks in ML has also led to much work on interpreting these so-called
black-box models.
This section reviews the NLP interpretability literature on the Transformer model,
which is directly comparable to our work on interpreting Transformer models of protein sequences.
Interpreting
Transformers.
The
Transformer
is
a
neural
architecture
that
uses
attention
to
ac-
celerate learning (Vaswani et al., 2017).
In NLP, transformers are the backbone of state-of-the-art
pre-trained language models such as BERT (Devlin et al., 2019).
BERTology
focuses on interpreting
what the BERT model learns about language using a suite of probes and interventions (Rogers et al.,
2020).
So-called
diagnostic classifiers
are used to interpret the outputs from BERT’s layers (Veldhoen
et
al.,
2016).
At
a
high
level,
mechanisms
for
interpreting
BERT
can
be
placed
into
three
main
categories:
interpreting the learned embeddings (Ethayarajh, 2019; Wiedemann et al., 2019; Mickus
et al., 2020; Adi et al., 2016; Conneau et al., 2018), BERT’s learned knowledge of syntax (Lin et al.,
2019; Liu et al., 2019; Tenney et al., 2019; Htut et al., 2019; Hewitt & Manning, 2019; Goldberg,
2019), and BERT’s learned knowledge of semantics (Tenney et al., 2019; Ettinger, 2020).
Interpreting
attention
specifically.
Interpreting
attention
on
textual
sequences
is
a
well-
established area of research (Wiegreffe & Pinter, 2019; Zhong et al., 2019; Brunner et al., 2020;
Hewitt & Manning, 2019).
Past work has been shown that attention correlates with syntactic and
semantic relationships in natural language in some cases (Clark et al., 2019; Vig & Belinkov, 2019;
Htut et al., 2019).
Depending on the task and model architecture, attention may have less or more
explanatory power for model predictions (Jain & Wallace, 2019; Serrano & Smith, 2019; Pruthi et al.,
2020; Moradi et al., 2019; Vashishth et al., 2019).
Visualization techniques have been used to convey
the structure and properties of attention in Transformers (Vaswani et al., 2017; Kovaleva et al., 2019;
Hoover et al., 2020; Vig, 2019).
Recent work has begun to analyze attention in Transformer models
outside of the domain of natural language (Schwaller et al., 2020; Payne et al., 2020).
Our work extends these methods to protein sequence models by considering particular biophysical
properties and relationships.
We also present a joint cross-layer probing analysis of attention weights
and layer embeddings.
While past work in NLP has analyzed attention and embeddings across layers,
we believe we are the first to do so in any domain using a single, unified metric, which enables us to
8
Published as a conference paper at ICLR 2021
directly compare the relative information content of the two representations.
Finally, we present a
novel tool for visualizing attention embedded in three-dimensional structure.
6
C
ONCLUSIONS
AND
F
UTURE
W
ORK
This paper builds on the synergy between NLP and computational biology by adapting and extending
NLP interpretability methods to protein sequence modeling.
We show how a Transformer language
model recovers structural and functional properties of proteins and integrates this knowledge directly
into its attention mechanism.
While this paper focuses on reconciling attention with known properties
of proteins, one might also leverage attention to uncover novel relationships or more nuanced forms
of existing measures such as contact maps, as discussed in Section 4.1.
In this way, language models
have the potential to serve as tools for scientific discovery.
But in order for learned representations
to be accessible to domain experts,
they must be presented in an appropriate context to facilitate
discovery.
Visualizing attention in the context of protein structure (Figure 1) is one attempt to do so.
We believe there is the potential to develop such contextual visualizations of learned representations
in a range of scientific domains.
A
CKNOWLEDGMENTS
We would like to thank Xi Victoria Lin,
Stephan Zheng,
Melvin Gruesbeck,
and the anonymous
reviewers for their valuable feedback.
R
EFERENCES
Yossi Adi, Einat Kermany, Yonatan Belinkov, Ofer Lavi, and Yoav Goldberg.
Fine-grained analysis
of sentence embeddings using auxiliary prediction tasks.
arXiv:1608.04207 [cs.CL]., 2016.
Ethan C Alley, Grigory Khimulya, Surojit Biswas, Mohammed AlQuraishi, and George M Church.
Unified rational protein engineering with sequence-based deep representation learning.
Nature
Methods
, 16(12):1315–1322, 2019.
Mohammed AlQuraishi.
ProteinNet:
a standardized data set for machine learning of protein structure.
BMC Bioinformatics
, 20, 2019.
Ehsaneddin Asgari and Mohammad RK Mofrad.
Continuous distributed representation of biological
sequences for deep proteomics and genomics.
PLOS One
, 10(11), 2015.
Tristan Bepler and Bonnie Berger.
Learning protein sequence embeddings using information from
structure.
In
International Conference on Learning Representations
, 2019.
Helen M Berman, John Westbrook, Zukang Feng, Gary Gilliland, Talapady N Bhat, Helge Weissig,
Ilya N Shindyalov, and Philip E Bourne.
The protein data bank.
Nucleic Acids Research
, 28(1):
235–242, 2000.
Surojit
Biswas,
Grigory
Khimulya,
Ethan
C.
Alley,
Kevin
M.
Esvelt,
and
George
M.
Church.
Low-n
protein
engineering
with
data-efficient
deep
learning.
bioRxiv
,
2020.
doi:
10.1101/
2020.01.23.917682.
URL
https://www.biorxiv.org/content/early/2020/08/
31/2020.01.23.917682
.
Ashraf
Brik
and
Chi-Huey
Wong.
HIV-1
protease:
Mechanism
and
drug
discovery.
Organic
&
Biomolecular Chemistry
, 1(1):5–14, 2003.
Gino Brunner, Yang Liu, Damian Pascual, Oliver Richter, Massimiliano Ciaramita, and Roger Watten-
hofer. On identifiability in Transformers. In
International Conference on Learning Representations
,
2020.
URL
https://openreview.net/forum?id=BJg1f6EFDB
.
Kevin Clark, Urvashi Khandelwal, Omer Levy, and Christopher D. Manning.
What does BERT look
at?
An analysis of BERT’s attention.
In
BlackBoxNLP@ACL
, 2019.
9
Published as a conference paper at ICLR 2021
Alexis Conneau, German Kruszewski, Guillaume Lample, Loïc Barrault, and Marco Baroni.
What
you can cram into a single $&!#* vector:
Probing sentence embeddings for linguistic properties.
In
Proceedings of the 56th Annual Meeting of the Association for Computational Linguistics
, pp.
2126–2136, 2018.
Jacob Devlin, Ming-Wei Chang, Kenton Lee, and Kristina Toutanova.
BERT: Pre-training of deep
bidirectional transformers for language understanding.
In
Proceedings of the 2019 Conference of
the North American Chapter of the Association for Computational Linguistics:
Human Language
Technologies, Volume 1 (Long and Short Papers)
, pp. 4171–4186, Minneapolis, Minnesota, 2019.
Association for Computational Linguistics.
Sara
El-Gebali,
Jaina
Mistry,
Alex
Bateman,
Sean
R.
Eddy,
Aurélien
Luciani,
Simon
C.
Potter,
Matloob Qureshi, Lorna J. Richardson, Gustavo A. Salazar, Alfredo Smart, Erik L. L. Sonnhammer,
Layla Hirsh, Lisanna Paladin, Damiano Piovesan, Silvio C. E. Tosatto, and Robert D. Finn.
The
Pfam protein families database in 2019.
Nucleic Acids Research
, 47(D1):D427–D432, January
2019a.
doi:
10.1093/nar/gky995.
Sara El-Gebali, Jaina Mistry, Alex Bateman, Sean R Eddy, Aurélien Luciani, Simon C Potter, Matloob
Qureshi, Lorna J Richardson, Gustavo A Salazar, Alfredo Smart, Erik L L Sonnhammer, Layla
Hirsh, Lisanna Paladin, Damiano Piovesan, Silvio C E Tosatto, and Robert D Finn.
The Pfam
protein families database in 2019.
Nucleic Acids Research
, 47(D1):D427–D432, 2019b.
ISSN
0305-1048.
doi:
10.1093/nar/gky995.
Ahmed Elnaggar, Michael Heinzinger, Christian Dallago, Ghalia Rihawi, Yu Wang, Llion Jones, Tom
Gibbs, Tamas Feher, Christoph Angerer, Martin Steinegger, Debsindhu Bhowmik, and Burkhard
Rost.
ProtTrans:
Towards
cracking
the
language
of
life’s
code
through
self-supervised
deep
learning and high performance computing.
arXiv preprint arXiv:2007.06225
, 2020.
Kawin Ethayarajh. How contextual are contextualized word representations? Comparing the geometry
of BERT, ELMo, and GPT-2 embeddings.
In
Proceedings of the 2019 Conference on Empirical
Methods in Natural Language Processing and the 9th International Joint Conference on Natural
Language Processing (EMNLP-IJCNLP)
, pp. 55–65, Hong Kong, China, 2019. Association for
Computational Linguistics.
Allyson Ettinger.
What BERT is not:
Lessons from a new suite of psycholinguistic diagnostics for
language models.
Transactions of the Association for Computational Linguistics
, 8:34–48, 2020.
Naomi K Fox, Steven E Brenner, and John-Marc Chandonia.
SCOPe:
Structural classification of
proteins—extended, integrating scop and astral data and classification of new structures.
Nucleic
Acids Research
, 42(D1):D304–D309, 2013.
Yoav Goldberg.
Assessing BERT’s syntactic abilities.
arXiv preprint arXiv:1901.05287
, 2019.
Christopher Grimsley, Elijah Mayfield, and Julia R.S. Bursten.
Why attention is not explanation:
Surgical
intervention
and
causal
reasoning
about
neural
models.
In
Proceedings
of
The
12th
Language Resources and Evaluation Conference
, pp. 1780–1790, Marseille, France, May 2020.
European Language Resources Association.
ISBN 979-10-95546-34-4.
URL
https://www.
aclweb.org/anthology/2020.lrec-1.220
.
S Henikoff and J G Henikoff.
Amino acid substitution matrices from protein blocks.
Proceedings of
the National Academy of Sciences
, 89(22):10915–10919, 1992.
ISSN 0027-8424.
doi:
10.1073/
pnas.89.22.10915.
URL
https://www.pnas.org/content/89/22/10915
.
John Hewitt and Christopher D Manning. A structural probe for finding syntax in word representations.
In
Proceedings
of
the
2019
Conference
of
the
North
American
Chapter
of
the
Association
for
Computational Linguistics:
Human Language Technologies, Volume 1 (Long and Short Papers)
,
pp. 4129–4138, 2019.
Benjamin Hoover, Hendrik Strobelt, and Sebastian Gehrmann.
exBERT: A Visual Analysis Tool
to Explore Learned Representations in Transformer Models.
In
Proceedings of the 58th Annual
Meeting of the Association for Computational Linguistics:
System Demonstrations
, pp. 187–196.
Association for Computational Linguistics, 2020.
10
Published as a conference paper at ICLR 2021
Phu Mon Htut, Jason Phang, Shikha Bordia, and Samuel R Bowman.
Do attention heads in BERT
track syntactic dependencies?
arXiv preprint arXiv:1911.12246
, 2019.
Sarthak
Jain
and
Byron
C.
Wallace.
Attention
is
not
Explanation.
In
Proceedings
of
the
2019
Conference
of
the
North
American
Chapter
of
the
Association
for
Computational
Linguistics:
Human Language Technologies, Volume 1 (Long and Short Papers)
, pp. 3543–3556, June 2019.
Ganesh Jawahar, Benoît Sagot, and Djamé Seddah.
What does BERT learn about the structure of
language?
In
ACL 2019 - 57th Annual Meeting of the Association for Computational Linguistics
,
Florence, Italy, July 2019.
URL
https://hal.inria.fr/hal-02131630
.
Akira Kinjo and Haruki Nakamura.
Comprehensive structural classification of ligand-binding motifs
in proteins.
Structure
, 17(2), 2009.
Michael Schantz Klausen, Martin Closter Jespersen, Henrik Nielsen, Kamilla Kjaergaard Jensen,
Vanessa
Isabell
Jurtz,
Casper
Kaae
Soenderby,
Morten
Otto
Alexander
Sommer,
Ole
Winther,
Morten Nielsen,
Bent Petersen,
et al.
NetSurfP-2.0:
Improved prediction of protein structural
features by integrated deep learning.
Proteins:
Structure, Function, and Bioinformatics
, 2019.
Olga Kovaleva, Alexey Romanov, Anna Rogers, and Anna Rumshisky.
Revealing the dark secrets
of BERT.
In
Proceedings of the 2019 Conference on Empirical Methods in Natural Language
Processing and the 9th International Joint Conference on Natural Language Processing (EMNLP-
IJCNLP)
, pp. 4365–4374, Hong Kong, China, 2019. Association for Computational Linguistics.
Keita Kurita,
Nidhi Vyas,
Ayush Pareek,
Alan W Black,
and Yulia Tsvetkov.
Measuring bias in
contextualized word representations.
In
Proceedings of the First Workshop on Gender Bias in
Natural Language Processing
, pp. 166–172, Florence, Italy, 2019. Association for Computational
Linguistics.
Zhenzhong Lan, Mingda Chen, Sebastian Goodman, Kevin Gimpel, Piyush Sharma, and Radu Soricut.
Albert:
A
lite
bert
for
self-supervised
learning
of
language
representations.
In
International
Conference on Learning Representations
, 2020.
Juyong Lee, Janez Konc, Dusanka Janezic, and Bernard Brooks.
Global organization of a binding
site network gives insight into evolution and structure-function relationships of proteins.
Sci Rep
, 7
(11652), 2017.
Yongjie
Lin,
Yi
Chern
Tan,
and
Robert
Frank.
Open
sesame:
Getting
inside
BERT’s
linguistic
knowledge.
In
Proceedings of the 2019 ACL Workshop BlackboxNLP: Analyzing and Interpreting
Neural
Networks
for
NLP
,
pp.
241–253,
Florence,
Italy,
2019.
Association
for
Computational
Linguistics.
Nelson F. Liu, Matt Gardner, Yonatan Belinkov, Matthew E. Peters, and Noah A. Smith.
Linguistic
knowledge and transferability of contextual representations. In
Proceedings of the 2019 Conference
of the North American Chapter of the Association for Computational Linguistics: Human Language
Technologies, Volume 1 (Long and Short Papers)
, pp. 1073–1094. Association for Computational
Linguistics, 2019.
Ali Madani, Bryan McCann, Nikhil Naik, Nitish Shirish Keskar, Namrata Anand, Raphael R. Eguchi,
Po-Ssu Huang, and Richard Socher.
Progen:
Language modeling for protein generation.
arXiv
preprint arXiv:2004.03497
, 2020.
Timothee Mickus, Mathieu Constant, Denis Paperno, and Kees Van Deemter.
What do you mean,
BERT? Assessing BERT as a Distributional Semantics Model.
Proceedings of the Society for
Computation in Linguistics
, 3, 2020.
Tomas Mikolov, Ilya Sutskever, Kai Chen, Greg S Corrado, and Jeff Dean. Distributed representations
of
words
and
phrases
and
their
compositionality.
In
C.
J.
C.
Burges,
L.
Bottou,
M.
Welling,
Z. Ghahramani, and K. Q. Weinberger (eds.),
Advances in Neural Information Processing Systems
26
, pp. 3111–3119. Curran Associates, Inc., 2013.
11
Published as a conference paper at ICLR 2021
Pooya
Moradi,
Nishant
Kambhatla,
and
Anoop
Sarkar.
Interrogating
the
explanatory
power
of
attention in neural machine translation.
In
Proceedings of the 3rd Workshop on Neural Generation
and
Translation
,
pp.
221–230,
Hong
Kong,
November
2019.
Association
for
Computational
Linguistics.
doi:
10.18653/v1/D19-5624.
URL
https://www.aclweb.org/anthology/
D19-5624
.
John
Moult,
Krzysztof
Fidelis,
Andriy
Kryshtafovych,
Torsten
Schwede,
and
Anna
Tramontano.
Critical
assessment
of
methods
of
protein
structure
prediction
(CASP)-Round
XII.
Proteins:
Structure, Function, and Bioinformatics
, 86:7–15, 2018.
ISSN 08873585.
doi:
10.1002/prot.25415.
URL
http://doi.wiley.com/10.1002/prot.25415
.
Hai Nguyen, David A Case, and Alexander S Rose.
NGLview–interactive molecular graphics for
Jupyter notebooks.
Bioinformatics
, 34(7):1241–1242, 12 2017.
ISSN 1367-4803.
doi:
10.1093/
bioinformatics/btx789.
URL
https://doi.org/10.1093/bioinformatics/btx789
.
Timothy
Niven
and
Hung-Yu
Kao.
Probing
neural
network
comprehension
of
natural
language
arguments.
In
Proceedings
of
the
57th
Annual
Meeting
of
the
Association
for
Computational
Linguistics
, pp. 4658–4664, Florence, Italy, 2019. Association for Computational Linguistics.
Josh Payne, Mario Srouji, Dian Ang Yap, and Vineet Kosaraju.
Bert learns (and teaches) chemistry.
arXiv preprint arXiv:2007.16012
, 2020.
Matthew
Peters,
Mark
Neumann,
Luke
Zettlemoyer,
and
Wen-tau
Yih.
Dissecting
contextual
word embeddings:
Architecture and representation.
In
Proceedings of the 2018 Conference on
Empirical Methods in Natural Language Processing
, pp. 1499–1509, Brussels, Belgium, October-
November 2018. Association for Computational Linguistics.
doi:
10.18653/v1/D18-1179.
URL
https://www.aclweb.org/anthology/D18-1179
.
Danish Pruthi, Mansi Gupta, Bhuwan Dhingra, Graham Neubig, and Zachary C. Lipton.
Learning to
deceive with attention-based explanations.
In
Annual Conference of the Association for Computa-
tional Linguistics (ACL)
, July 2020.
URL
https://arxiv.org/abs/1909.07913
.
Alessandro Raganato and Jörg Tiedemann.
An analysis of encoder representations in Transformer-
based machine translation. In
Proceedings of the 2018 EMNLP Workshop BlackboxNLP: Analyzing
and Interpreting Neural Networks for NLP
, pp. 287–297,
Brussels,
Belgium,
November 2018.
Association for Computational Linguistics.
doi:
10.18653/v1/W18-5431.
URL
https://www.
aclweb.org/anthology/W18-5431
.
Roshan Rao, Nicholas Bhattacharya, Neil Thomas, Yan Duan, Xi Chen, John Canny, Pieter Abbeel,
and
Yun
S
Song.
Evaluating
protein
transfer
learning
with
TAPE.
In
Advances
in
Neural
Information Processing Systems
, 2019.
Emily Reif, Ann Yuan, Martin Wattenberg, Fernanda B Viegas, Andy Coenen, Adam Pearce, and
Been
Kim.
Visualizing
and
measuring
the
geometry
of
BERT.
In
H.
Wallach,
H.
Larochelle,
A. Beygelzimer, F. d
'
Alché-Buc, E. Fox, and R. Garnett (eds.),
Advances in Neural Information
Processing Systems
, volume 32, pp. 8594–8603. Curran Associates, Inc., 2019.
Adam
J
Riesselman,
Jung-Eun
Shin,
Aaron
W
Kollasch,
Conor
McMahon,
Elana
Simon,
Chris
Sander, Aashish Manglik, Andrew C Kruse, and Debora S Marks.
Accelerating protein design
using autoregressive generative models.
bioRxiv
, pp. 757252, 2019.
Alexander Rives, Siddharth Goyal, Joshua Meier, Demi Guo, Myle Ott, C Lawrence Zitnick, Jerry
Ma, and Rob Fergus.
Biological structure and function emerge from scaling unsupervised learning
to 250 million protein sequences.
bioRxiv
, pp. 622803, 2019.
Anna Rogers, Olga Kovaleva, and Anna Rumshisky.
A primer in BERTology:
What we know about
how BERT works.
Transactions of the Association for Computational Linguistics
, 8:842–866,
2020.
Nathan J Rollins, Kelly P Brock, Frank J Poelwijk, Michael A Stiffler, Nicholas P Gauthier, Chris
Sander, and Debora S Marks.
Inferring protein 3D structure from deep mutation scans.
Nature
Genetics
, 51(7):1170, 2019.
12
Published as a conference paper at ICLR 2021
Alexander
S.
Rose
and
Peter
W.
Hildebrand.
NGL
Viewer:
a
web
application
for
molecular
vi-
sualization.
Nucleic
Acids
Research
,
43(W1):W576–W579,
04
2015.
ISSN
0305-1048.
doi:
10.1093/nar/gkv402.
URL
https://doi.org/10.1093/nar/gkv402
.
Alexander S Rose, Anthony R Bradley, Yana Valasatava, Jose M Duarte, Andreas Prli´c, and Peter W
Rose.
NGL viewer:
web-based molecular graphics for large complexes.
Bioinformatics
, 34(21):
3755–3758,
05
2018.
ISSN
1367-4803.
doi:
10.1093/bioinformatics/bty419.
URL
https:
//doi.org/10.1093/bioinformatics/bty419
.
Charles Rubin and Ora Rosen.
Protein phosphorylation.
Annual Review of Biochemistry
, 44:831–887,
1975.
URL
https://doi.org/10.1146/annurev.bi.44.070175.004151
.
Philippe
Schwaller,
Benjamin
Hoover,
Jean-Louis
Reymond,
Hendrik
Strobelt,
and
Teodoro
Laino.
Unsupervised
attention-guided
atom-mapping.
ChemRxiv
,
5
2020.
doi:
10.26434/
chemrxiv.12298559.v1.
URL
https://chemrxiv.org/articles/Unsupervised_
Attention-Guided_Atom-Mapping/12298559
.
Sofia Serrano and Noah A. Smith.
Is attention interpretable?
In
Proceedings of the 57th Annual
Meeting of the Association for Computational Linguistics
, pp. 2931–2951, Florence, Italy, July
2019. Association for Computational Linguistics.
doi:
10.18653/v1/P19-1282.
URL
https:
//www.aclweb.org/anthology/P19-1282
.
Martin Steinegger and Johannes Söding.
Clustering huge protein sequence sets in linear time.
Nature
Communications
, 9(2542), 2018.
doi:
10.1038/s41467-018-04964-5.
Baris E. Suzek, Yuqi Wang, Hongzhan Huang, Peter B. McGarvey, Cathy H. Wu, and the UniProt Con-
sortium.
UniRef
clusters:
a
comprehensive
and
scalable
alternative
for
improving
sequence
similarity searches.
Bioinformatics
, 31(6):926–932, 11 2014.
ISSN 1367-4803.
doi:
10.1093/
bioinformatics/btu739.
URL
https://doi.org/10.1093/bioinformatics/btu739
.
Yi Chern Tan and L. Elisa Celis.
Assessing social and intersectional biases in contextualized word
representations.
In
Advances in Neural Information Processing Systems 32
, pp. 13230–13241.
Curran Associates, Inc., 2019.
Ian
Tenney,
Dipanjan
Das,
and
Ellie
Pavlick.
BERT
rediscovers
the
classical
NLP
pipeline.
In
Proceedings of the 57th Annual Meeting of the Association for Computational Linguistics
,
pp.
4593–4601, Florence, Italy, 2019. Association for Computational Linguistics.
Shikhar Vashishth, Shyam Upadhyay, Gaurav Singh Tomar, and Manaal Faruqui.
Attention inter-
pretability across NLP tasks.
arXiv preprint arXiv:1909.11218
, 2019.
Ashish Vaswani, Noam Shazeer, Niki Parmar, Jakob Uszkoreit, Llion Jones, Aidan N Gomez, Łukasz
Kaiser,
and
Illia
Polosukhin.
Attention
is
all
you
need.
In
Advances
in
Neural
Information
Processing Systems
, pp. 5998–6008, 2017.
Sara Veldhoen,
Dieuwke Hupkes,
and Willem H. Zuidema.
Diagnostic classifiers revealing how
neural networks process hierarchical structure.
In
CoCo@NIPS
, 2016.
Jesse Vig.
A multiscale visualization of attention in the Transformer model.
In
Proceedings of the
57th Annual Meeting of the Association for Computational Linguistics:
System Demonstrations
,
pp. 37–42, Florence, Italy, 2019. Association for Computational Linguistics.
Jesse Vig and Yonatan Belinkov.
Analyzing the structure of attention in a Transformer language
model.
In
Proceedings
of
the
2019
ACL
Workshop
BlackboxNLP:
Analyzing
and
Interpreting
Neural
Networks
for
NLP
,
pp.
63–76,
Florence,
Italy,
2019.
Association
for
Computational
Linguistics.
Jesse Vig, Sebastian Gehrmann, Yonatan Belinkov, Sharon Qian, Daniel Nevo, Yaron Singer, and
Stuart Shieber.
Investigating gender bias in language models using causal mediation analysis.
In
Advances in Neural Information Processing Systems
, volume 33, pp. 12388–12401, 2020.
Gregor
Wiedemann,
Steffen
Remus,
Avi
Chawla,
and
Chris
Biemann.
Does
BERT
make
any
sense?
Interpretable word sense disambiguation with contextualized embeddings.
arXiv preprint
arXiv:1909.10430
, 2019.
13
Published as a conference paper at ICLR 2021
Sarah
Wiegreffe
and
Yuval
Pinter.
Attention
is
not
not
explanation.
In
Proceedings
of
the
2019
Conference on Empirical Methods in Natural Language Processing and the 9th International Joint
Conference on Natural Language Processing (EMNLP-IJCNLP)
, pp. 11–20, November 2019.
Zhilin
Yang,
Zihang
Dai,
Yiming
Yang,
Jaime
Carbonell,
Russ
R
Salakhutdinov,
and
Quoc
V
Le.
XLNet:
Generalized autoregressive pretraining for language understanding.
In H. Wallach,
H. Larochelle, A. Beygelzimer, F. d
'
Alché-Buc, E. Fox, and R. Garnett (eds.),
Advances in Neural
Information Processing Systems
, volume 32, pp. 5753–5763. Curran Associates, Inc., 2019.
Ruiqi Zhong, Steven Shao, and Kathleen McKeown.
Fine-grained sentiment analysis with faithful
attention.
arXiv preprint arXiv:1908.06870
, 2019.
14
Published as a conference paper at ICLR 2021
A
M
ODEL
O
VERVIEW
A.1
P
RE
-T
RAINED
M
ODELS
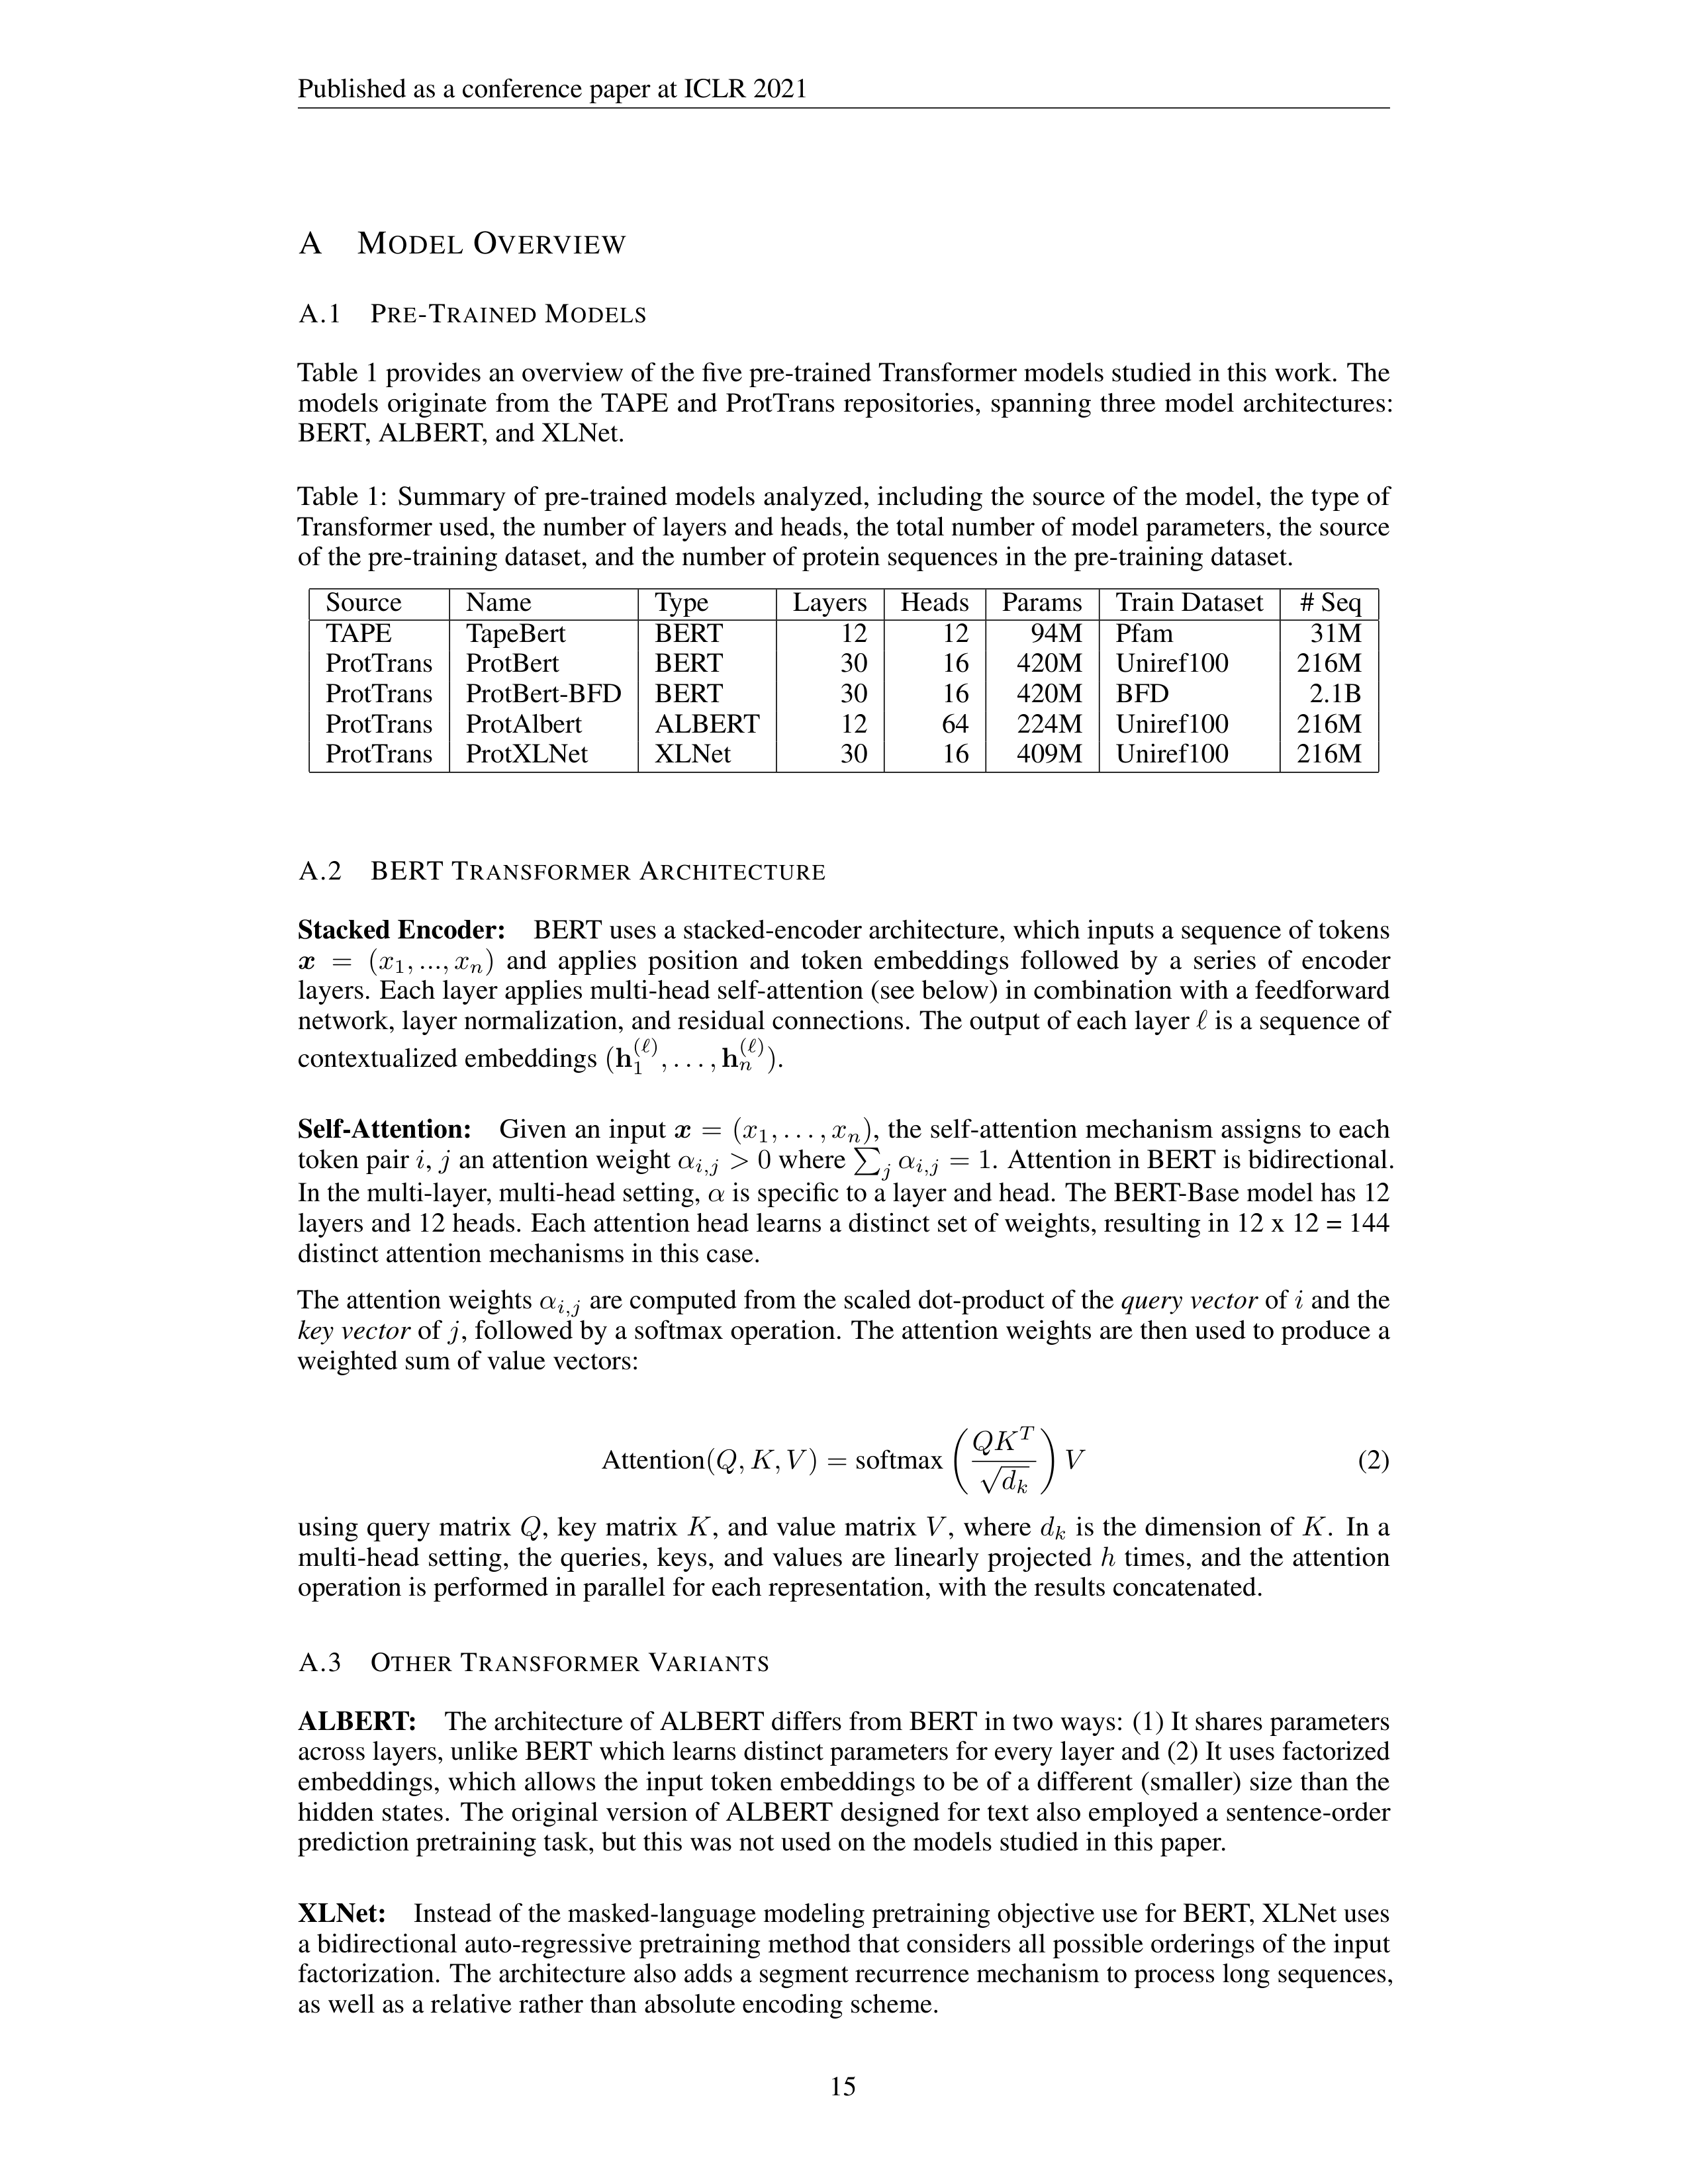
Table 1 provides an overview of the five pre-trained Transformer models studied in this work.
The
models
originate
from
the
TAPE
and
ProtTrans
repositories,
spanning
three
model
architectures:
BERT, ALBERT, and XLNet.
Table 1:
Summary of pre-trained models analyzed, including the source of the model, the type of
Transformer used, the number of layers and heads, the total number of model parameters, the source
of the pre-training dataset, and the number of protein sequences in the pre-training dataset.
Source
Name
Type
Layers
Heads
Params
Train Dataset
# Seq
TAPE
TapeBert
BERT
12
12
94M
Pfam
31M
ProtTrans
ProtBert
BERT
30
16
420M
Uniref100
216M
ProtTrans
ProtBert-BFD
BERT
30
16
420M
BFD
2.1B
ProtTrans
ProtAlbert
ALBERT
12
64
224M
Uniref100
216M
ProtTrans
ProtXLNet
XLNet
30
16
409M
Uniref100
216M
A.2
BERT
T
RANSFORMER
A
RCHITECTURE
Stacked Encoder:
BERT uses a stacked-encoder architecture, which inputs a sequence of tokens
x
=
(
x
1
, ..., x
n
)
and
applies
position
and
token
embeddings
followed
by
a
series
of
encoder
layers.
Each layer applies multi-head self-attention (see below) in combination with a feedforward
network, layer normalization, and residual connections.
The output of each layer
ℓ
is a sequence of
contextualized embeddings
(
h
(
ℓ
)
1
, . . . ,
h
(
ℓ
)
n
)
.
Self-Attention:
Given an input
x
=
(
x
1
, . . . , x
n
)
, the self-attention mechanism assigns to each
token pair
i
,
j
an attention weight
α
i,j
>
0
where
P
j
α
i,j
= 1
.
Attention in BERT is bidirectional.
In the multi-layer, multi-head setting,
α
is specific to a layer and head.
The BERT-Base model has 12
layers and 12 heads.
Each attention head learns a distinct set of weights, resulting in 12 x 12 = 144
distinct attention mechanisms in this case.
The attention weights
α
i,j
are computed from the scaled dot-product of the
query vector
of
i
and the
key vector
of
j
, followed by a softmax operation.
The attention weights are then used to produce a
weighted sum of value vectors:
Attention
(
Q, K, V
) =
softmax
QK
T
√
d
k
V
(2)
using query matrix
Q
,
key matrix
K
,
and value matrix
V
,
where
d
k
is the dimension of
K
.
In a
multi-head setting,
the queries,
keys,
and values are linearly projected
h
times,
and the attention
operation is performed in parallel for each representation, with the results concatenated.
A.3
O
THER
T
RANSFORMER
V
ARIANTS
ALBERT:
The architecture of ALBERT differs from BERT in two ways:
(1) It shares parameters
across layers, unlike BERT which learns distinct parameters for every layer and (2) It uses factorized
embeddings, which allows the input token embeddings to be of a different (smaller) size than the
hidden states.
The original version of ALBERT designed for text also employed a sentence-order
prediction pretraining task, but this was not used on the models studied in this paper.
XLNet:
Instead of the masked-language modeling pretraining objective use for BERT, XLNet uses
a bidirectional auto-regressive pretraining method that considers all possible orderings of the input
factorization.
The architecture also adds a segment recurrence mechanism to process long sequences,
as well as a relative rather than absolute encoding scheme.
15
Published as a conference paper at ICLR 2021
B
A
DDITIONAL
E
XPERIMENTAL
D
ETAILS
B.1
A
LTERNATIVE
ATTENTION
AGREEMENT
METRIC
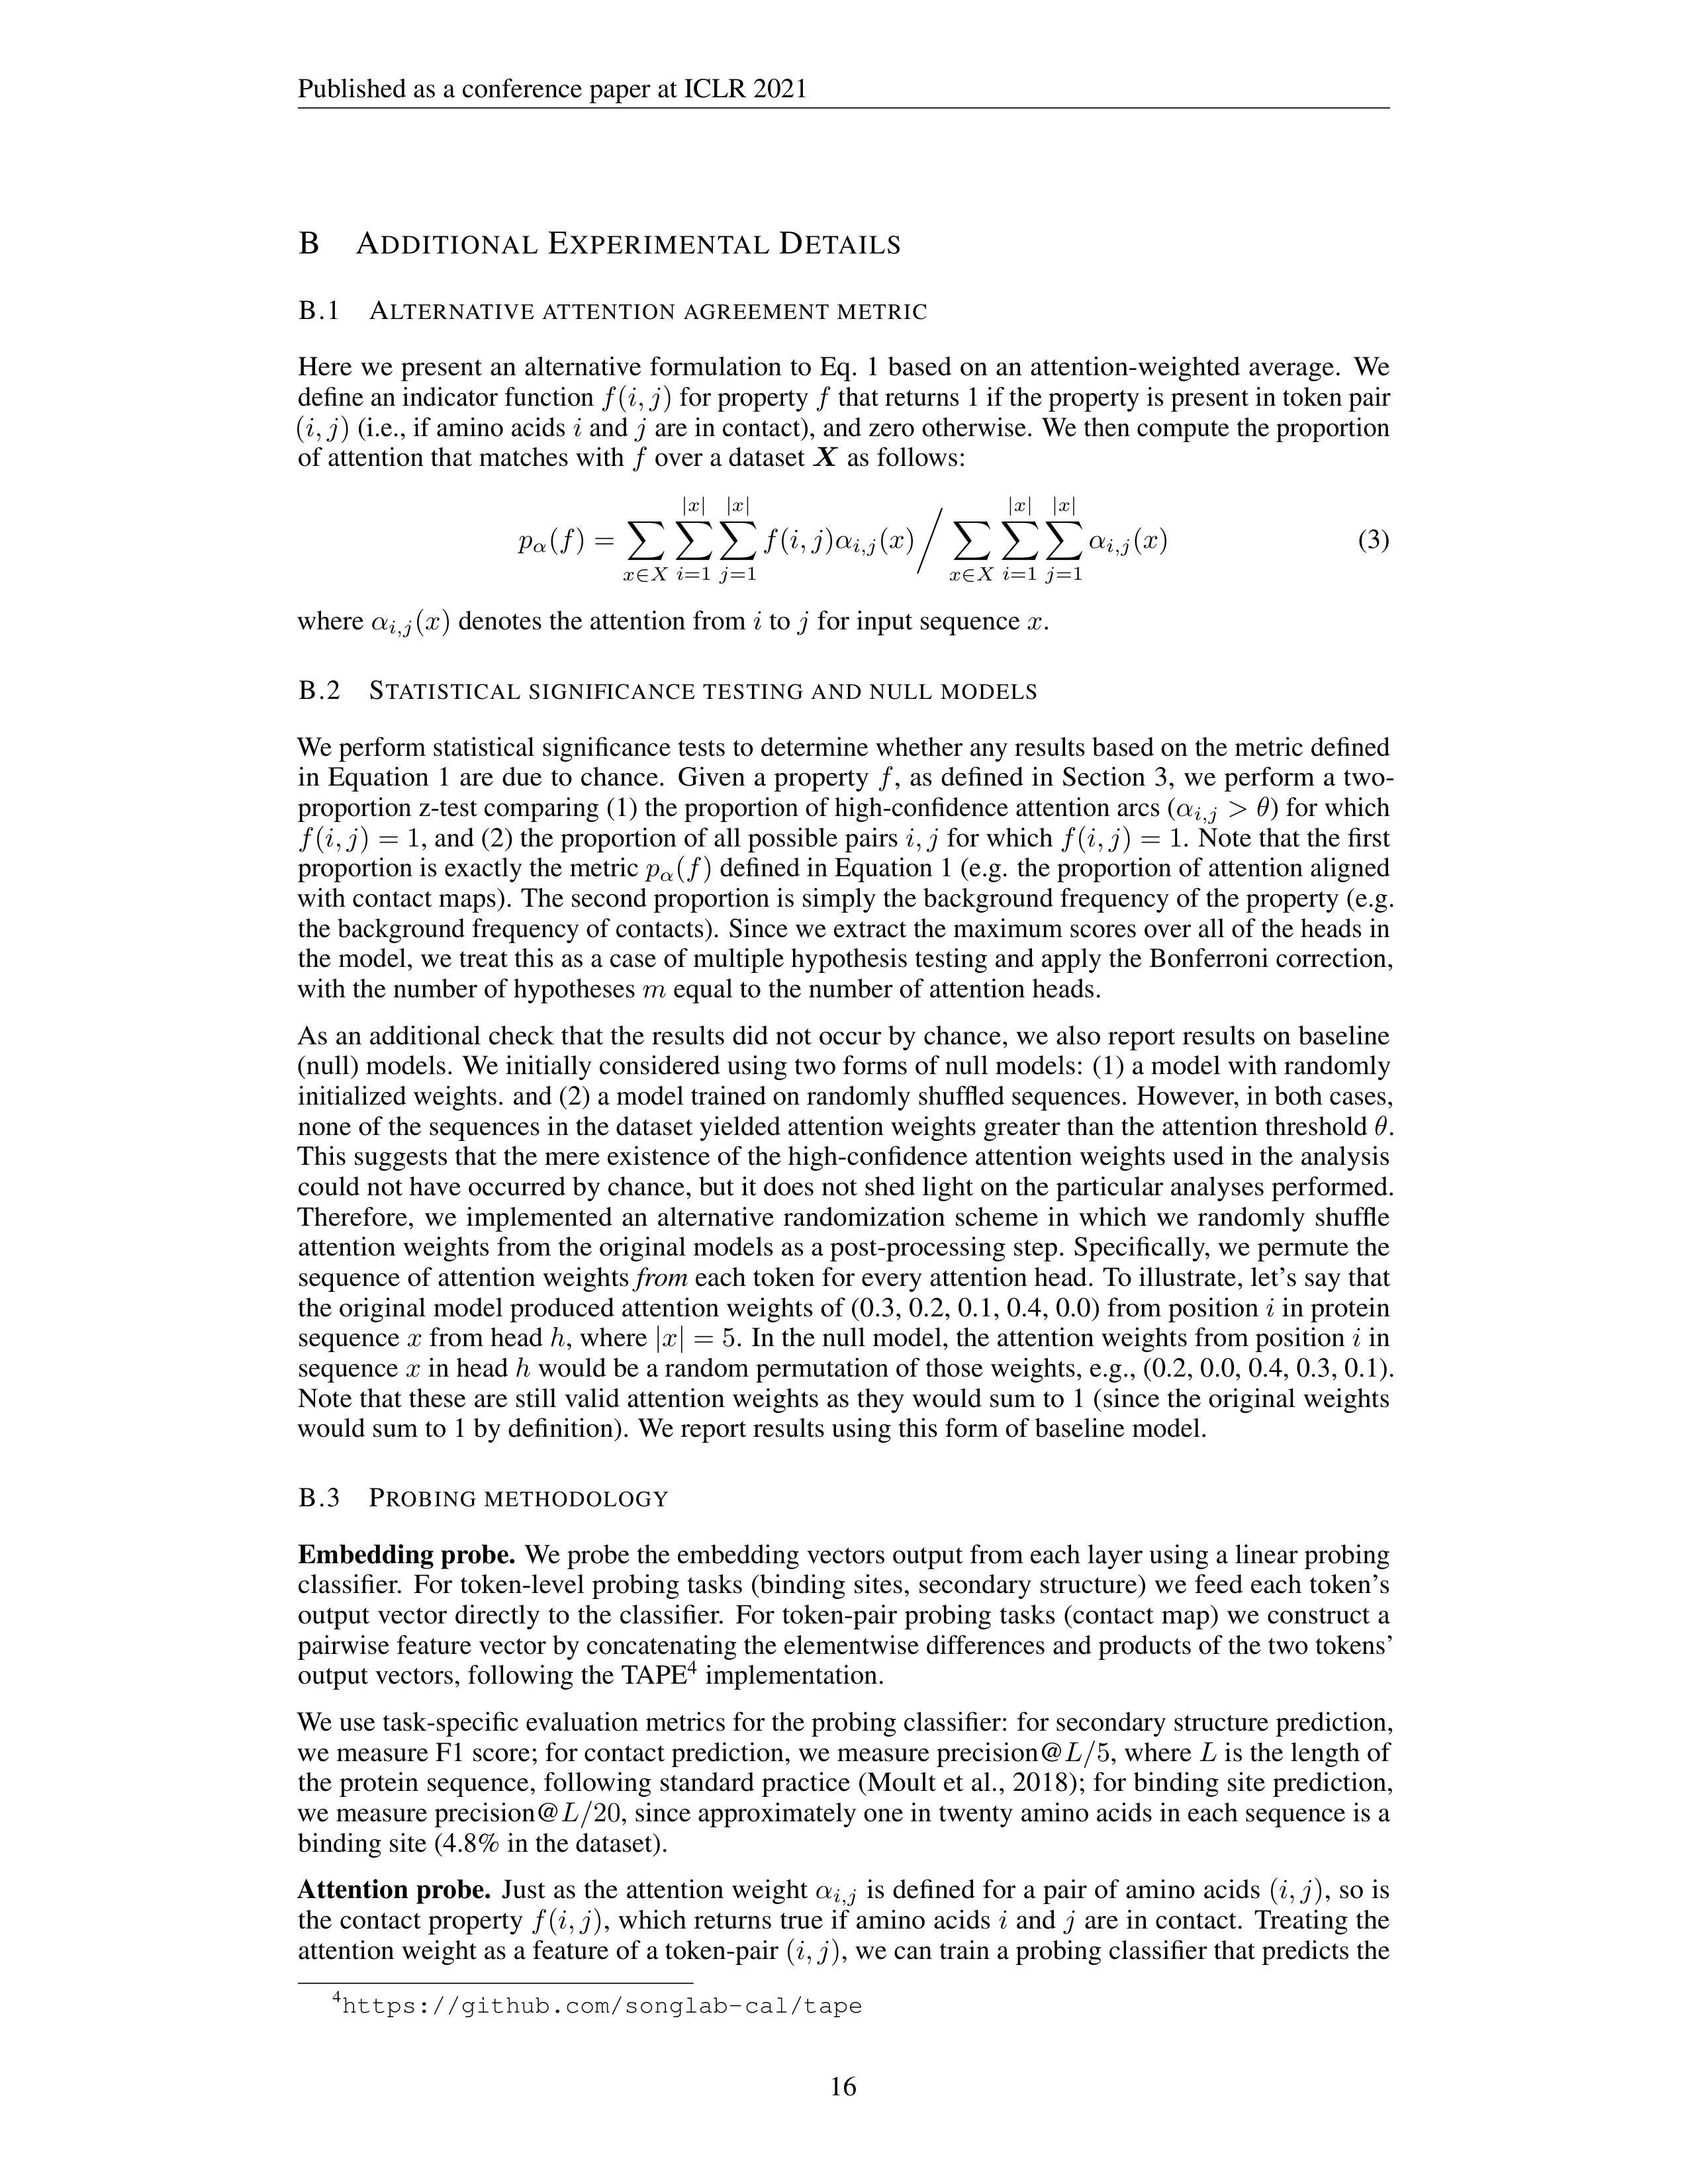
Here we present an alternative formulation to Eq. 1 based on an attention-weighted average.
We
define an indicator function
f
(
i, j
)
for property
f
that returns 1 if the property is present in token pair
(
i, j
)
(i.e., if amino acids
i
and
j
are in contact), and zero otherwise.
We then compute the proportion
of attention that matches with
f
over a dataset
X
as follows:
p
α
(
f
) =
X
x
∈
X
|
x
|
X
i
=1
|
x
|
X
j
=1
f
(
i, j
)
α
i,j
(
x
)
X
x
∈
X
|
x
|
X
i
=1
|
x
|
X
j
=1
α
i,j
(
x
)
(3)
where
α
i,j
(
x
)
denotes the attention from
i
to
j
for input sequence
x
.
B.2
S
TATISTICAL
SIGNIFICANCE
TESTING
AND
NULL
MODELS
We perform statistical significance tests to determine whether any results based on the metric defined
in Equation 1 are due to chance.
Given a property
f
,
as defined in Section 3,
we perform a two-
proportion z-test comparing (1) the proportion of high-confidence attention arcs (
α
i,j
> θ
) for which
f
(
i, j
) = 1
, and (2) the proportion of all possible pairs
i, j
for which
f
(
i, j
) = 1
.
Note that the first
proportion is exactly the metric
p
α
(
f
)
defined in Equation 1 (e.g.
the proportion of attention aligned
with contact maps).
The second proportion is simply the background frequency of the property (e.g.
the background frequency of contacts).
Since we extract the maximum scores over all of the heads in
the model, we treat this as a case of multiple hypothesis testing and apply the Bonferroni correction,
with the number of hypotheses
m
equal to the number of attention heads.
As an additional check that the results did not occur by chance, we also report results on baseline
(null) models.
We initially considered using two forms of null models:
(1) a model with randomly
initialized weights.
and (2) a model trained on randomly shuffled sequences.
However, in both cases,
none of the sequences in the dataset yielded attention weights greater than the attention threshold
θ
.
This suggests that the mere existence of the high-confidence attention weights used in the analysis
could not have occurred by chance, but it does not shed light on the particular analyses performed.
Therefore,
we
implemented
an
alternative
randomization
scheme
in
which
we
randomly
shuffle
attention weights from the original models as a post-processing step.
Specifically, we permute the
sequence of attention weights
from
each token for every attention head.
To illustrate, let’s say that
the original model produced attention weights of (0.3, 0.2, 0.1, 0.4, 0.0) from position
i
in protein
sequence
x
from head
h
, where
|
x
|
= 5
.
In the null model, the attention weights from position
i
in
sequence
x
in head
h
would be a random permutation of those weights, e.g., (0.2, 0.0, 0.4, 0.3, 0.1).
Note that these are still valid attention weights as they would sum to 1 (since the original weights
would sum to 1 by definition).
We report results using this form of baseline model.
B.3
P
ROBING
METHODOLOGY
Embedding probe.
We probe the embedding vectors output from each layer using a linear probing
classifier.
For token-level probing tasks (binding sites, secondary structure) we feed each token’s
output vector directly to the classifier.
For token-pair probing tasks (contact map) we construct a
pairwise feature vector by concatenating the elementwise differences and products of the two tokens’
output vectors, following the TAPE
4
implementation.
We use task-specific evaluation metrics for the probing classifier:
for secondary structure prediction,
we measure F1 score; for contact prediction, we measure precision@
L/
5
, where
L
is the length of
the protein sequence, following standard practice (Moult et al., 2018); for binding site prediction,
we measure precision@
L/
20
, since approximately one in twenty amino acids in each sequence is a
binding site (4.8% in the dataset).
Attention probe.
Just as the attention weight
α
i,j
is defined for a pair of amino acids
(
i, j
)
, so is
the contact property
f
(
i, j
)
, which returns true if amino acids
i
and
j
are in contact.
Treating the
attention weight as a feature of a token-pair
(
i, j
)
, we can train a probing classifier that predicts the
4
https://github.com/songlab-cal/tape
16
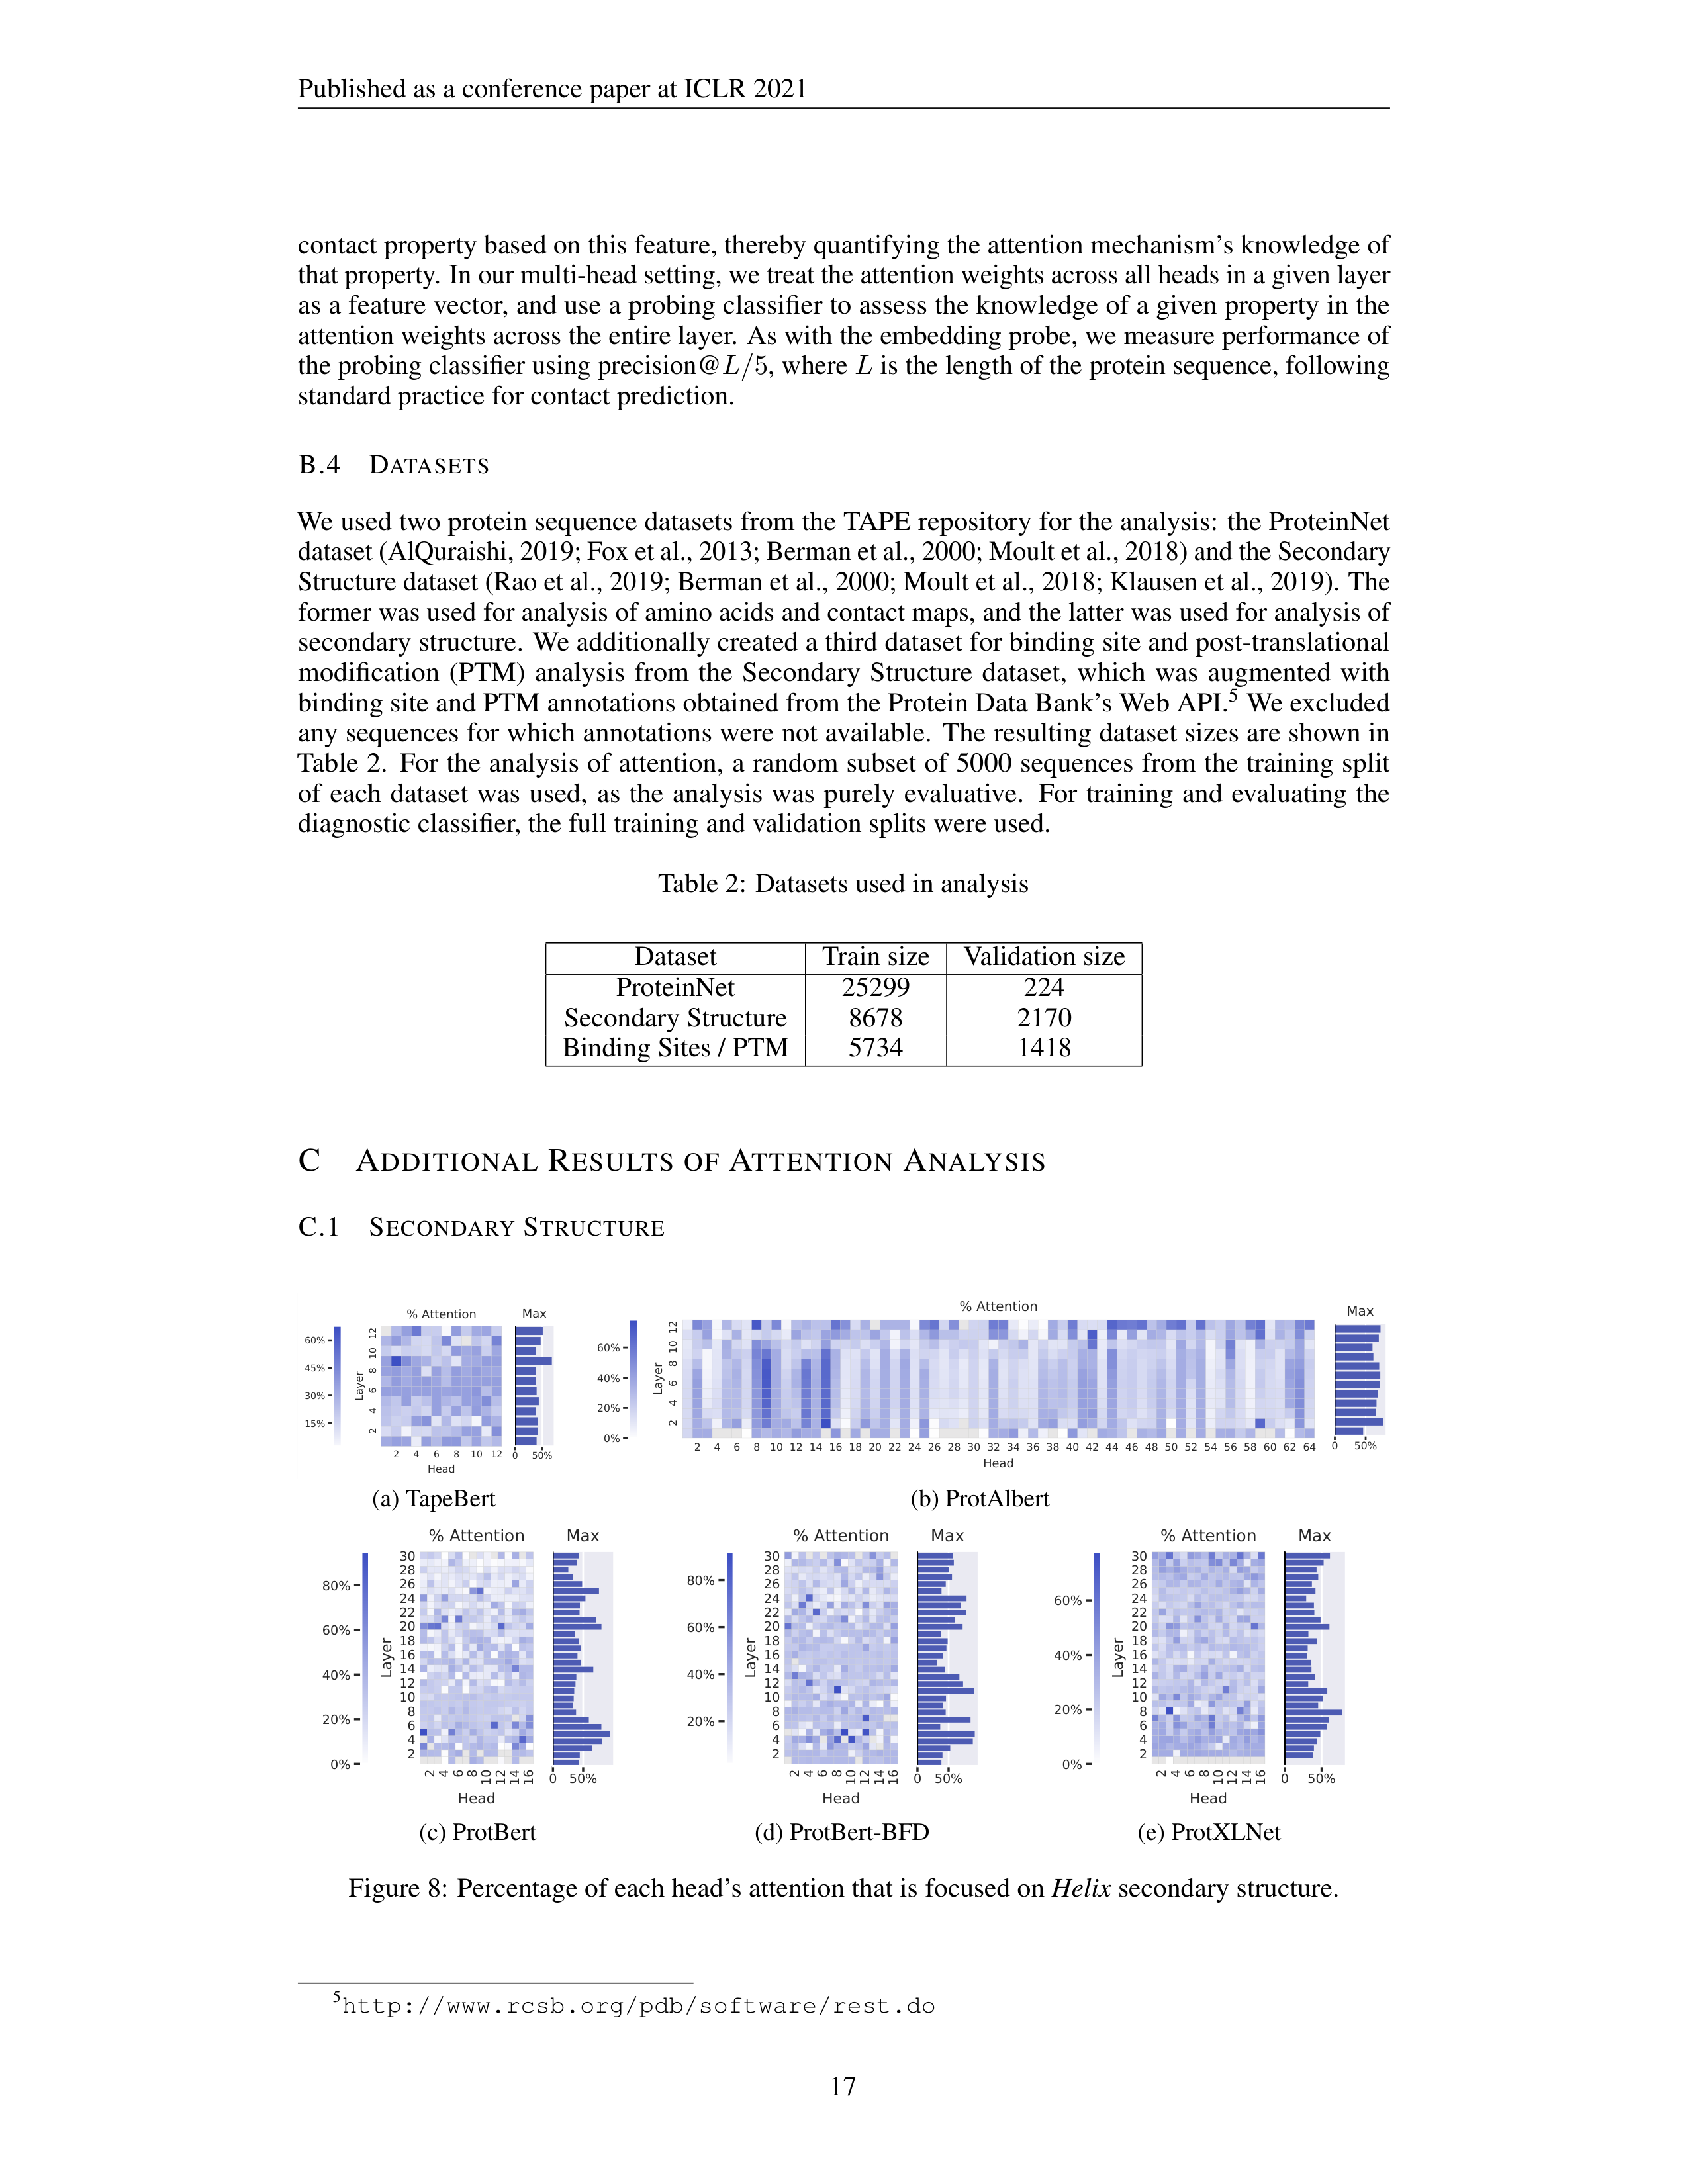
Published as a conference paper at ICLR 2021
contact property based on this feature, thereby quantifying the attention mechanism’s knowledge of
that property.
In our multi-head setting, we treat the attention weights across all heads in a given layer
as a feature vector, and use a probing classifier to assess the knowledge of a given property in the
attention weights across the entire layer.
As with the embedding probe, we measure performance of
the probing classifier using precision@
L/
5
, where
L
is the length of the protein sequence, following
standard practice for contact prediction.
B.4
D
ATASETS
We used two protein sequence datasets from the TAPE repository for the analysis:
the ProteinNet
dataset (AlQuraishi, 2019; Fox et al., 2013; Berman et al., 2000; Moult et al., 2018) and the Secondary
Structure dataset (Rao et al., 2019; Berman et al., 2000; Moult et al., 2018; Klausen et al., 2019).
The
former was used for analysis of amino acids and contact maps, and the latter was used for analysis of
secondary structure.
We additionally created a third dataset for binding site and post-translational
modification
(PTM)
analysis
from
the
Secondary
Structure
dataset,
which
was
augmented
with
binding site and PTM annotations obtained from the Protein Data Bank’s Web API.
5
We excluded
any sequences for which annotations were not available.
The resulting dataset sizes are shown in
Table 2.
For the analysis of attention,
a random subset of 5000 sequences from the training split
of
each
dataset
was
used,
as
the
analysis
was
purely
evaluative.
For
training
and
evaluating
the
diagnostic classifier, the full training and validation splits were used.
Table 2:
Datasets used in analysis
Dataset
Train size
Validation size
ProteinNet
25299
224
Secondary Structure
8678
2170
Binding Sites / PTM
5734
1418
C
A
DDITIONAL
R
ESULTS
OF
A
TTENTION
A
NALYSIS
C.1
S
ECONDARY
S
TRUCTURE
2
4
6
8
10
12
Head
2
4
6
8
10
12
Layer
% Attention
0
50%
Max
15%
30%
45%
60%
(a) TapeBert
2
4
6
8
10
12
14
16
18
20
22
24
26
28
30
32
34
36
38
40
42
44
46
48
50
52
54
56
58
60
62
64
Head
2
4
6
8
10
12
Layer
% Attention
0
50%
Max
0%
20%
40%
60%
(b) ProtAlbert
2
4
6
8
10
12
14
16
Head
2
4
6
8
10
12
14
16
18
20
22
24
26
28
30
Layer
% Attention
0
50%
Max
0%
20%
40%
60%
80%
(c) ProtBert
2
4
6
8
10
12
14
16
Head
2
4
6
8
10
12
14
16
18
20
22
24
26
28
30
Layer
% Attention
0
50%
Max
20%
40%
60%
80%
(d) ProtBert-BFD
2
4
6
8
10
12
14
16
Head
2
4
6
8
10
12
14
16
18
20
22
24
26
28
30
Layer
% Attention
0
50%
Max
0%
20%
40%
60%
(e) ProtXLNet
Figure 8:
Percentage of each head’s attention that is focused on
Helix
secondary structure.
5
http://www.rcsb.org/pdb/software/rest.do
17
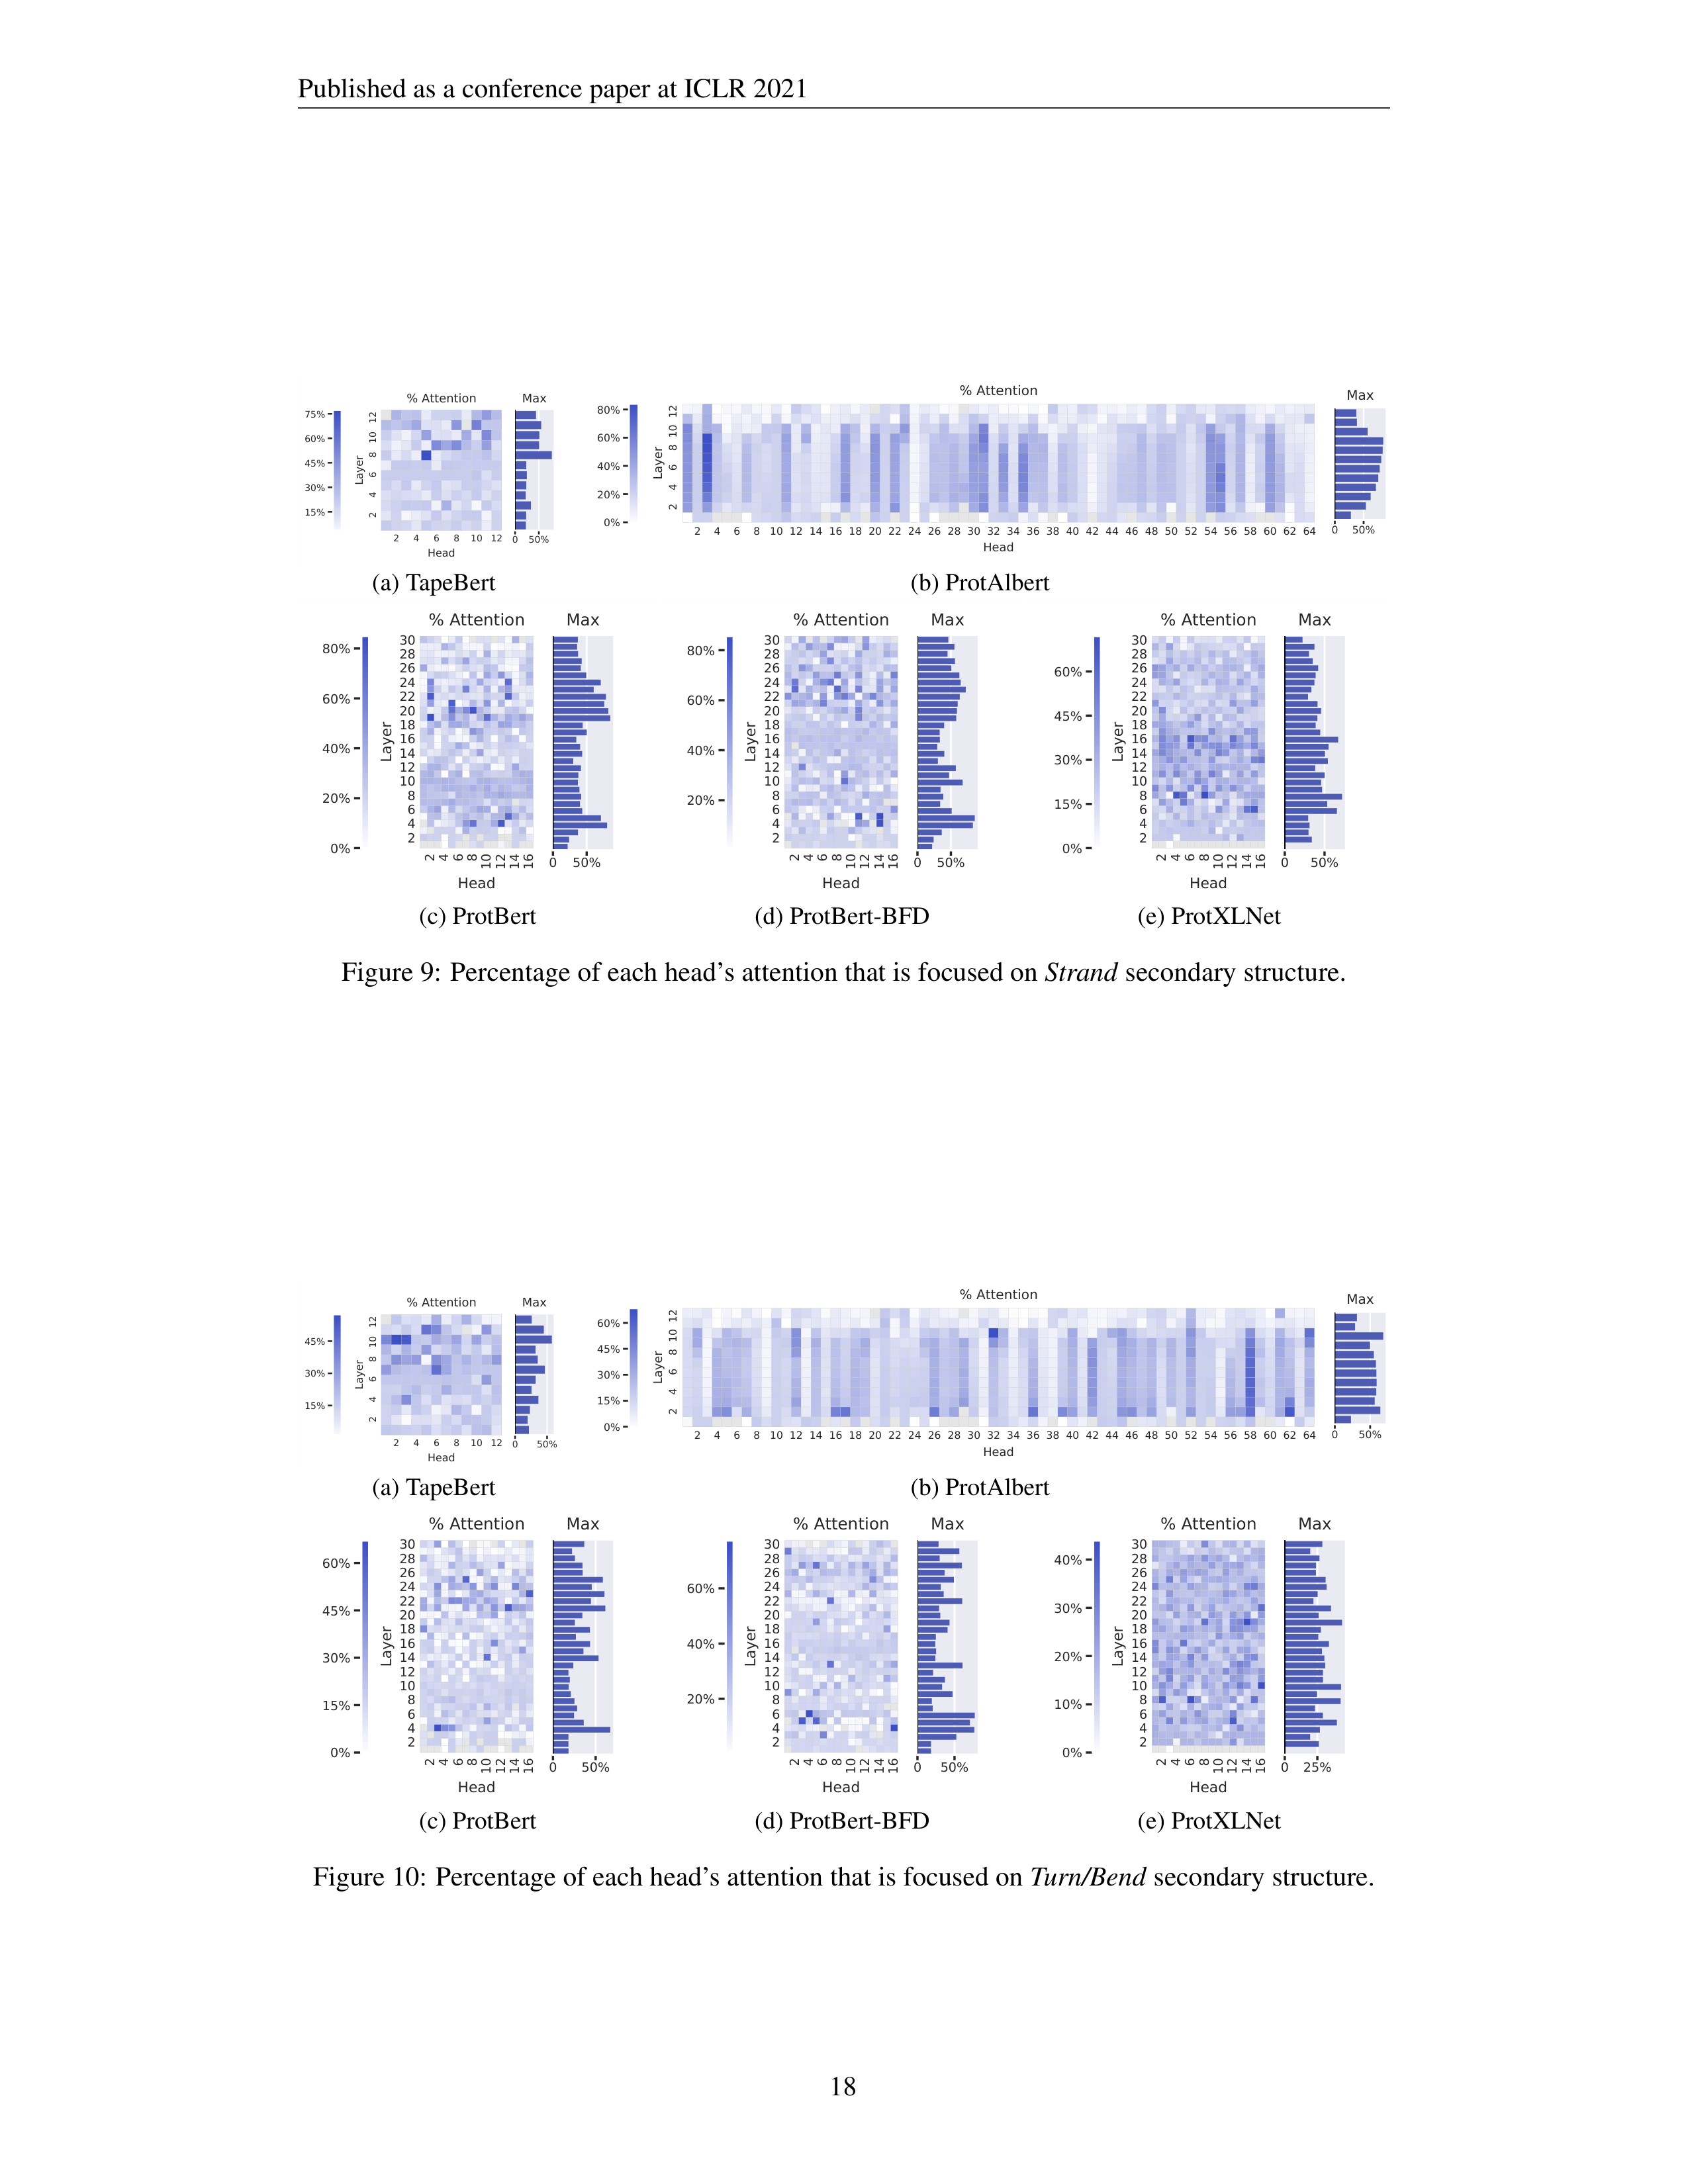
Published as a conference paper at ICLR 2021
2
4
6
8
10
12
Head
2
4
6
8
10
12
Layer
% Attention
0
50%
Max
15%
30%
45%
60%
75%
(a) TapeBert
2
4
6
8
10
12
14
16
18
20
22
24
26
28
30
32
34
36
38
40
42
44
46
48
50
52
54
56
58
60
62
64
Head
2
4
6
8
10
12
Layer
% Attention
0
50%
Max
0%
20%
40%
60%
80%
(b) ProtAlbert
2
4
6
8
10
12
14
16
Head
2
4
6
8
10
12
14
16
18
20
22
24
26
28
30
Layer
% Attention
0
50%
Max
0%
20%
40%
60%
80%
(c) ProtBert
2
4
6
8
10
12
14
16
Head
2
4
6
8
10
12
14
16
18
20
22
24
26
28
30
Layer
% Attention
0
50%
Max
20%
40%
60%
80%
(d) ProtBert-BFD
2
4
6
8
10
12
14
16
Head
2
4
6
8
10
12
14
16
18
20
22
24
26
28
30
Layer
% Attention
0
50%
Max
0%
15%
30%
45%
60%
(e) ProtXLNet
Figure 9:
Percentage of each head’s attention that is focused on
Strand
secondary structure.
2
4
6
8
10
12
Head
2
4
6
8
10
12
Layer
% Attention
0
50%
Max
15%
30%
45%
(a) TapeBert
2
4
6
8
10
12
14
16
18
20
22
24
26
28
30
32
34
36
38
40
42
44
46
48
50
52
54
56
58
60
62
64
Head
2
4
6
8
10
12
Layer
% Attention
0
50%
Max
0%
15%
30%
45%
60%
(b) ProtAlbert
2
4
6
8
10
12
14
16
Head
2
4
6
8
10
12
14
16
18
20
22
24
26
28
30
Layer
% Attention
0
50%
Max
0%
15%
30%
45%
60%
(c) ProtBert
2
4
6
8
10
12
14
16
Head
2
4
6
8
10
12
14
16
18
20
22
24
26
28
30
Layer
% Attention
0
50%
Max
20%
40%
60%
(d) ProtBert-BFD
2
4
6
8
10
12
14
16
Head
2
4
6
8
10
12
14
16
18
20
22
24
26
28
30
Layer
% Attention
0
25%
Max
0%
10%
20%
30%
40%
(e) ProtXLNet
Figure 10:
Percentage of each head’s attention that is focused on
Turn/Bend
secondary structure.
18
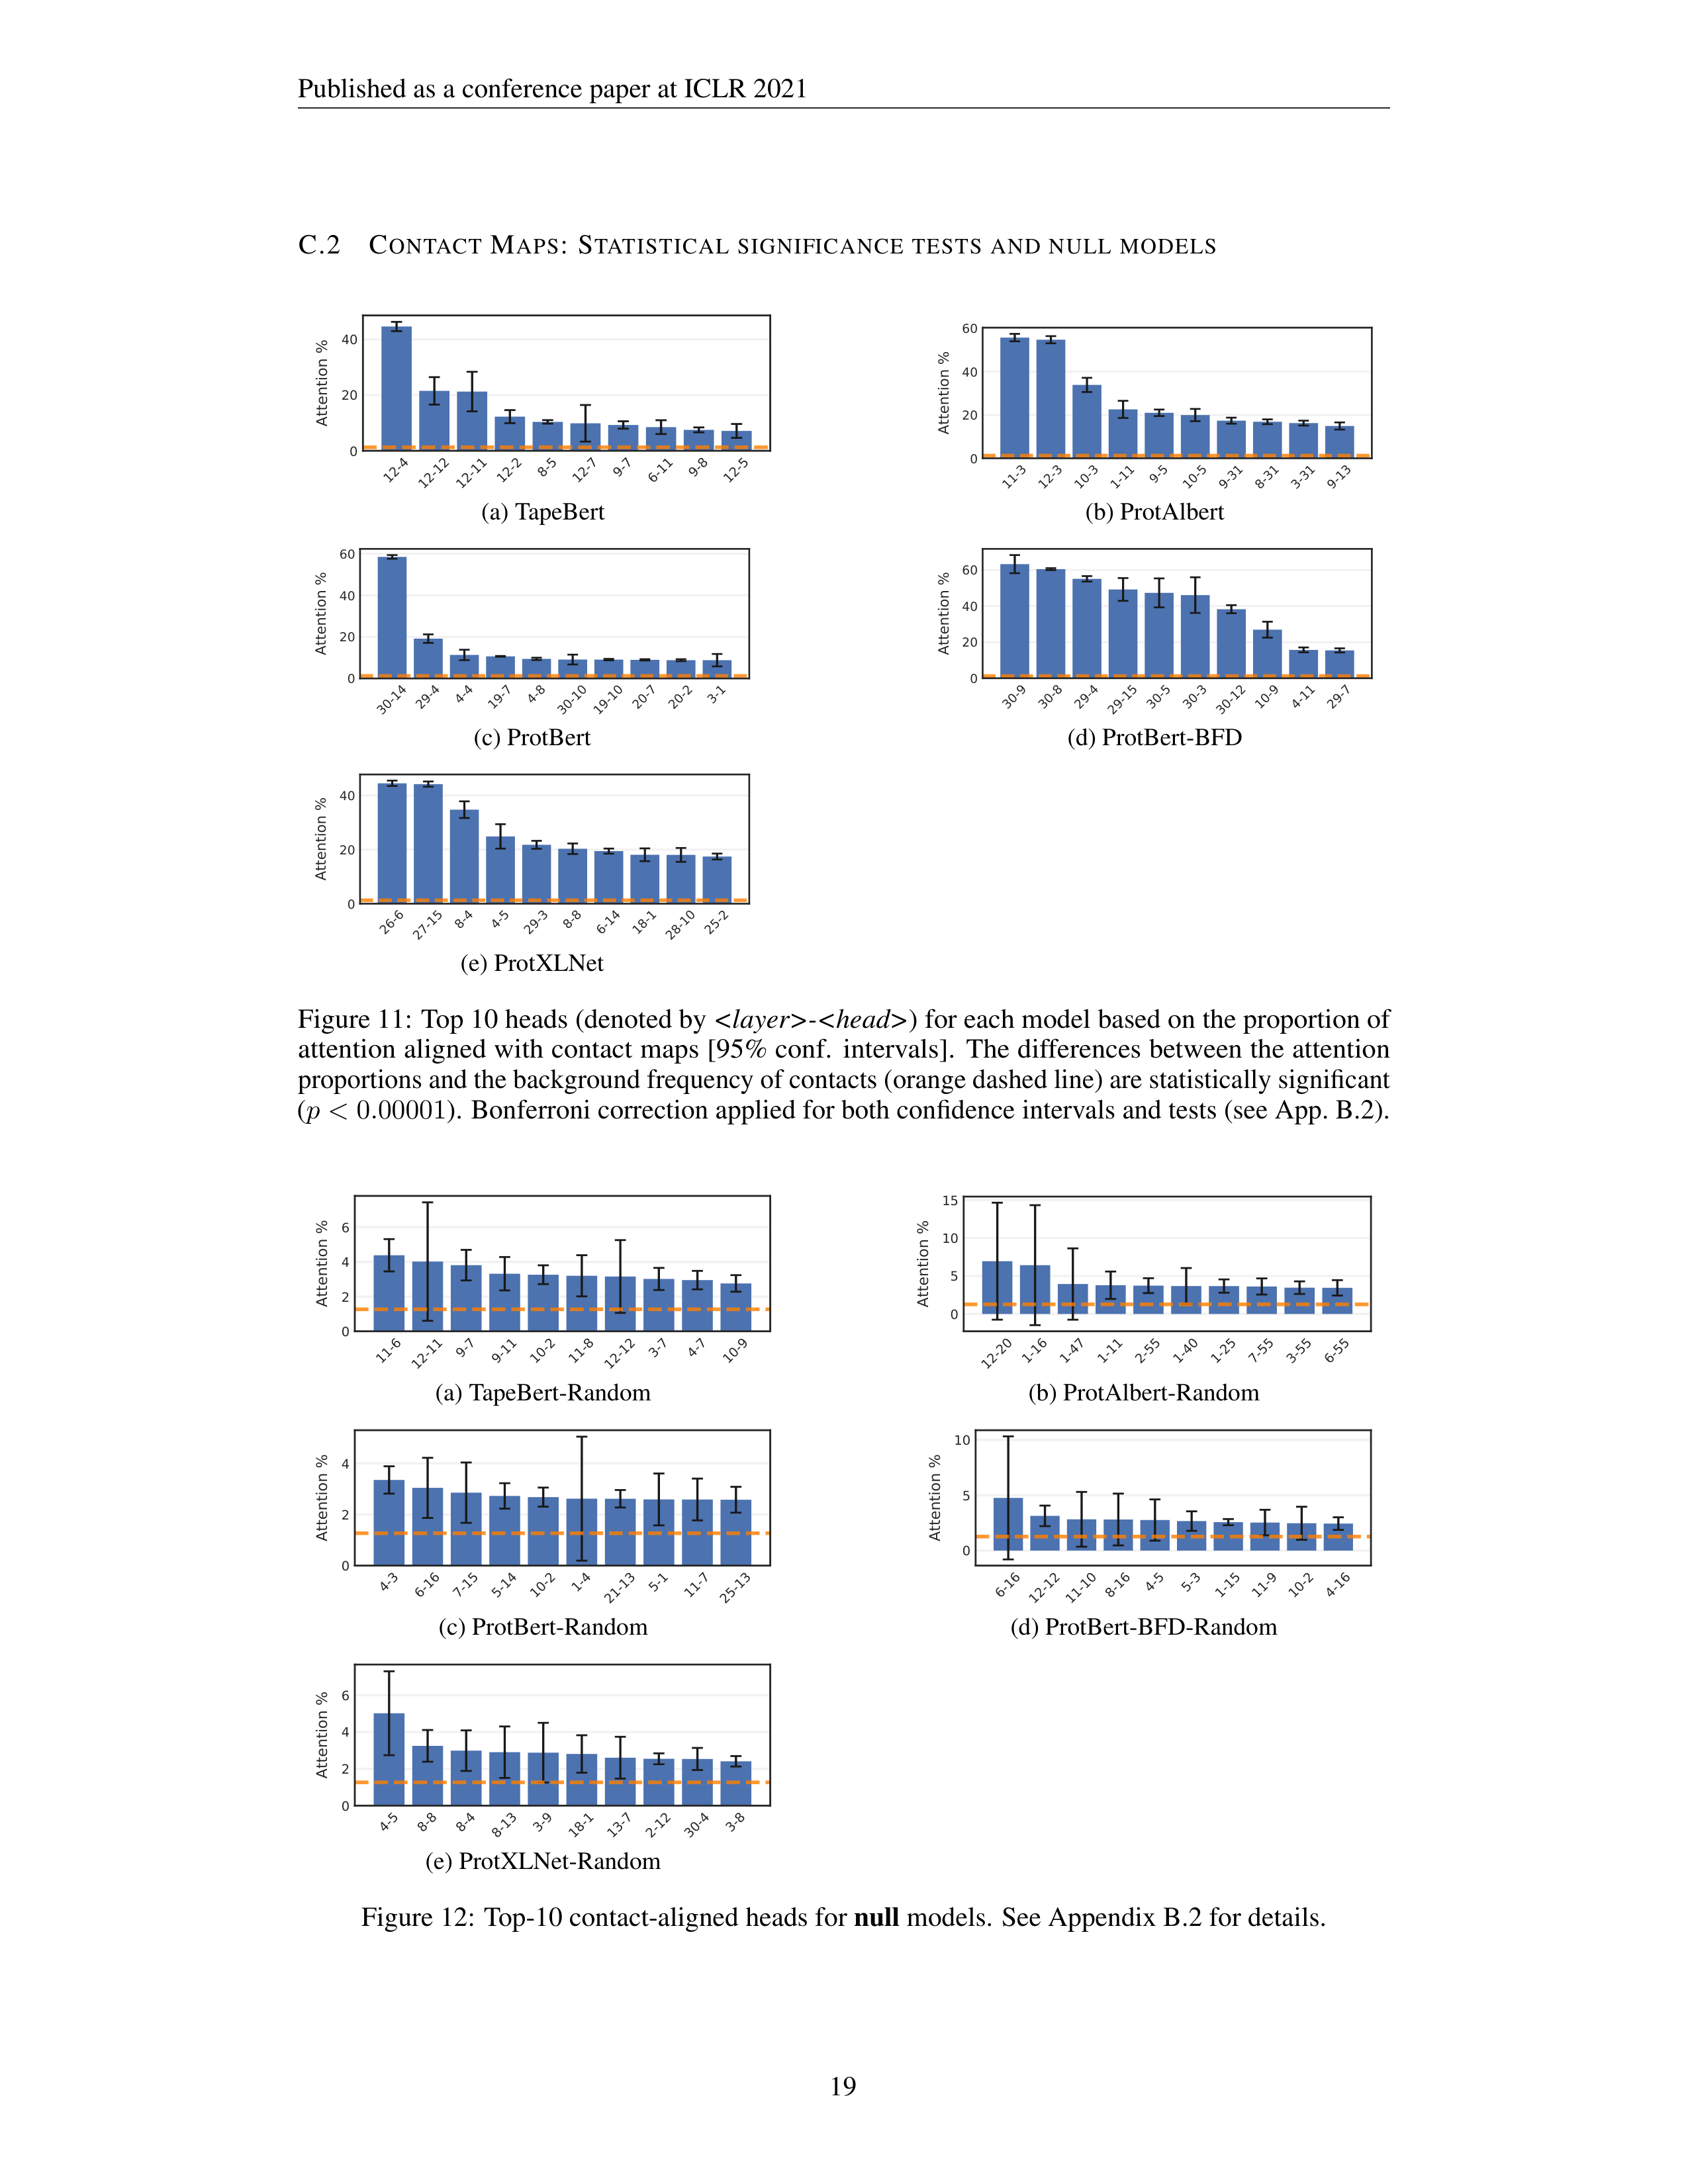
Published as a conference paper at ICLR 2021
C.2
C
ONTACT
M
APS
:
S
TATISTICAL
SIGNIFICANCE
TESTS
AND
NULL
MODELS
12-4
12-12
12-11
12-2
8-5
12-7
9-7
6-11
9-8
12-5
0
20
40
Attention %
(a) TapeBert
11-3
12-3
10-3
1-11
9-5
10-5
9-31
8-31
3-31
9-13
0
20
40
60
Attention %
(b) ProtAlbert
30-14
29-4
4-4
19-7
4-8
30-10
19-10
20-7
20-2
3-1
0
20
40
60
Attention %
(c) ProtBert
30-9
30-8
29-4
29-15
30-5
30-3
30-12
10-9
4-11
29-7
0
20
40
60
Attention %
(d) ProtBert-BFD
26-6
27-15
8-4
4-5
29-3
8-8
6-14
18-1
28-10
25-2
0
20
40
Attention %
(e) ProtXLNet
Figure 11:
Top 10 heads (denoted by
-
) for each model based on the proportion of
attention aligned with contact maps [95% conf.
intervals].
The differences between the attention
proportions and the background frequency of contacts (orange dashed line) are statistically significant
(
p <
0
.
00001
).
Bonferroni correction applied for both confidence intervals and tests (see App. B.2).
11-6
12-11
9-7
9-11
10-2
11-8
12-12
3-7
4-7
10-9
0
2
4
6
Attention %
(a) TapeBert-Random
12-20
1-16
1-47
1-11
2-55
1-40
1-25
7-55
3-55
6-55
0
5
10
15
Attention %
(b) ProtAlbert-Random
4-3
6-16
7-15
5-14
10-2
1-4
21-13
5-1
11-7
25-13
0
2
4
Attention %
(c) ProtBert-Random
6-16
12-12
11-10
8-16
4-5
5-3
1-15
11-9
10-2
4-16
0
5
10
Attention %
(d) ProtBert-BFD-Random
4-5
8-8
8-4
8-13
3-9
18-1
13-7
2-12
30-4
3-8
0
2
4
6
Attention %
(e) ProtXLNet-Random
Figure 12:
Top-10 contact-aligned heads for
null
models.
See Appendix B.2 for details.
19
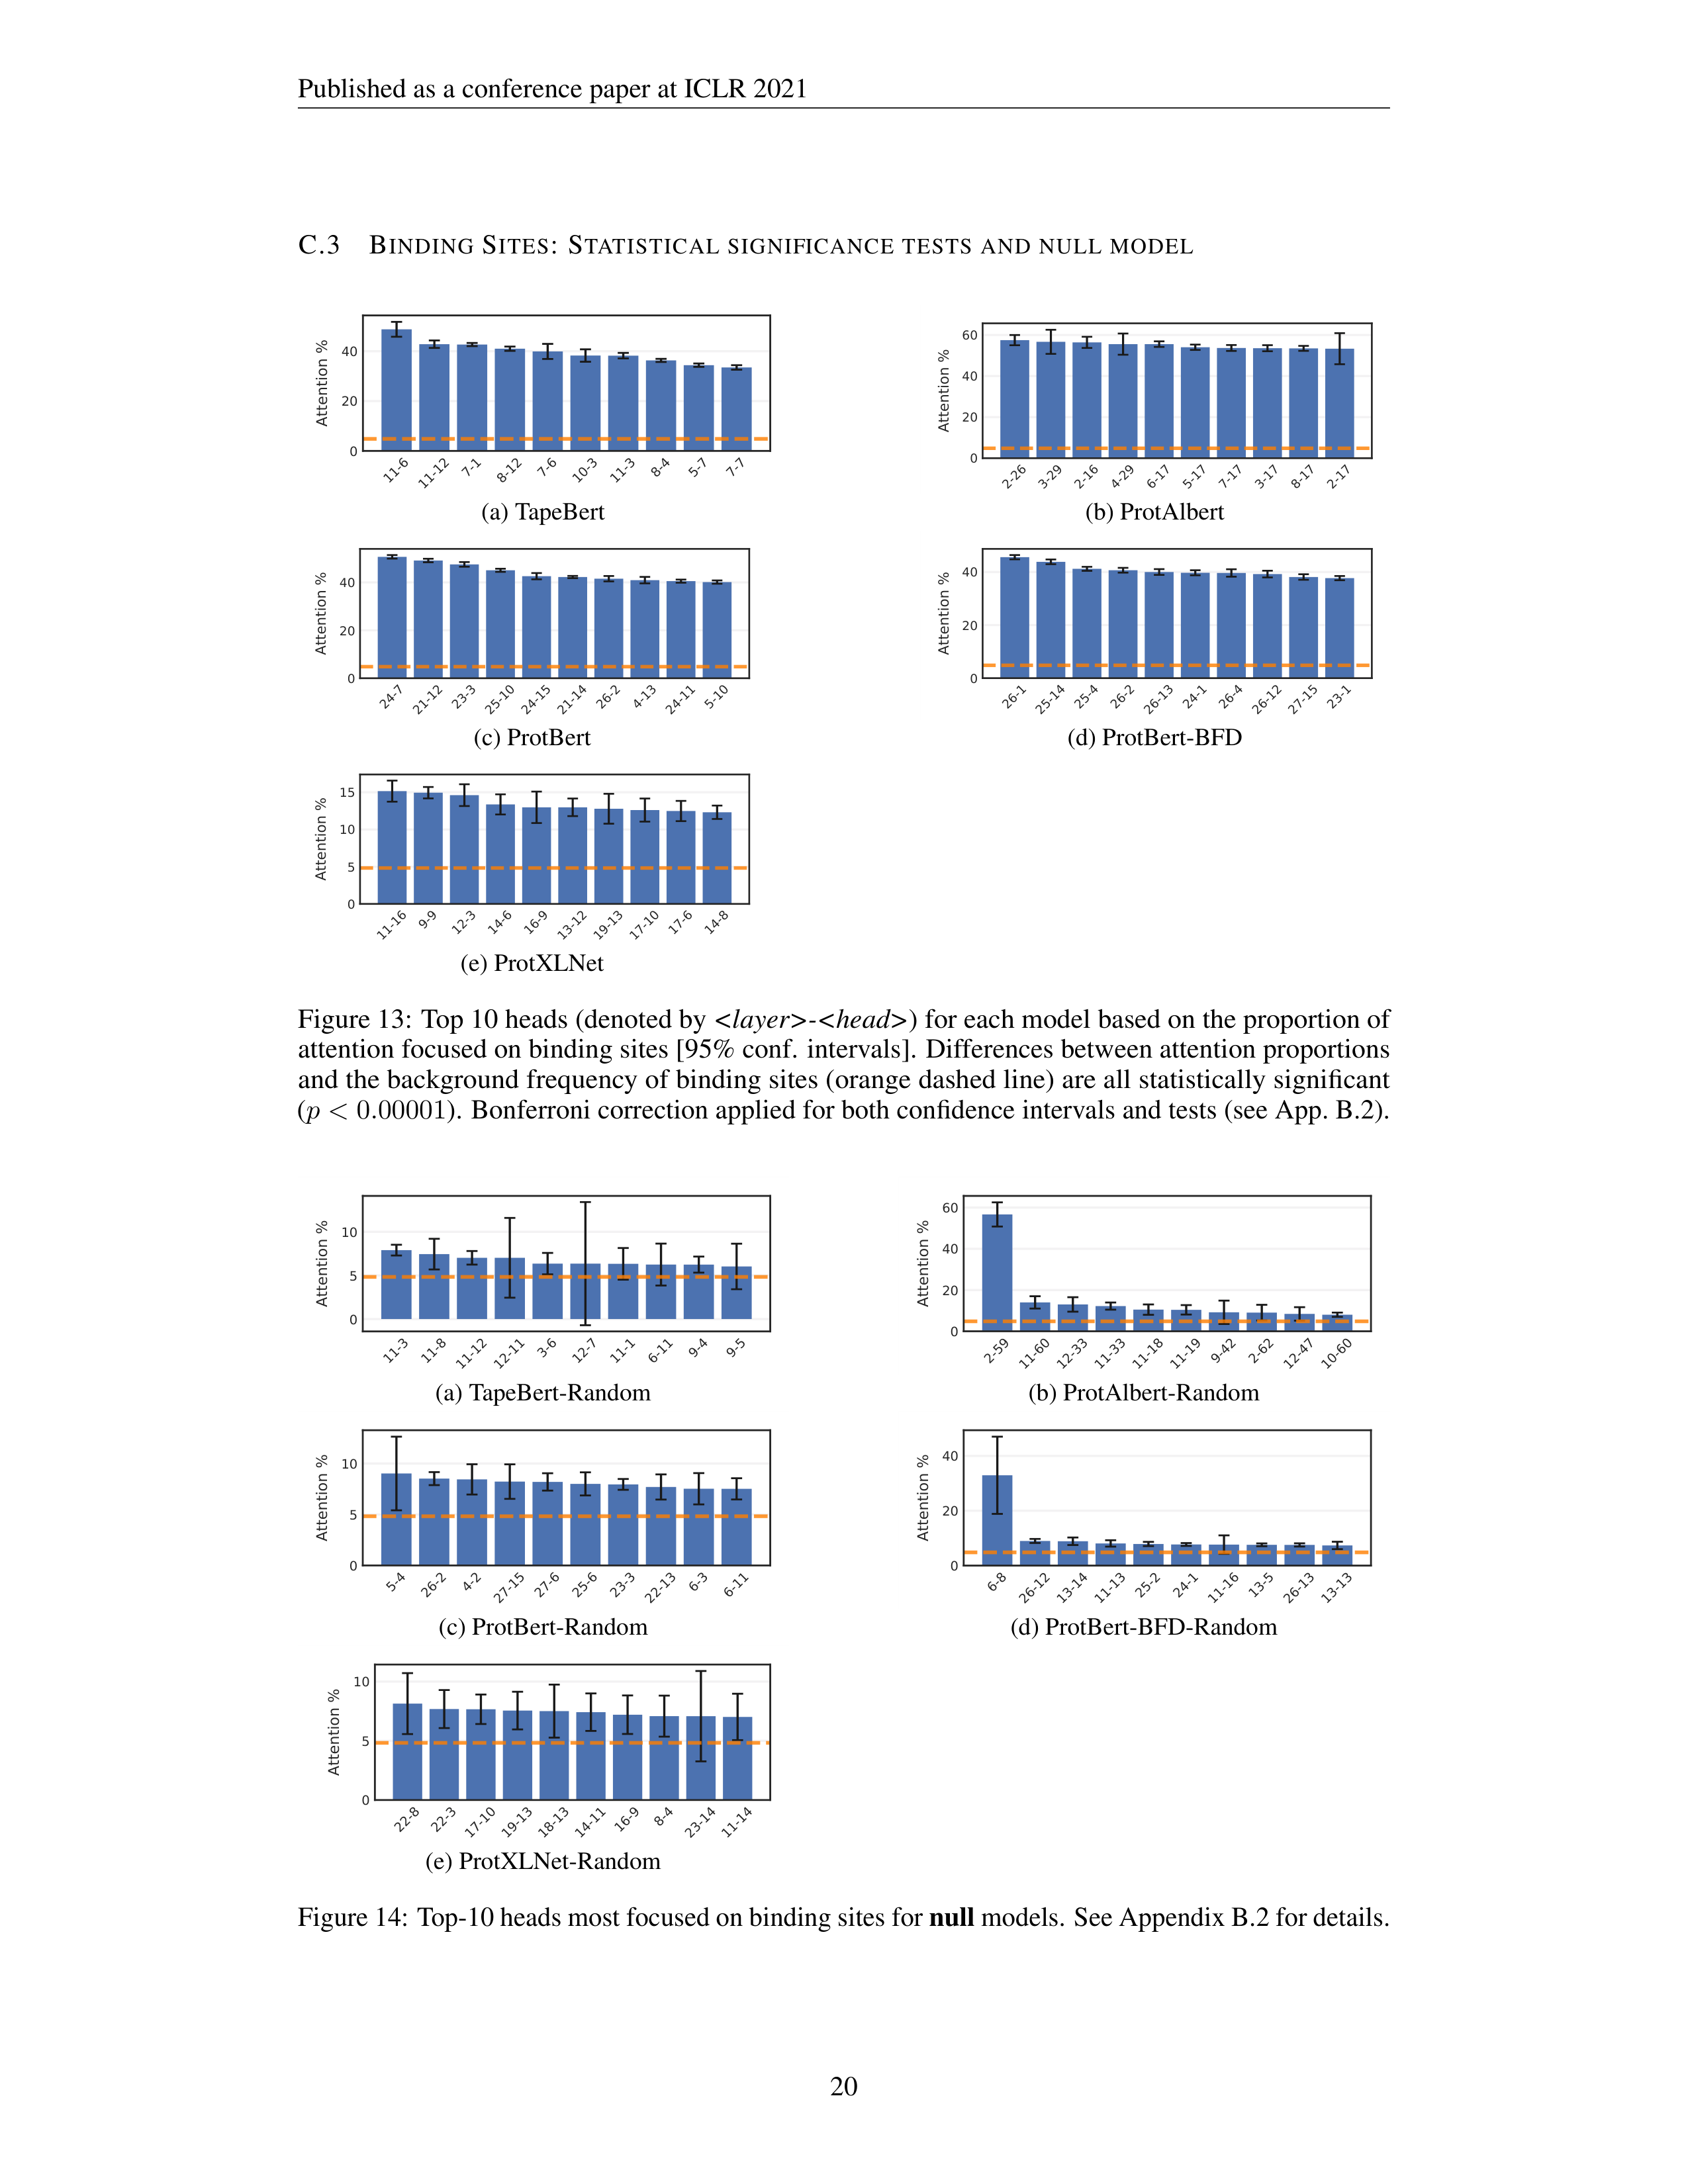
Published as a conference paper at ICLR 2021
C.3
B
INDING
S
ITES
:
S
TATISTICAL
SIGNIFICANCE
TESTS
AND
NULL
MODEL
11-6
11-12
7-1
8-12
7-6
10-3
11-3
8-4
5-7
7-7
0
20
40
Attention %
(a) TapeBert
2-26
3-29
2-16
4-29
6-17
5-17
7-17
3-17
8-17
2-17
0
20
40
60
Attention %
(b) ProtAlbert
24-7
21-12
23-3
25-10
24-15
21-14
26-2
4-13
24-11
5-10
0
20
40
Attention %
(c) ProtBert
26-1
25-14
25-4
26-2
26-13
24-1
26-4
26-12
27-15
23-1
0
20
40
Attention %
(d) ProtBert-BFD
11-16
9-9
12-3
14-6
16-9
13-12
19-13
17-10
17-6
14-8
0
5
10
15
Attention %
(e) ProtXLNet
Figure 13:
Top 10 heads (denoted by
-
) for each model based on the proportion of
attention focused on binding sites [95% conf.
intervals].
Differences between attention proportions
and the background frequency of binding sites (orange dashed line) are all statistically significant
(
p <
0
.
00001
).
Bonferroni correction applied for both confidence intervals and tests (see App. B.2).
11-3
11-8
11-12
12-11
3-6
12-7
11-1
6-11
9-4
9-5
0
5
10
Attention %
(a) TapeBert-Random
2-59
11-60
12-33
11-33
11-18
11-19
9-42
2-62
12-47
10-60
0
20
40
60
Attention %
(b) ProtAlbert-Random
5-4
26-2
4-2
27-15
27-6
25-6
23-3
22-13
6-3
6-11
0
5
10
Attention %
(c) ProtBert-Random
6-8
26-12
13-14
11-13
25-2
24-1
11-16
13-5
26-13
13-13
0
20
40
Attention %
(d) ProtBert-BFD-Random
22-8
22-3
17-10
19-13
18-13
14-11
16-9
8-4
23-14
11-14
0
5
10
Attention %
(e) ProtXLNet-Random
Figure 14: Top-10 heads most focused on binding sites for
null
models.
See Appendix B.2 for details.
20
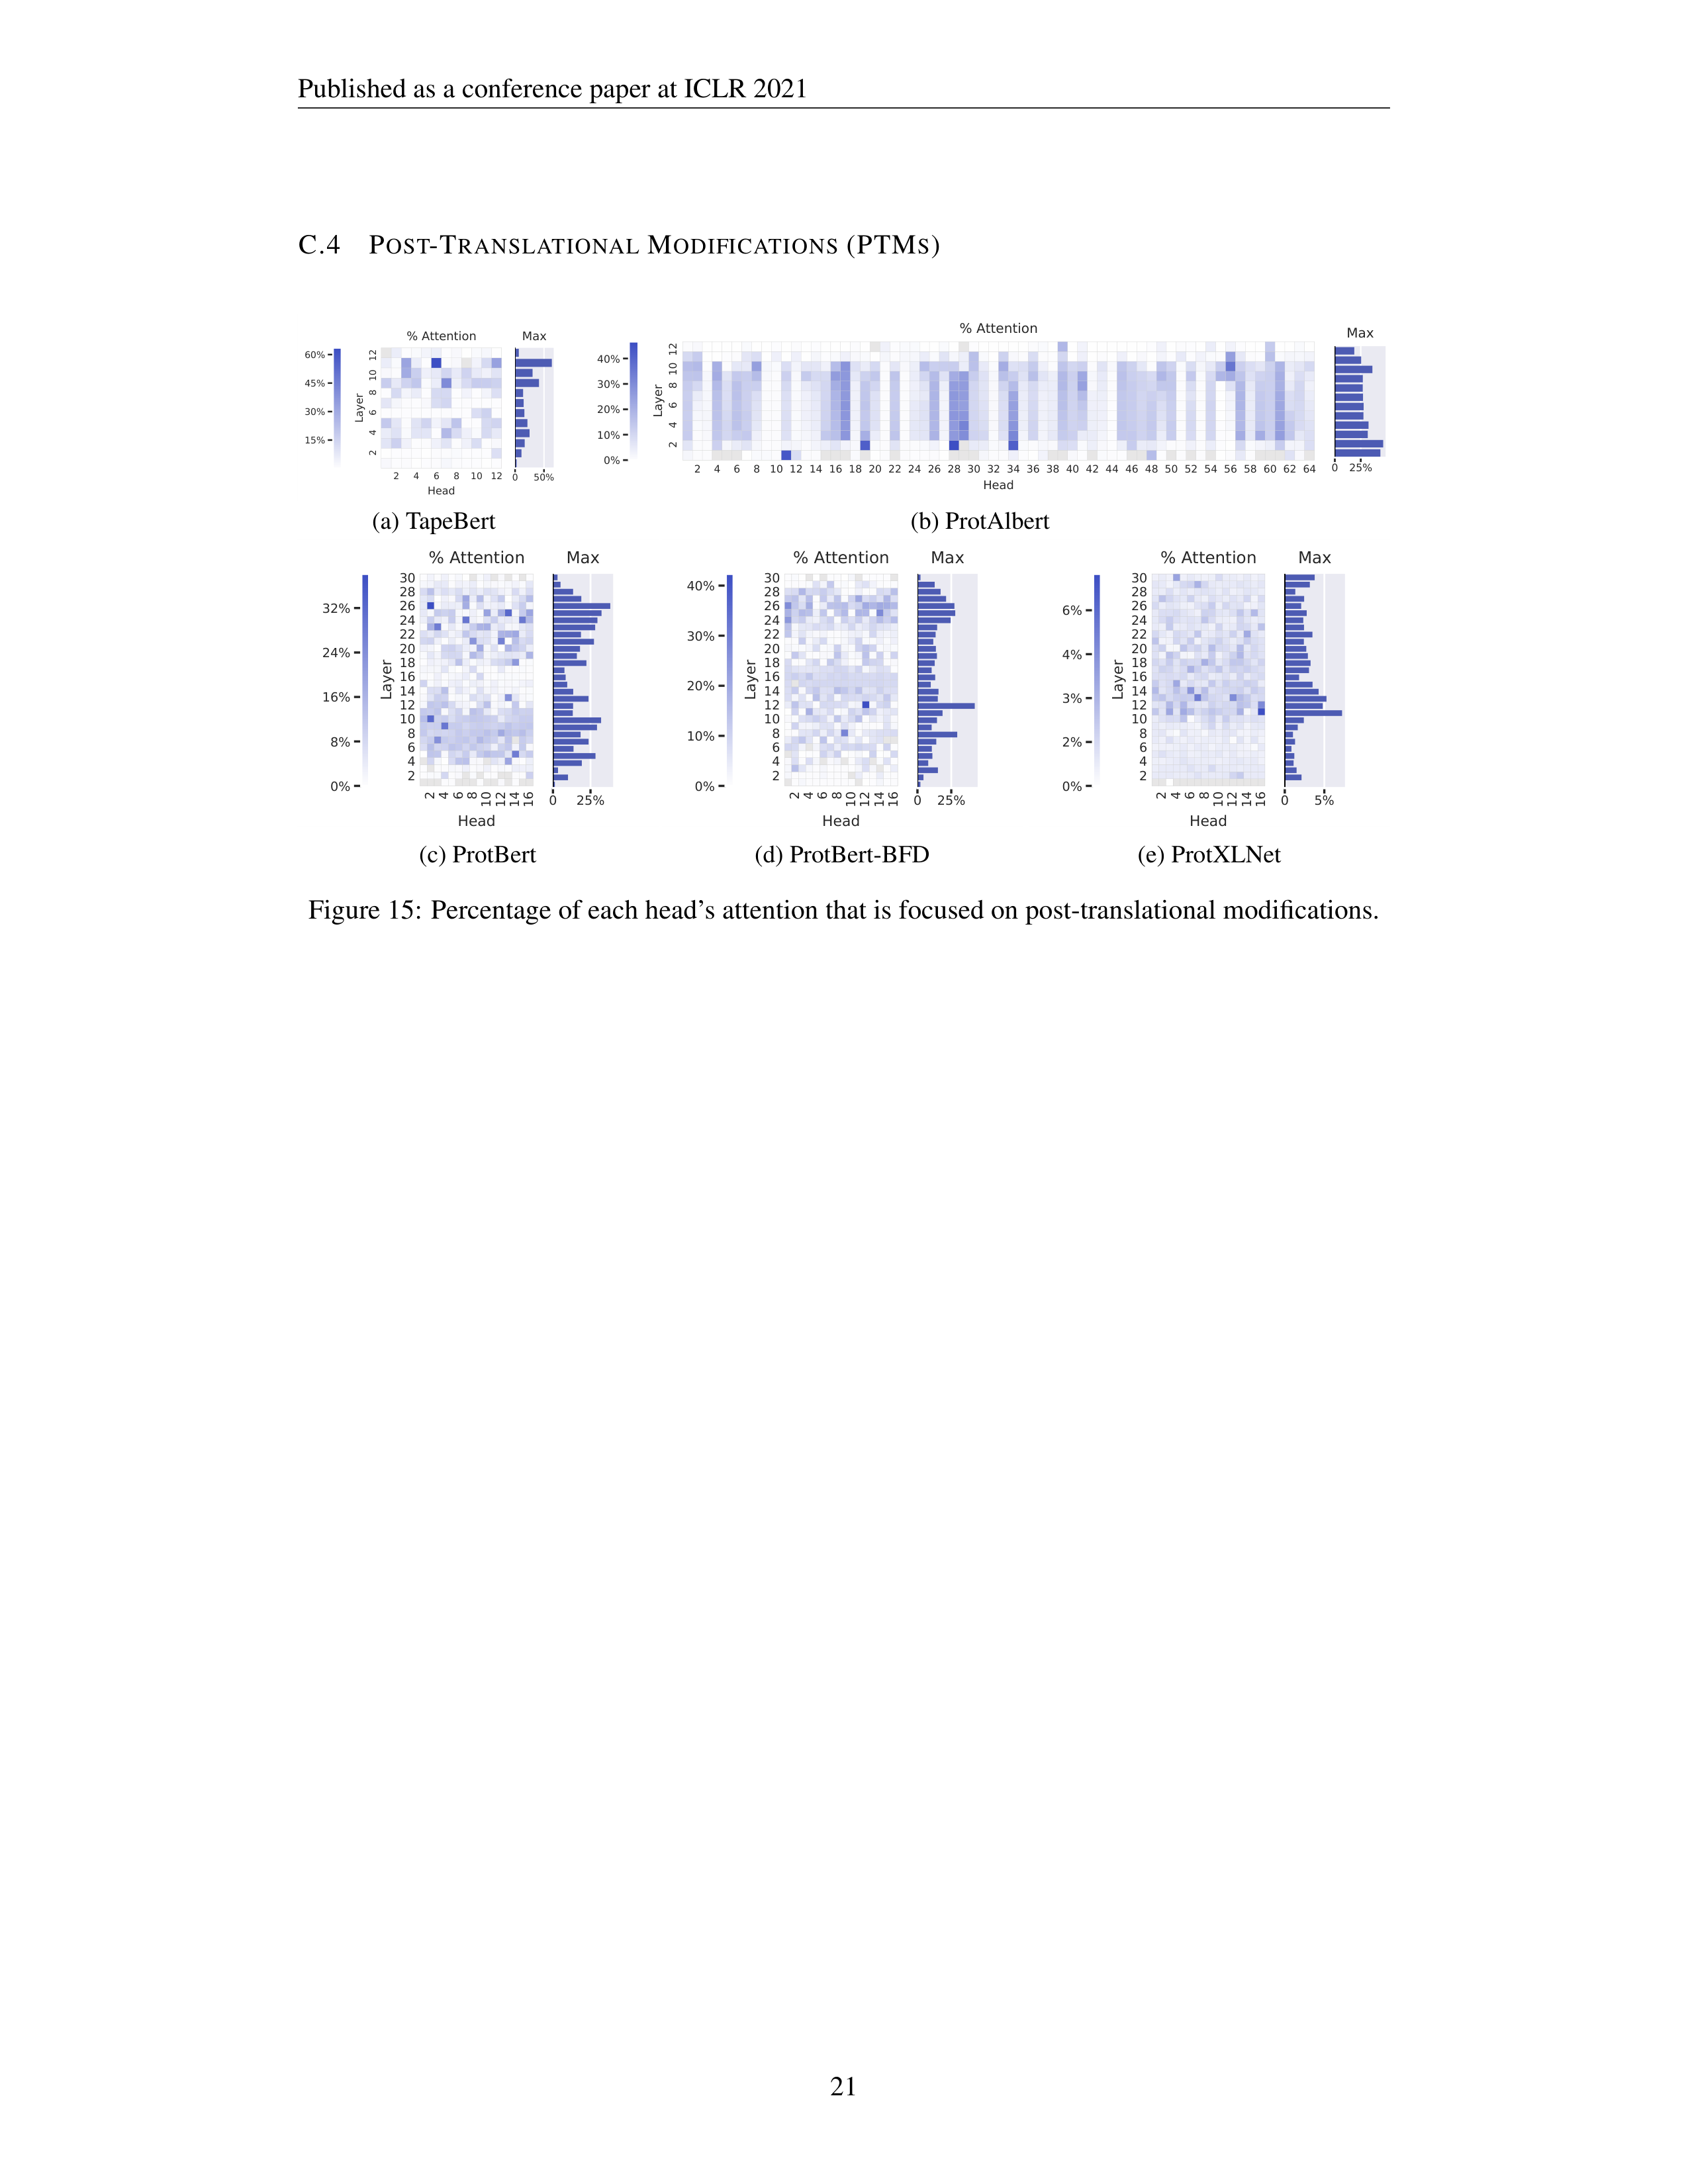
Published as a conference paper at ICLR 2021
C.4
P
OST
-T
RANSLATIONAL
M
ODIFICATIONS
(PTM
S
)
2
4
6
8
10
12
Head
2
4
6
8
10
12
Layer
% Attention
0
50%
Max
15%
30%
45%
60%
(a) TapeBert
2
4
6
8
10
12
14
16
18
20
22
24
26
28
30
32
34
36
38
40
42
44
46
48
50
52
54
56
58
60
62
64
Head
2
4
6
8
10
12
Layer
% Attention
0
25%
Max
0%
10%
20%
30%
40%
(b) ProtAlbert
2
4
6
8
10
12
14
16
Head
2
4
6
8
10
12
14
16
18
20
22
24
26
28
30
Layer
% Attention
0
25%
Max
0%
8%
16%
24%
32%
(c) ProtBert
2
4
6
8
10
12
14
16
Head
2
4
6
8
10
12
14
16
18
20
22
24
26
28
30
Layer
% Attention
0
25%
Max
0%
10%
20%
30%
40%
(d) ProtBert-BFD
2
4
6
8
10
12
14
16
Head
2
4
6
8
10
12
14
16
18
20
22
24
26
28
30
Layer
% Attention
0
5%
Max
0%
2%
3%
4%
6%
(e) ProtXLNet
Figure 15:
Percentage of each head’s attention that is focused on post-translational modifications.
21
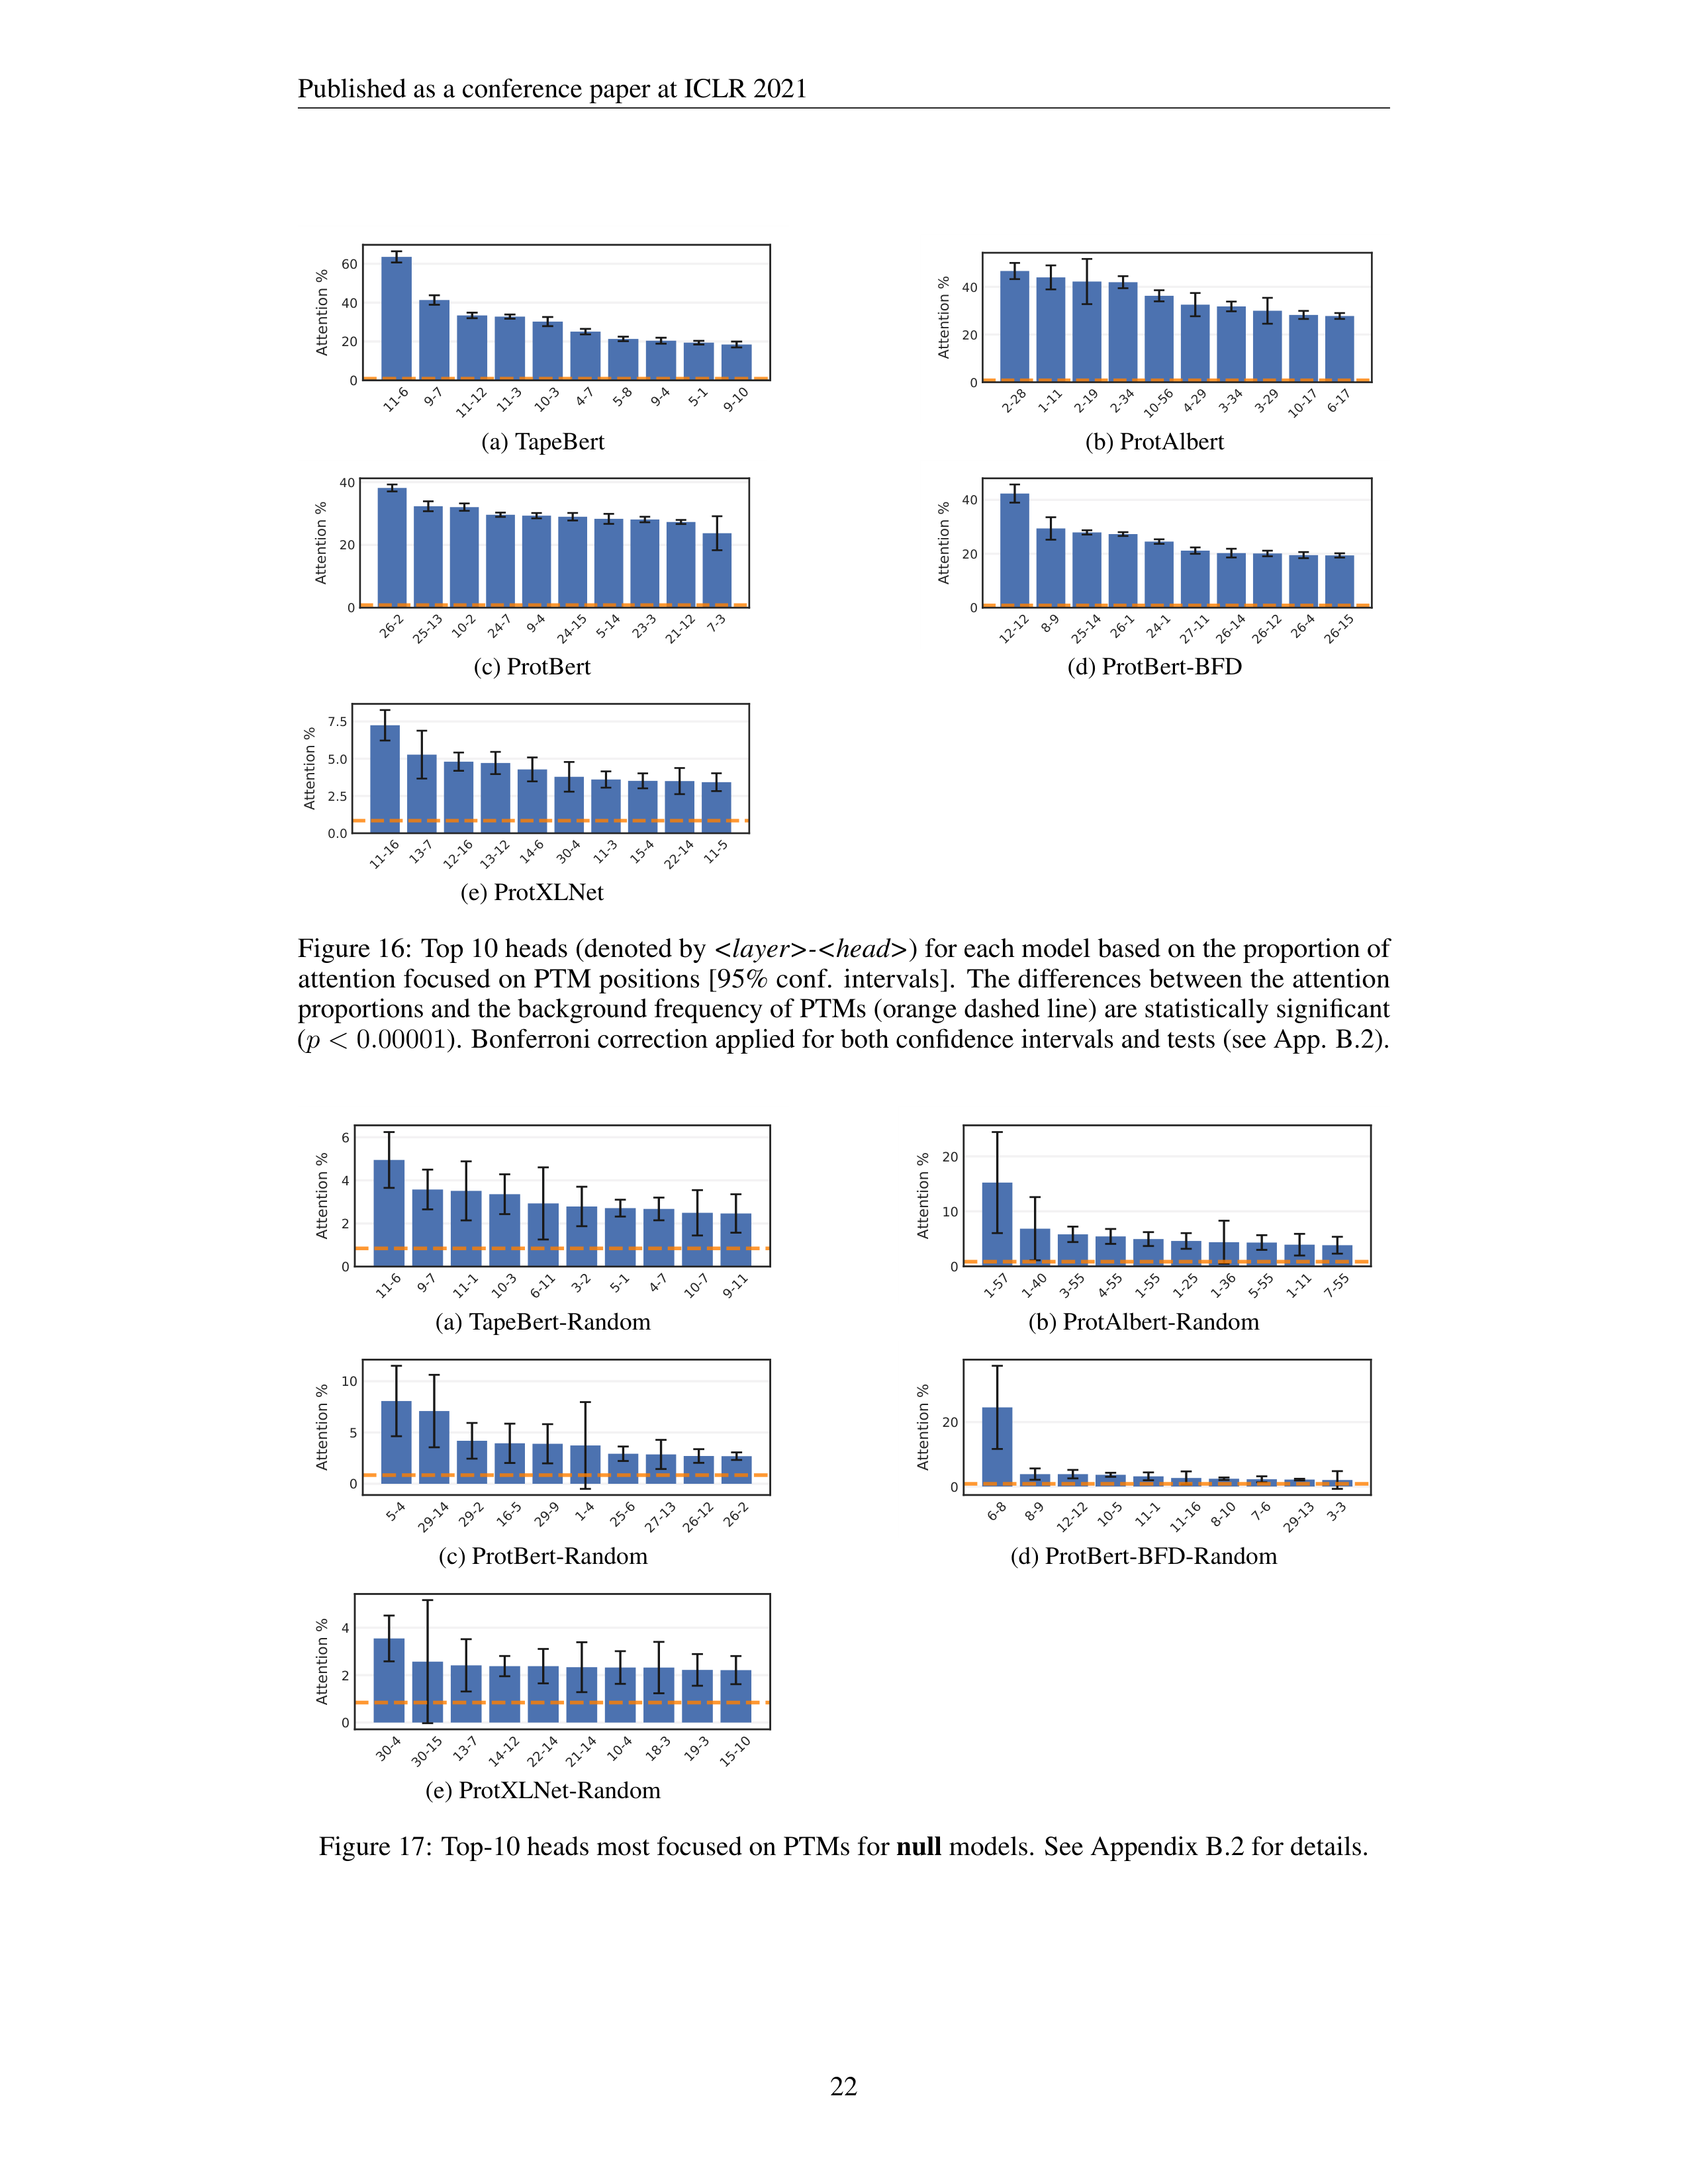
Published as a conference paper at ICLR 2021
11-6
9-7
11-12
11-3
10-3
4-7
5-8
9-4
5-1
9-10
0
20
40
60
Attention %
(a) TapeBert
2-28
1-11
2-19
2-34
10-56
4-29
3-34
3-29
10-17
6-17
0
20
40
Attention %
(b) ProtAlbert
26-2
25-13
10-2
24-7
9-4
24-15
5-14
23-3
21-12
7-3
0
20
40
Attention %
(c) ProtBert
12-12
8-9
25-14
26-1
24-1
27-11
26-14
26-12
26-4
26-15
0
20
40
Attention %
(d) ProtBert-BFD
11-16
13-7
12-16
13-12
14-6
30-4
11-3
15-4
22-14
11-5
0.0
2.5
5.0
7.5
Attention %
(e) ProtXLNet
Figure 16:
Top 10 heads (denoted by
-
) for each model based on the proportion of
attention focused on PTM positions [95% conf.
intervals].
The differences between the attention
proportions and the background frequency of PTMs (orange dashed line) are statistically significant
(
p <
0
.
00001
).
Bonferroni correction applied for both confidence intervals and tests (see App.
B.2).
11-6
9-7
11-1
10-3
6-11
3-2
5-1
4-7
10-7
9-11
0
2
4
6
Attention %
(a) TapeBert-Random
1-57
1-40
3-55
4-55
1-55
1-25
1-36
5-55
1-11
7-55
0
10
20
Attention %
(b) ProtAlbert-Random
5-4
29-14
29-2
16-5
29-9
1-4
25-6
27-13
26-12
26-2
0
5
10
Attention %
(c) ProtBert-Random
6-8
8-9
12-12
10-5
11-1
11-16
8-10
7-6
29-13
3-3
0
20
Attention %
(d) ProtBert-BFD-Random
30-4
30-15
13-7
14-12
22-14
21-14
10-4
18-3
19-3
15-10
0
2
4
Attention %
(e) ProtXLNet-Random
Figure 17:
Top-10 heads most focused on PTMs for
null
models.
See Appendix B.2 for details.
22
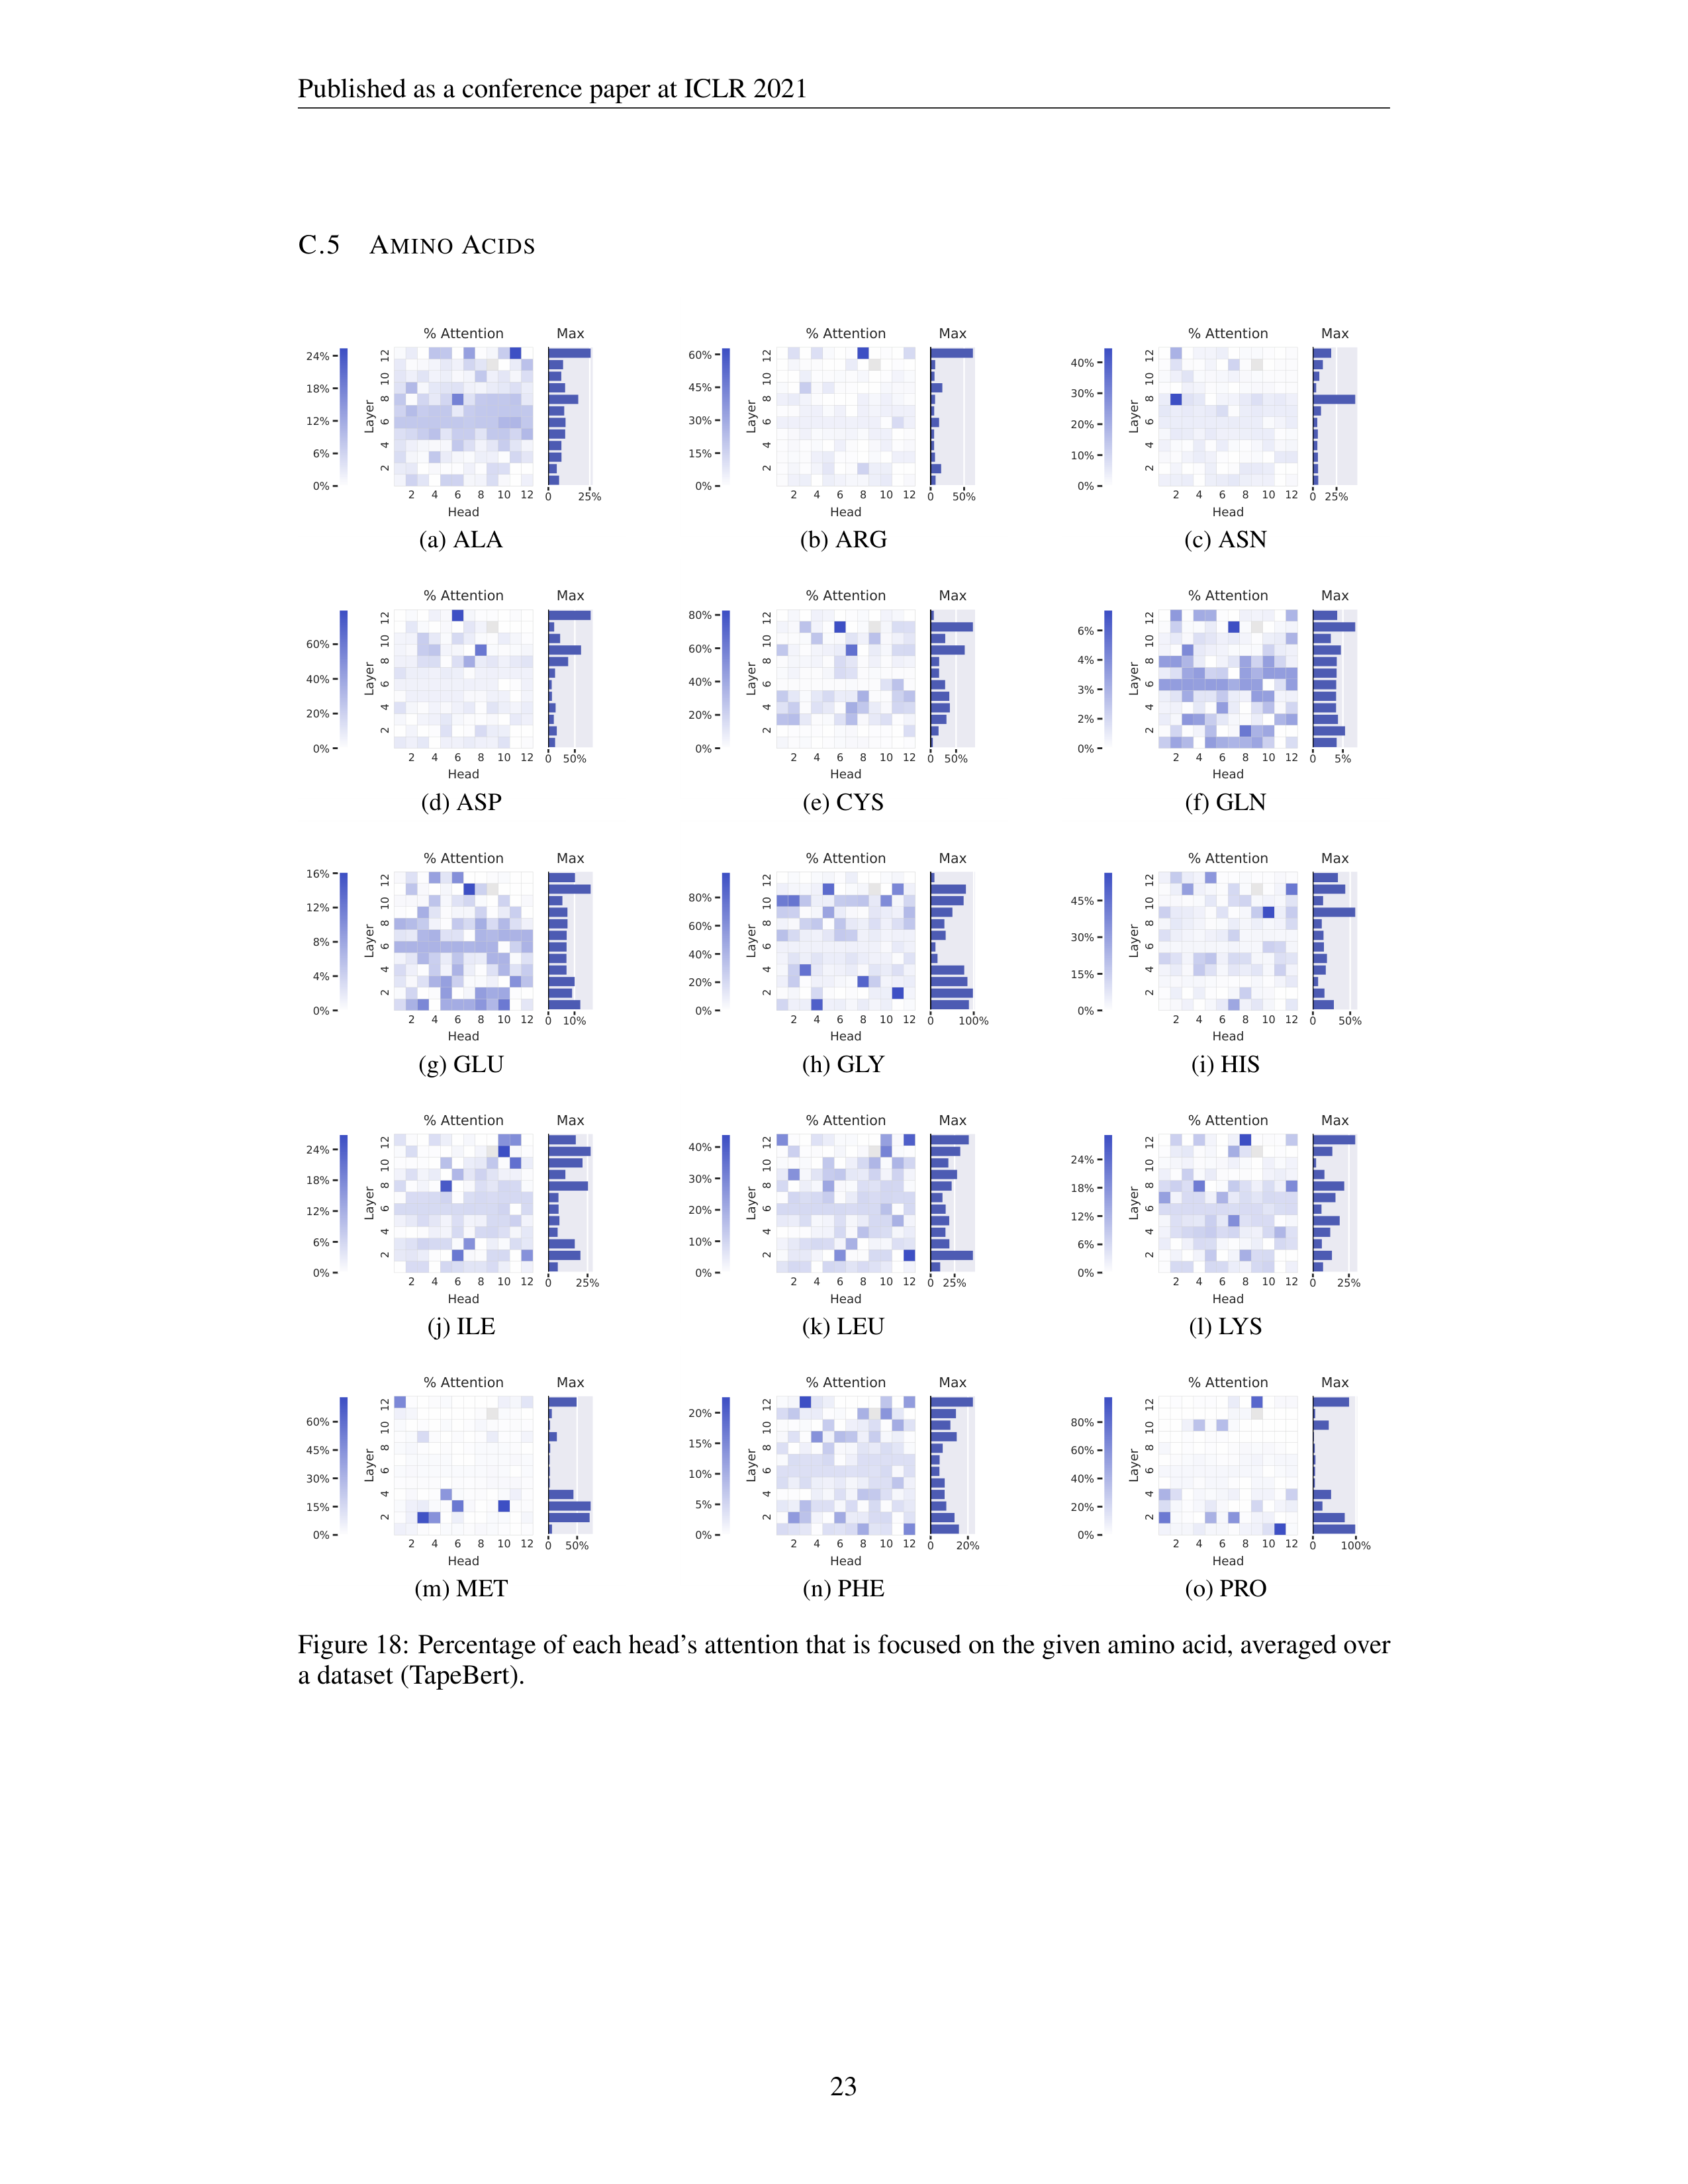
Published as a conference paper at ICLR 2021
C.5
A
MINO
A
CIDS
2
4
6
8
10
12
Head
2
4
6
8
10
12
Layer
% Attention
0
25%
Max
0%
6%
12%
18%
24%
(a) ALA
2
4
6
8
10
12
Head
2
4
6
8
10
12
Layer
% Attention
0
50%
Max
0%
15%
30%
45%
60%
(b) ARG
2
4
6
8
10
12
Head
2
4
6
8
10
12
Layer
% Attention
0
25%
Max
0%
10%
20%
30%
40%
(c) ASN
2
4
6
8
10
12
Head
2
4
6
8
10
12
Layer
% Attention
0
50%
Max
0%
20%
40%
60%
(d) ASP
2
4
6
8
10
12
Head
2
4
6
8
10
12
Layer
% Attention
0
50%
Max
0%
20%
40%
60%
80%
(e) CYS
2
4
6
8
10
12
Head
2
4
6
8
10
12
Layer
% Attention
0
5%
Max
0%
2%
3%
4%
6%
(f) GLN
2
4
6
8
10
12
Head
2
4
6
8
10
12
Layer
% Attention
0
10%
Max
0%
4%
8%
12%
16%
(g) GLU
2
4
6
8
10
12
Head
2
4
6
8
10
12
Layer
% Attention
0
100%
Max
0%
20%
40%
60%
80%
(h) GLY
2
4
6
8
10
12
Head
2
4
6
8
10
12
Layer
% Attention
0
50%
Max
0%
15%
30%
45%
(i) HIS
2
4
6
8
10
12
Head
2
4
6
8
10
12
Layer
% Attention
0
25%
Max
0%
6%
12%
18%
24%
(j) ILE
2
4
6
8
10
12
Head
2
4
6
8
10
12
Layer
% Attention
0
25%
Max
0%
10%
20%
30%
40%
(k) LEU
2
4
6
8
10
12
Head
2
4
6
8
10
12
Layer
% Attention
0
25%
Max
0%
6%
12%
18%
24%
(l) LYS
2
4
6
8
10
12
Head
2
4
6
8
10
12
Layer
% Attention
0
50%
Max
0%
15%
30%
45%
60%
(m) MET
2
4
6
8
10
12
Head
2
4
6
8
10
12
Layer
% Attention
0
20%
Max
0%
5%
10%
15%
20%
(n) PHE
2
4
6
8
10
12
Head
2
4
6
8
10
12
Layer
% Attention
0
100%
Max
0%
20%
40%
60%
80%
(o) PRO
Figure 18:
Percentage of each head’s attention that is focused on the given amino acid, averaged over
a dataset (TapeBert).
23
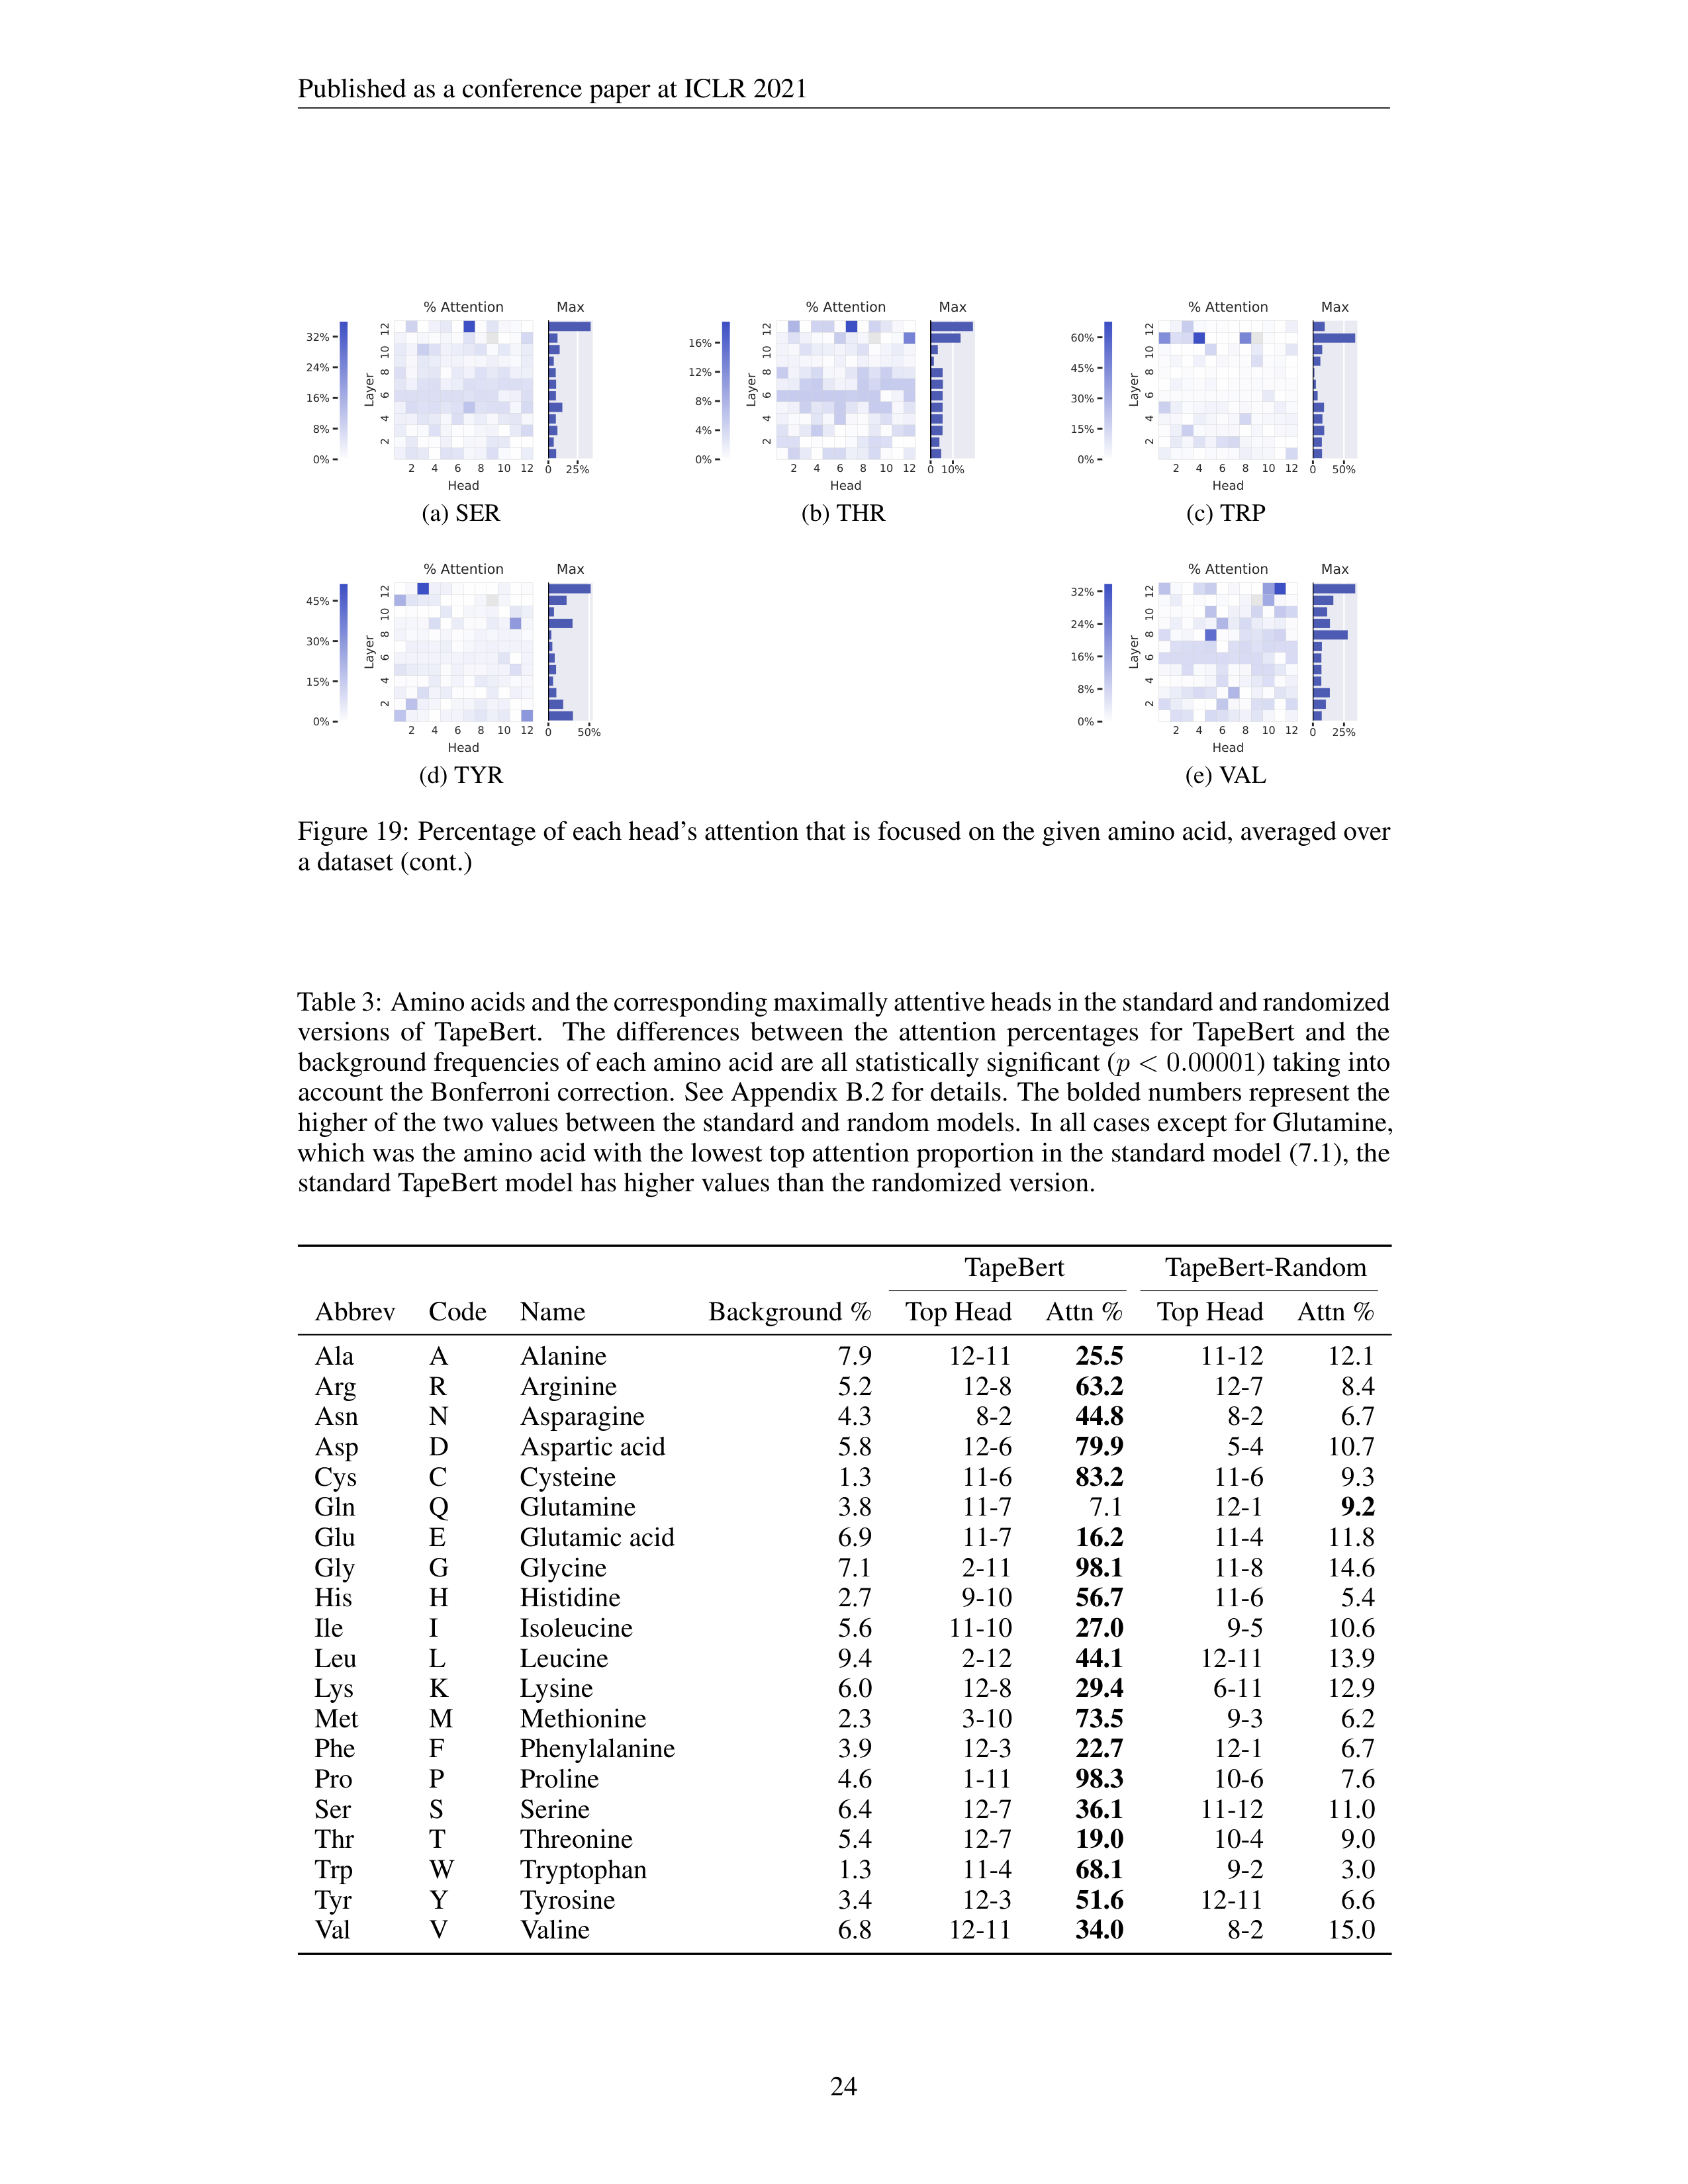
Published as a conference paper at ICLR 2021
2
4
6
8
10
12
Head
2
4
6
8
10
12
Layer
% Attention
0
25%
Max
0%
8%
16%
24%
32%
(a) SER
2
4
6
8
10
12
Head
2
4
6
8
10
12
Layer
% Attention
0
10%
Max
0%
4%
8%
12%
16%
(b) THR
2
4
6
8
10
12
Head
2
4
6
8
10
12
Layer
% Attention
0
50%
Max
0%
15%
30%
45%
60%
(c) TRP
2
4
6
8
10
12
Head
2
4
6
8
10
12
Layer
% Attention
0
50%
Max
0%
15%
30%
45%
(d) TYR
2
4
6
8
10
12
Head
2
4
6
8
10
12
Layer
% Attention
0
25%
Max
0%
8%
16%
24%
32%
(e) VAL
Figure 19:
Percentage of each head’s attention that is focused on the given amino acid, averaged over
a dataset (cont.)
Table 3: Amino acids and the corresponding maximally attentive heads in the standard and randomized
versions
of
TapeBert.
The
differences
between
the
attention
percentages
for
TapeBert
and
the
background frequencies of each amino acid are all statistically significant (
p <
0
.
00001
) taking into
account the Bonferroni correction.
See Appendix B.2 for details.
The bolded numbers represent the
higher of the two values between the standard and random models.
In all cases except for Glutamine,
which was the amino acid with the lowest top attention proportion in the standard model (7.1), the
standard TapeBert model has higher values than the randomized version.
TapeBert
TapeBert-Random
Abbrev
Code
Name
Background %
Top Head
Attn %
Top Head
Attn %
Ala
A
Alanine
7.9
12-11
25.5
11-12
12.1
Arg
R
Arginine
5.2
12-8
63.2
12-7
8.4
Asn
N
Asparagine
4.3
8-2
44.8
8-2
6.7
Asp
D
Aspartic acid
5.8
12-6
79.9
5-4
10.7
Cys
C
Cysteine
1.3
11-6
83.2
11-6
9.3
Gln
Q
Glutamine
3.8
11-7
7.1
12-1
9.2
Glu
E
Glutamic acid
6.9
11-7
16.2
11-4
11.8
Gly
G
Glycine
7.1
2-11
98.1
11-8
14.6
His
H
Histidine
2.7
9-10
56.7
11-6
5.4
Ile
I
Isoleucine
5.6
11-10
27.0
9-5
10.6
Leu
L
Leucine
9.4
2-12
44.1
12-11
13.9
Lys
K
Lysine
6.0
12-8
29.4
6-11
12.9
Met
M
Methionine
2.3
3-10
73.5
9-3
6.2
Phe
F
Phenylalanine
3.9
12-3
22.7
12-1
6.7
Pro
P
Proline
4.6
1-11
98.3
10-6
7.6
Ser
S
Serine
6.4
12-7
36.1
11-12
11.0
Thr
T
Threonine
5.4
12-7
19.0
10-4
9.0
Trp
W
Tryptophan
1.3
11-4
68.1
9-2
3.0
Tyr
Y
Tyrosine
3.4
12-3
51.6
12-11
6.6
Val
V
Valine
6.8
12-11
34.0
8-2
15.0
24