PROCTER & GAMBLE
PORTFOLIO & PRODUCTIVITY TRANSFORMATION
Research-based synthesized action plan • Not an official Procter & Gamble publication
1
PROCTER & GAMBLE
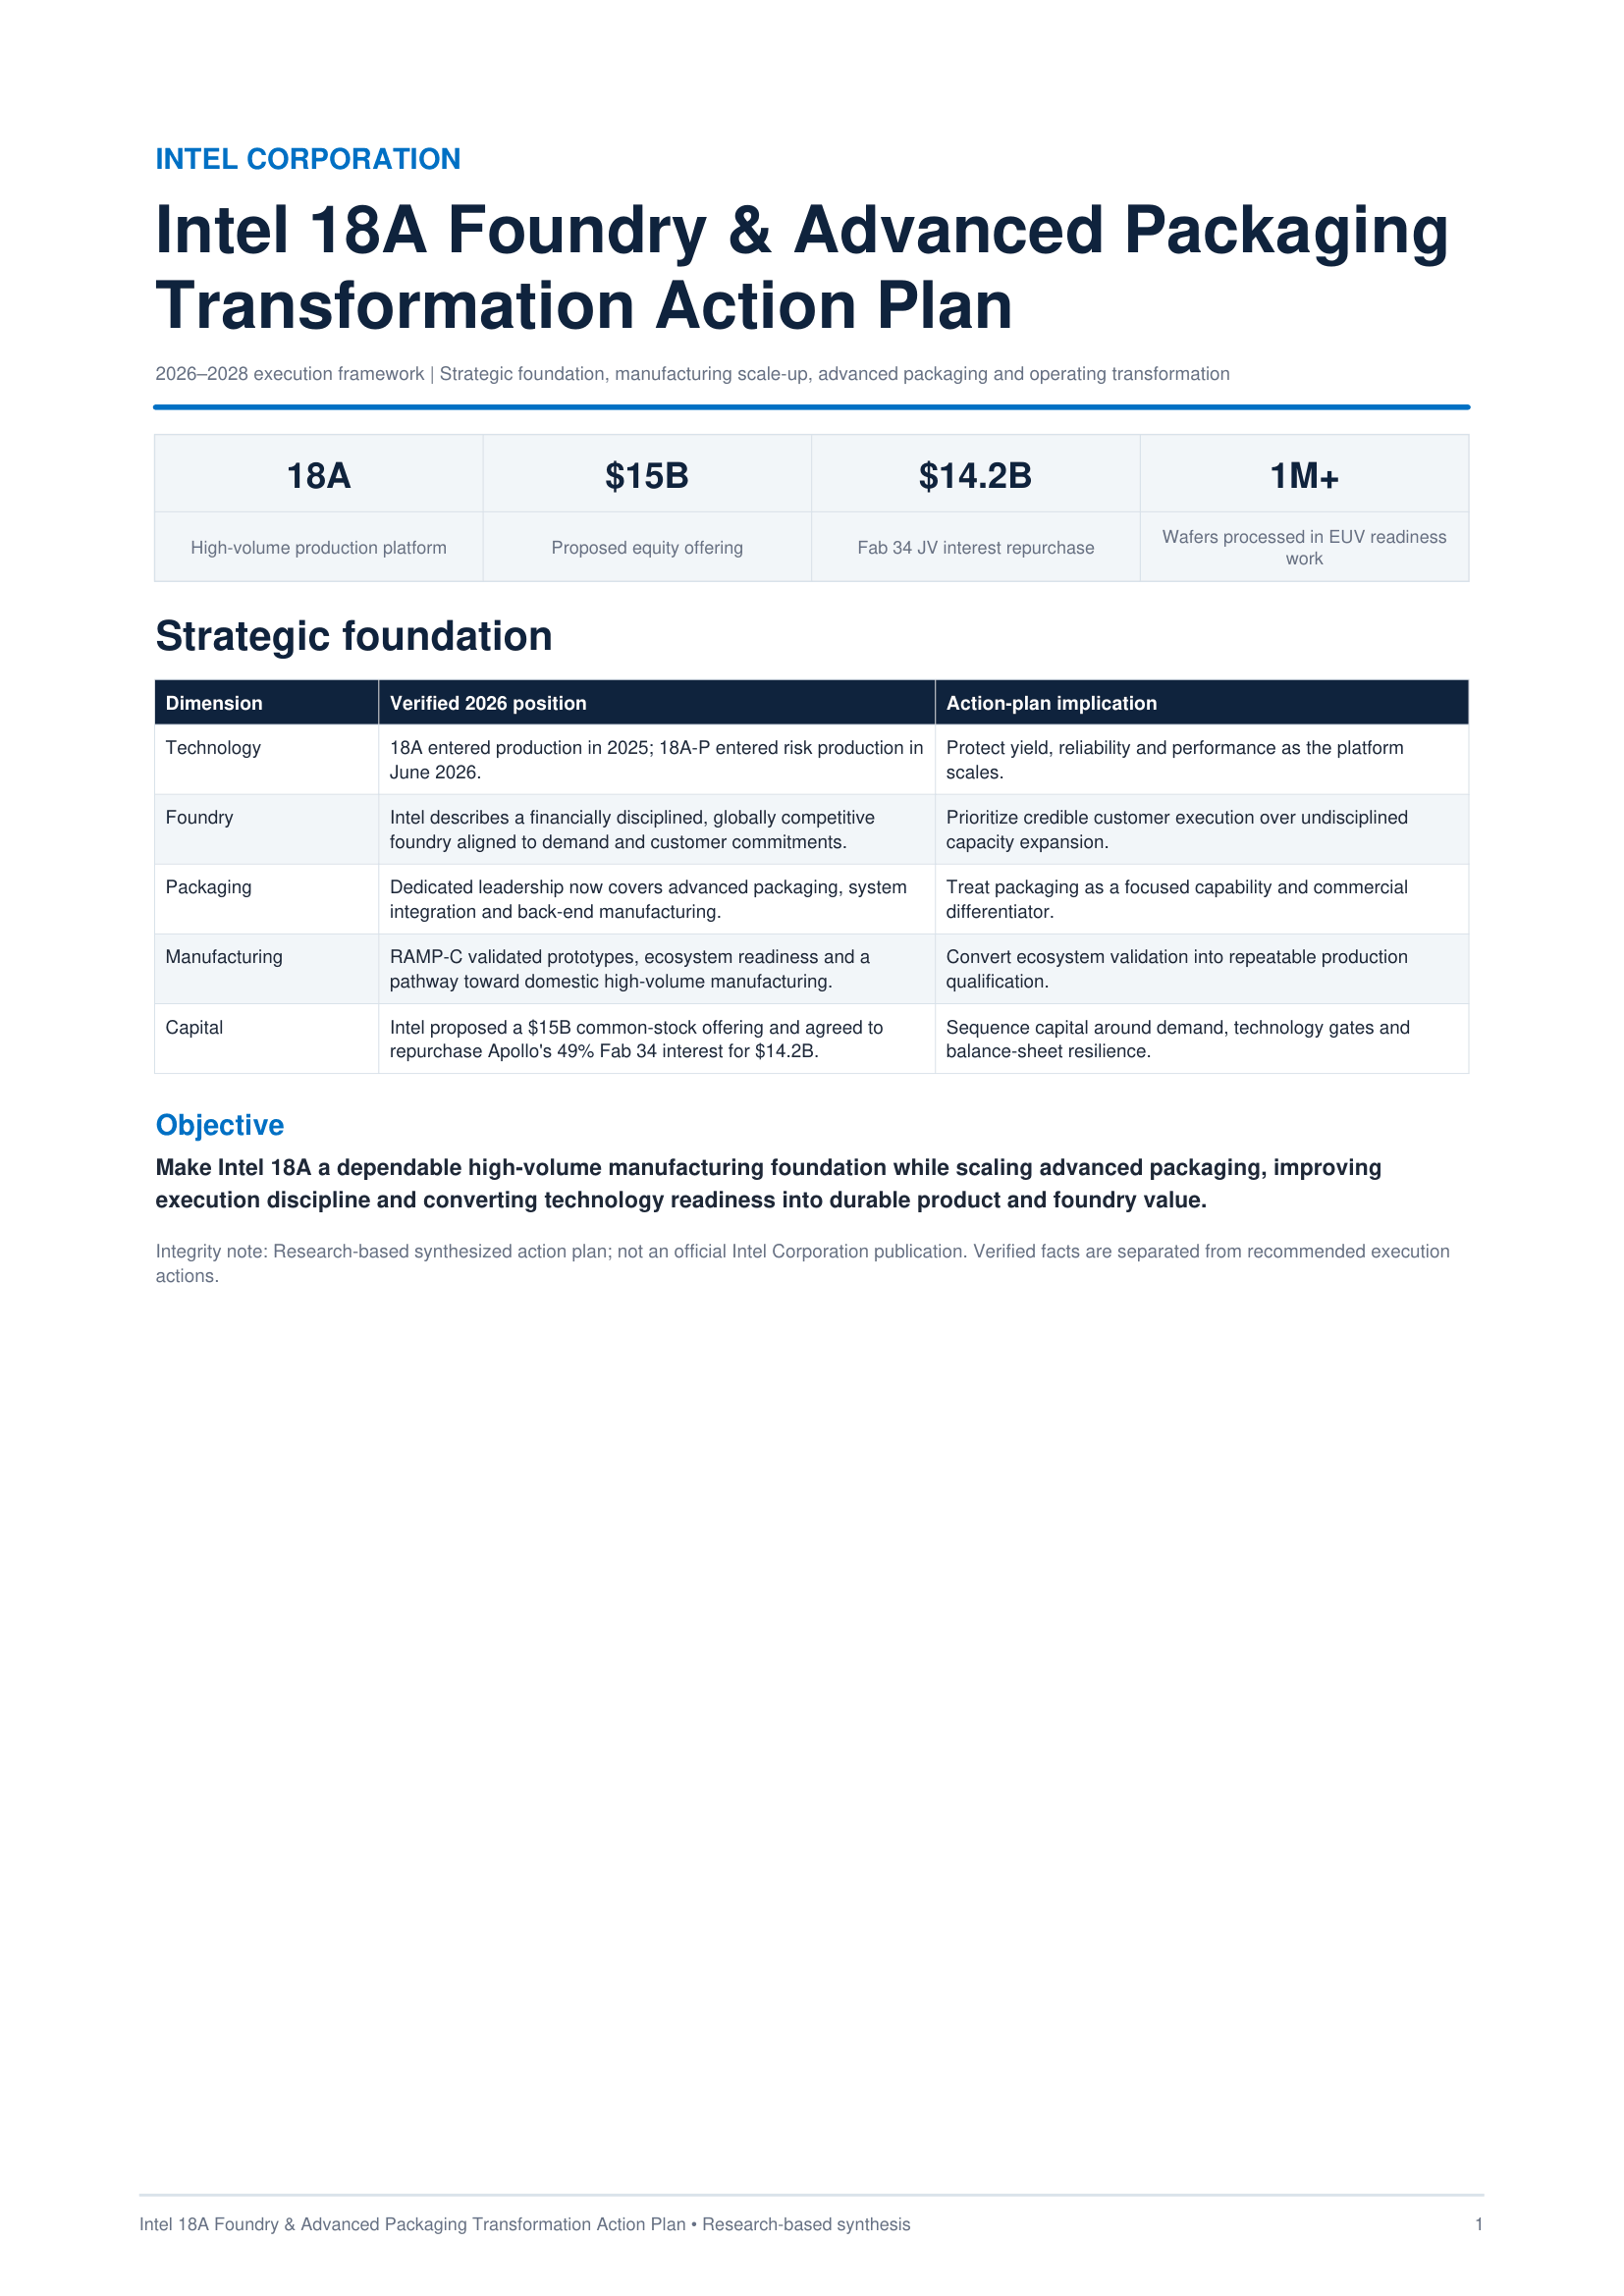
Procter & Gamble $1.6 Billion Portfolio &
Productivity Transformation Action Plan
Portfolio focus • supply-chain right-sizing • organization design • productivity • consumer-led growth
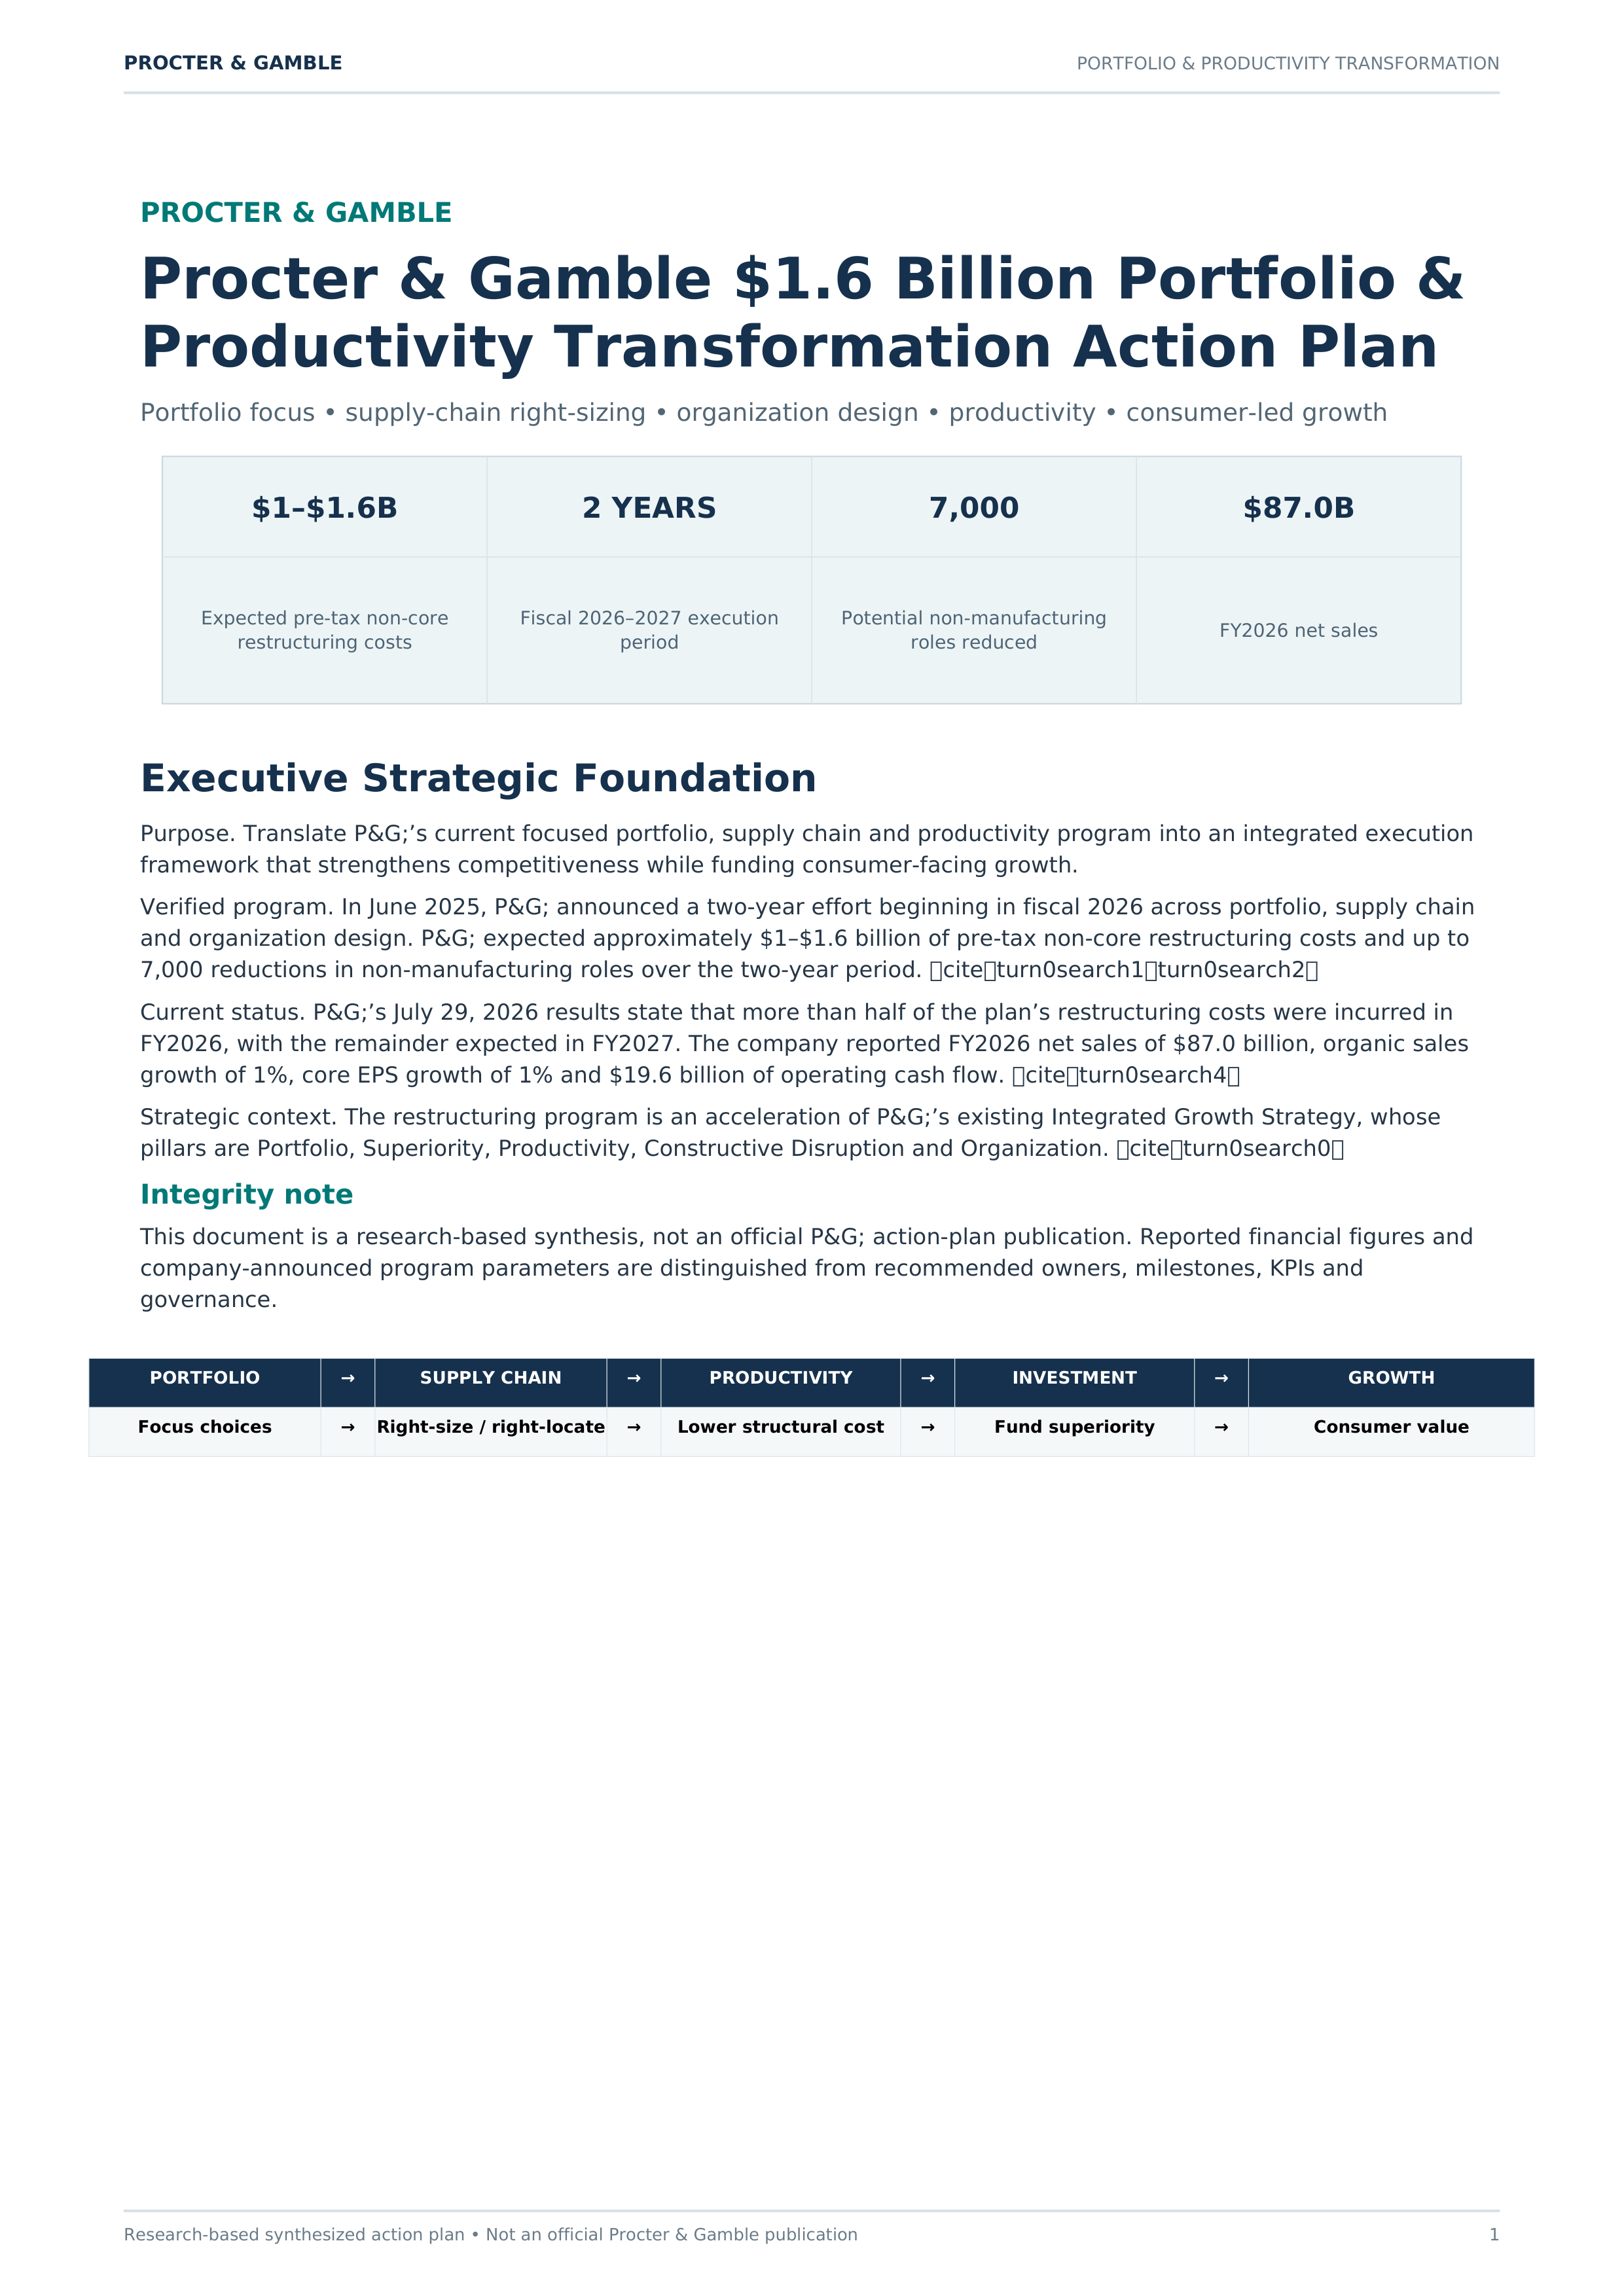
$1–$1.6B
2 YEARS
7,000
$87.0B
Expected pre-tax non-core
restructuring costs
Fiscal 2026–2027 execution
period
Potential non-manufacturing
roles reduced
FY2026 net sales
Executive Strategic Foundation
Purpose. Translate P&G;’s current focused portfolio, supply chain and productivity program into an integrated execution
framework that strengthens competitiveness while funding consumer-facing growth.
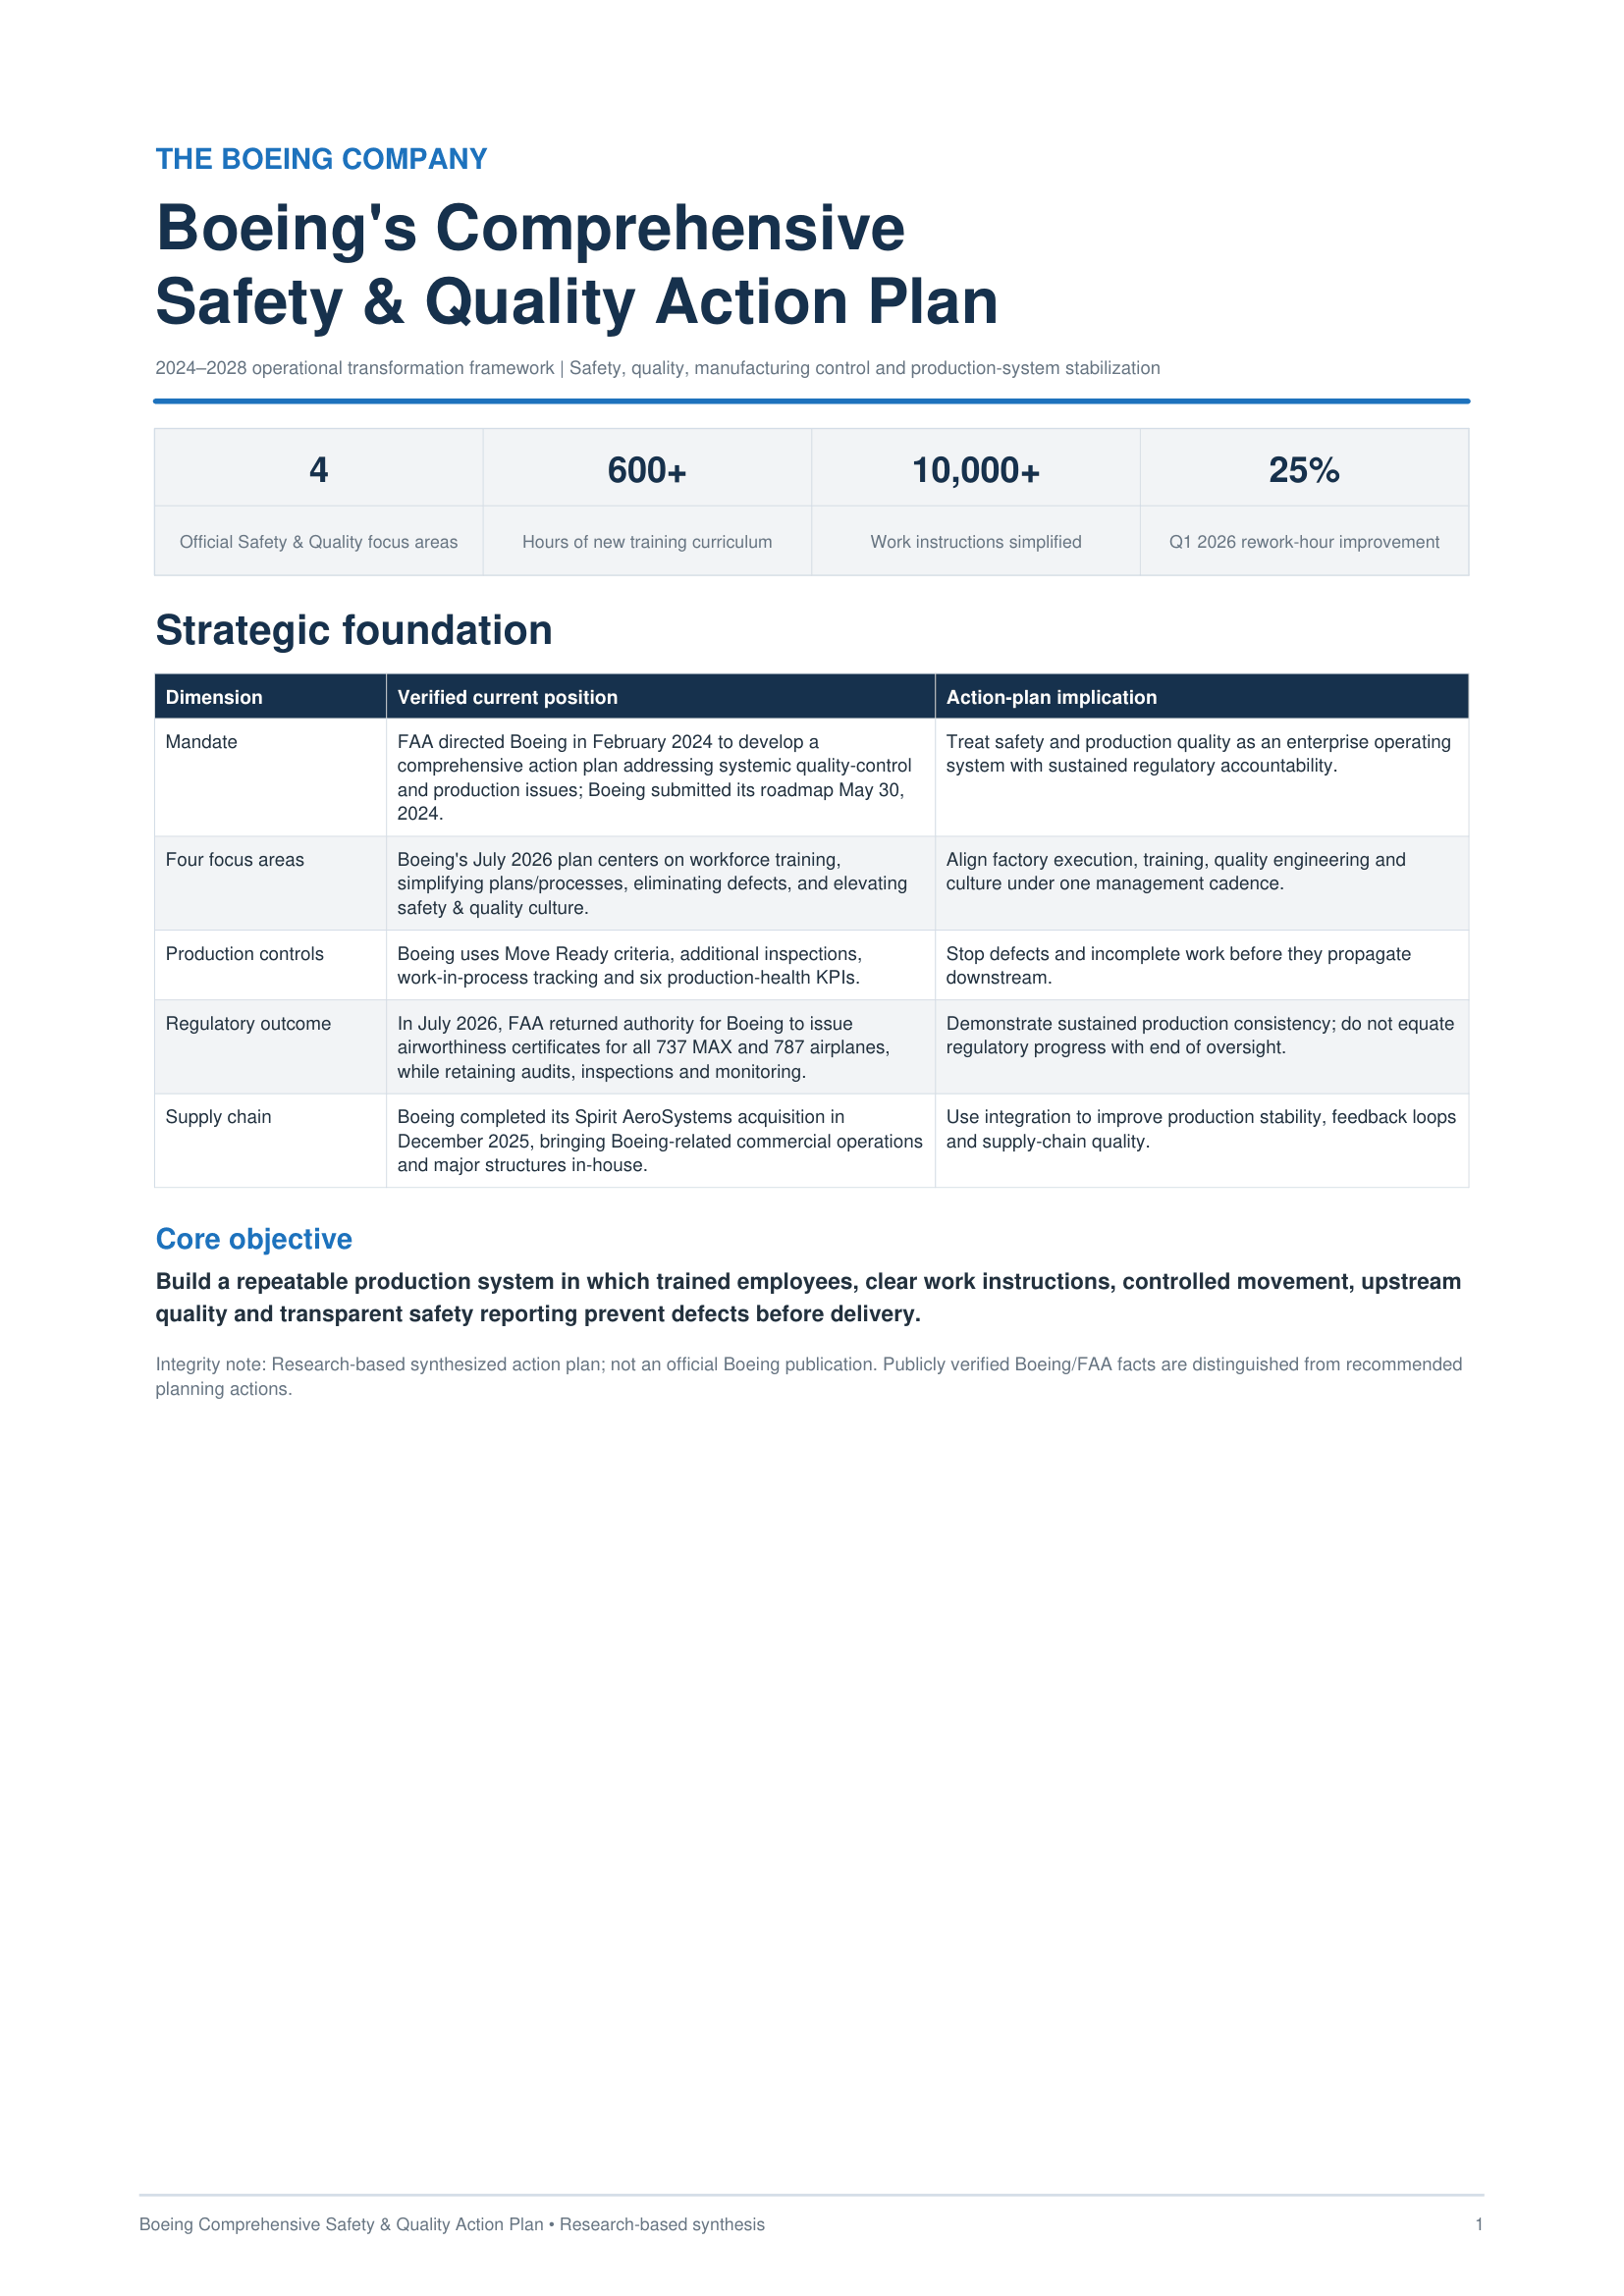
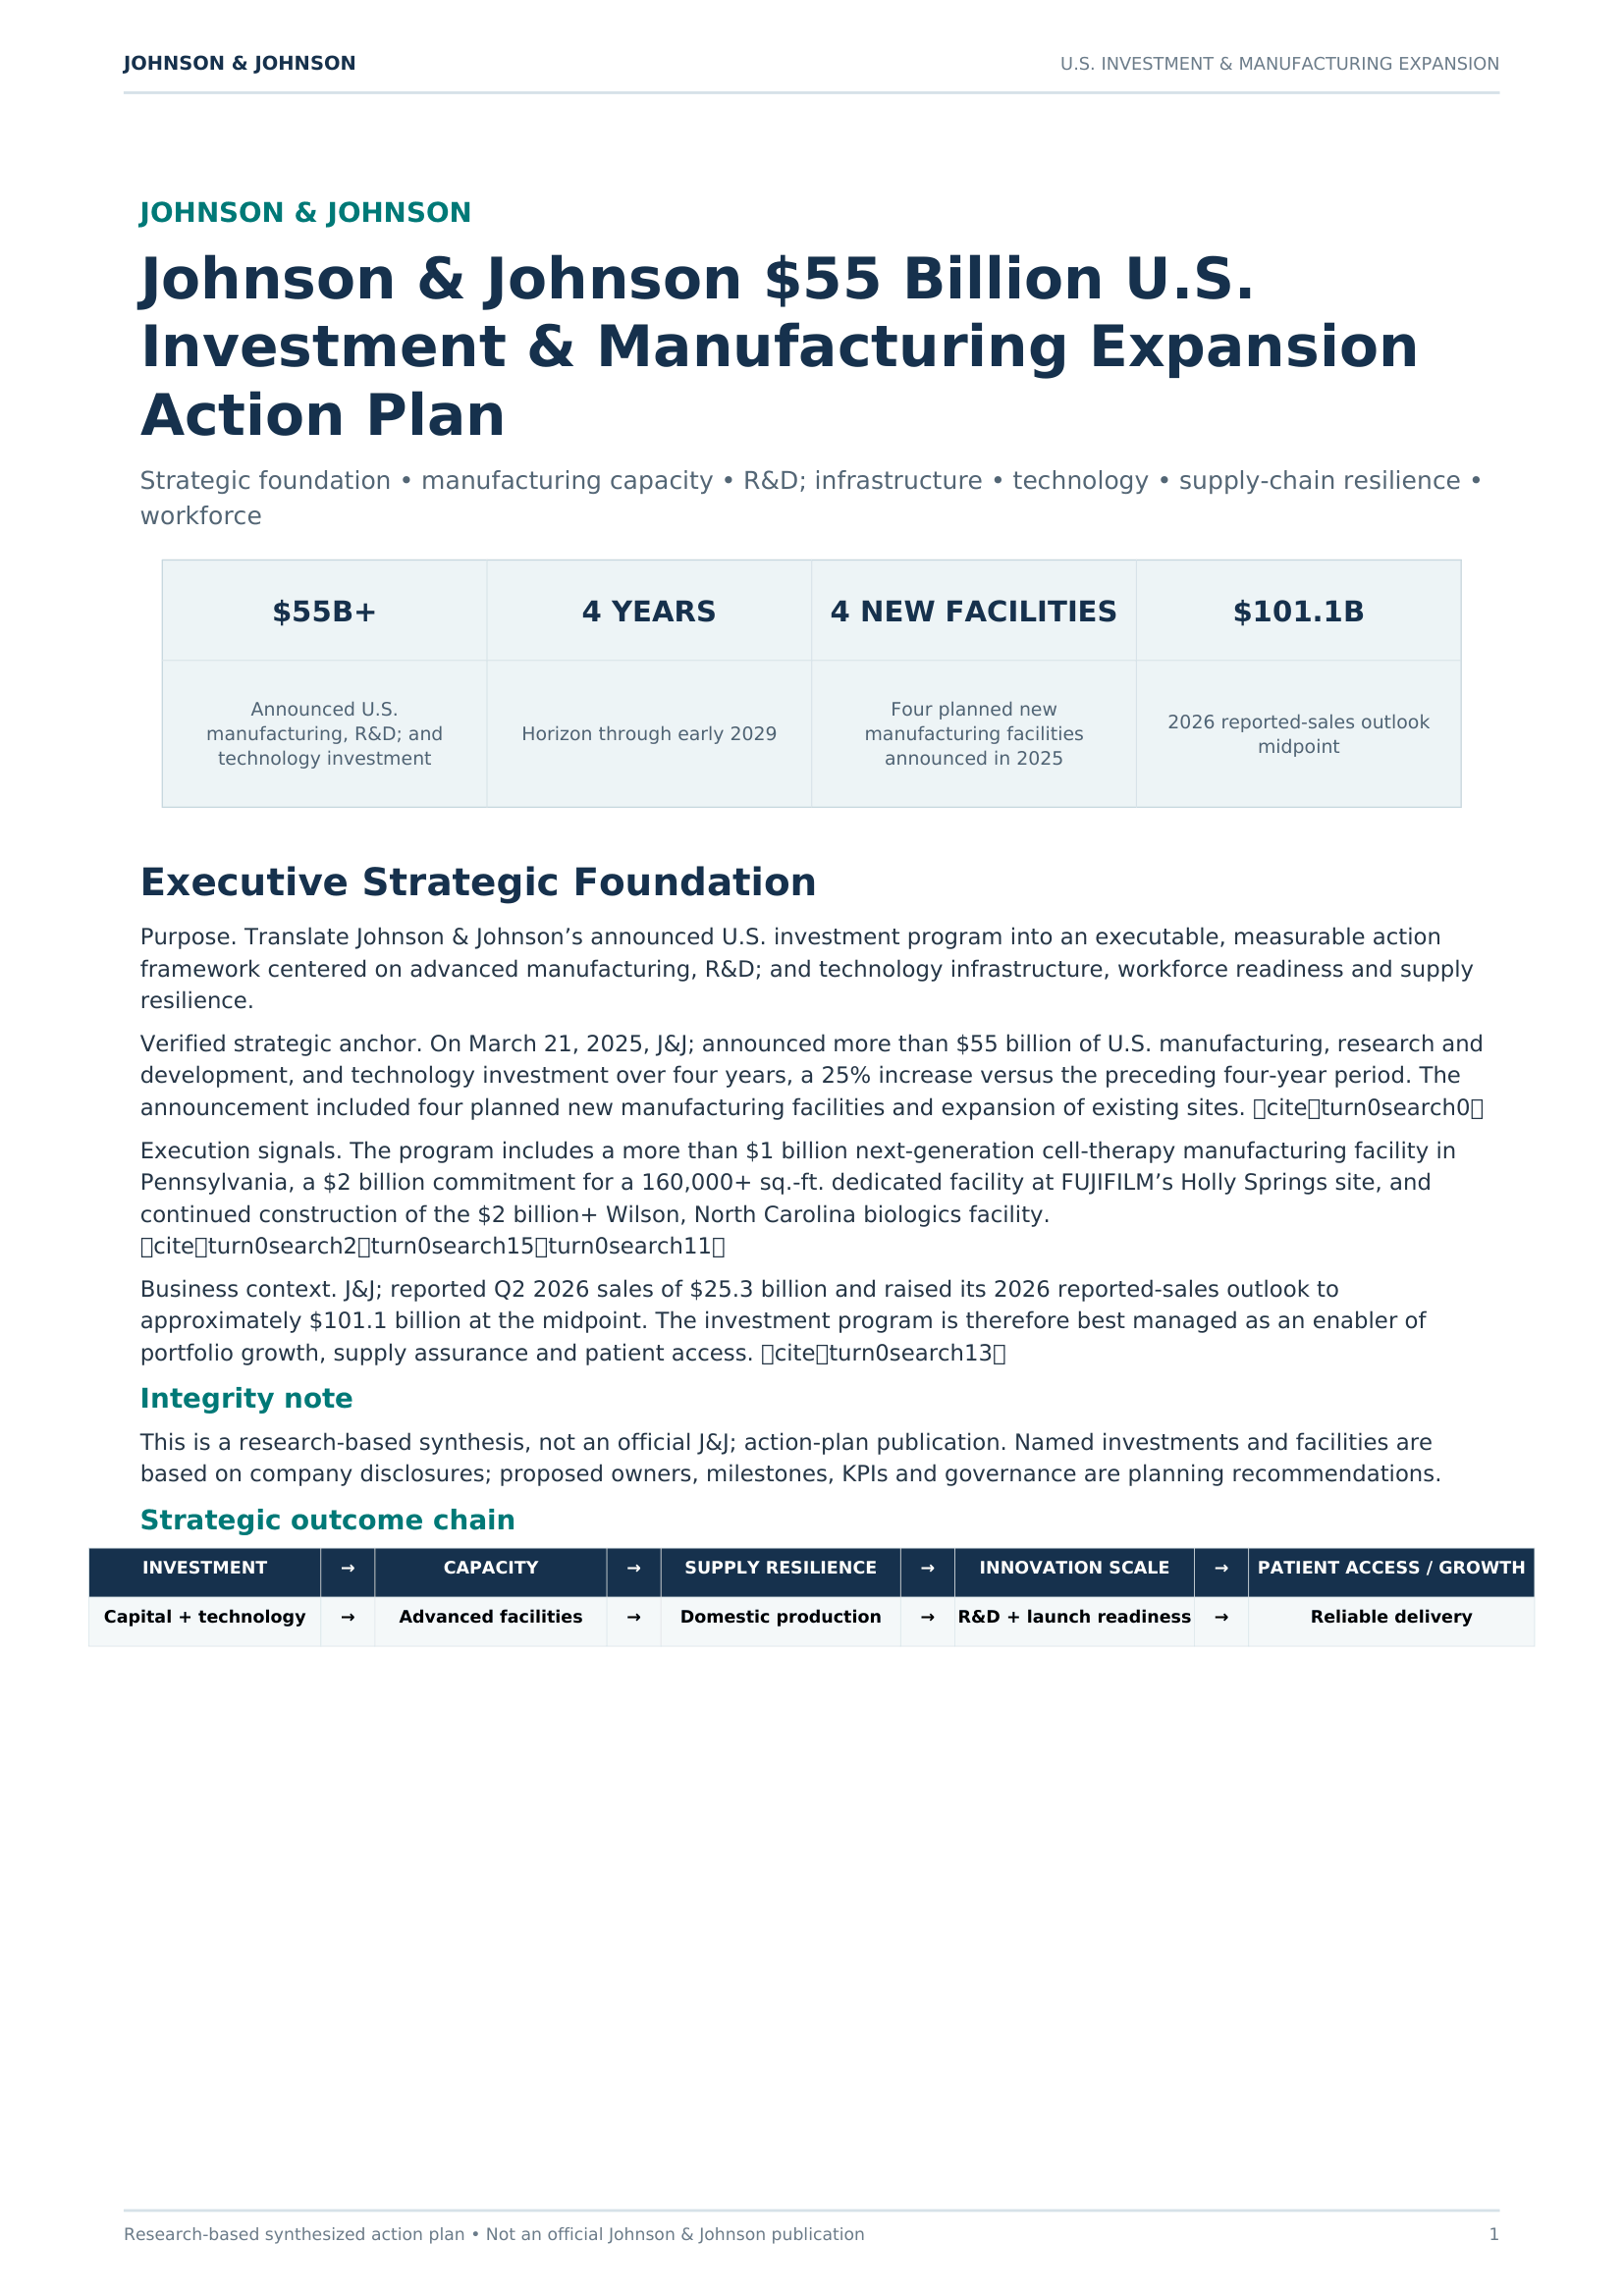
Verified program. In June 2025, P&G; announced a two-year effort beginning in fiscal 2026 across portfolio, supply chain
and organization design. P&G; expected approximately $1–$1.6 billion of pre-tax non-core restructuring costs and up to
7,000 reductions in non-manufacturing roles over the two-year period.
citeturn0search1turn0search2
Current status. P&G;’s July 29, 2026 results state that more than half of the plan’s restructuring costs were incurred in
FY2026, with the remainder expected in FY2027. The company reported FY2026 net sales of $87.0 billion, organic sales
growth of 1%, core EPS growth of 1% and $19.6 billion of operating cash flow.
citeturn0search4
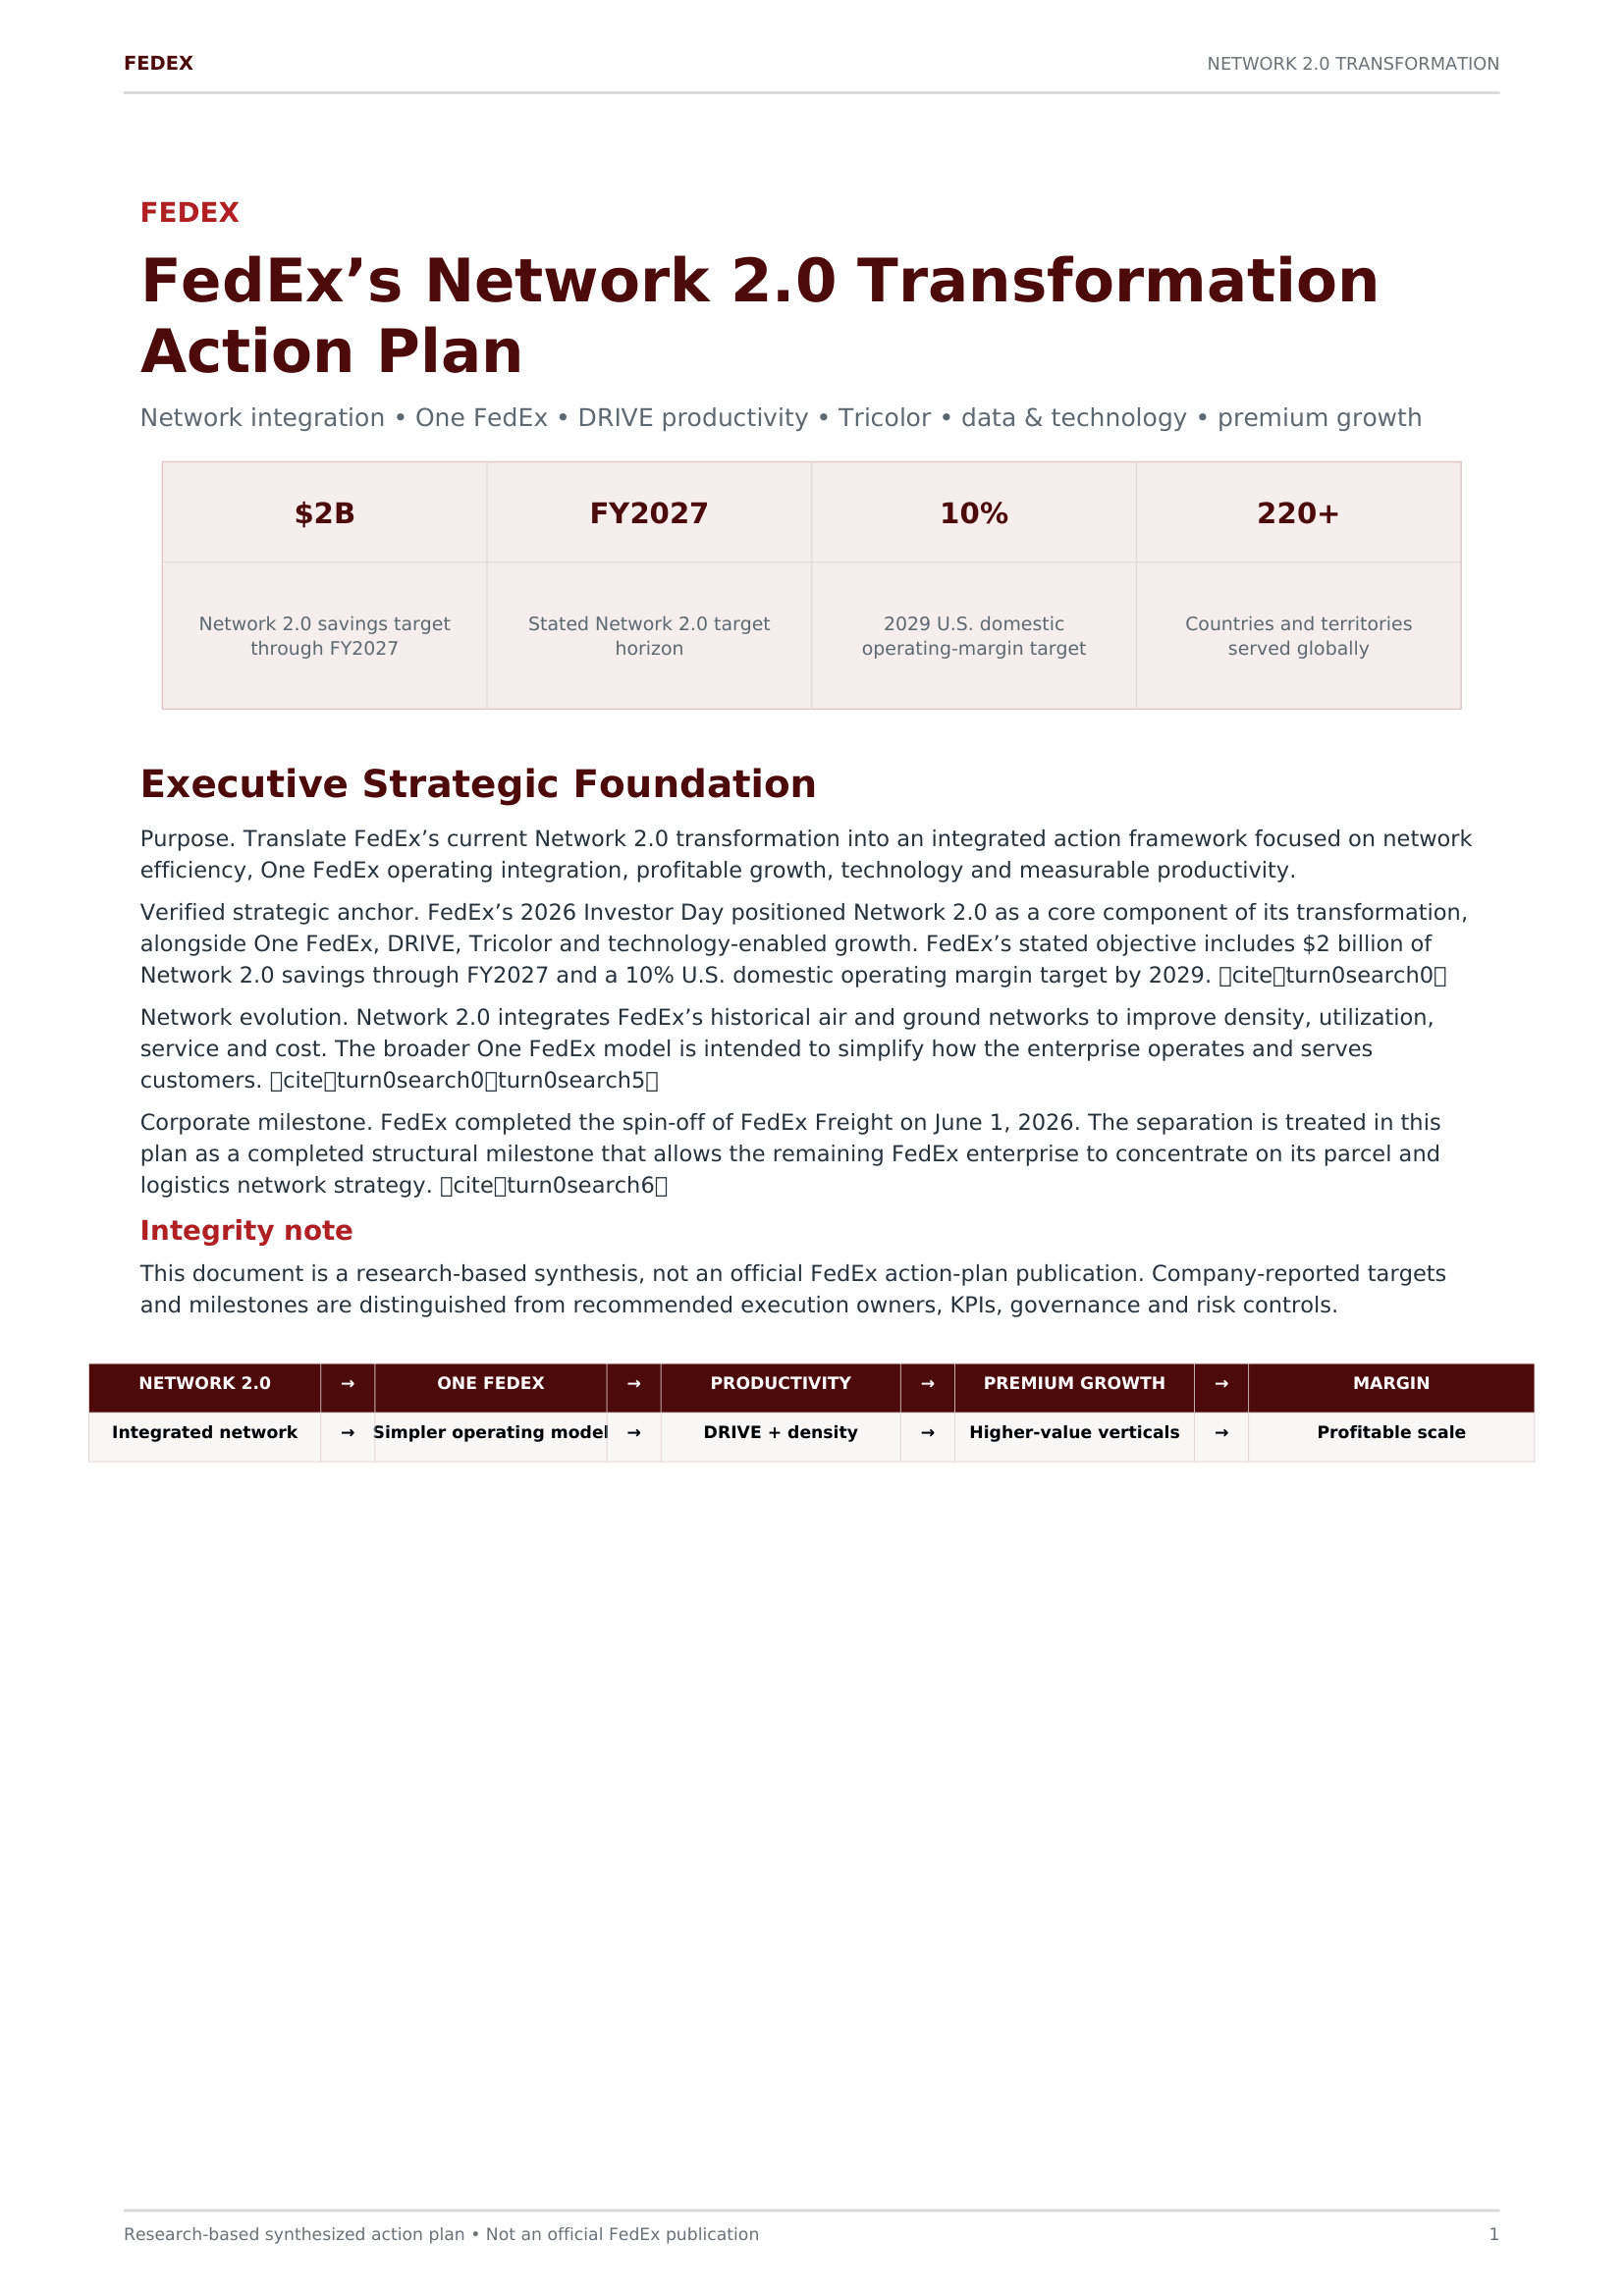
Strategic context. The restructuring program is an acceleration of P&G;’s existing Integrated Growth Strategy, whose
pillars are Portfolio, Superiority, Productivity, Constructive Disruption and Organization.
citeturn0search0
Integrity note
This document is a research-based synthesis, not an official P&G; action-plan publication. Reported financial figures and
company-announced program parameters are distinguished from recommended owners, milestones, KPIs and
governance.
PORTFOLIO
→
SUPPLY CHAIN
→
PRODUCTIVITY
→
INVESTMENT
→
GROWTH
Focus choices
→
Right-size / right-locate
→
Lower structural cost
→
Fund superiority
→
Consumer value
PROCTER & GAMBLE
PORTFOLIO & PRODUCTIVITY TRANSFORMATION
Research-based synthesized action plan • Not an official Procter & Gamble publication
2
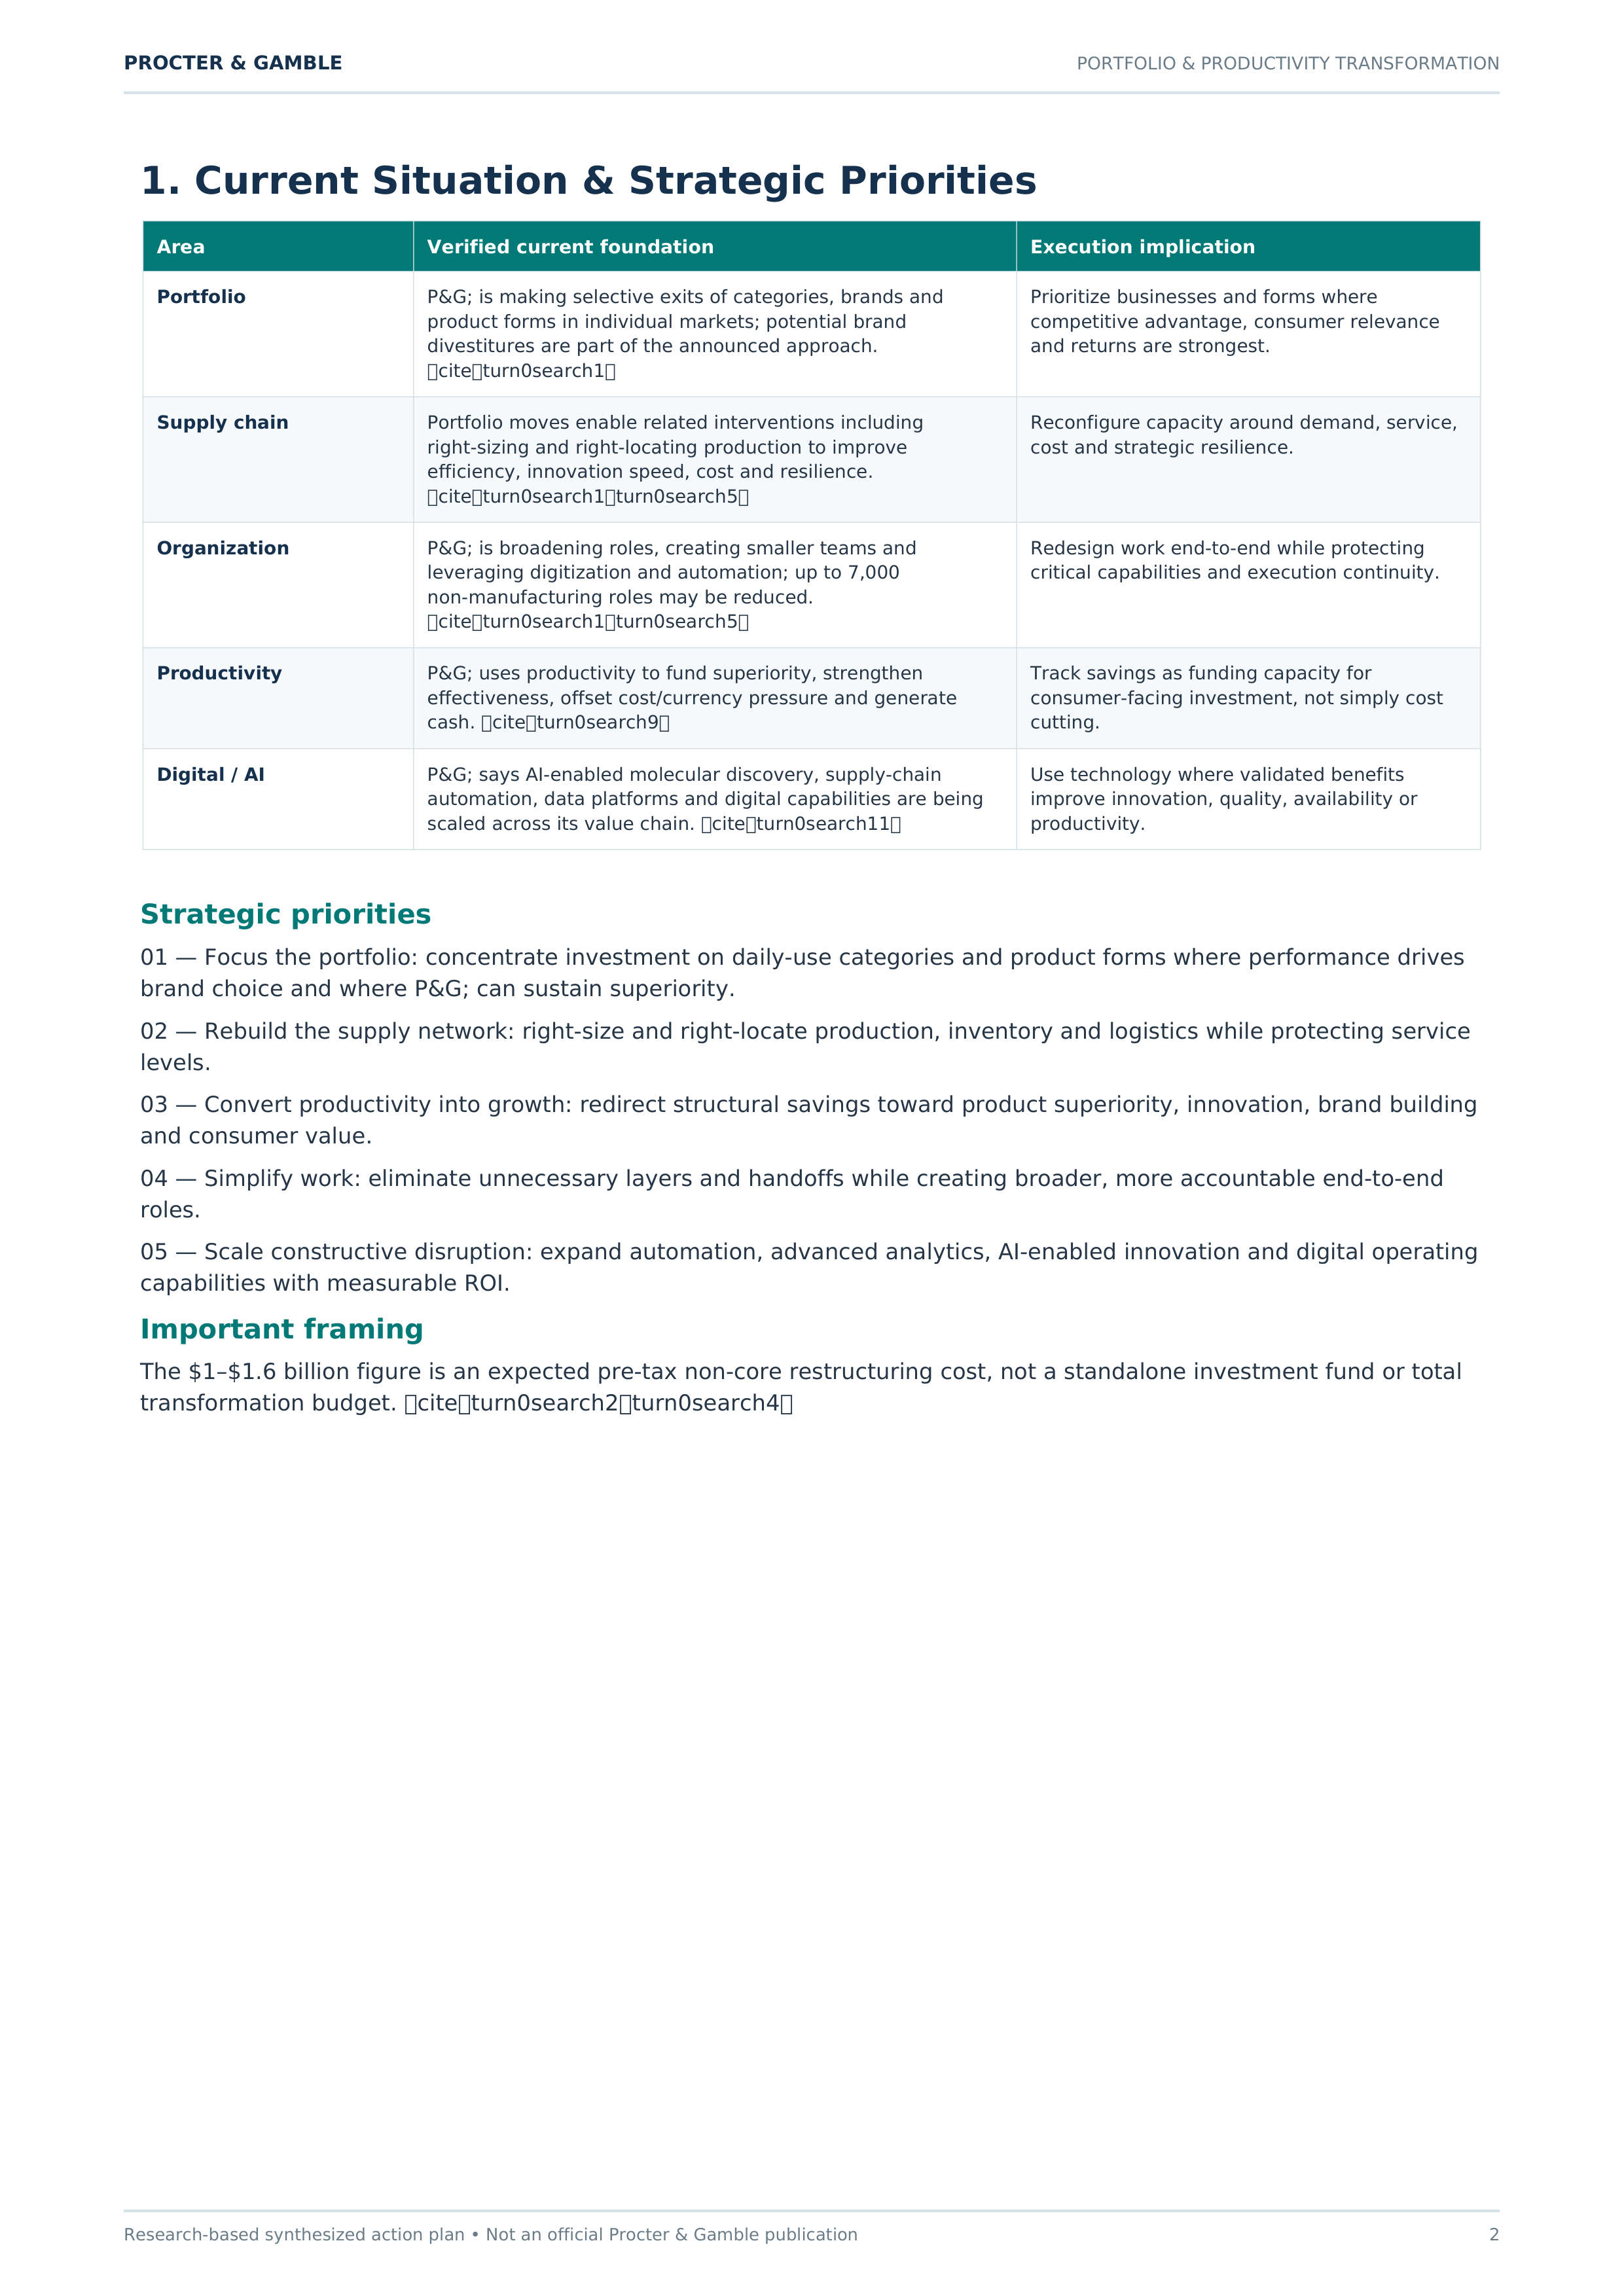
1. Current Situation & Strategic Priorities
Area
Verified current foundation
Execution implication
Portfolio
P&G; is making selective exits of categories, brands and
product forms in individual markets; potential brand
divestitures are part of the announced approach.
citeturn0search1
Prioritize businesses and forms where
competitive advantage, consumer relevance
and returns are strongest.
Supply chain
Portfolio moves enable related interventions including
right-sizing and right-locating production to improve
efficiency, innovation speed, cost and resilience.
citeturn0search1turn0search5
Reconfigure capacity around demand, service,
cost and strategic resilience.
Organization
P&G; is broadening roles, creating smaller teams and
leveraging digitization and automation; up to 7,000
non-manufacturing roles may be reduced.
citeturn0search1turn0search5
Redesign work end-to-end while protecting
critical capabilities and execution continuity.
Productivity
P&G; uses productivity to fund superiority, strengthen
effectiveness, offset cost/currency pressure and generate
cash.
citeturn0search9
Track savings as funding capacity for
consumer-facing investment, not simply cost
cutting.
Digital / AI
P&G; says AI-enabled molecular discovery, supply-chain
automation, data platforms and digital capabilities are being
scaled across its value chain.
citeturn0search11
Use technology where validated benefits
improve innovation, quality, availability or
productivity.
Strategic priorities
01 — Focus the portfolio: concentrate investment on daily-use categories and product forms where performance drives
brand choice and where P&G; can sustain superiority.
02 — Rebuild the supply network: right-size and right-locate production, inventory and logistics while protecting service
levels.
03 — Convert productivity into growth: redirect structural savings toward product superiority, innovation, brand building
and consumer value.
04 — Simplify work: eliminate unnecessary layers and handoffs while creating broader, more accountable end-to-end
roles.
05 — Scale constructive disruption: expand automation, advanced analytics, AI-enabled innovation and digital operating
capabilities with measurable ROI.
Important framing
The $1–$1.6 billion figure is an expected pre-tax non-core restructuring cost, not a standalone investment fund or total
transformation budget.
citeturn0search2turn0search4
PROCTER & GAMBLE
PORTFOLIO & PRODUCTIVITY TRANSFORMATION
Research-based synthesized action plan • Not an official Procter & Gamble publication
3
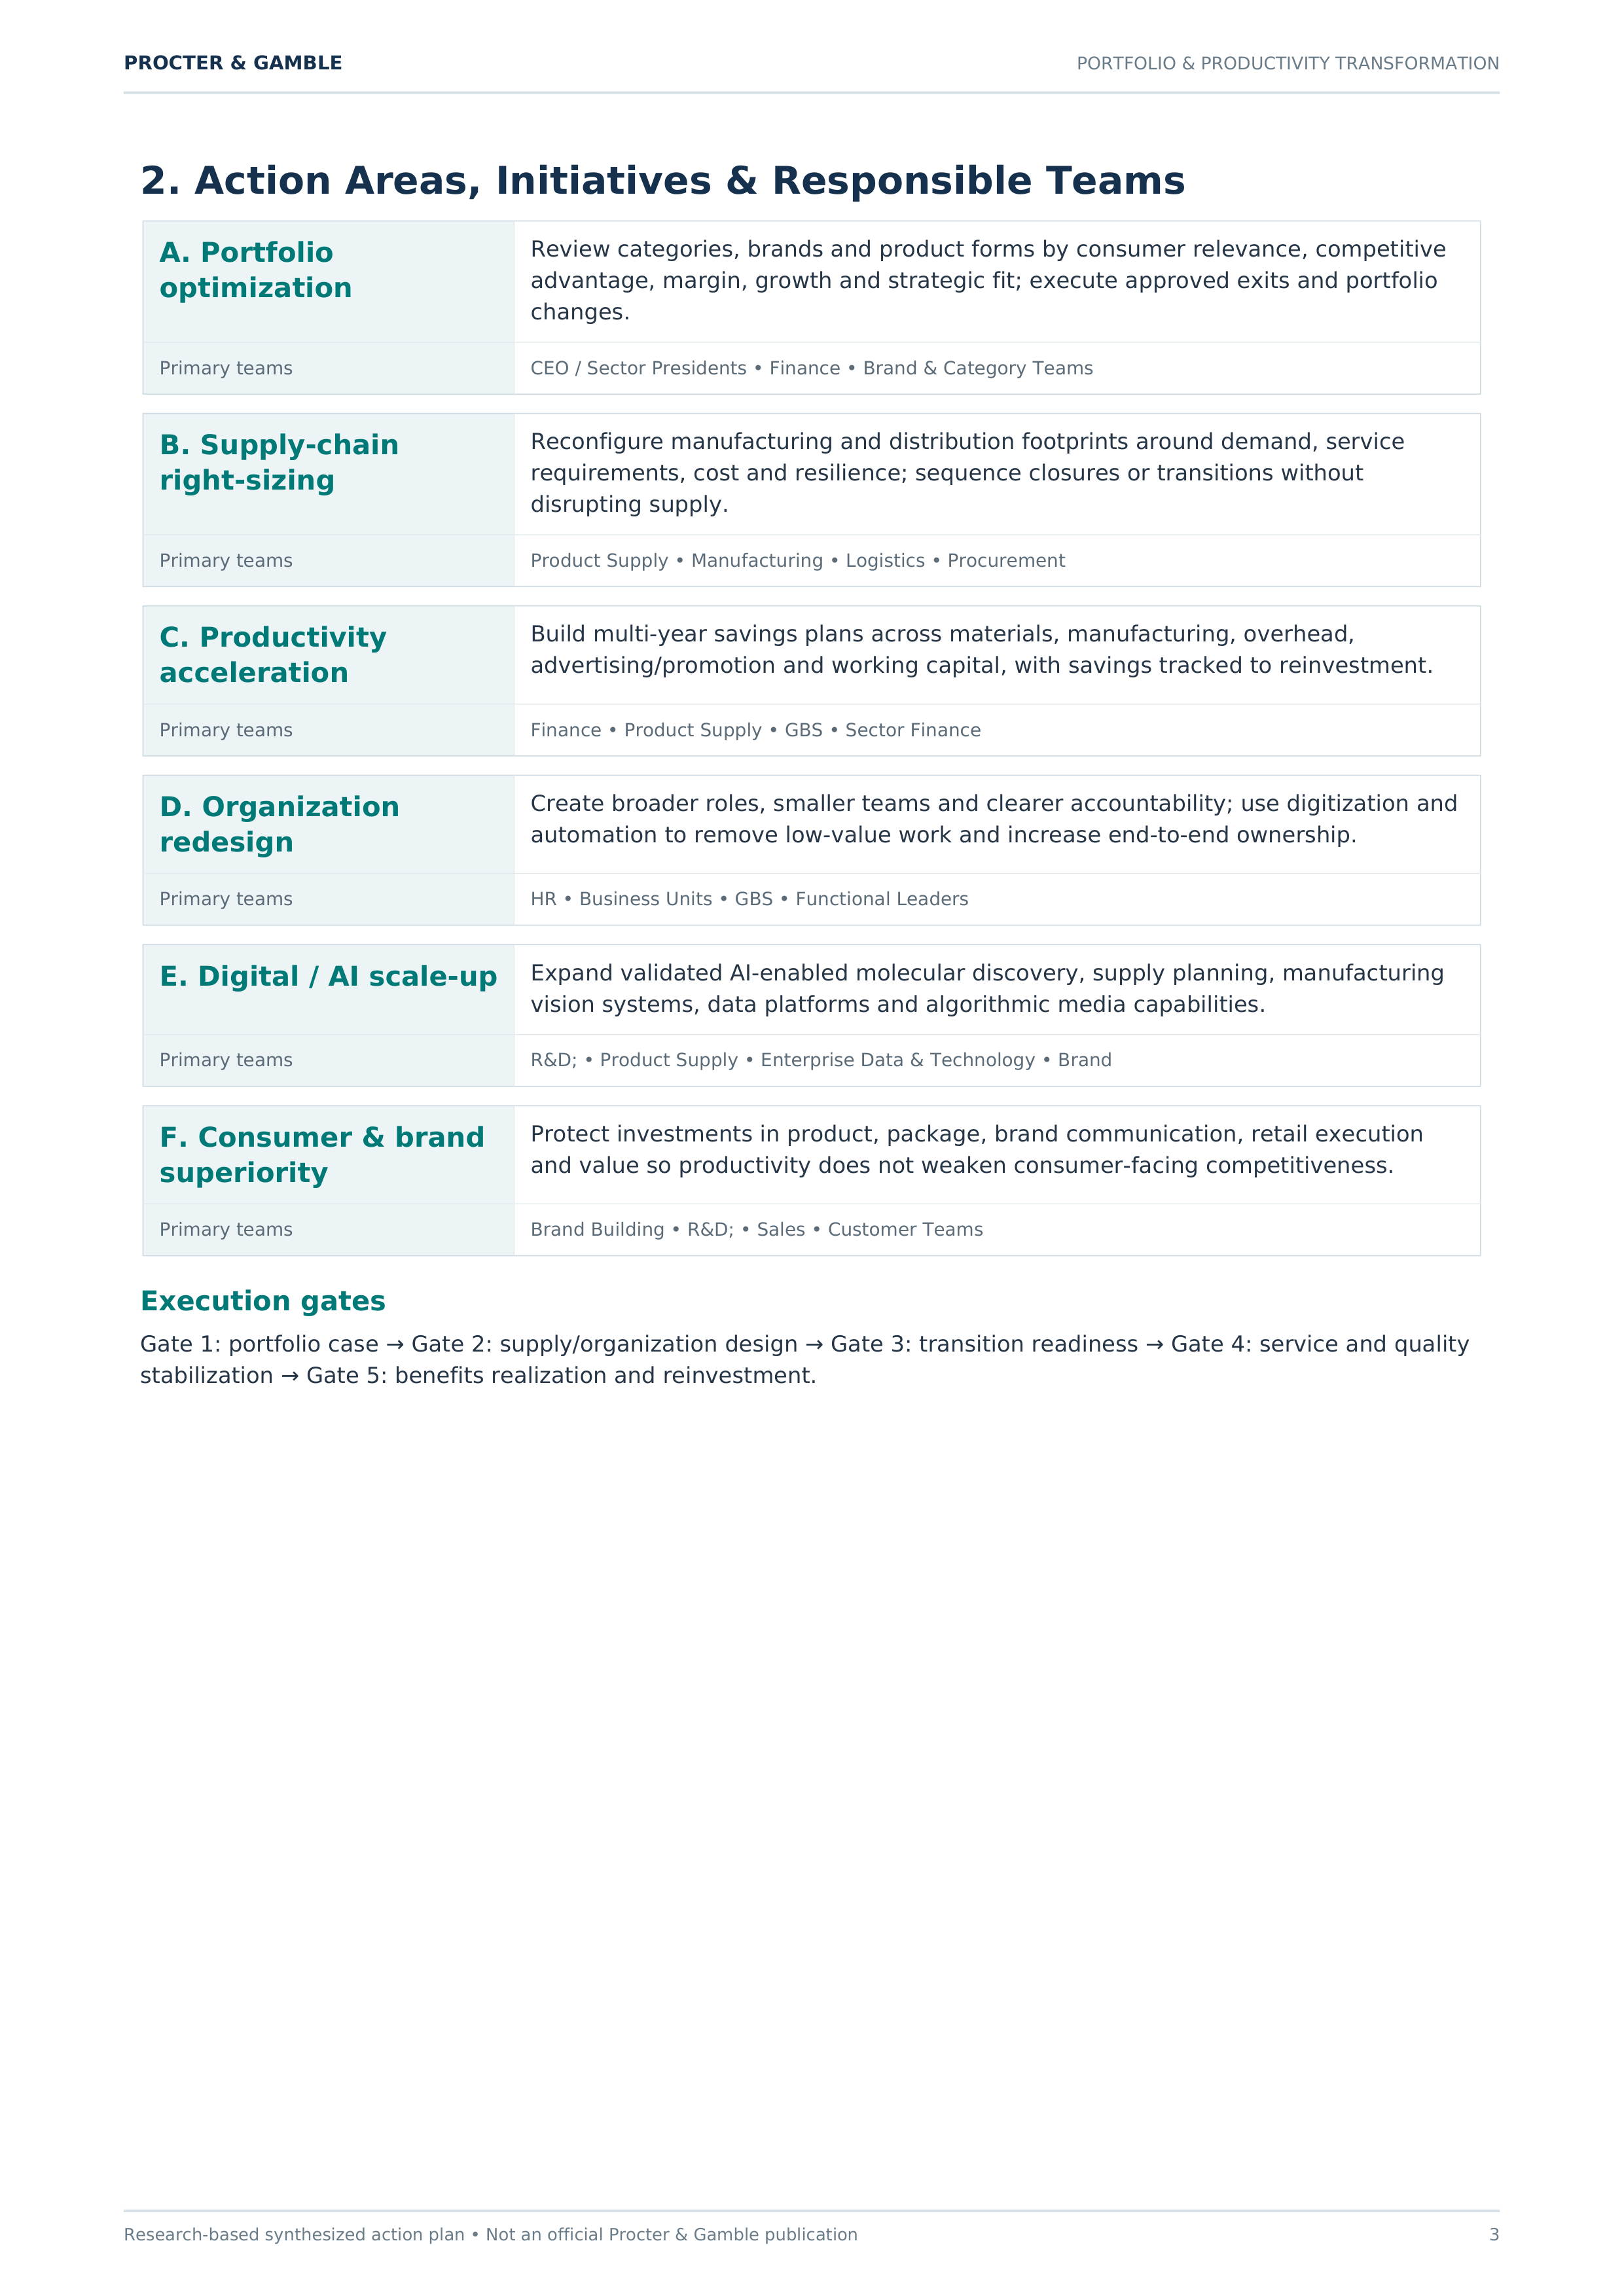
2. Action Areas, Initiatives & Responsible Teams
A. Portfolio
optimization
Review categories, brands and product forms by consumer relevance, competitive
advantage, margin, growth and strategic fit; execute approved exits and portfolio
changes.
Primary teams
CEO / Sector Presidents • Finance • Brand & Category Teams
B. Supply-chain
right-sizing
Reconfigure manufacturing and distribution footprints around demand, service
requirements, cost and resilience; sequence closures or transitions without
disrupting supply.
Primary teams
Product Supply • Manufacturing • Logistics • Procurement
C. Productivity
acceleration
Build multi-year savings plans across materials, manufacturing, overhead,
advertising/promotion and working capital, with savings tracked to reinvestment.
Primary teams
Finance • Product Supply • GBS • Sector Finance
D. Organization
redesign
Create broader roles, smaller teams and clearer accountability; use digitization and
automation to remove low-value work and increase end-to-end ownership.
Primary teams
HR • Business Units • GBS • Functional Leaders
E. Digital / AI scale-up
Expand validated AI-enabled molecular discovery, supply planning, manufacturing
vision systems, data platforms and algorithmic media capabilities.
Primary teams
R&D; • Product Supply • Enterprise Data & Technology • Brand
F. Consumer & brand
superiority
Protect investments in product, package, brand communication, retail execution
and value so productivity does not weaken consumer-facing competitiveness.
Primary teams
Brand Building • R&D; • Sales • Customer Teams
Execution gates
Gate 1: portfolio case → Gate 2: supply/organization design → Gate 3: transition readiness → Gate 4: service and quality
stabilization → Gate 5: benefits realization and reinvestment.
PROCTER & GAMBLE
PORTFOLIO & PRODUCTIVITY TRANSFORMATION
Research-based synthesized action plan • Not an official Procter & Gamble publication
4
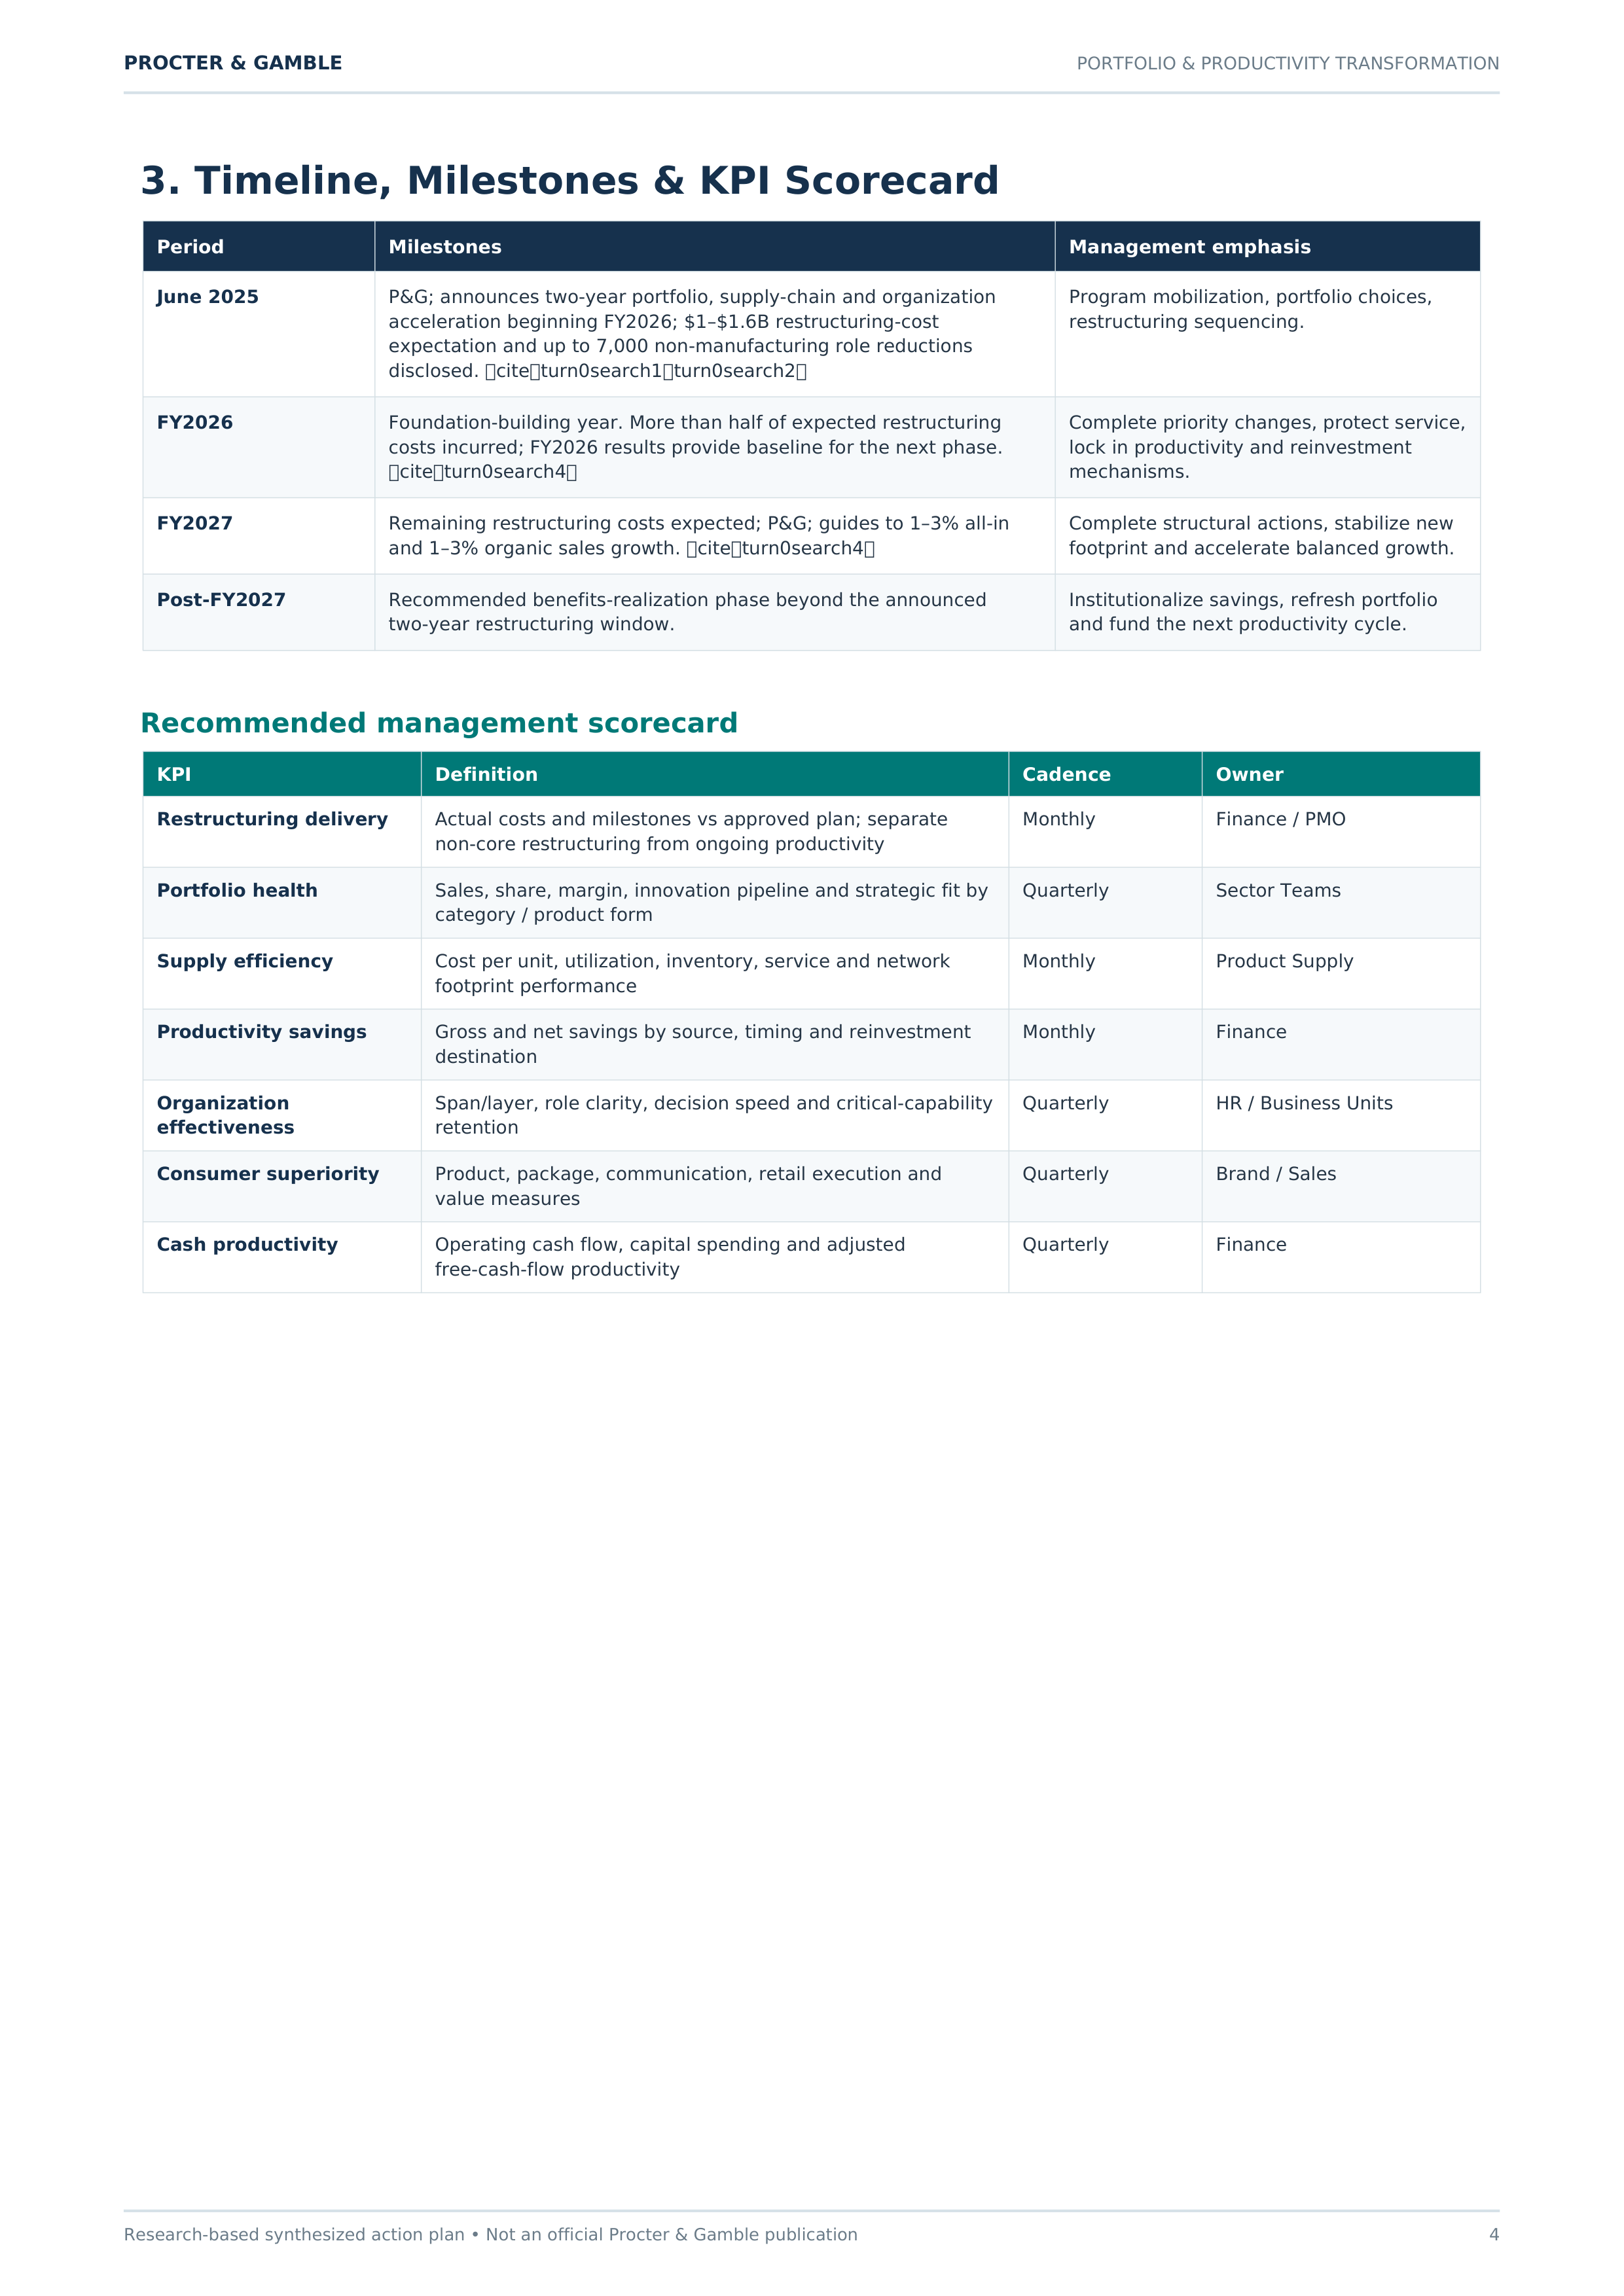
3. Timeline, Milestones & KPI Scorecard
Period
Milestones
Management emphasis
June 2025
P&G; announces two-year portfolio, supply-chain and organization
acceleration beginning FY2026; $1–$1.6B restructuring-cost
expectation and up to 7,000 non-manufacturing role reductions
disclosed.
citeturn0search1turn0search2
Program mobilization, portfolio choices,
restructuring sequencing.
FY2026
Foundation-building year. More than half of expected restructuring
costs incurred; FY2026 results provide baseline for the next phase.
citeturn0search4
Complete priority changes, protect service,
lock in productivity and reinvestment
mechanisms.
FY2027
Remaining restructuring costs expected; P&G; guides to 1–3% all-in
and 1–3% organic sales growth.
citeturn0search4
Complete structural actions, stabilize new
footprint and accelerate balanced growth.
Post-FY2027
Recommended benefits-realization phase beyond the announced
two-year restructuring window.
Institutionalize savings, refresh portfolio
and fund the next productivity cycle.
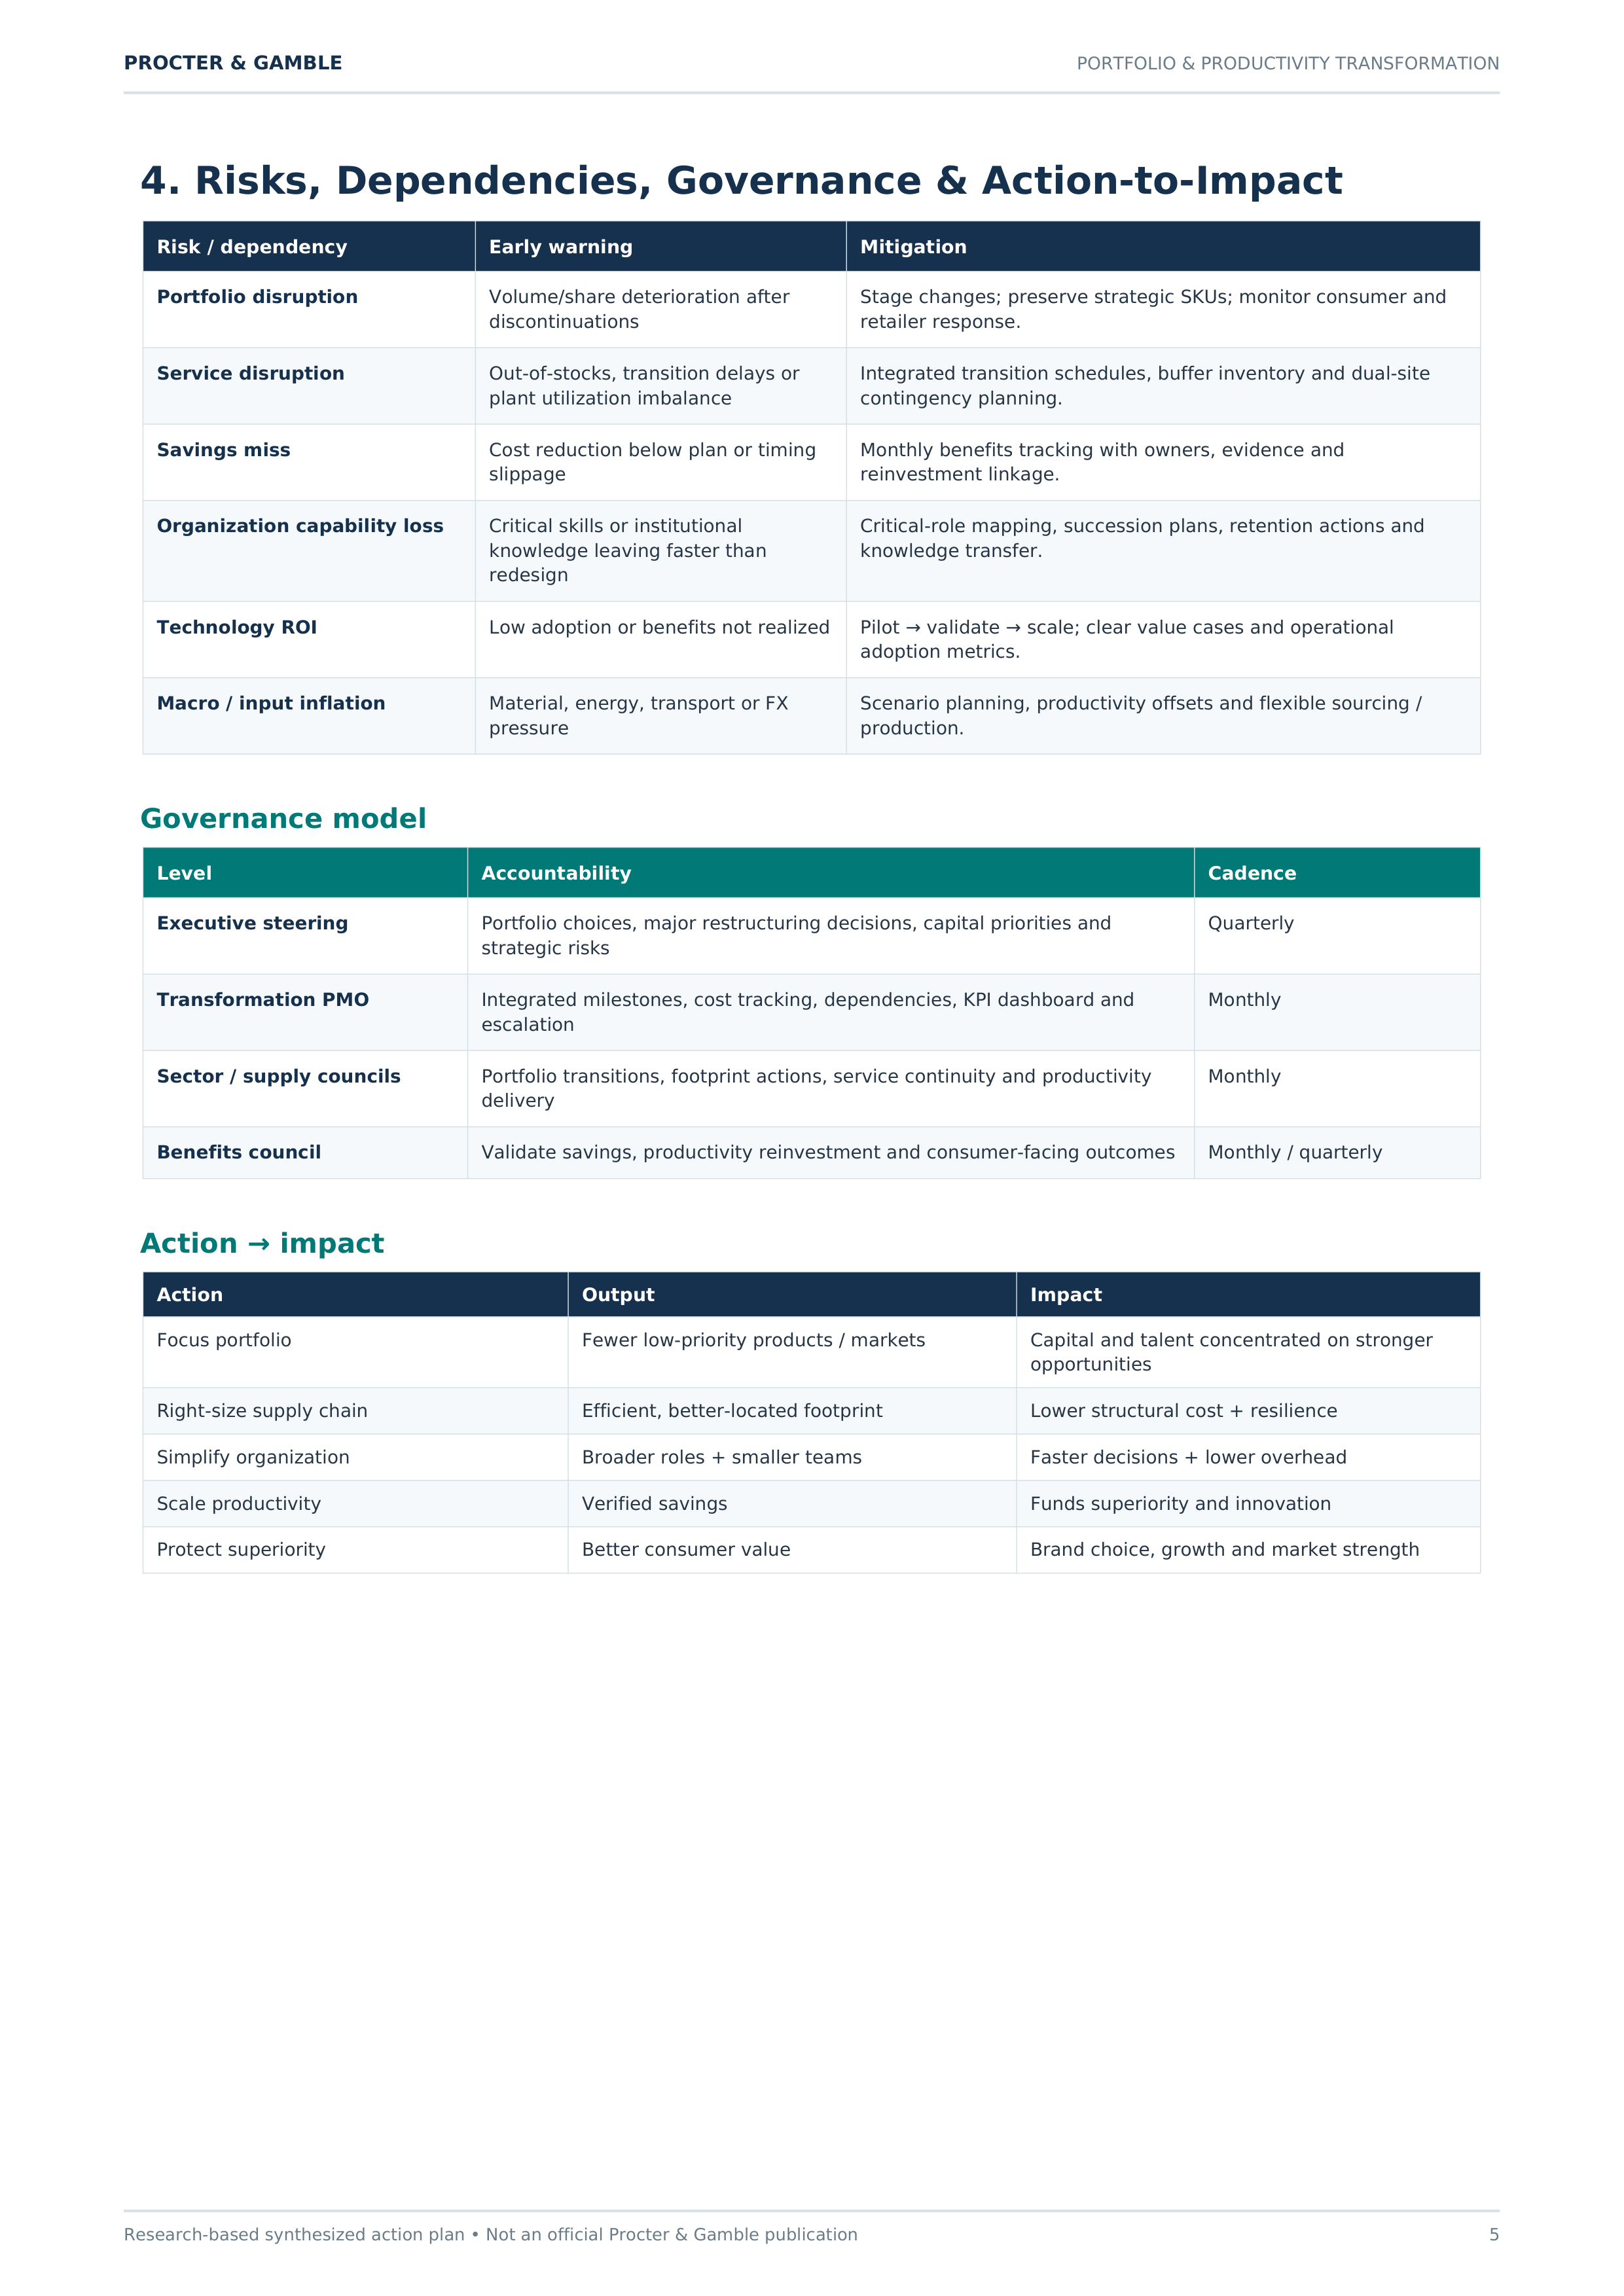
Recommended management scorecard
KPI
Definition
Cadence
Owner
Restructuring delivery
Actual costs and milestones vs approved plan; separate
non-core restructuring from ongoing productivity
Monthly
Finance / PMO
Portfolio health
Sales, share, margin, innovation pipeline and strategic fit by
category / product form
Quarterly
Sector Teams
Supply efficiency
Cost per unit, utilization, inventory, service and network
footprint performance
Monthly
Product Supply
Productivity savings
Gross and net savings by source, timing and reinvestment
destination
Monthly
Finance
Organization
effectiveness
Span/layer, role clarity, decision speed and critical-capability
retention
Quarterly
HR / Business Units
Consumer superiority
Product, package, communication, retail execution and
value measures
Quarterly
Brand / Sales
Cash productivity
Operating cash flow, capital spending and adjusted
free-cash-flow productivity
Quarterly
Finance
PROCTER & GAMBLE
PORTFOLIO & PRODUCTIVITY TRANSFORMATION
Research-based synthesized action plan • Not an official Procter & Gamble publication
5
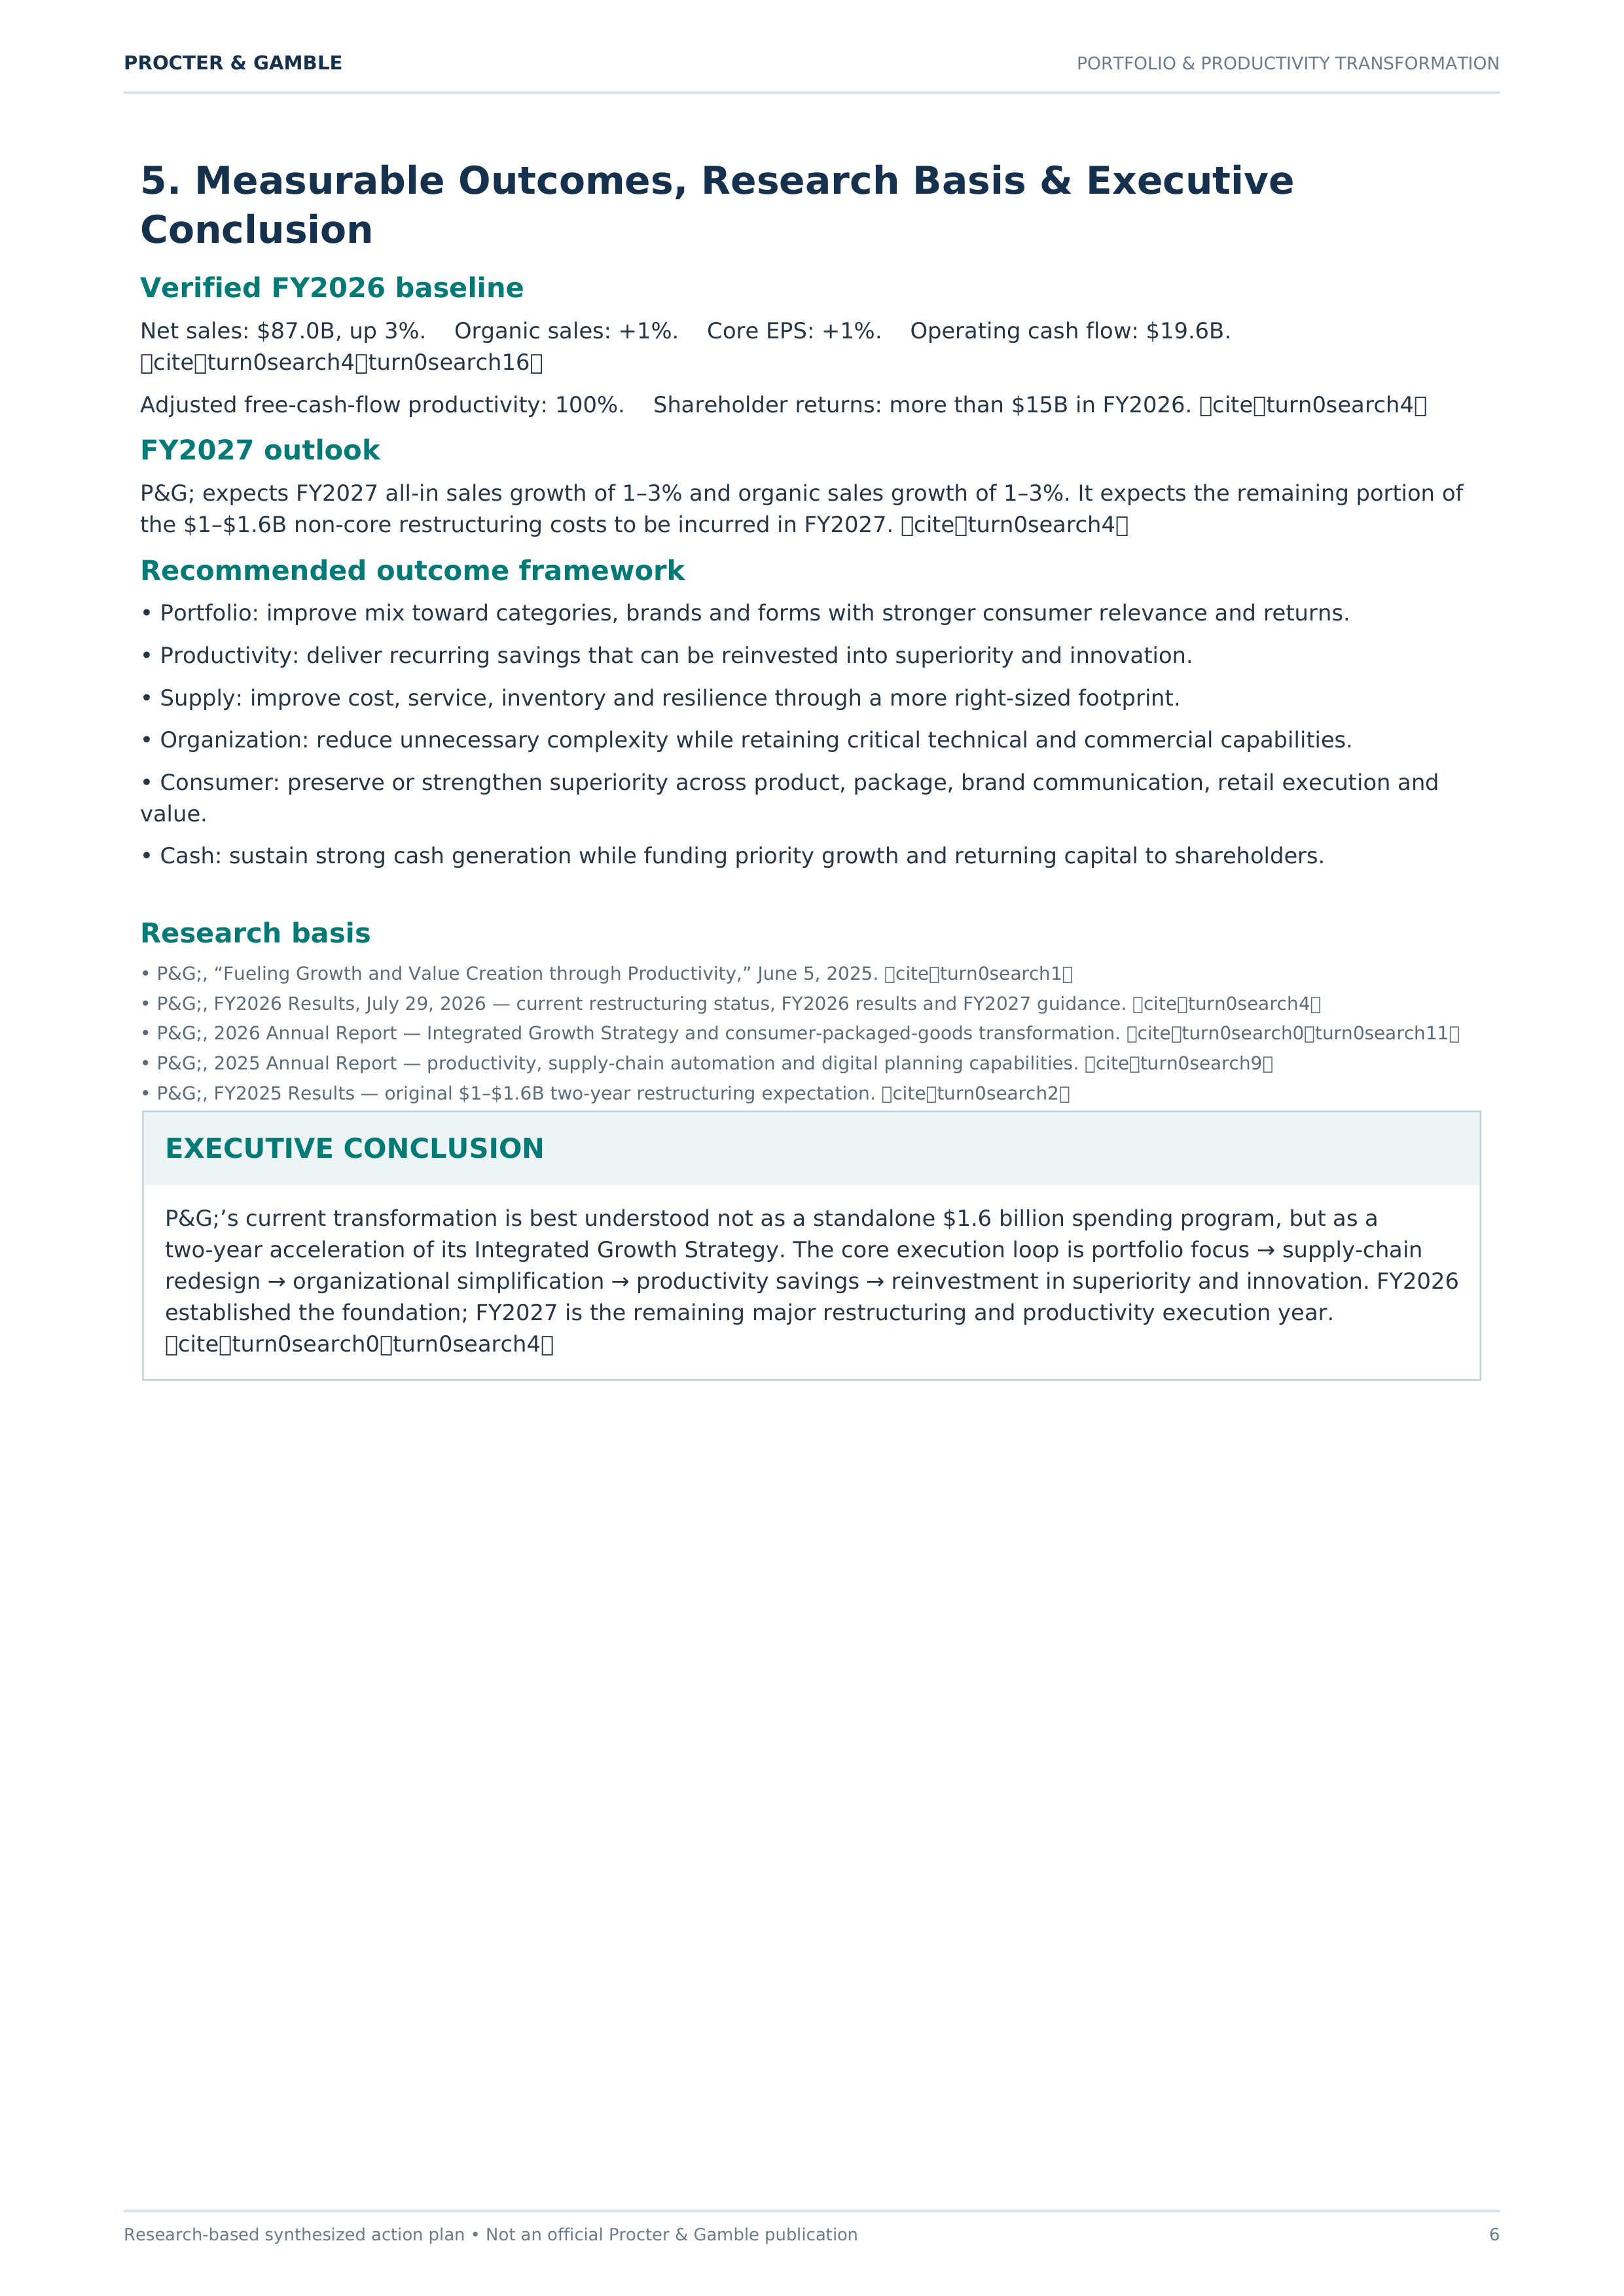
4. Risks, Dependencies, Governance & Action-to-Impact
Risk / dependency
Early warning
Mitigation
Portfolio disruption
Volume/share deterioration after
discontinuations
Stage changes; preserve strategic SKUs; monitor consumer and
retailer response.
Service disruption
Out-of-stocks, transition delays or
plant utilization imbalance
Integrated transition schedules, buffer inventory and dual-site
contingency planning.
Savings miss
Cost reduction below plan or timing
slippage
Monthly benefits tracking with owners, evidence and
reinvestment linkage.
Organization capability loss
Critical skills or institutional
knowledge leaving faster than
redesign
Critical-role mapping, succession plans, retention actions and
knowledge transfer.
Technology ROI
Low adoption or benefits not realized
Pilot → validate → scale; clear value cases and operational
adoption metrics.
Macro / input inflation
Material, energy, transport or FX
pressure
Scenario planning, productivity offsets and flexible sourcing /
production.
Governance model
Level
Accountability
Cadence
Executive steering
Portfolio choices, major restructuring decisions, capital priorities and
strategic risks
Quarterly
Transformation PMO
Integrated milestones, cost tracking, dependencies, KPI dashboard and
escalation
Monthly
Sector / supply councils
Portfolio transitions, footprint actions, service continuity and productivity
delivery
Monthly
Benefits council
Validate savings, productivity reinvestment and consumer-facing outcomes
Monthly / quarterly
Action → impact
Action
Output
Impact
Focus portfolio
Fewer low-priority products / markets
Capital and talent concentrated on stronger
opportunities
Right-size supply chain
Efficient, better-located footprint
Lower structural cost + resilience
Simplify organization
Broader roles + smaller teams
Faster decisions + lower overhead
Scale productivity
Verified savings
Funds superiority and innovation
Protect superiority
Better consumer value
Brand choice, growth and market strength
PROCTER & GAMBLE
PORTFOLIO & PRODUCTIVITY TRANSFORMATION
Research-based synthesized action plan • Not an official Procter & Gamble publication
6
5. Measurable Outcomes, Research Basis & Executive
Conclusion
Verified FY2026 baseline
Net sales: $87.0B, up 3%. Organic sales: +1%. Core EPS: +1%. Operating cash flow: $19.6B.
citeturn0search4turn0search16
Adjusted free-cash-flow productivity: 100%. Shareholder returns: more than $15B in FY2026.
citeturn0search4
FY2027 outlook
P&G; expects FY2027 all-in sales growth of 1–3% and organic sales growth of 1–3%. It expects the remaining portion of
the $1–$1.6B non-core restructuring costs to be incurred in FY2027.
citeturn0search4
Recommended outcome framework
• Portfolio: improve mix toward categories, brands and forms with stronger consumer relevance and returns.
• Productivity: deliver recurring savings that can be reinvested into superiority and innovation.
• Supply: improve cost, service, inventory and resilience through a more right-sized footprint.
• Organization: reduce unnecessary complexity while retaining critical technical and commercial capabilities.
• Consumer: preserve or strengthen superiority across product, package, brand communication, retail execution and
value.
• Cash: sustain strong cash generation while funding priority growth and returning capital to shareholders.
Research basis
• P&G;, “Fueling Growth and Value Creation through Productivity,” June 5, 2025.
citeturn0search1
• P&G;, FY2026 Results, July 29, 2026 — current restructuring status, FY2026 results and FY2027 guidance.
citeturn0search4
• P&G;, 2026 Annual Report — Integrated Growth Strategy and consumer-packaged-goods transformation.
citeturn0search0turn0search11
• P&G;, 2025 Annual Report — productivity, supply-chain automation and digital planning capabilities.
citeturn0search9
• P&G;, FY2025 Results — original $1–$1.6B two-year restructuring expectation.
citeturn0search2
EXECUTIVE CONCLUSION
P&G;’s current transformation is best understood not as a standalone $1.6 billion spending program, but as a
two-year acceleration of its Integrated Growth Strategy. The core execution loop is portfolio focus → supply-chain
redesign → organizational simplification → productivity savings → reinvestment in superiority and innovation. FY2026
established the foundation; FY2027 is the remaining major restructuring and productivity execution year.
citeturn0search0turn0search4