Decision
-
Making
Professional
Goals
1.
Decision
-
Making
Skills
Inventory
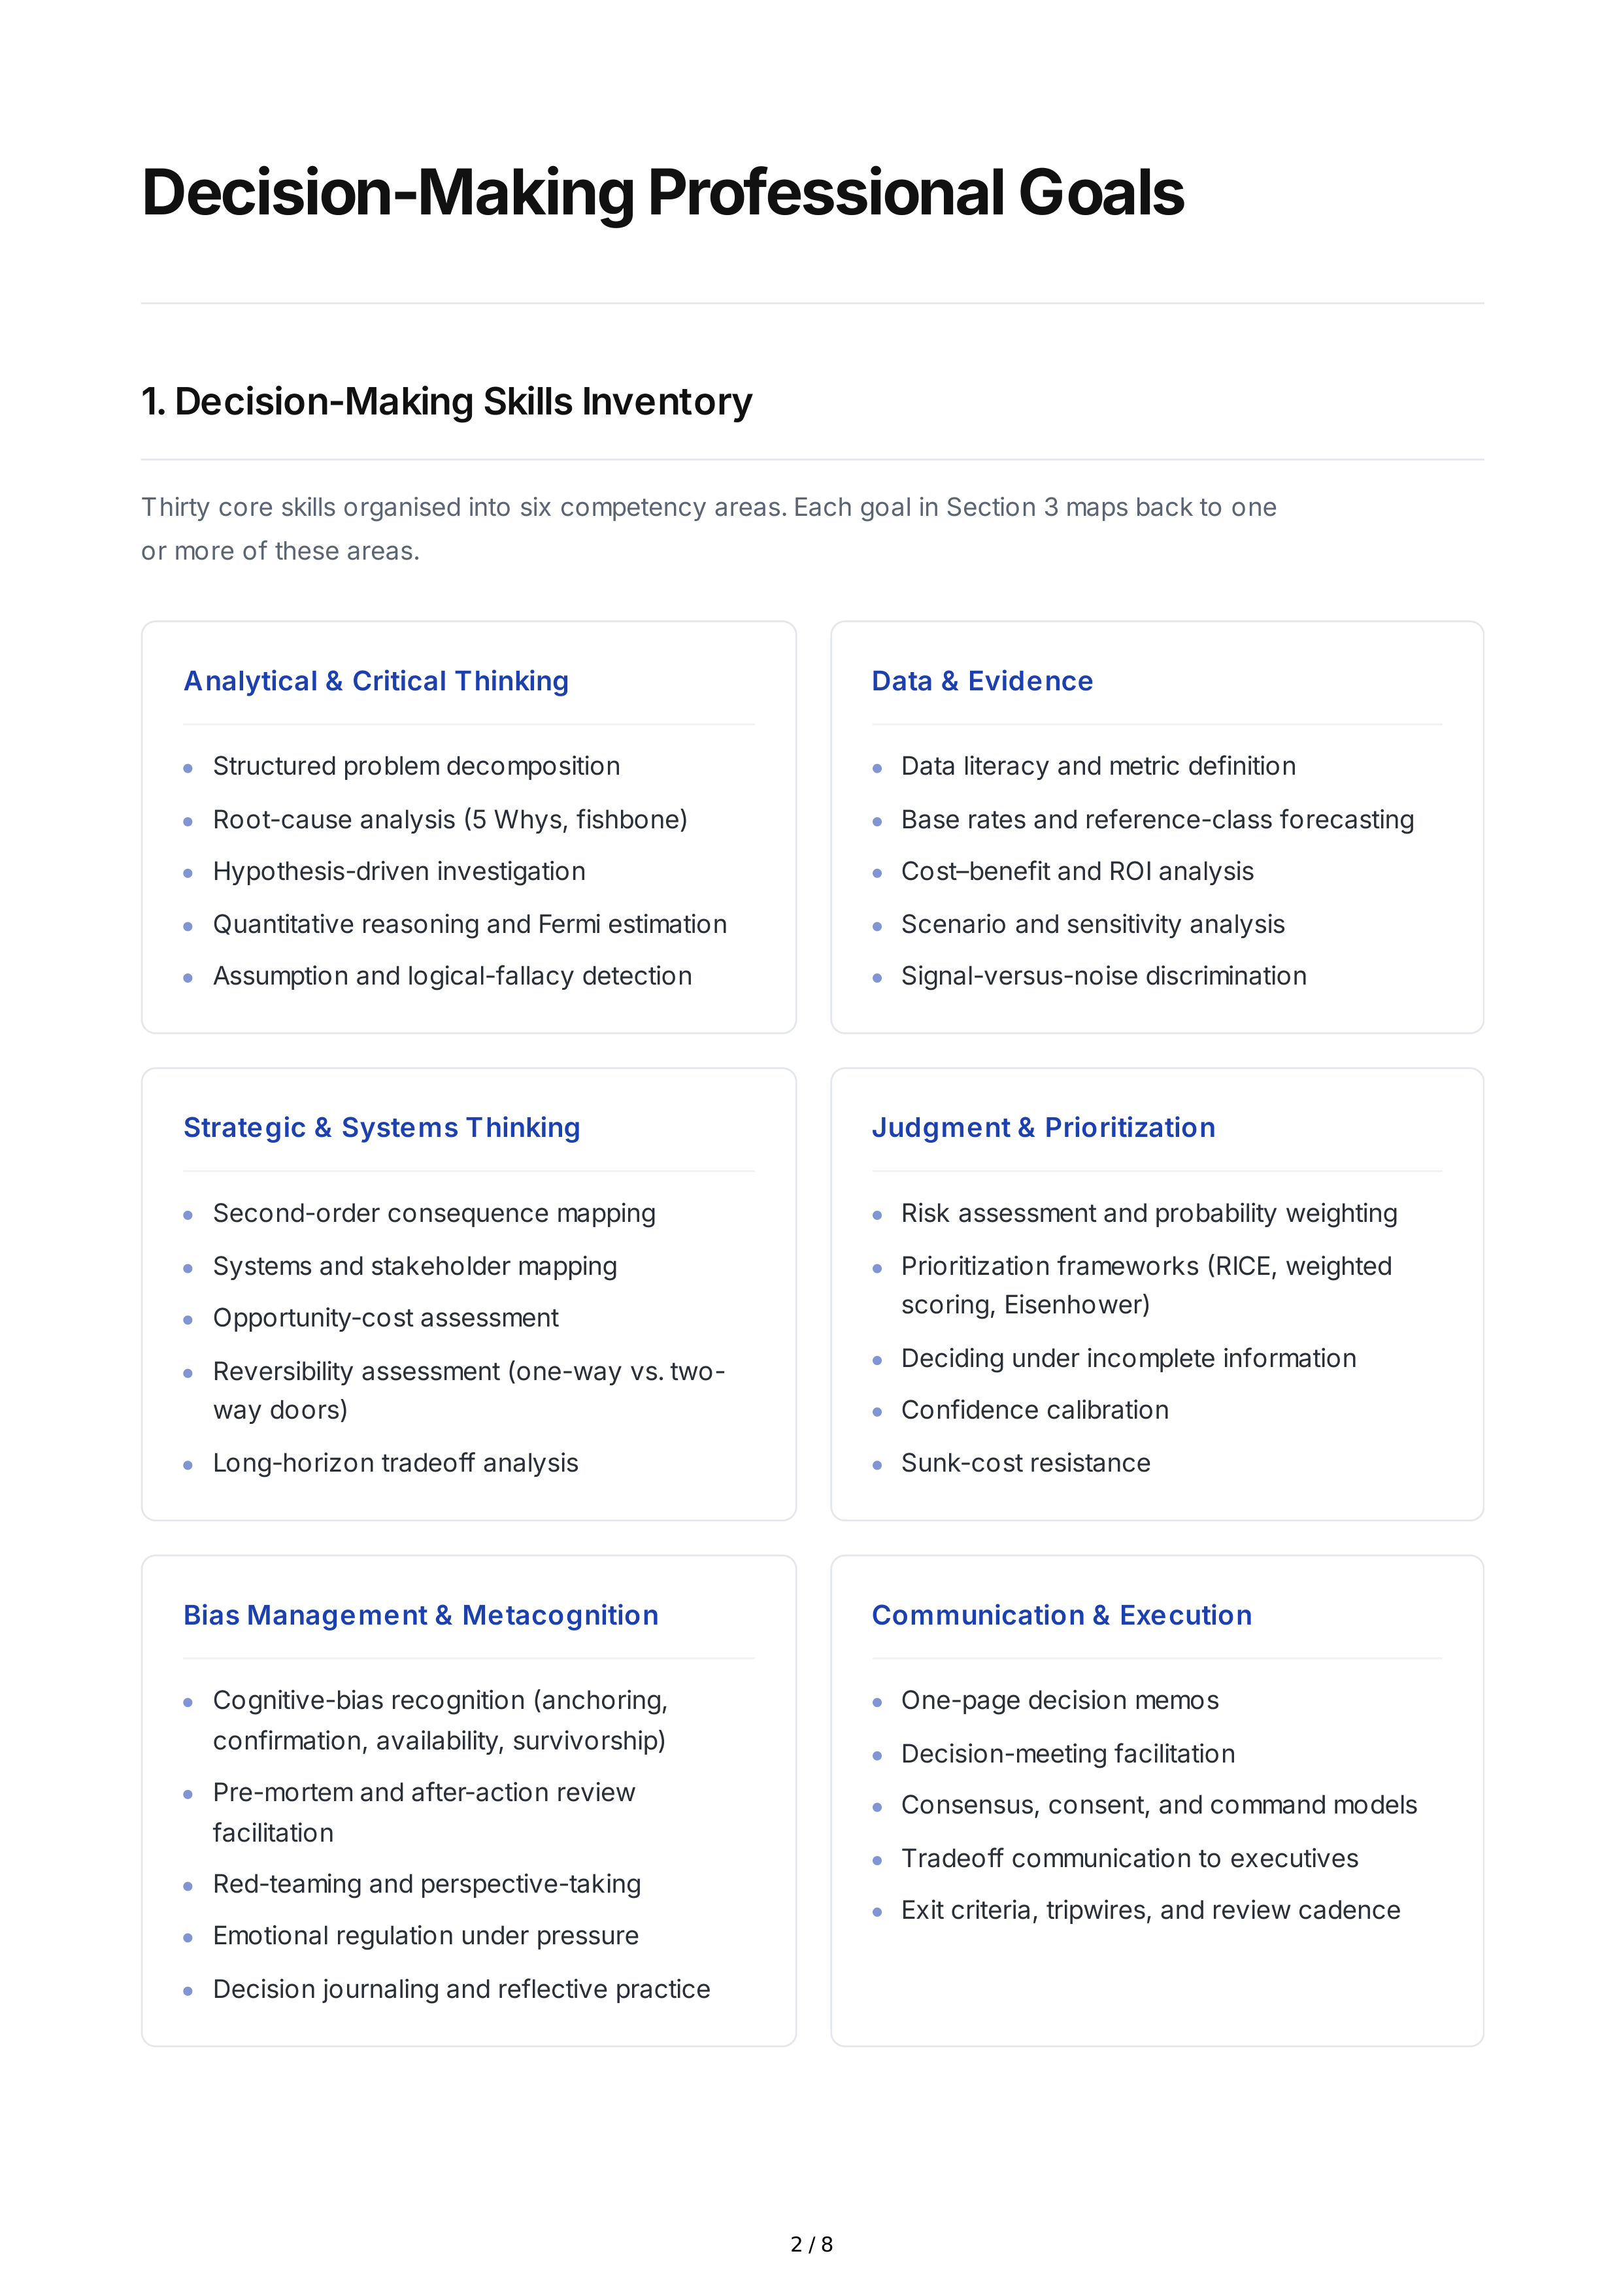
Thirty
core
skills
organised
into
six
competency
areas
.
Each
goal
in
Section
3
maps
back
to
one
or
more
of
these
areas
.
Analytical
&
Critical
Thinking
Data
&
Evidence
Strategic
&
Systems
Thinking
Judgment
&
Prioritization
Bias
Management
&
Metacognition
Communication
&
Execution
Structured
problem
decomposition
Root
-
cause
analysis
(5
Whys
,
fishbone
)
Hypothesis
-
driven
investigation
Quantitative
reasoning
and
Fermi
estimation
Assumption
and
logical
-
fallacy
detection
Data
literacy
and
metric
definition
Base
rates
and
reference
-
class
forecasting
Cost
–
benefit
and
ROI
analysis
Scenario
and
sensitivity
analysis
Signal
-
versus
-
noise
discrimination
Second
-
order
consequence
mapping
Systems
and
stakeholder
mapping
Opportunity
-
cost
assessment
Reversibility
assessment
(
one
-
way
vs
.
two
-
way
doors
)
Long
-
horizon
tradeoff
analysis
Risk
assessment
and
probability
weighting
Prioritization
frameworks
(
RICE
,
weighted
scoring
,
Eisenhower
)
Deciding
under
incomplete
information
Confidence
calibration
Sunk
-
cost
resistance
Cognitive
-
bias
recognition
(
anchoring
,
confirmation
,
availability
,
survivorship
)
Pre
-
mortem
and
after
-
action
review
facilitation
Red
-
teaming
and
perspective
-
taking
Emotional
regulation
under
pressure
Decision
journaling
and
reflective
practice
One
-
page
decision
memos
Decision
-
meeting
facilitation
Consensus
,
consent
,
and
command
models
Tradeoff
communication
to
executives
Exit
criteria
,
tripwires
,
and
review
cadence
2 / 8
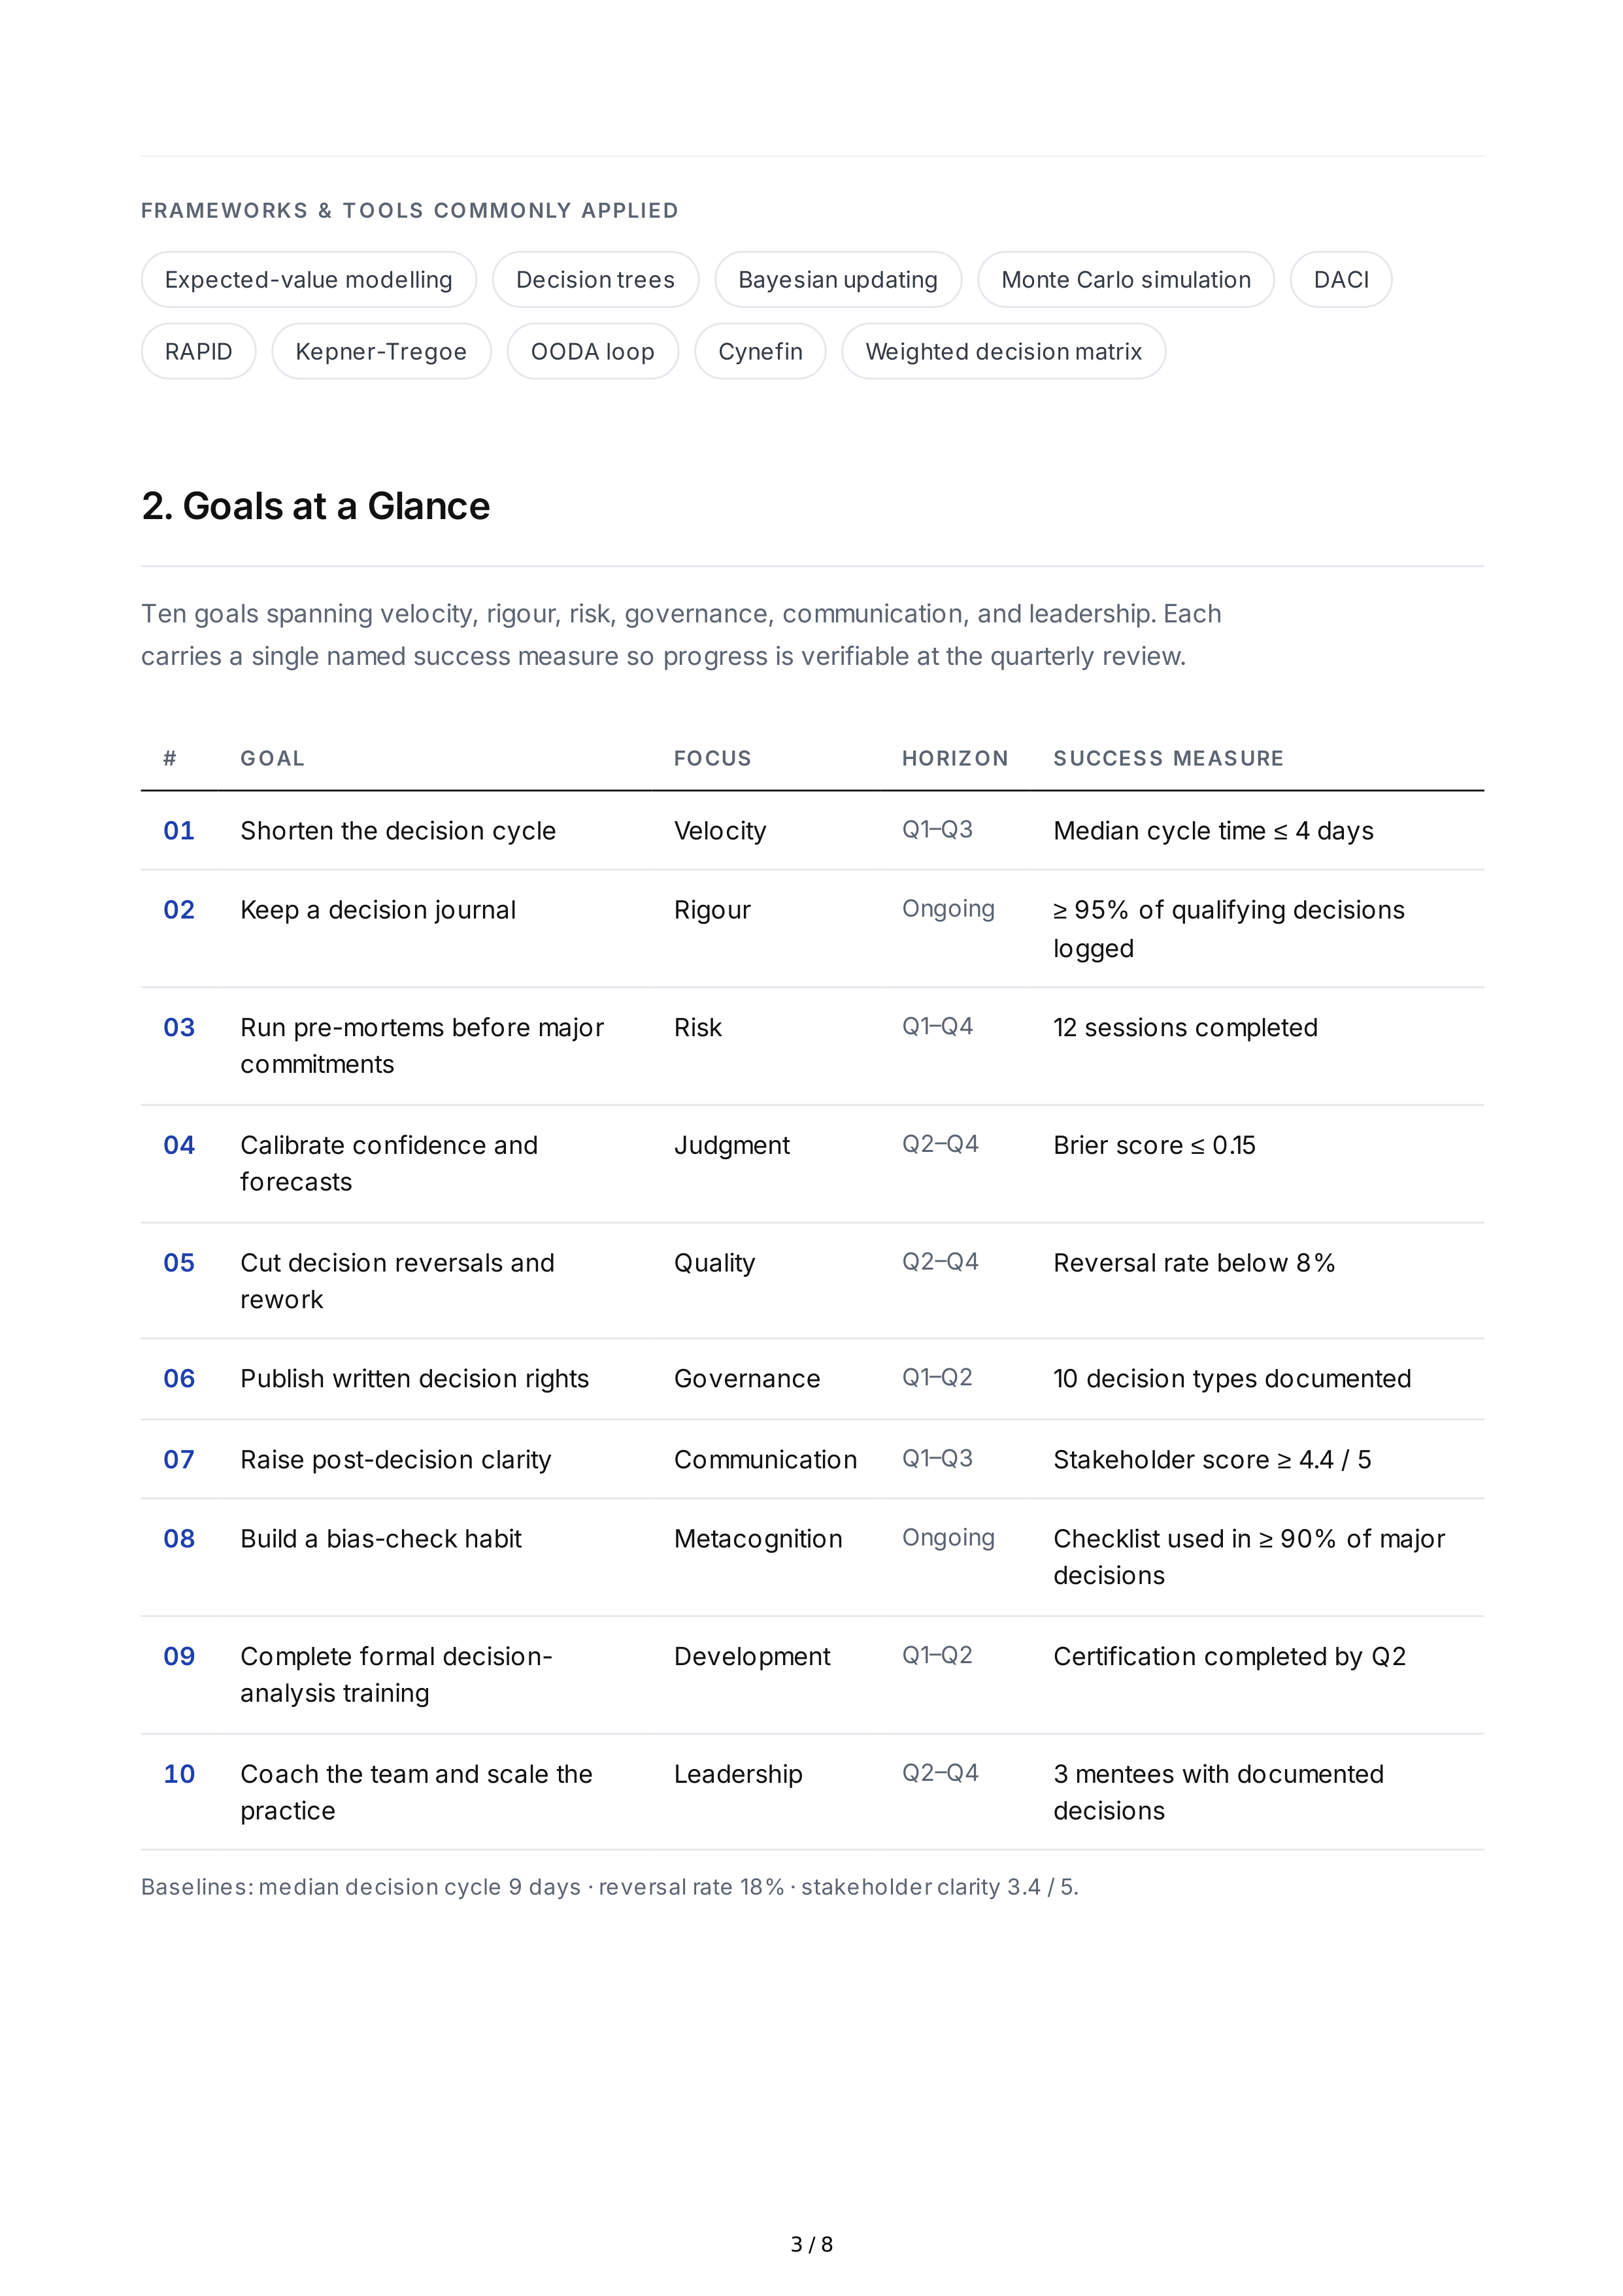
FRAMEWORKS
&
T OOLS
COMMONLY
APPLIED
Expected
-
value
modelling
Decision
trees
Bayesian
updating
Monte
Carlo
simulation
DACI
RAPID
Kepner
-
Tregoe
OODA
loop
Cynefin
Weighted
decision
matrix
2.
Goals
at
a
Glance
Ten
goals
spanning
velocity
,
rigour
,
risk
,
governance
,
communication
,
and
leadership
.
Each
carries
a
single
named
success
measure
so
progress
is
verifiable
at
the
quarterly
review
.
#
GOAL
FOCUS
HORIZON
SUCCESS
MEASURE
01
Shorten
the
decision
cycle
Velocity
Q
1–
Q
3
Median
cycle
time
≤
4
days
02
Keep
a
decision
journal
Rigour
Ongoing
≥
95%
of
qualifying
decisions
logged
03
Run
pre
-
mortems
before
major
commitments
Risk
Q
1–
Q
4
12
sessions
completed
04
Calibrate
confidence
and
forecasts
Judgment
Q
2–
Q
4
Brier
score
≤
0.15
05
Cut
decision
reversals
and
rework
Quality
Q
2–
Q
4
Reversal
rate
below
8%
06
Publish
written
decision
rights
Governance
Q
1–
Q
2
10
decision
types
documented
07
Raise
post
-
decision
clarity
Communication
Q
1–
Q
3
Stakeholder
score
≥
4.4 / 5
08
Build
a
bias
-
check
habit
Metacognition
Ongoing
Checklist
used
in
≥
90%
of
major
decisions
09
Complete
formal
decision
-
analysis
training
Development
Q
1–
Q
2
Certification
completed
by
Q
2
10
Coach
the
team
and
scale
the
practice
Leadership
Q
2–
Q
4
3
mentees
with
documented
decisions
Baselines
:
median
decision
cycle
9
days
·
reversal
rate
18% ·
stakeholder
clarity
3.4 / 5.
3 / 8
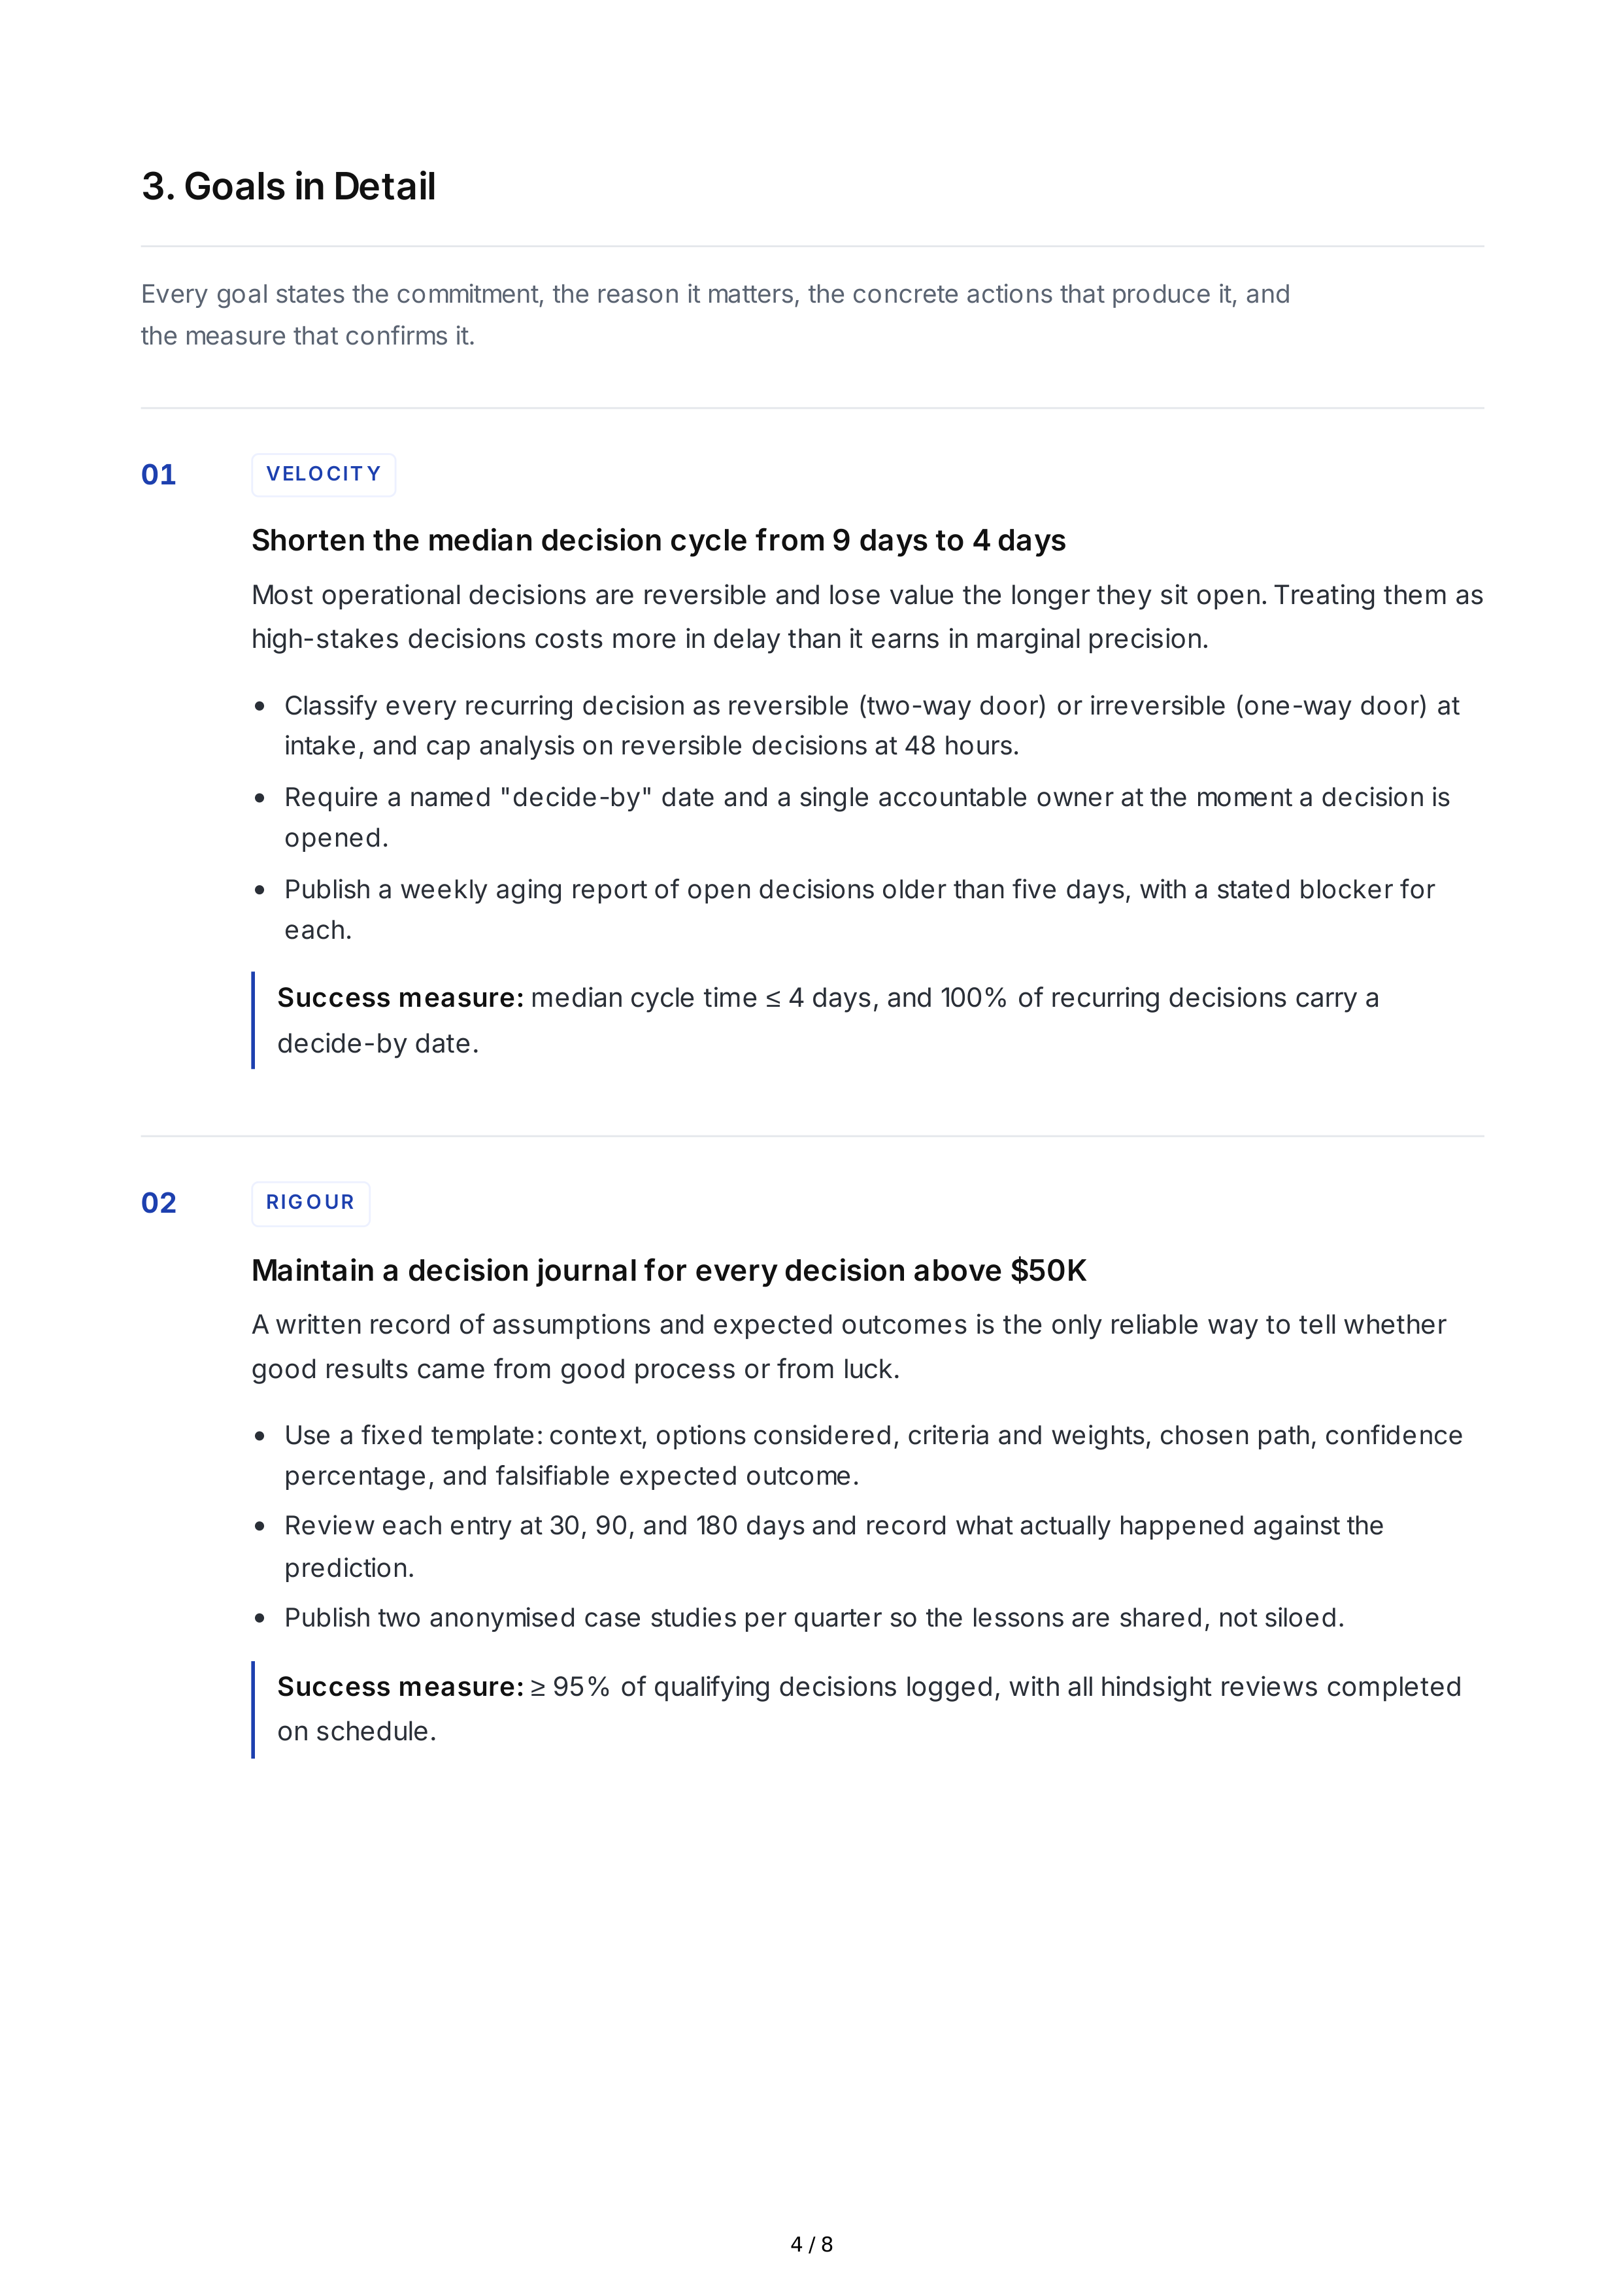
3.
Goals
in
Detail
Every
goal
states
the
commitment
,
the
reason
it
matters
,
the
concrete
actions
that
produce
it
,
and
the
measure
that
confirms
it
.
01
VELO CIT Y
Shorten
the
median
decision
cycle
from
9
days
to
4
days
Most
operational
decisions
are
reversible
and
lose
value
the
longer
they
sit
open
.
Treating
them
as
high
-
stakes
decisions
costs
more
in
delay
than
it
earns
in
marginal
precision
.
Classify
every
recurring
decision
as
reversible
(
two
-
way
door
)
or
irreversible
(
one
-
way
door
)
at
intake
,
and
cap
analysis
on
reversible
decisions
at
48
hours
.
Require
a
named
"
decide
-
by
"
date
and
a
single
accountable
owner
at
the
moment
a
decision
is
opened
.
Publish
a
weekly
aging
report
of
open
decisions
older
than
five
days
,
with
a
stated
blocker
for
each
.
Success
measure
:
median
cycle
time
≤
4
days
,
and
100%
of
recurring
decisions
carry
a
decide
-
by
date
.
02
RIG O UR
Maintain
a
decision
journal
for
every
decision
above
$
50
K
A
written
record
of
assumptions
and
expected
outcomes
is
the
only
reliable
way
to
tell
whether
good
results
came
from
good
process
or
from
luck
.
Use
a
fixed
template
:
context
,
options
considered
,
criteria
and
weights
,
chosen
path
,
confidence
percentage
,
and
falsifiable
expected
outcome
.
Review
each
entry
at
30, 90,
and
180
days
and
record
what
actually
happened
against
the
prediction
.
Publish
two
anonymised
case
studies
per
quarter
so
the
lessons
are
shared
,
not
siloed
.
Success
measure
:
≥
95%
of
qualifying
decisions
logged
,
with
all
hindsight
reviews
completed
on
schedule
.
4 / 8
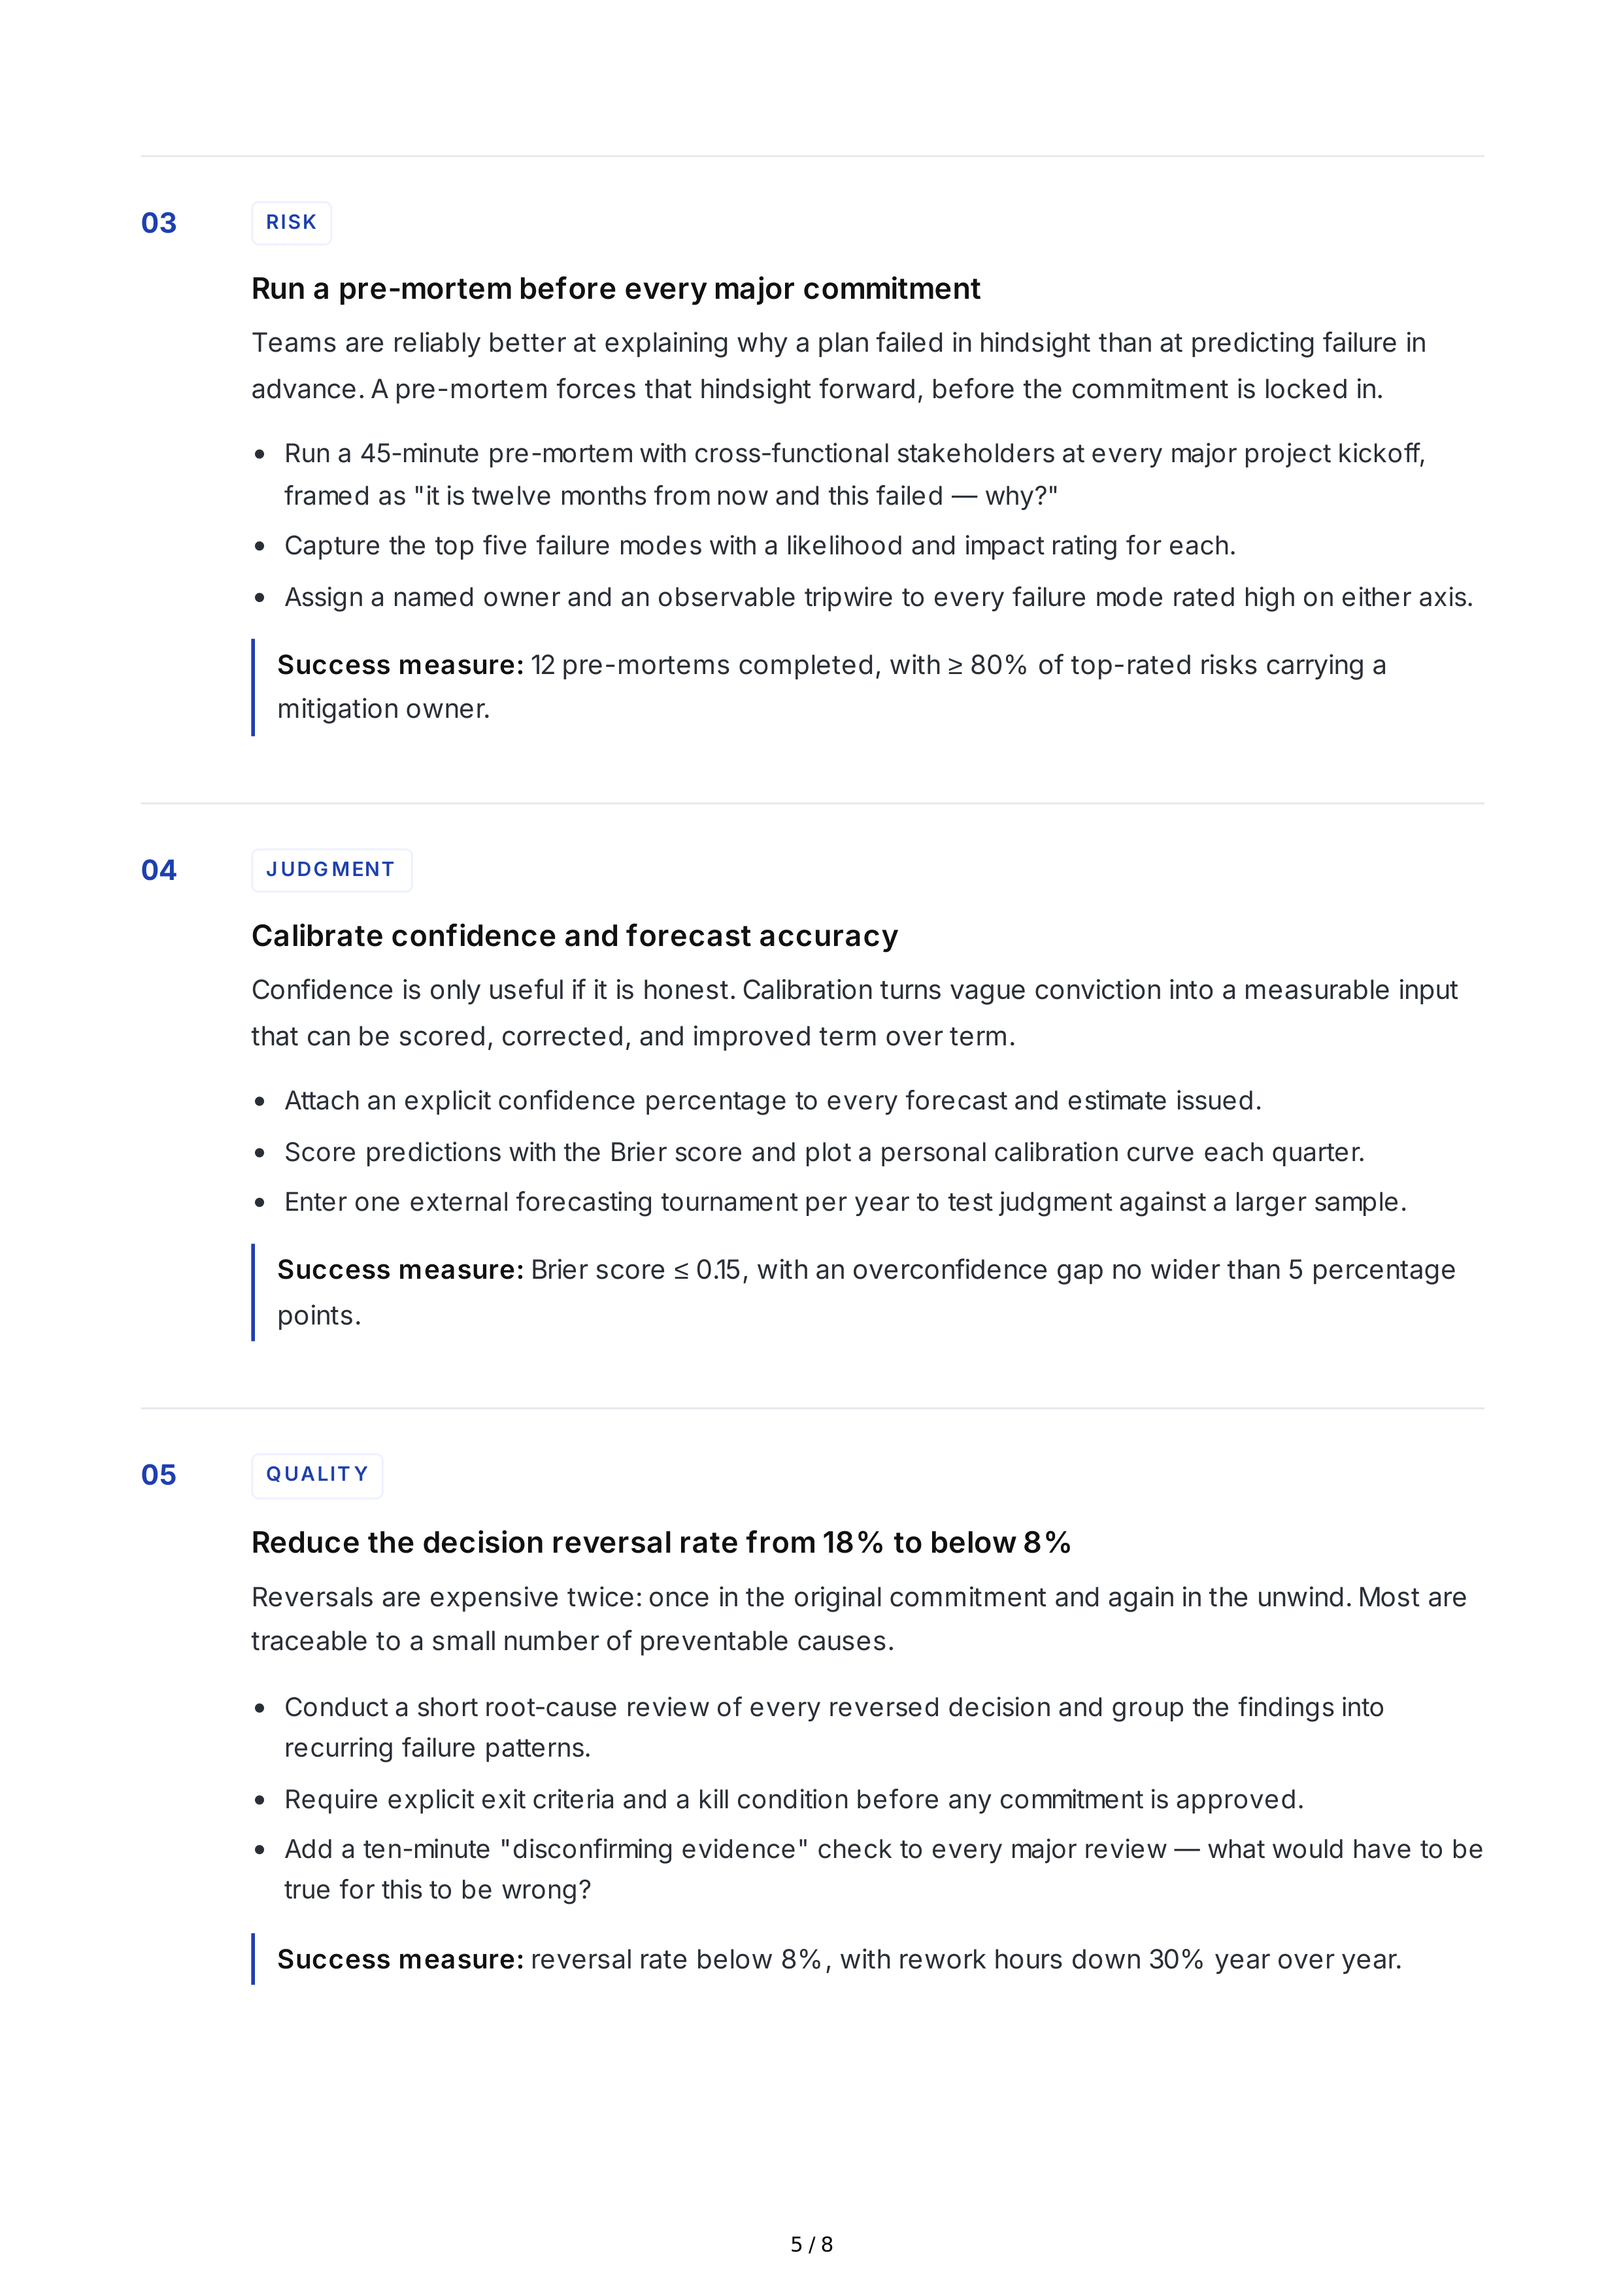
03
RISK
Run
a
pre
-
mortem
before
every
major
commitment
Teams
are
reliably
better
at
explaining
why
a
plan
failed
in
hindsight
than
at
predicting
failure
in
advance
.
A
pre
-
mortem
forces
that
hindsight
forward
,
before
the
commitment
is
locked
in
.
Run
a
45-
minute
pre
-
mortem
with
cross
-
functional
stakeholders
at
every
major
project
kickoff
,
framed
as
"
it
is
twelve
months
from
now
and
this
failed
—
why
?"
Capture
the
top
five
failure
modes
with
a
likelihood
and
impact
rating
for
each
.
Assign
a
named
owner
and
an
observable
tripwire
to
every
failure
mode
rated
high
on
either
axis
.
Success
measure
:
12
pre
-
mortems
completed
,
with
≥
80%
of
top
-
rated
risks
carrying
a
mitigation
owner
.
04
J UDG MENT
Calibrate
confidence
and
forecast
accuracy
Confidence
is
only
useful
if
it
is
honest
.
Calibration
turns
vague
conviction
into
a
measurable
input
that
can
be
scored
,
corrected
,
and
improved
term
over
term
.
Attach
an
explicit
confidence
percentage
to
every
forecast
and
estimate
issued
.
Score
predictions
with
the
Brier
score
and
plot
a
personal
calibration
curve
each
quarter
.
Enter
one
external
forecasting
tournament
per
year
to
test
judgment
against
a
larger
sample
.
Success
measure
:
Brier
score
≤
0.15,
with
an
overconfidence
gap
no
wider
than
5
percentage
points
.
05
Q UALIT Y
Reduce
the
decision
reversal
rate
from
18%
to
below
8%
Reversals
are
expensive
twice
:
once
in
the
original
commitment
and
again
in
the
unwind
.
Most
are
traceable
to
a
small
number
of
preventable
causes
.
Conduct
a
short
root
-
cause
review
of
every
reversed
decision
and
group
the
findings
into
recurring
failure
patterns
.
Require
explicit
exit
criteria
and
a
kill
condition
before
any
commitment
is
approved
.
Add
a
ten
-
minute
"
disconfirming
evidence
"
check
to
every
major
review
—
what
would
have
to
be
true
for
this
to
be
wrong
?
Success
measure
:
reversal
rate
below
8%,
with
rework
hours
down
30%
year
over
year
.
5 / 8
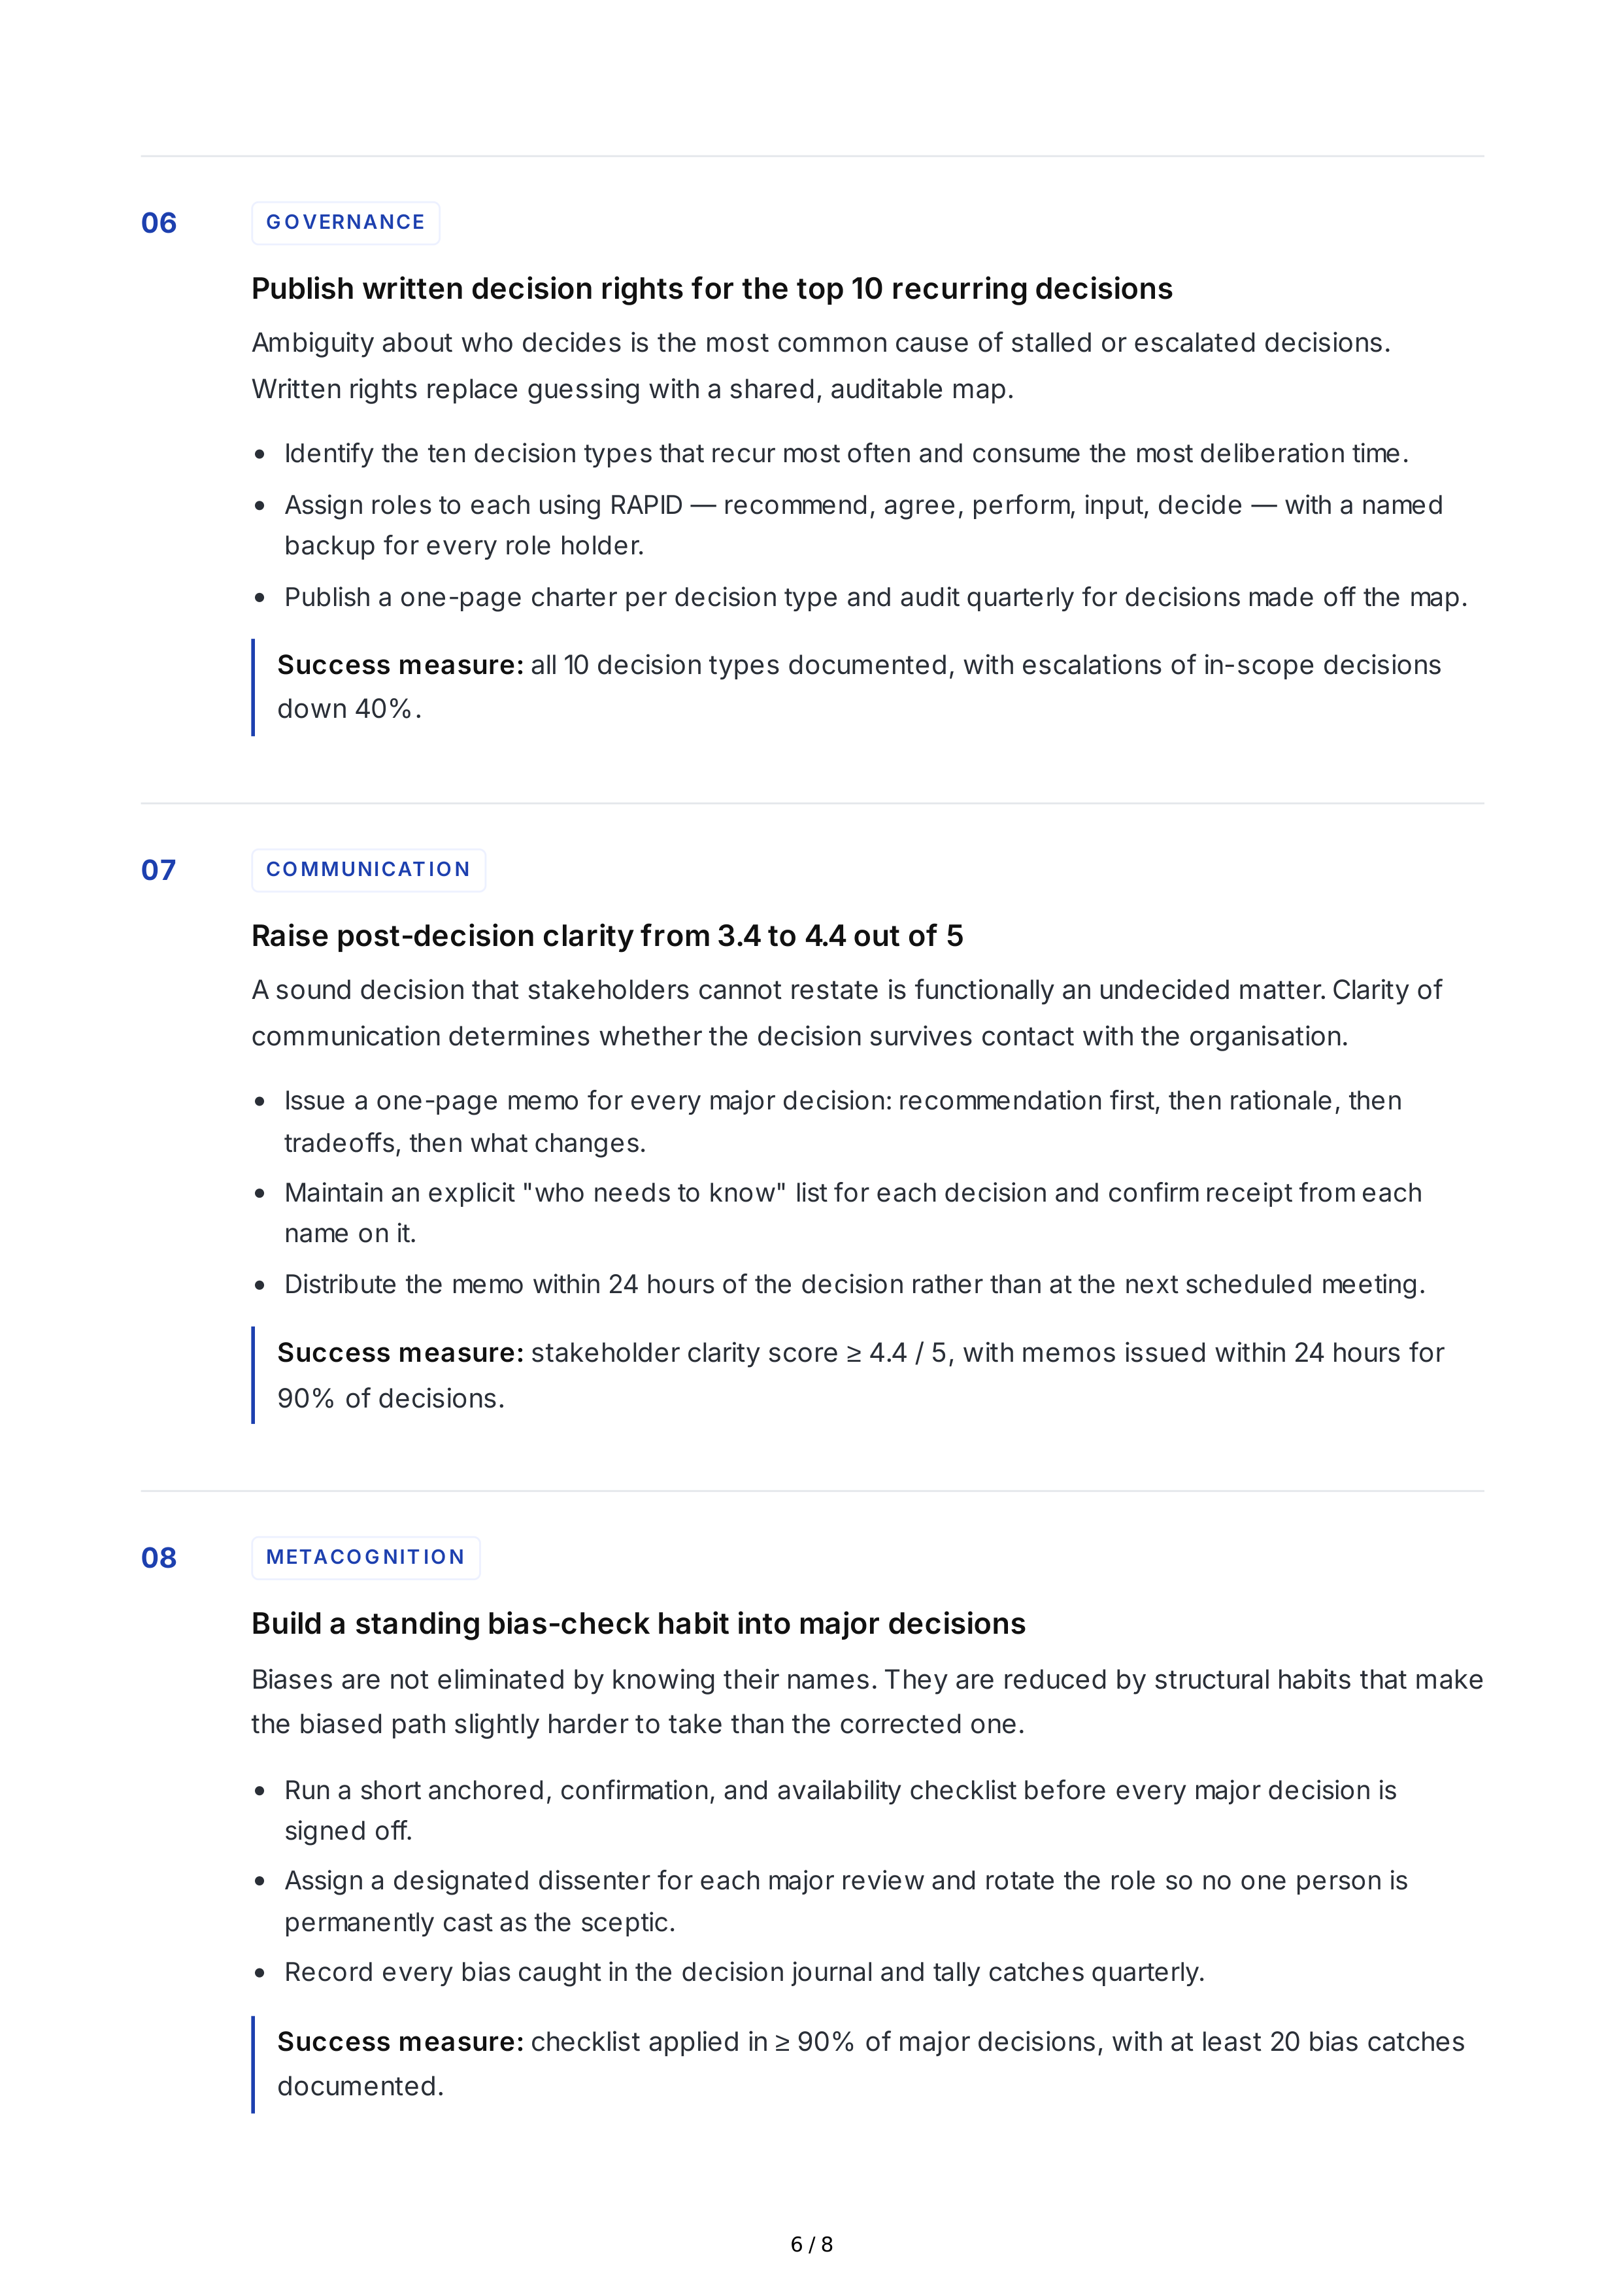
06
G O VERNANCE
Publish
written
decision
rights
for
the
top
10
recurring
decisions
Ambiguity
about
who
decides
is
the
most
common
cause
of
stalled
or
escalated
decisions
.
Written
rights
replace
guessing
with
a
shared
,
auditable
map
.
Identify
the
ten
decision
types
that
recur
most
often
and
consume
the
most
deliberation
time
.
Assign
roles
to
each
using
RAPID
—
recommend
,
agree
,
perform
,
input
,
decide
—
with
a
named
backup
for
every
role
holder
.
Publish
a
one
-
page
charter
per
decision
type
and
audit
quarterly
for
decisions
made
off
the
map
.
Success
measure
:
all
10
decision
types
documented
,
with
escalations
of
in
-
scope
decisions
down
40%.
07
CO MMUNICAT IO N
Raise
post
-
decision
clarity
from
3.4
to
4.4
out
of
5
A
sound
decision
that
stakeholders
cannot
restate
is
functionally
an
undecided
matter
.
Clarity
of
communication
determines
whether
the
decision
survives
contact
with
the
organisation
.
Issue
a
one
-
page
memo
for
every
major
decision
:
recommendation
first
,
then
rationale
,
then
tradeoffs
,
then
what
changes
.
Maintain
an
explicit
"
who
needs
to
know
"
list
for
each
decision
and
confirm
receipt
from
each
name
on
it
.
Distribute
the
memo
within
24
hours
of
the
decision
rather
than
at
the
next
scheduled
meeting
.
Success
measure
:
stakeholder
clarity
score
≥
4.4 / 5,
with
memos
issued
within
24
hours
for
90%
of
decisions
.
08
METACO G NIT IO N
Build
a
standing
bias
-
check
habit
into
major
decisions
Biases
are
not
eliminated
by
knowing
their
names
.
They
are
reduced
by
structural
habits
that
make
the
biased
path
slightly
harder
to
take
than
the
corrected
one
.
Run
a
short
anchored
,
confirmation
,
and
availability
checklist
before
every
major
decision
is
signed
off
.
Assign
a
designated
dissenter
for
each
major
review
and
rotate
the
role
so
no
one
person
is
permanently
cast
as
the
sceptic
.
Record
every
bias
caught
in
the
decision
journal
and
tally
catches
quarterly
.
Success
measure
:
checklist
applied
in
≥
90%
of
major
decisions
,
with
at
least
20
bias
catches
documented
.
6 / 8
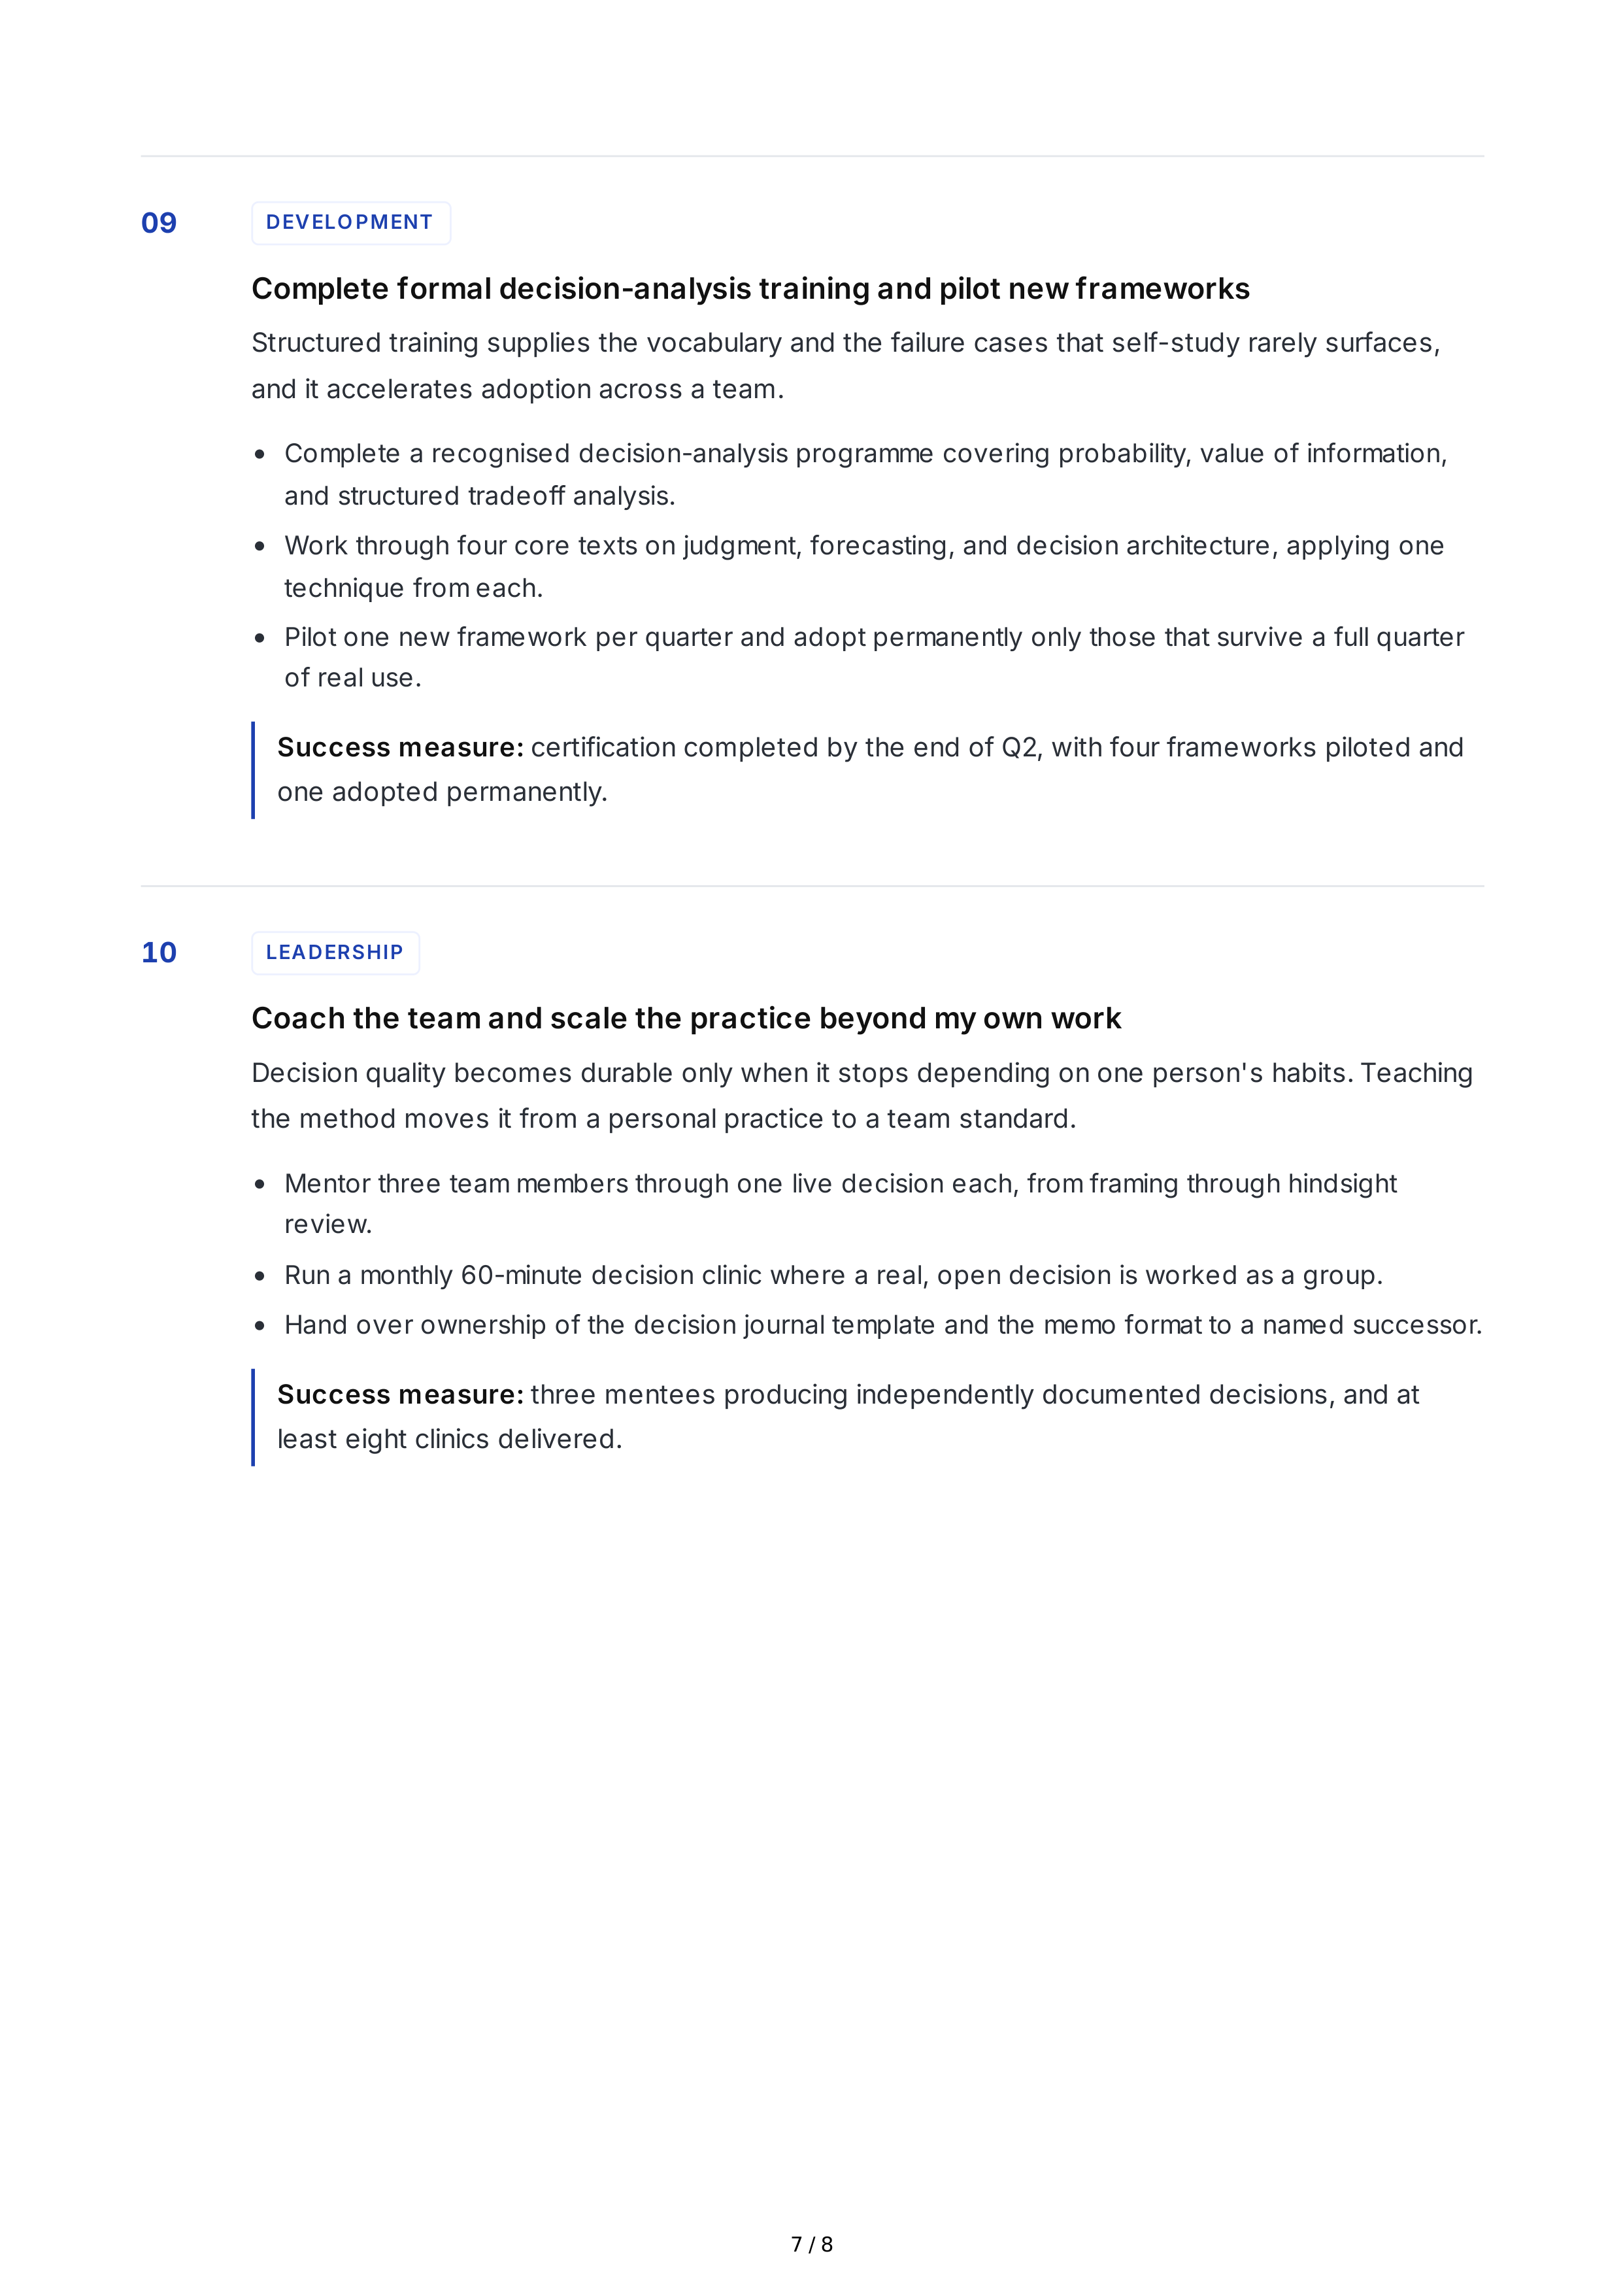
09
DEVELO PMENT
Complete
formal
decision
-
analysis
training
and
pilot
new
frameworks
Structured
training
supplies
the
vocabulary
and
the
failure
cases
that
self
-
study
rarely
surfaces
,
and
it
accelerates
adoption
across
a
team
.
Complete
a
recognised
decision
-
analysis
programme
covering
probability
,
value
of
information
,
and
structured
tradeoff
analysis
.
Work
through
four
core
texts
on
judgment
,
forecasting
,
and
decision
architecture
,
applying
one
technique
from
each
.
Pilot
one
new
framework
per
quarter
and
adopt
permanently
only
those
that
survive
a
full
quarter
of
real
use
.
Success
measure
:
certification
completed
by
the
end
of
Q
2,
with
four
frameworks
piloted
and
one
adopted
permanently
.
10
LEADERSHIP
Coach
the
team
and
scale
the
practice
beyond
my
own
work
Decision
quality
becomes
durable
only
when
it
stops
depending
on
one
person
'
s
habits
.
Teaching
the
method
moves
it
from
a
personal
practice
to
a
team
standard
.
Mentor
three
team
members
through
one
live
decision
each
,
from
framing
through
hindsight
review
.
Run
a
monthly
60-
minute
decision
clinic
where
a
real
,
open
decision
is
worked
as
a
group
.
Hand
over
ownership
of
the
decision
journal
template
and
the
memo
format
to
a
named
successor
.
Success
measure
:
three
mentees
producing
independently
documented
decisions
,
and
at
least
eight
clinics
delivered
.
7 / 8
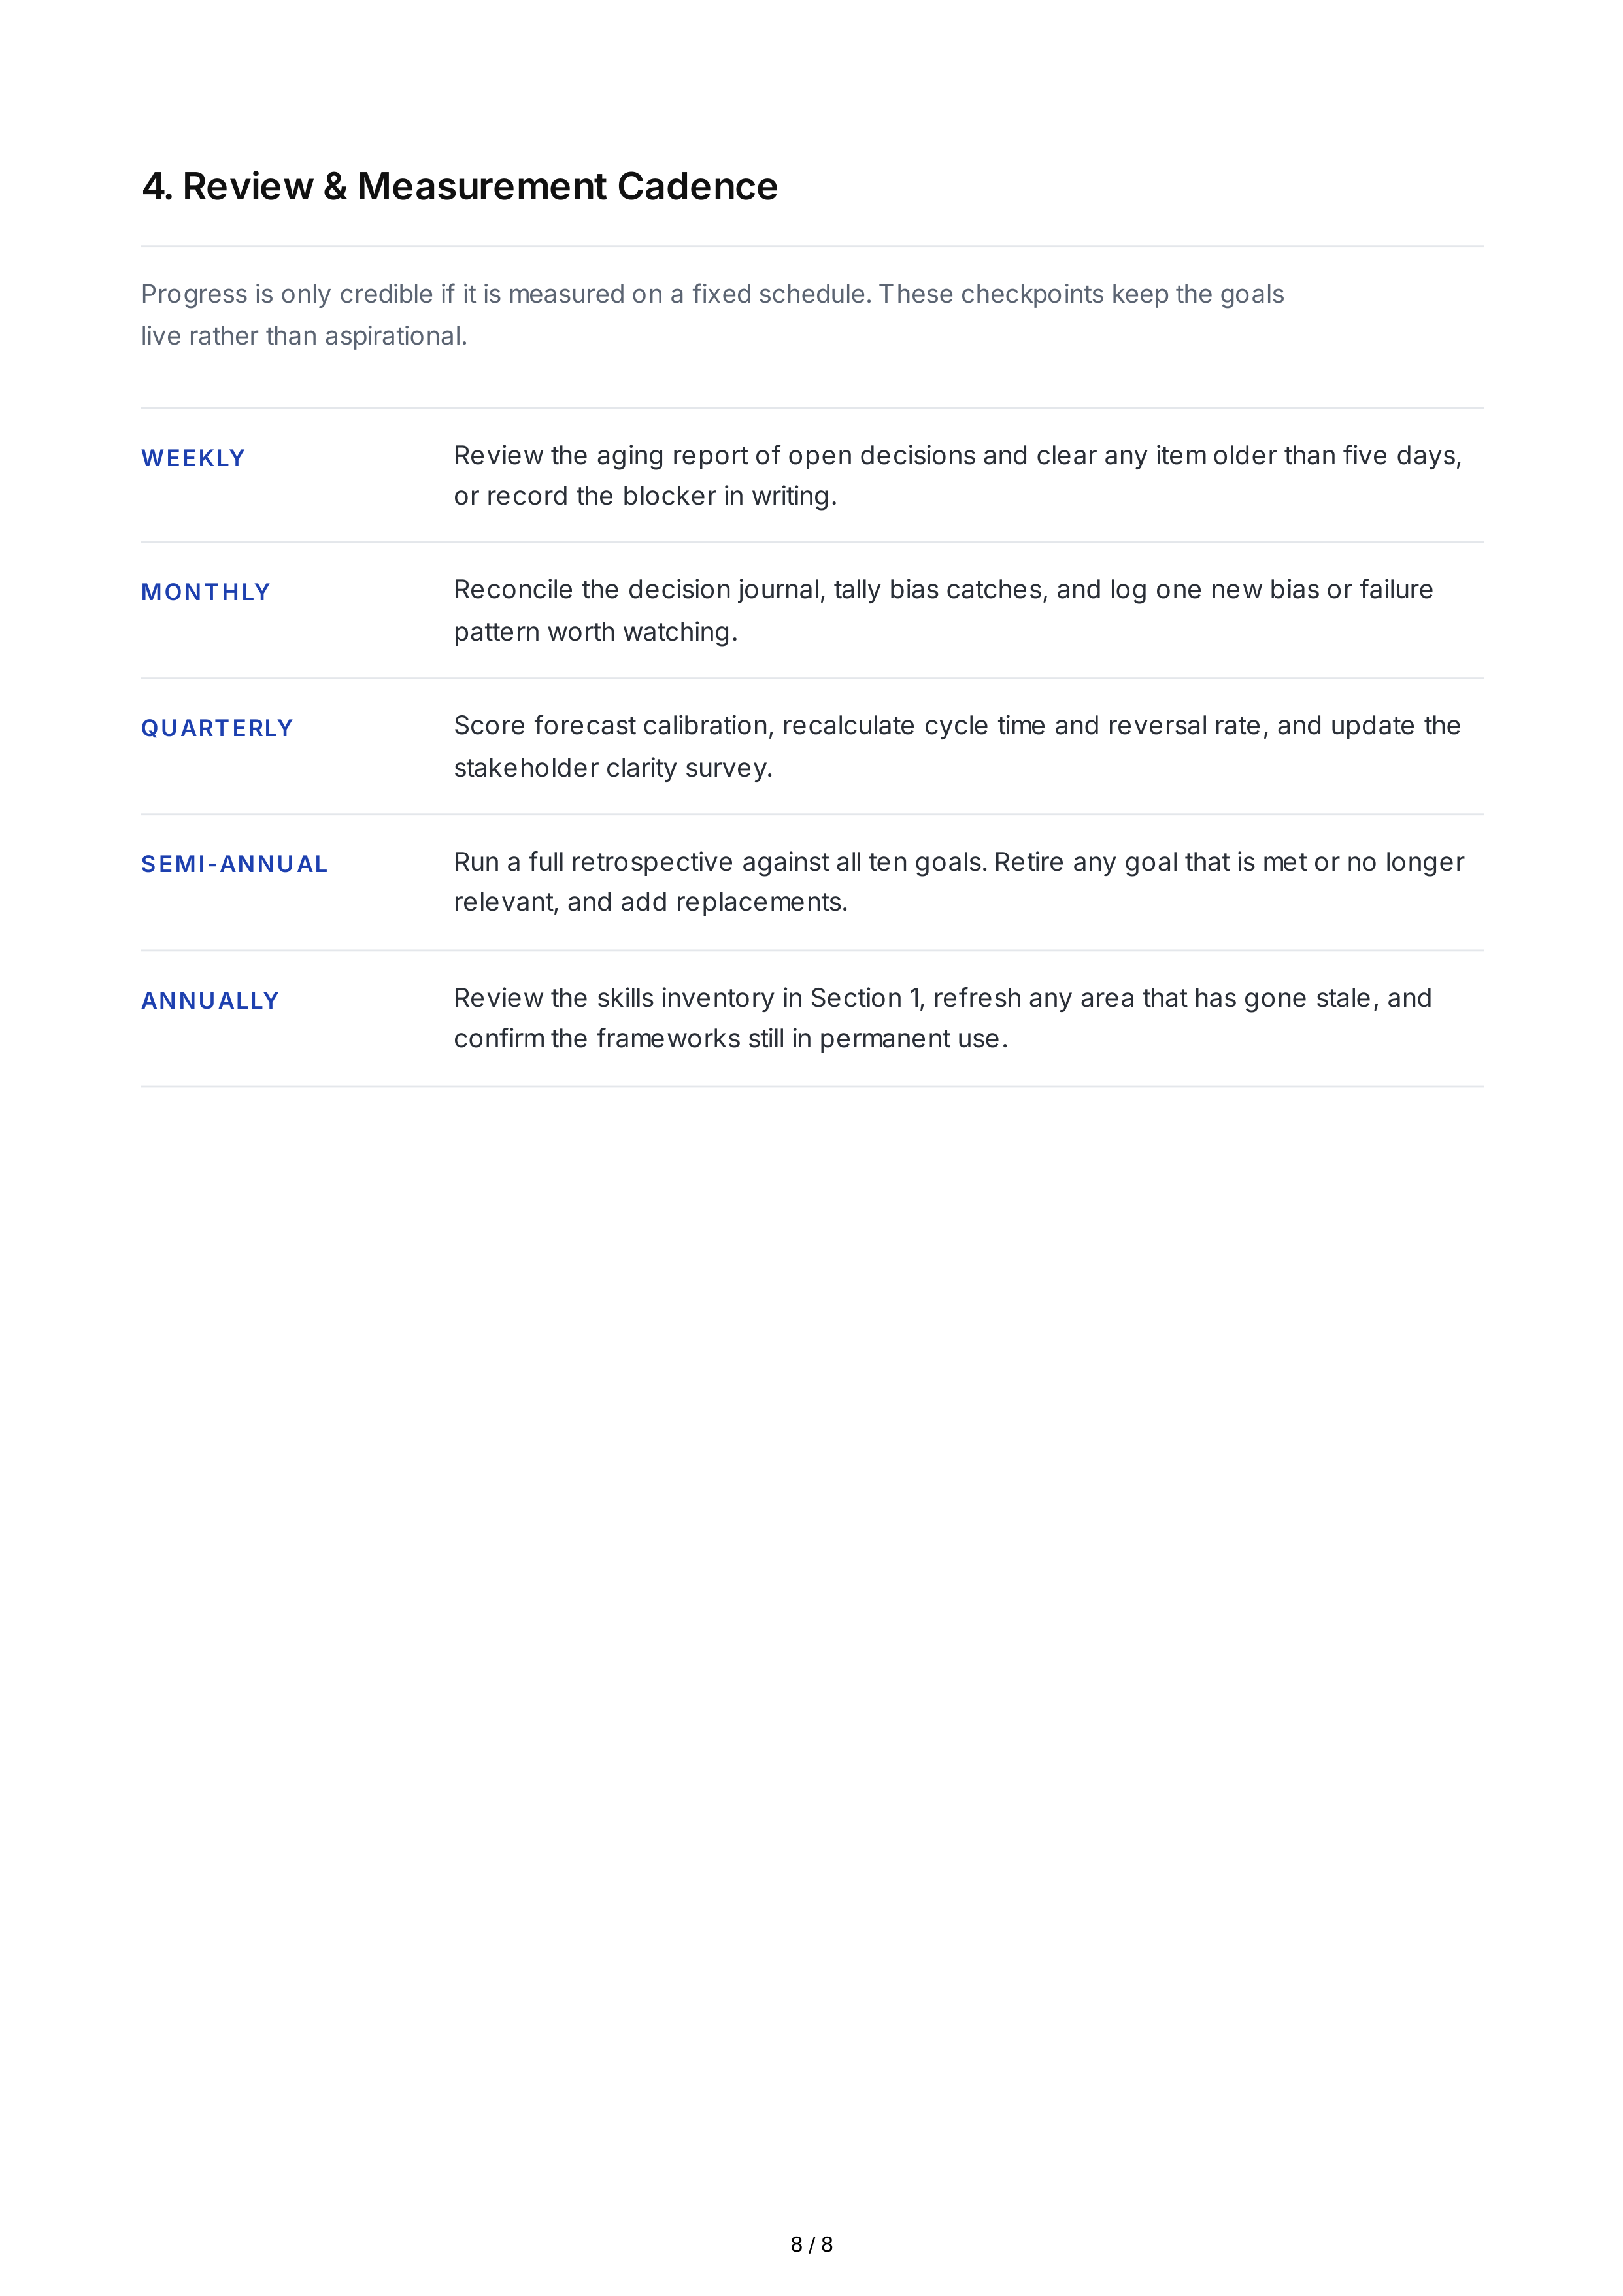
4.
Review
&
Measurement
Cadence
Progress
is
only
credible
if
it
is
measured
on
a
fixed
schedule
.
These
checkpoints
keep
the
goals
live
rather
than
aspirational
.
WEEKLY
Review
the
aging
report
of
open
decisions
and
clear
any
item
older
than
five
days
,
or
record
the
blocker
in
writing
.
MONTHLY
Reconcile
the
decision
journal
,
tally
bias
catches
,
and
log
one
new
bias
or
failure
pattern
worth
watching
.
QUARTERLY
Score
forecast
calibration
,
recalculate
cycle
time
and
reversal
rate
,
and
update
the
stakeholder
clarity
survey
.
SEMI
-
ANNUAL
Run
a
full
retrospective
against
all
ten
goals
.
Retire
any
goal
that
is
met
or
no
longer
relevant
,
and
add
replacements
.
ANNUALLY
Review
the
skills
inventory
in
Section
1,
refresh
any
area
that
has
gone
stale
,
and
confirm
the
frameworks
still
in
permanent
use
.
8 / 8