Operational
Efficiency
—
Professional
Goals
1 / 7
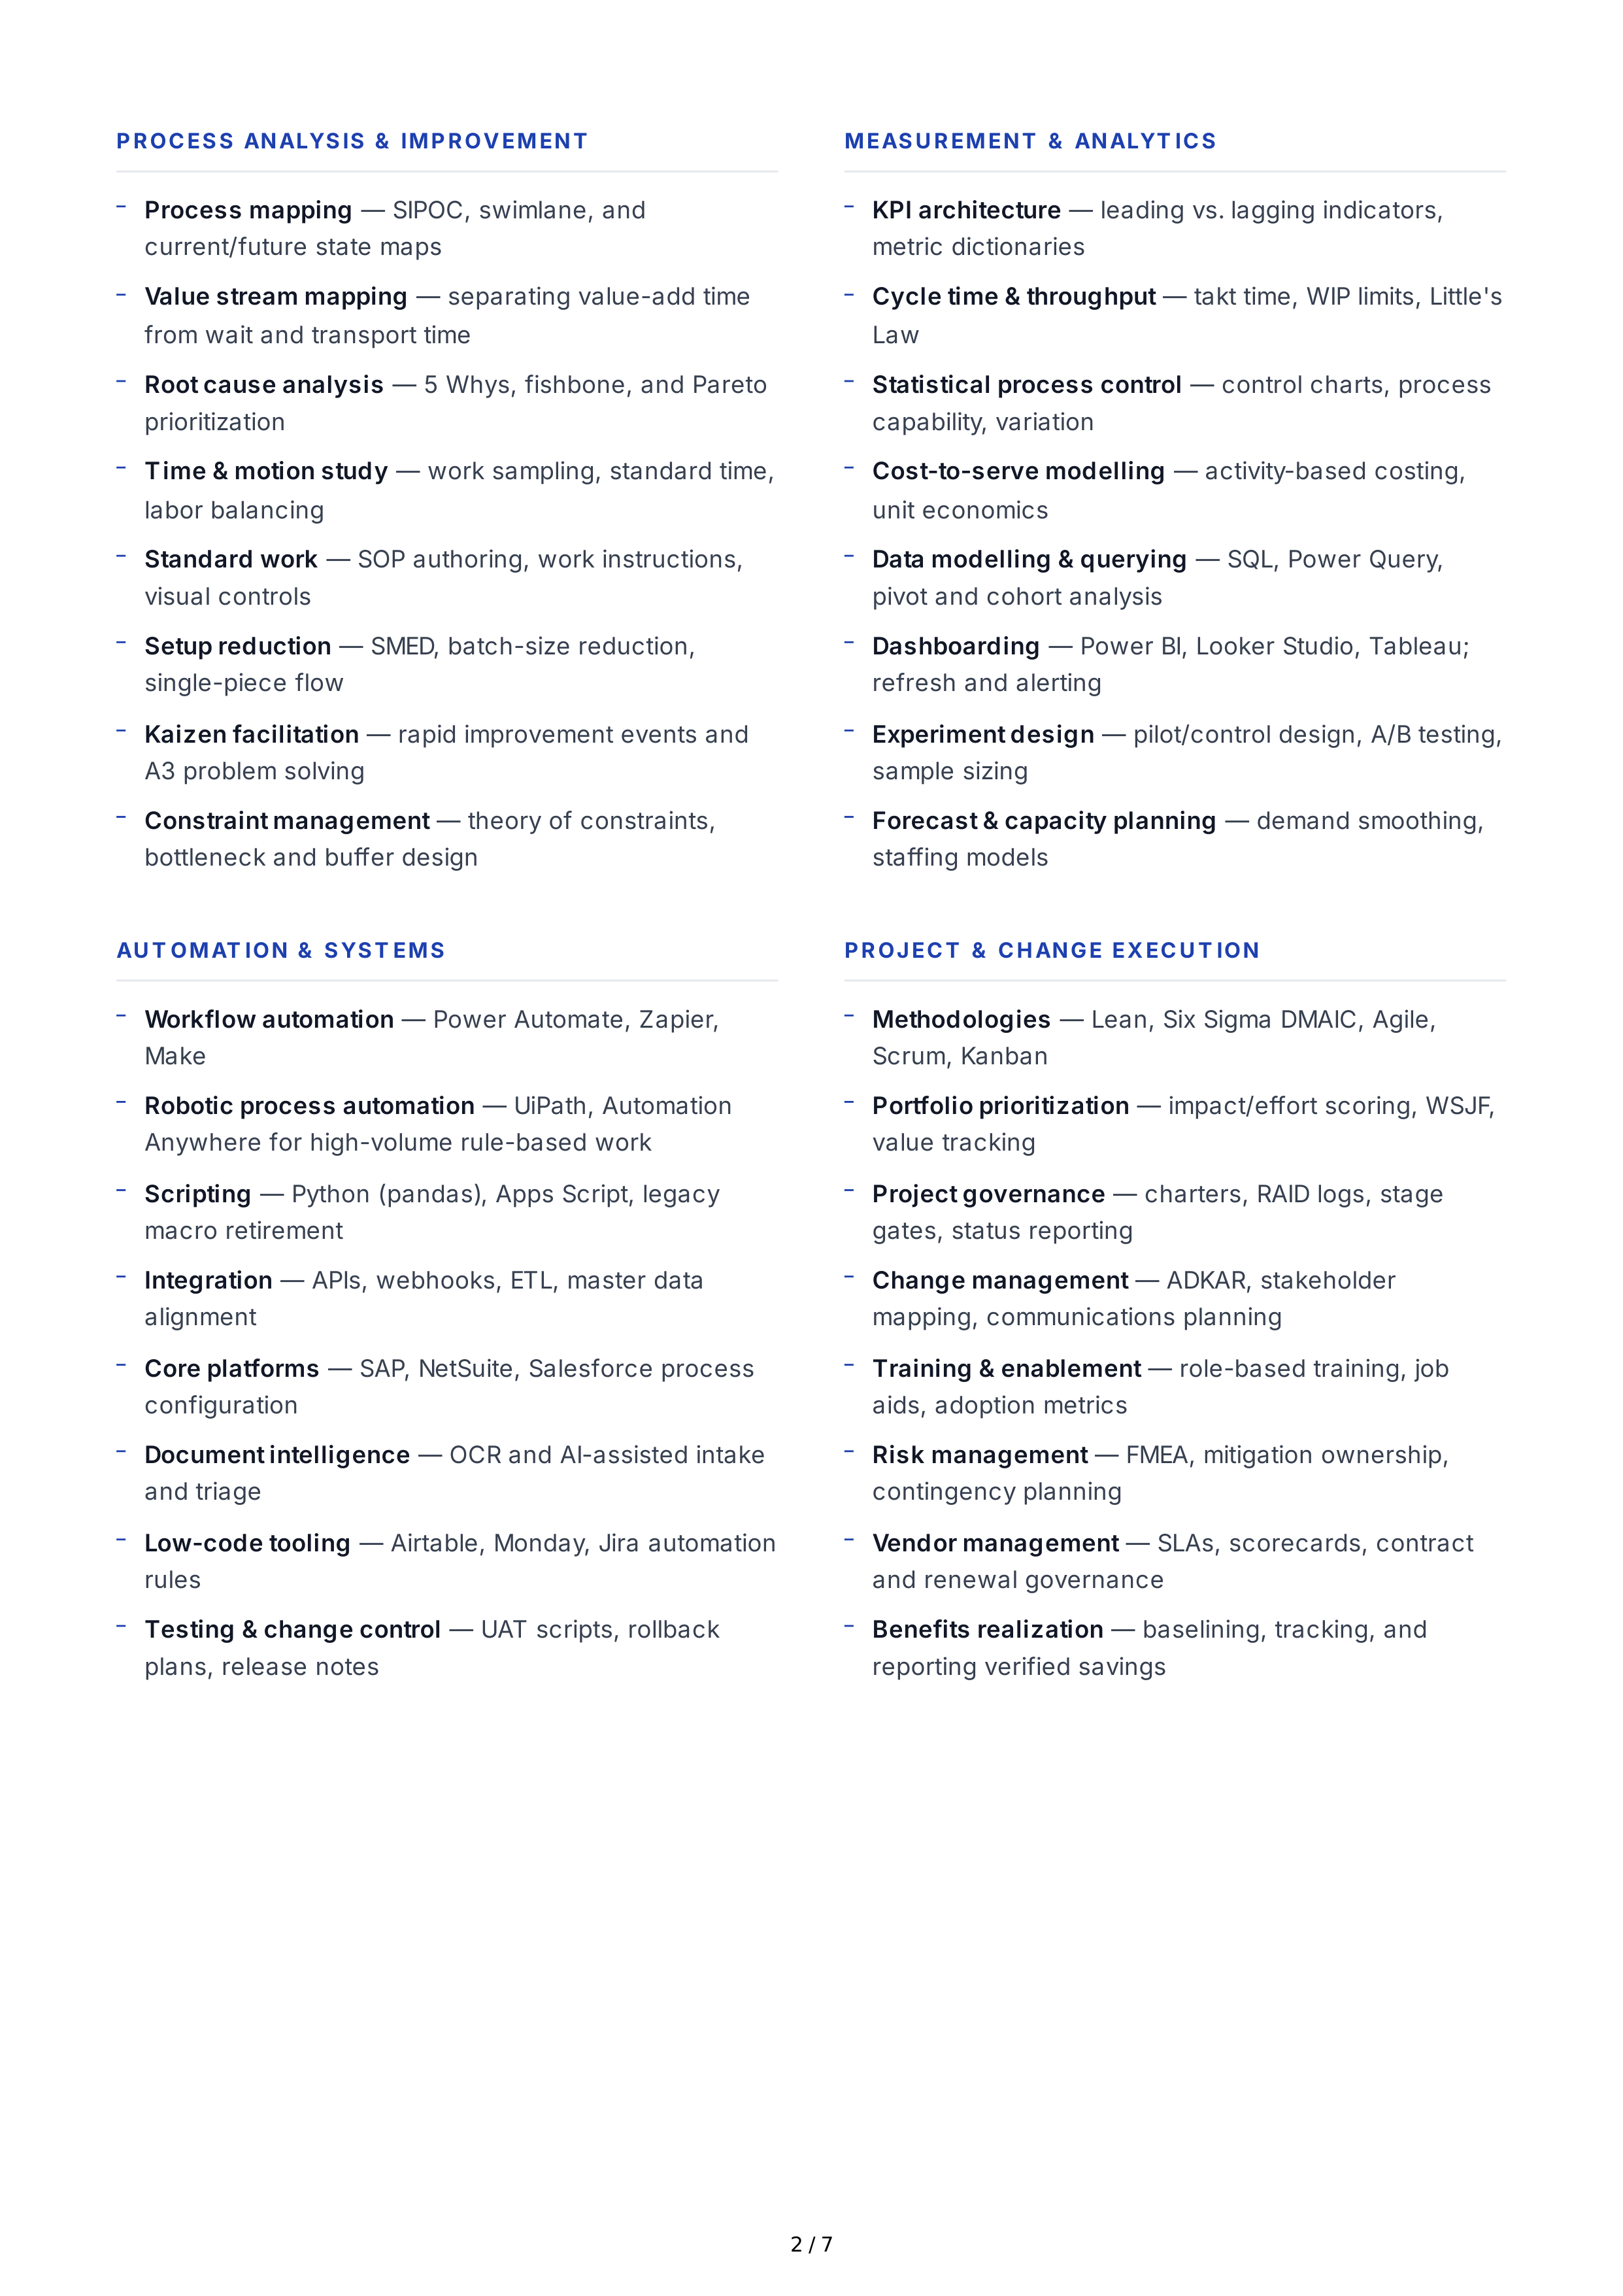
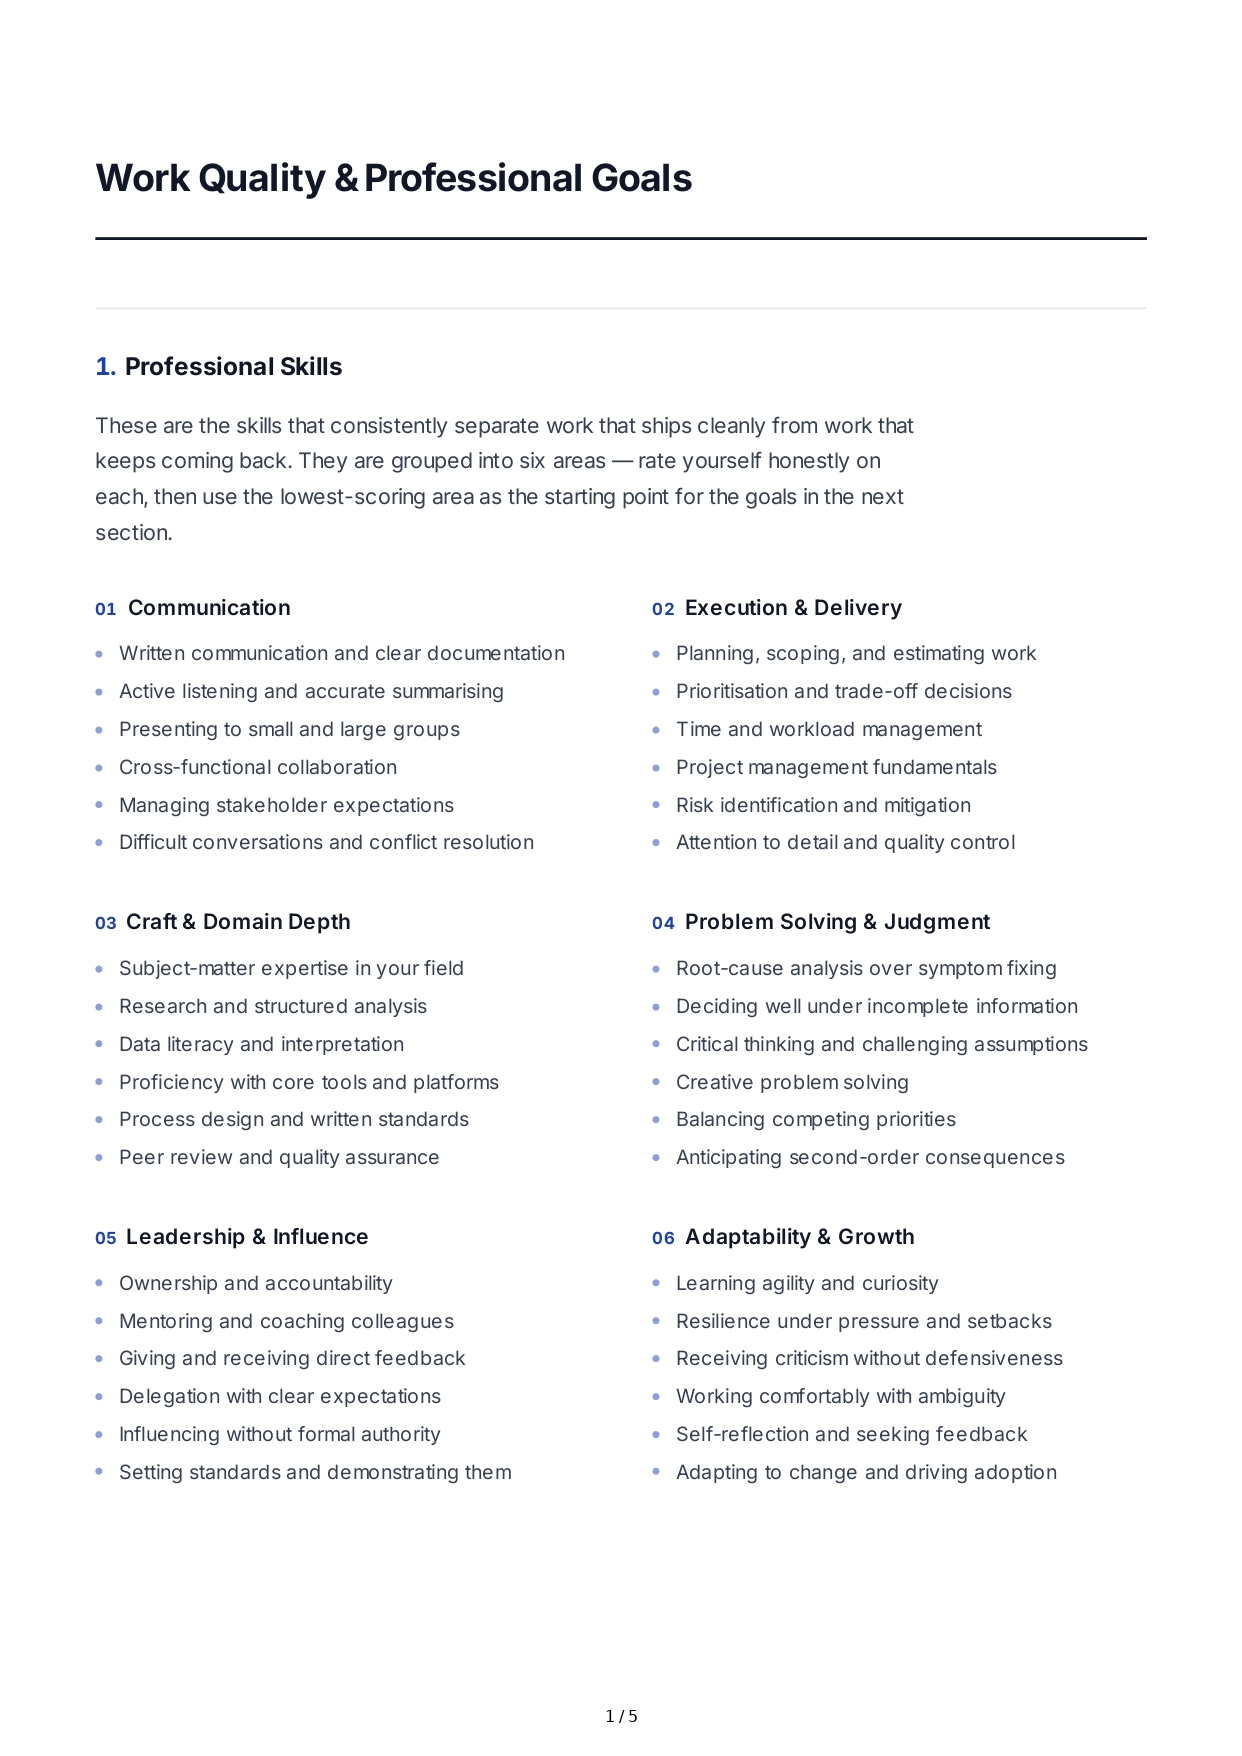
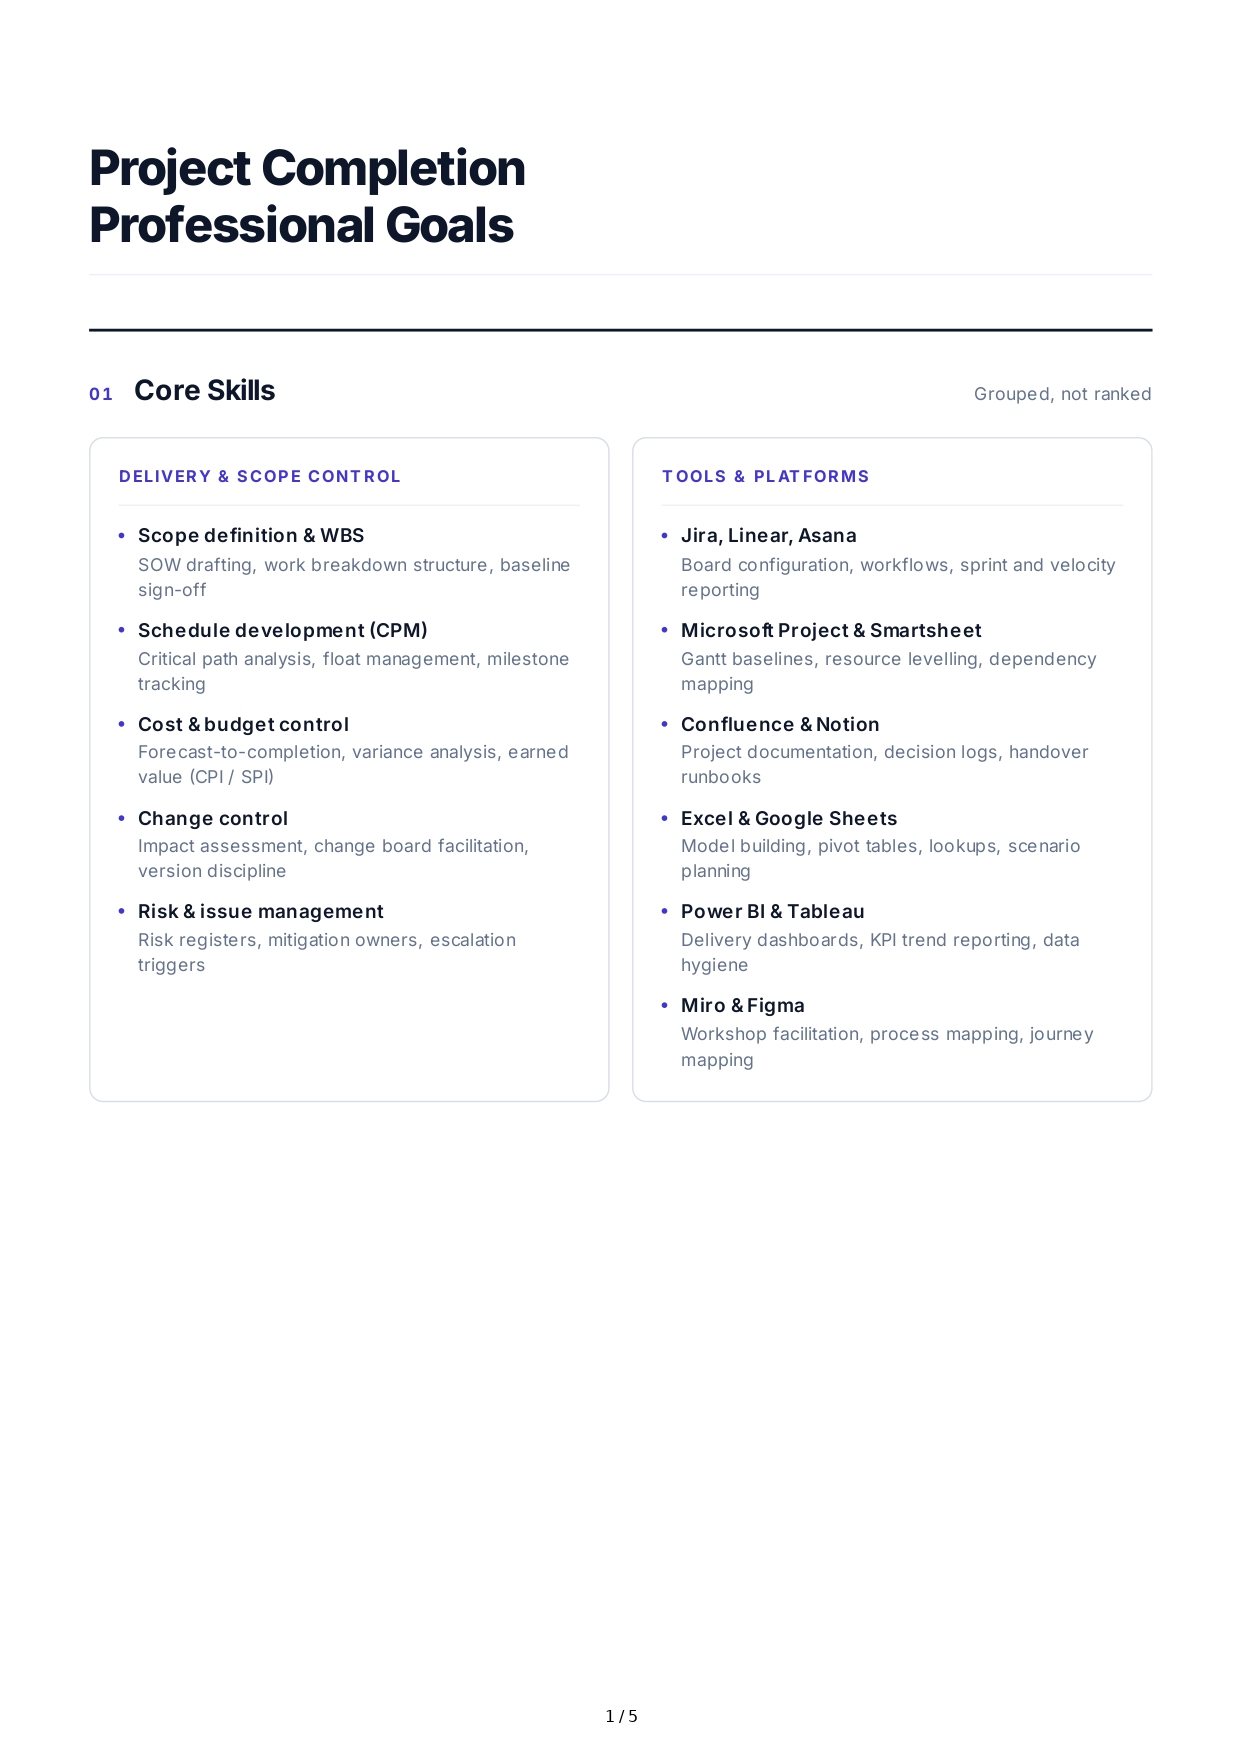
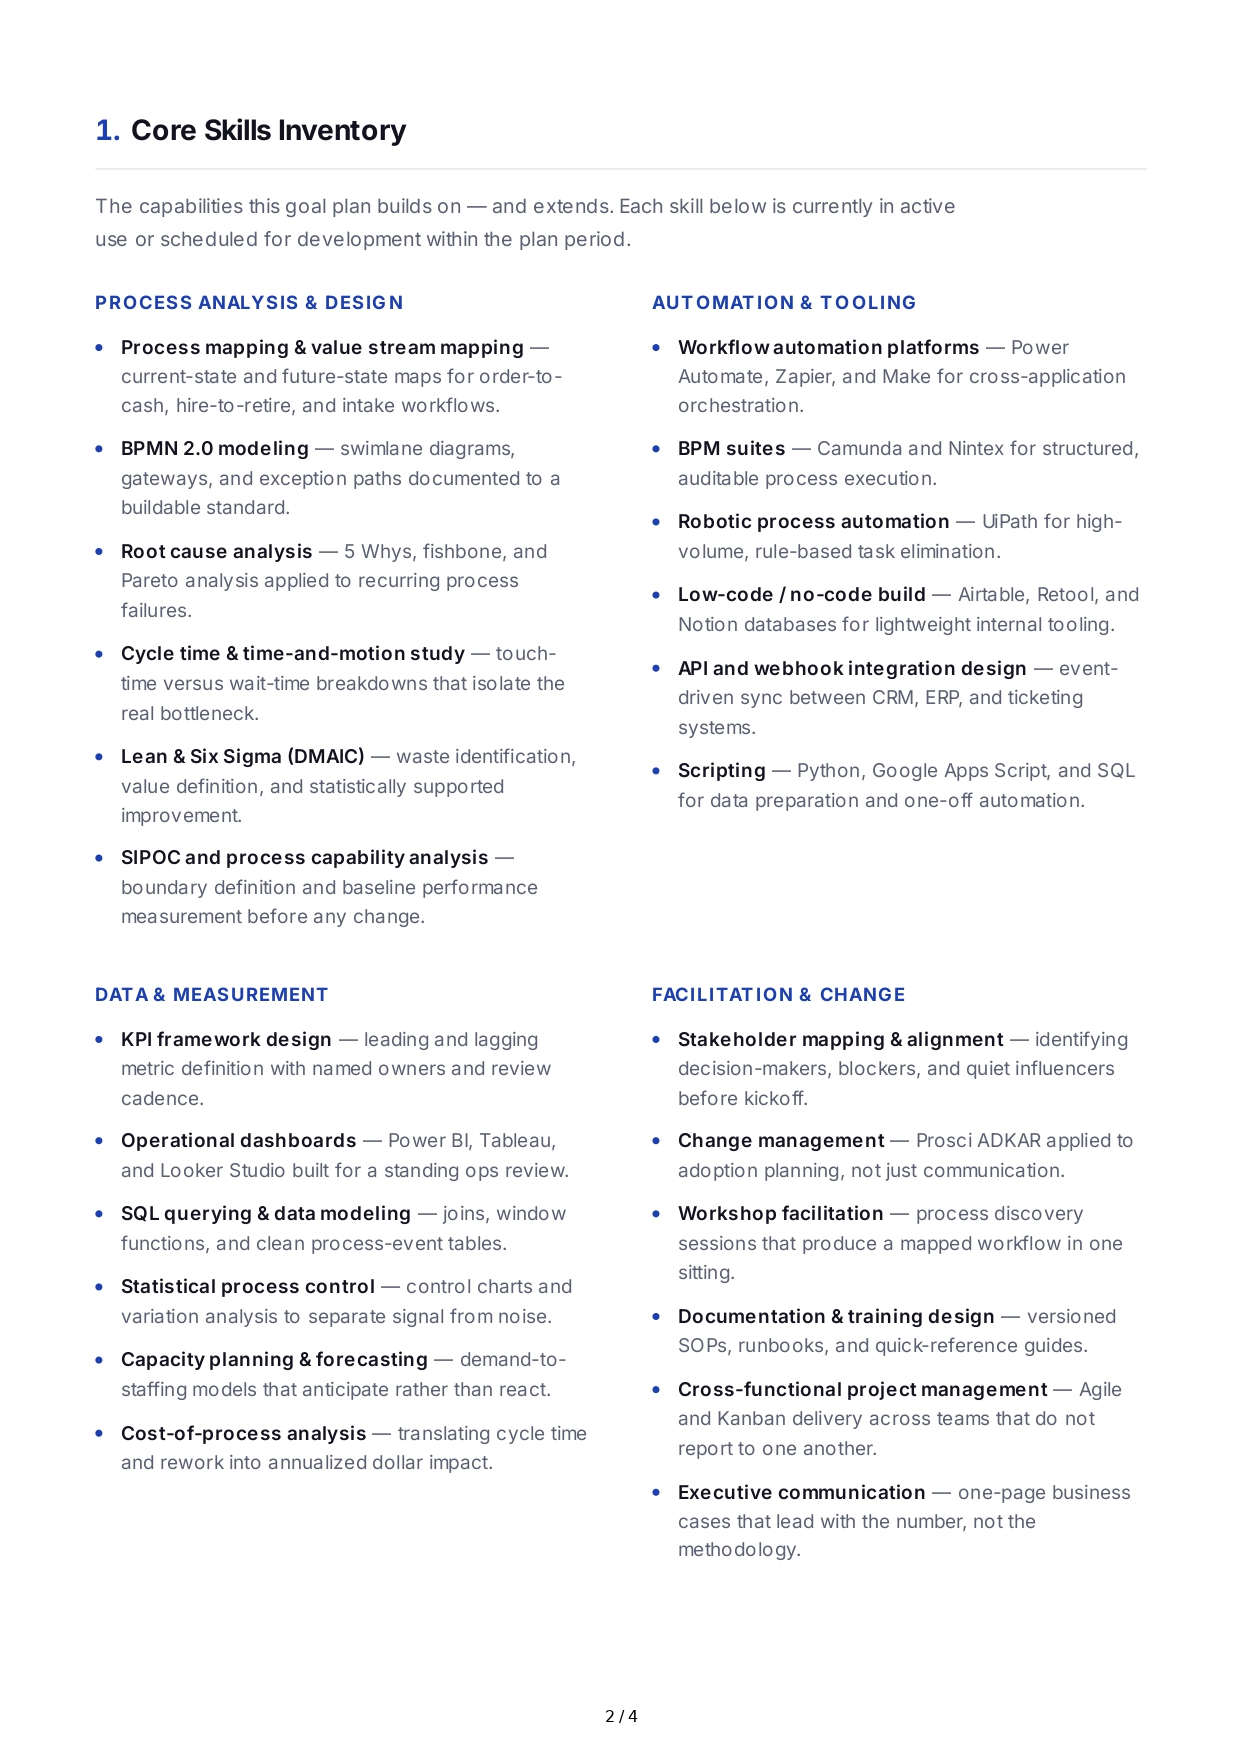
PROCESS
ANALYSIS
&
IMPROVEMENT
MEASU REMENT
&
ANALYT ICS
AU T OMAT ION
&
SYST EMS
PROJECT
&
CHANGE
EXECU T ION
Process
mapping
—
SIPOC
,
swimlane
,
and
current
/
future
state
maps
Value
stream
mapping
—
separating
value
-
add
time
from
wait
and
transport
time
Root
cause
analysis
— 5
Whys
,
fishbone
,
and
Pareto
prioritization
Time
&
motion
study
—
work
sampling
,
standard
time
,
labor
balancing
Standard
work
—
SOP
authoring
,
work
instructions
,
visual
controls
Setup
reduction
—
SMED
,
batch
-
size
reduction
,
single
-
piece
flow
Kaizen
facilitation
—
rapid
improvement
events
and
A
3
problem
solving
Constraint
management
—
theory
of
constraints
,
bottleneck
and
buffer
design
KPI
architecture
—
leading
vs
.
lagging
indicators
,
metric
dictionaries
Cycle
time
&
throughput
—
takt
time
,
WIP
limits
,
Little
'
s
Law
Statistical
process
control
—
control
charts
,
process
capability
,
variation
Cost
-
to
-
serve
modelling
—
activity
-
based
costing
,
unit
economics
Data
modelling
&
querying
—
SQL
,
Power
Query
,
pivot
and
cohort
analysis
Dashboarding
—
Power
BI
,
Looker
Studio
,
Tableau
;
refresh
and
alerting
Experiment
design
—
pilot
/
control
design
,
A
/
B
testing
,
sample
sizing
Forecast
&
capacity
planning
—
demand
smoothing
,
staffing
models
Workflow
automation
—
Power
Automate
,
Zapier
,
Make
Robotic
process
automation
—
UiPath
,
Automation
Anywhere
for
high
-
volume
rule
-
based
work
Scripting
—
Python
(
pandas
),
Apps
Script
,
legacy
macro
retirement
Integration
—
APIs
,
webhooks
,
ETL
,
master
data
alignment
Core
platforms
—
SAP
,
NetSuite
,
Salesforce
process
configuration
Document
intelligence
—
OCR
and
AI
-
assisted
intake
and
triage
Low
-
code
tooling
—
Airtable
,
Monday
,
Jira
automation
rules
Testing
&
change
control
—
UAT
scripts
,
rollback
plans
,
release
notes
Methodologies
—
Lean
,
Six
Sigma
DMAIC
,
Agile
,
Scrum
,
Kanban
Portfolio
prioritization
—
impact
/
effort
scoring
,
WSJF
,
value
tracking
Project
governance
—
charters
,
RAID
logs
,
stage
gates
,
status
reporting
Change
management
—
ADKAR
,
stakeholder
mapping
,
communications
planning
Training
&
enablement
—
role
-
based
training
,
job
aids
,
adoption
metrics
Risk
management
—
FMEA
,
mitigation
ownership
,
contingency
planning
Vendor
management
—
SLAs
,
scorecards
,
contract
and
renewal
governance
Benefits
realization
—
baselining
,
tracking
,
and
reporting
verified
savings
2 / 7
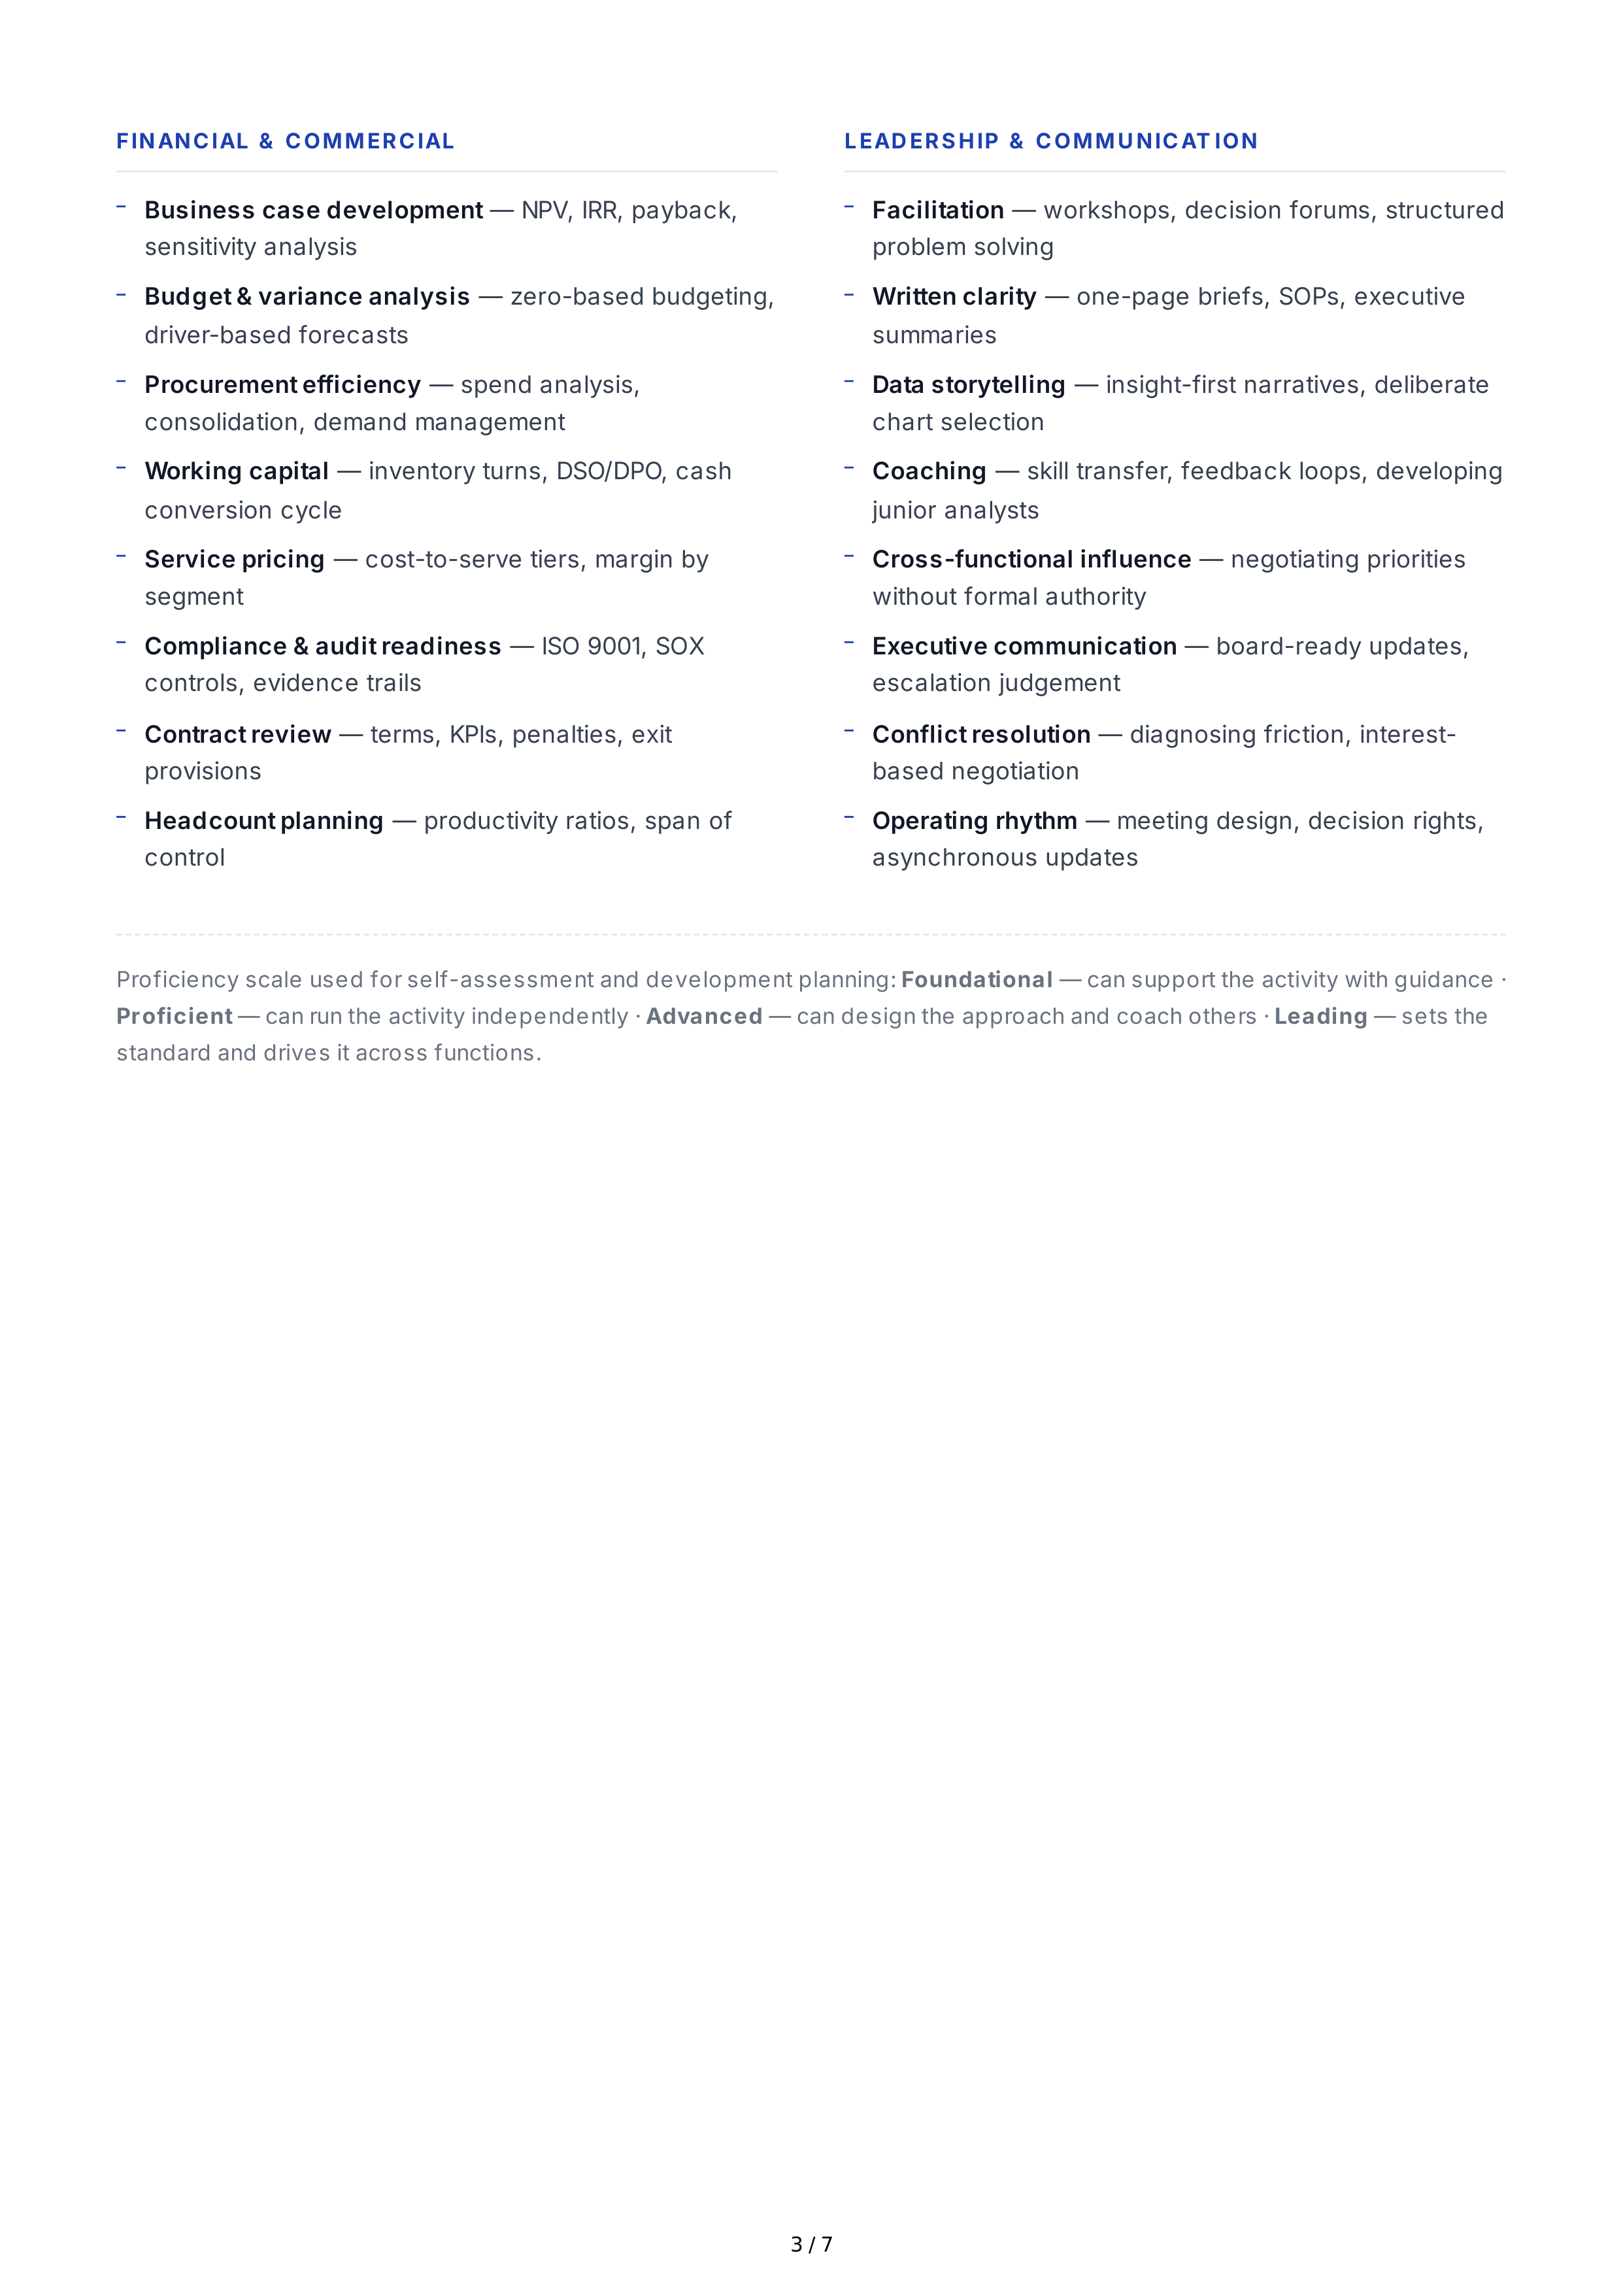
FINANCIAL
&
COMMERCIAL
LEAD ERSHIP
&
COMMU NICAT ION
Proficiency
scale
used
for
self
-
assessment
and
development
planning
:
Foundational
—
can
support
the
activity
with
guidance
·
Proficient
—
can
run
the
activity
independently
·
Advanced
—
can
design
the
approach
and
coach
others
·
Leading
—
sets
the
standard
and
drives
it
across
functions
.
Business
case
development
—
NPV
,
IRR
,
payback
,
sensitivity
analysis
Budget
&
variance
analysis
—
zero
-
based
budgeting
,
driver
-
based
forecasts
Procurement
efficiency
—
spend
analysis
,
consolidation
,
demand
management
Working
capital
—
inventory
turns
,
DSO
/
DPO
,
cash
conversion
cycle
Service
pricing
—
cost
-
to
-
serve
tiers
,
margin
by
segment
Compliance
&
audit
readiness
—
ISO
9001,
SOX
controls
,
evidence
trails
Contract
review
—
terms
,
KPIs
,
penalties
,
exit
provisions
Headcount
planning
—
productivity
ratios
,
span
of
control
Facilitation
—
workshops
,
decision
forums
,
structured
problem
solving
Written
clarity
—
one
-
page
briefs
,
SOPs
,
executive
summaries
Data
storytelling
—
insight
-
first
narratives
,
deliberate
chart
selection
Coaching
—
skill
transfer
,
feedback
loops
,
developing
junior
analysts
Cross
-
functional
influence
—
negotiating
priorities
without
formal
authority
Executive
communication
—
board
-
ready
updates
,
escalation
judgement
Conflict
resolution
—
diagnosing
friction
,
interest
-
based
negotiation
Operating
rhythm
—
meeting
design
,
decision
rights
,
asynchronous
updates
3 / 7
2.
Professional
Goals
—
Operational
Efficiency
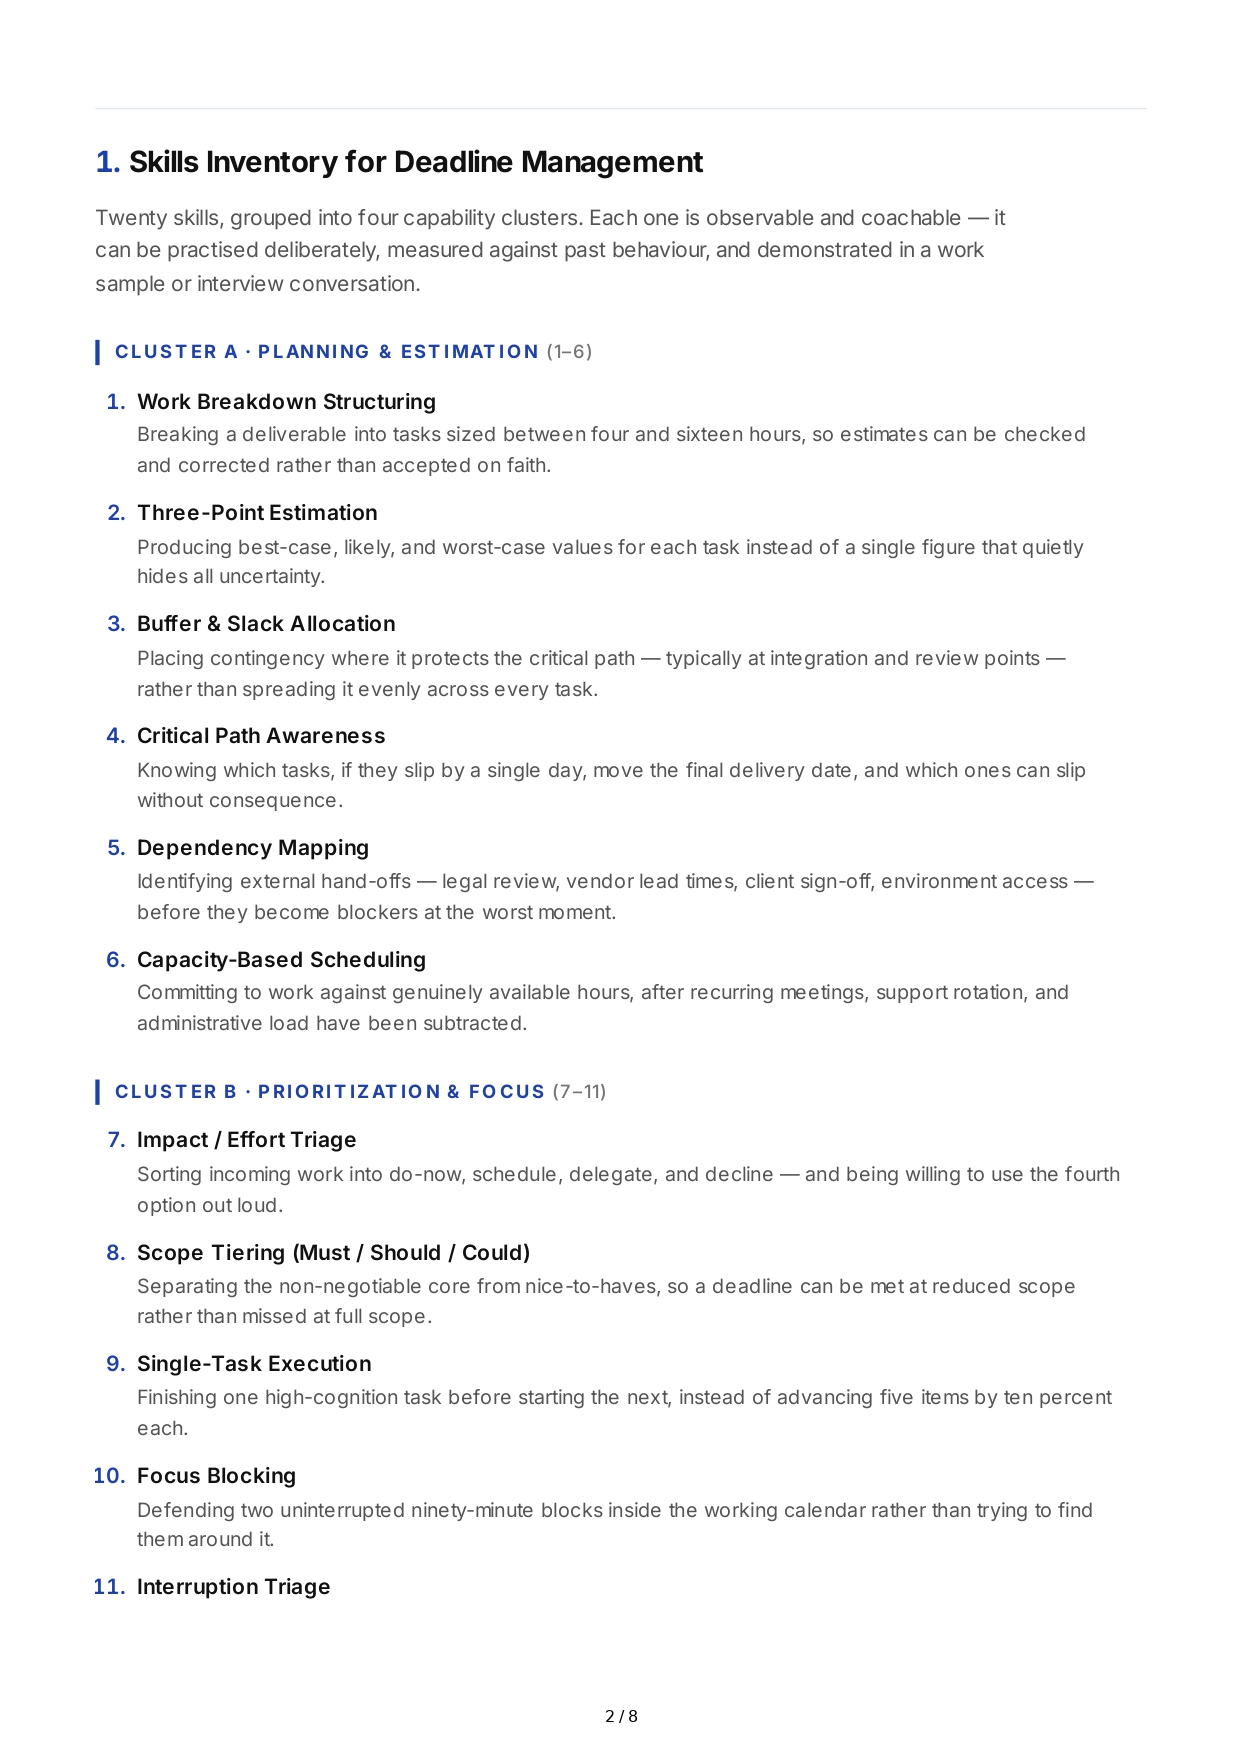
Twelve
goals
spanning
process
,
measurement
,
automation
,
cost
,
and
capability
.
Each
one
is
written
to
be
measurable
,
time
-
bound
,
and
verifiable
from
existing
systems
of
record
.
Select
four
to
six
per
year
,
agree
baselines
with
your
manager
,
and
report
progress
on
the
cadence
in
Section
3.
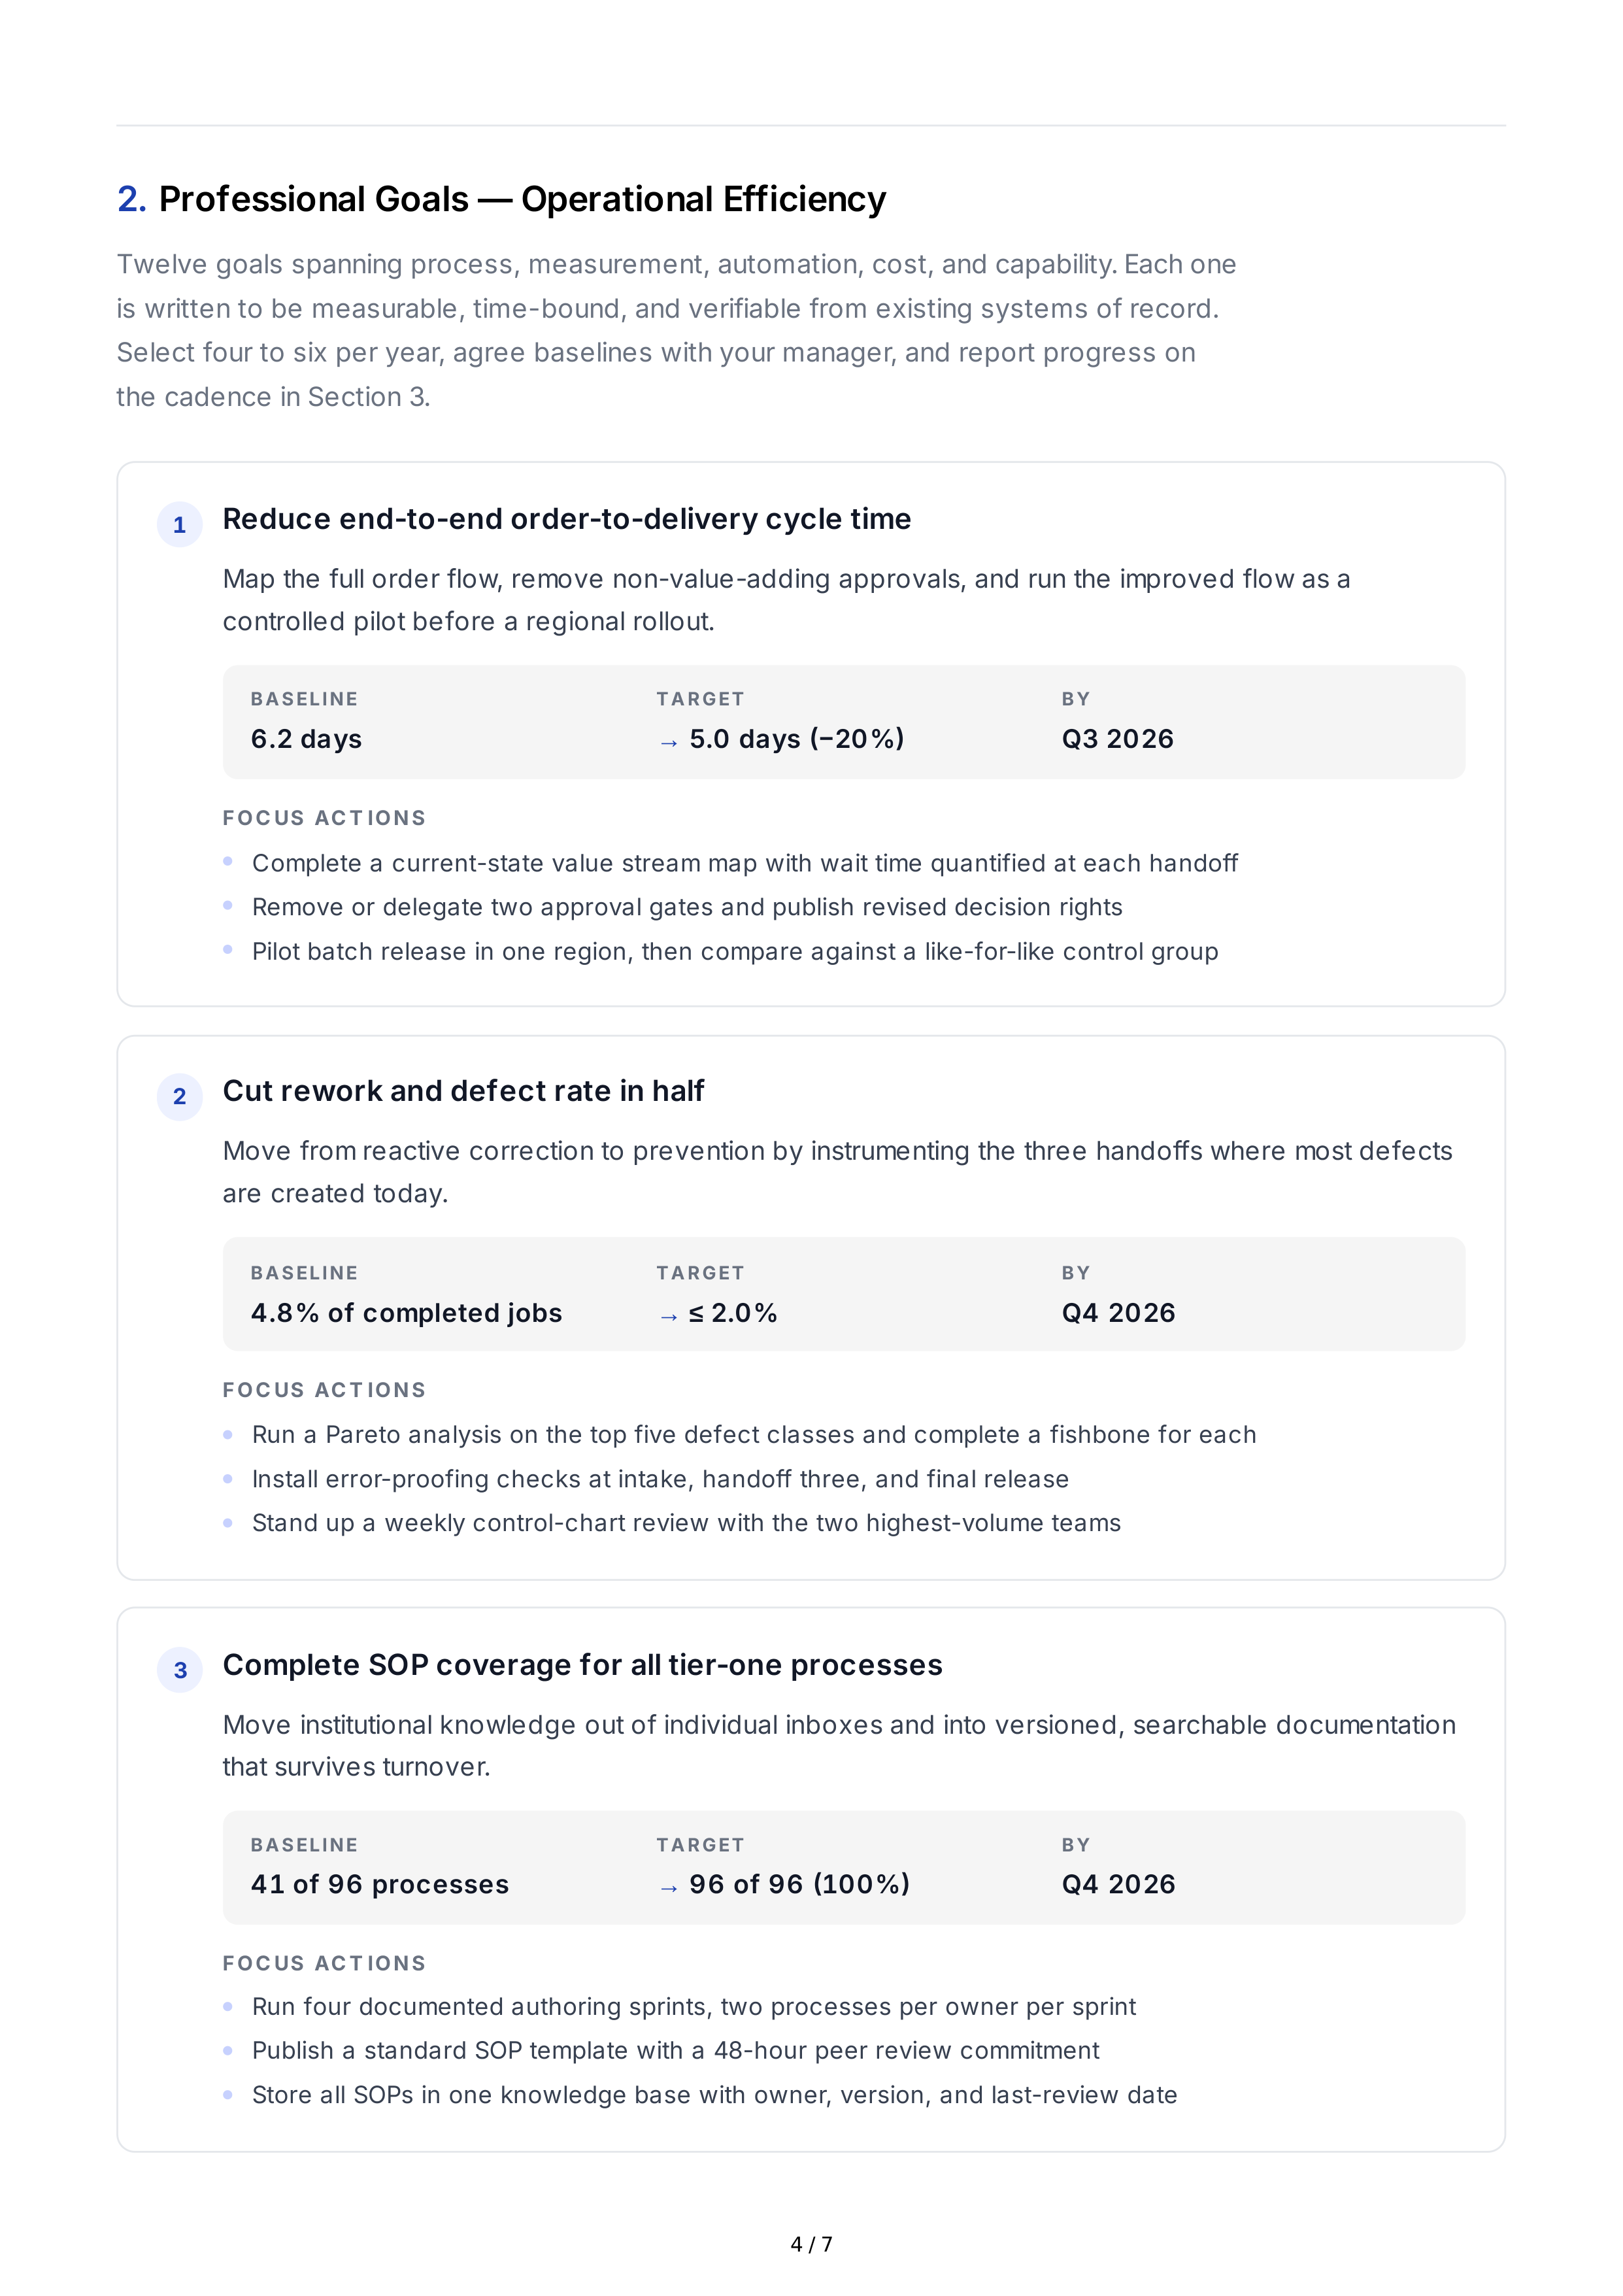
Reduce
end
-
to
-
end
order
-
to
-
delivery
cycle
time
Map
the
full
order
flow
,
remove
non
-
value
-
adding
approvals
,
and
run
the
improved
flow
as
a
controlled
pilot
before
a
regional
rollout
.
BA SELINE
6.2
days
TA RG ET
→
5.0
days
(−20%)
BY
Q
3 2026
FOC US
AC T IONS
Cut
rework
and
defect
rate
in
half
Move
from
reactive
correction
to
prevention
by
instrumenting
the
three
handoffs
where
most
defects
are
created
today
.
BA SELINE
4.8%
of
completed
jobs
TA RG ET
→
≤
2.0%
BY
Q
4 2026
FOC US
AC T IONS
Complete
SOP
coverage
for
all
tier
-
one
processes
Move
institutional
knowledge
out
of
individual
inboxes
and
into
versioned
,
searchable
documentation
that
survives
turnover
.
BA SELINE
41
of
96
processes
TA RG ET
→
96
of
96 (100%)
BY
Q
4 2026
FOC US
AC T IONS
1
Complete
a
current
-
state
value
stream
map
with
wait
time
quantified
at
each
handoff
Remove
or
delegate
two
approval
gates
and
publish
revised
decision
rights
Pilot
batch
release
in
one
region
,
then
compare
against
a
like
-
for
-
like
control
group
2
Run
a
Pareto
analysis
on
the
top
five
defect
classes
and
complete
a
fishbone
for
each
Install
error
-
proofing
checks
at
intake
,
handoff
three
,
and
final
release
Stand
up
a
weekly
control
-
chart
review
with
the
two
highest
-
volume
teams
3
Run
four
documented
authoring
sprints
,
two
processes
per
owner
per
sprint
Publish
a
standard
SOP
template
with
a
48-
hour
peer
review
commitment
Store
all
SOPs
in
one
knowledge
base
with
owner
,
version
,
and
last
-
review
date
4 / 7
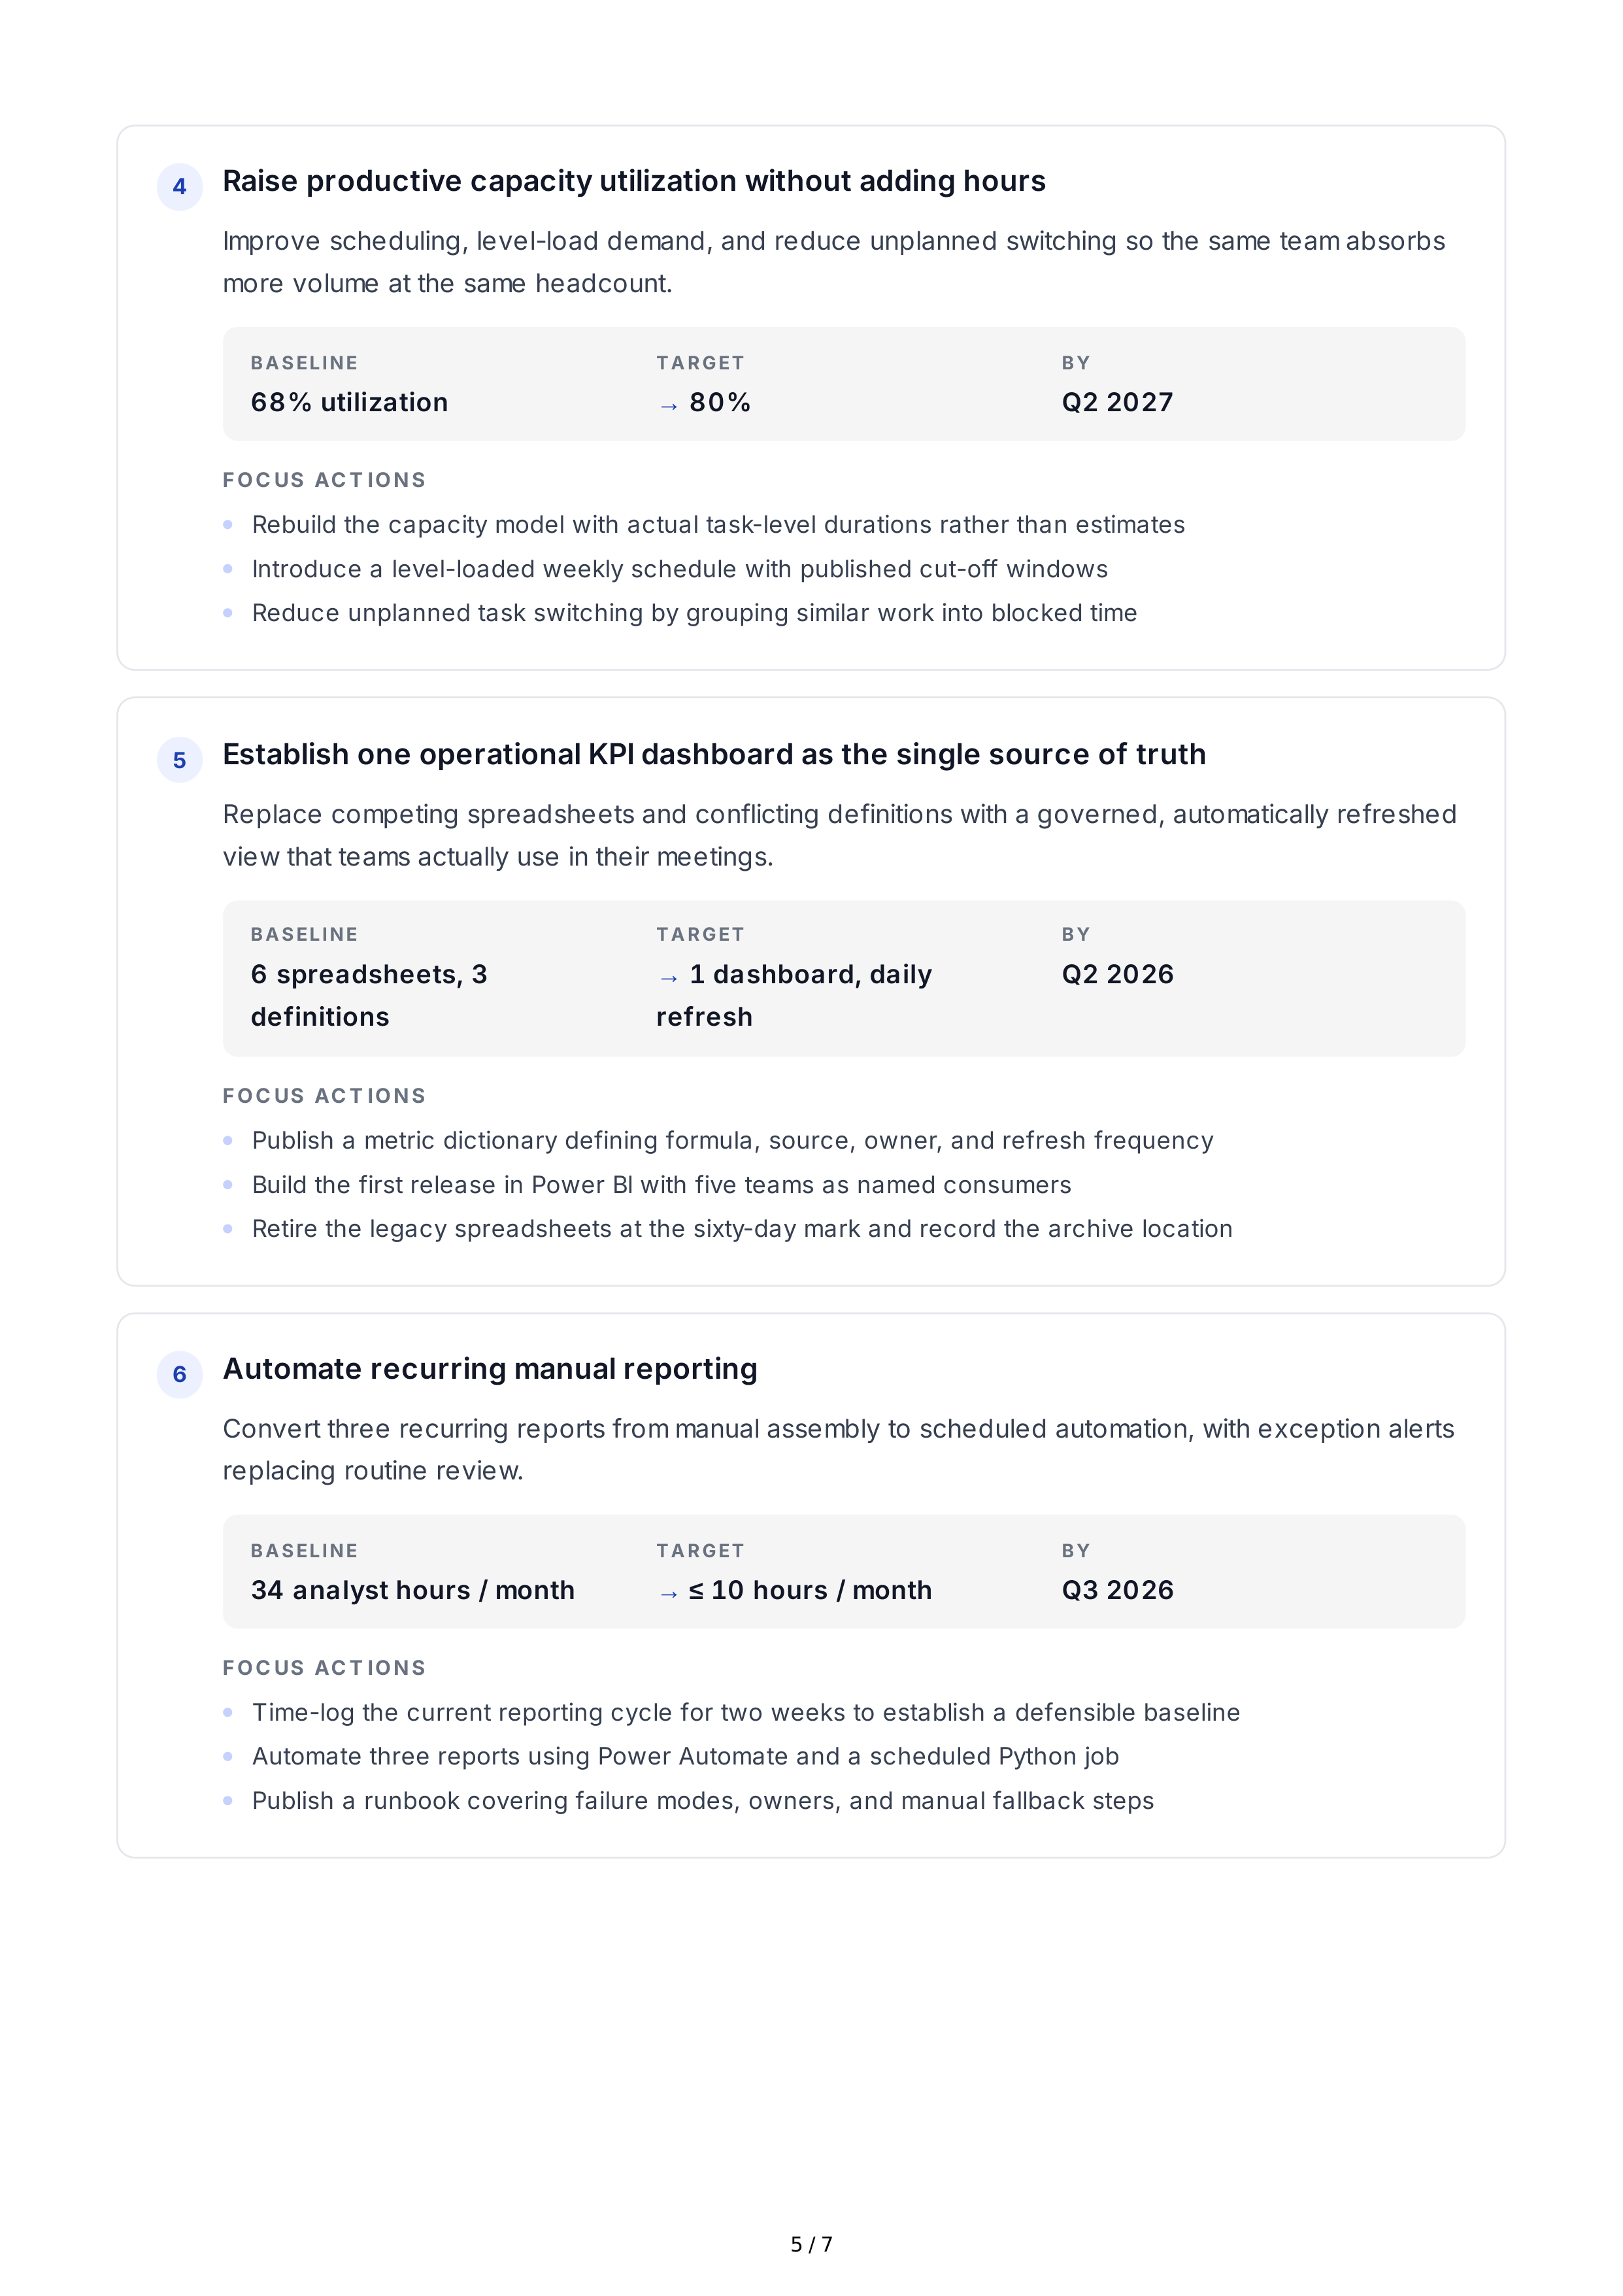
Raise
productive
capacity
utilization
without
adding
hours
Improve
scheduling
,
level
-
load
demand
,
and
reduce
unplanned
switching
so
the
same
team
absorbs
more
volume
at
the
same
headcount
.
BA SELINE
68%
utilization
TA RG ET
→
80%
BY
Q
2 2027
FOC US
AC T IONS
Establish
one
operational
KPI
dashboard
as
the
single
source
of
truth
Replace
competing
spreadsheets
and
conflicting
definitions
with
a
governed
,
automatically
refreshed
view
that
teams
actually
use
in
their
meetings
.
BA SELINE
6
spreadsheets
, 3
definitions
TA RG ET
→
1
dashboard
,
daily
refresh
BY
Q
2 2026
FOC US
AC T IONS
Automate
recurring
manual
reporting
Convert
three
recurring
reports
from
manual
assembly
to
scheduled
automation
,
with
exception
alerts
replacing
routine
review
.
BA SELINE
34
analyst
hours
/
month
TA RG ET
→
≤
10
hours
/
month
BY
Q
3 2026
FOC US
AC T IONS
4
Rebuild
the
capacity
model
with
actual
task
-
level
durations
rather
than
estimates
Introduce
a
level
-
loaded
weekly
schedule
with
published
cut
-
off
windows
Reduce
unplanned
task
switching
by
grouping
similar
work
into
blocked
time
5
Publish
a
metric
dictionary
defining
formula
,
source
,
owner
,
and
refresh
frequency
Build
the
first
release
in
Power
BI
with
five
teams
as
named
consumers
Retire
the
legacy
spreadsheets
at
the
sixty
-
day
mark
and
record
the
archive
location
6
Time
-
log
the
current
reporting
cycle
for
two
weeks
to
establish
a
defensible
baseline
Automate
three
reports
using
Power
Automate
and
a
scheduled
Python
job
Publish
a
runbook
covering
failure
modes
,
owners
,
and
manual
fallback
steps
5 / 7
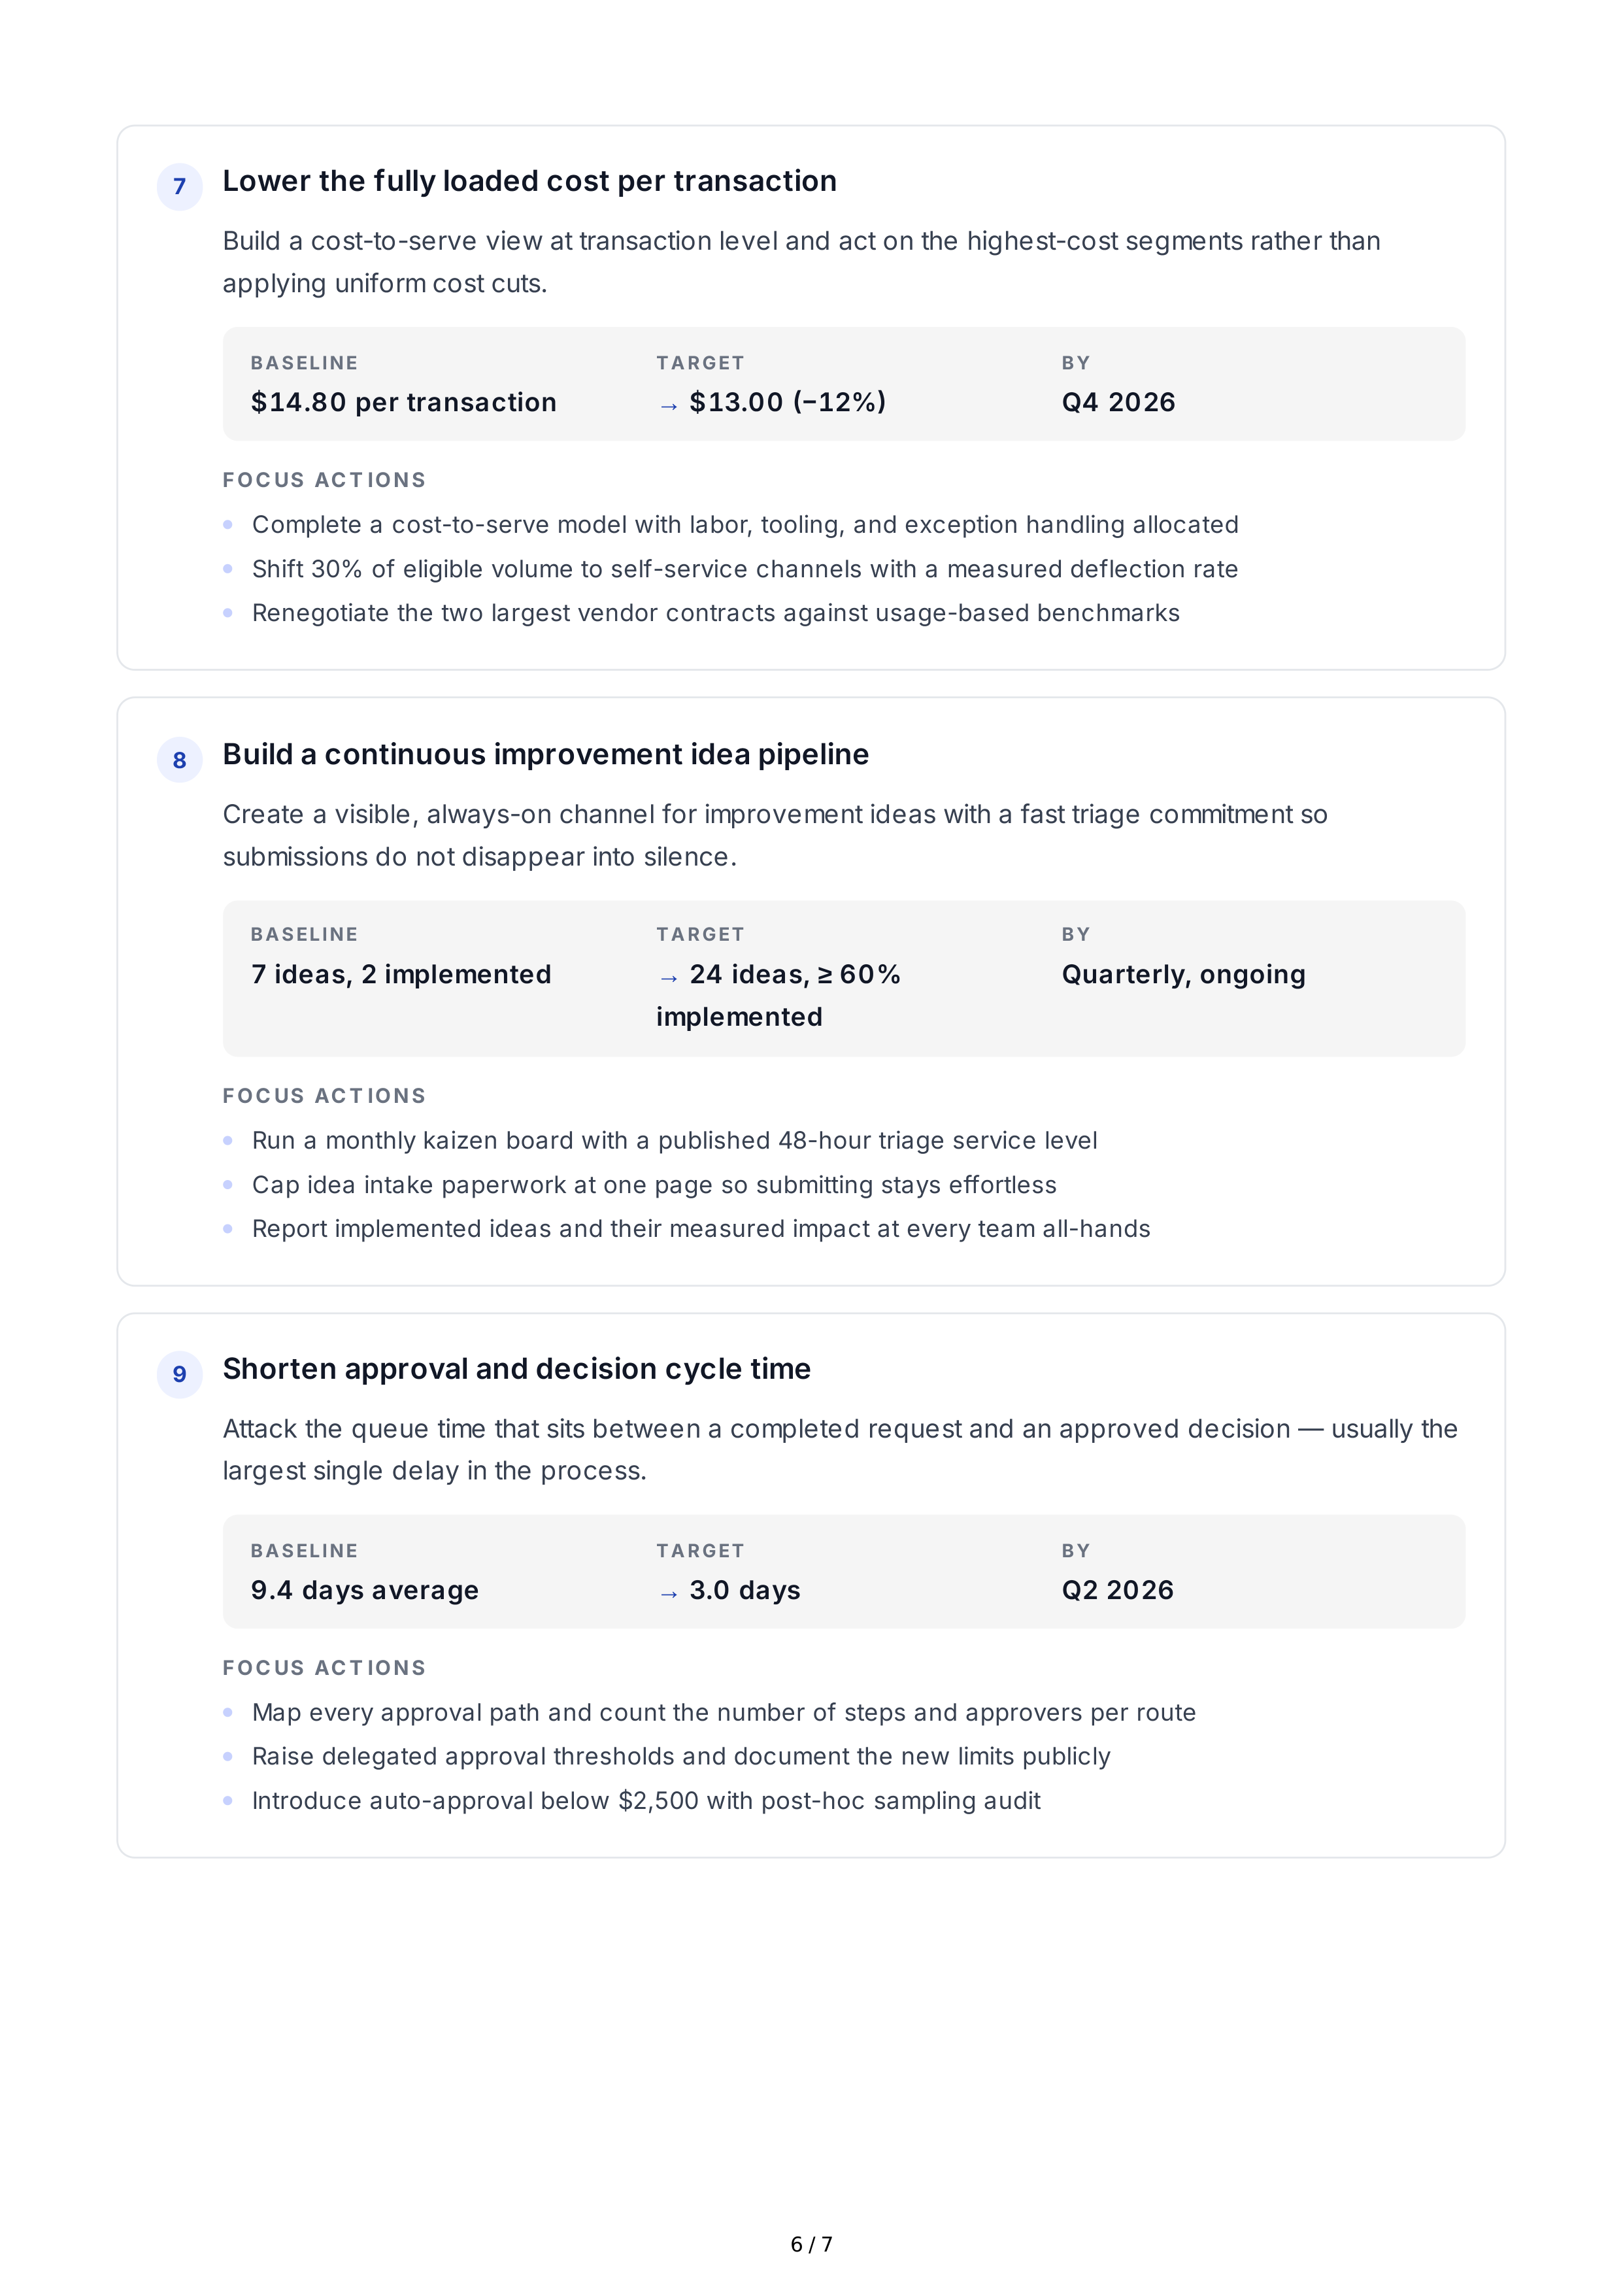
Lower
the
fully
loaded
cost
per
transaction
Build
a
cost
-
to
-
serve
view
at
transaction
level
and
act
on
the
highest
-
cost
segments
rather
than
applying
uniform
cost
cuts
.
BA SELINE
$
14.80
per
transaction
TA RG ET
→
$
13.00 (−12%)
BY
Q
4 2026
FOC US
AC T IONS
Build
a
continuous
improvement
idea
pipeline
Create
a
visible
,
always
-
on
channel
for
improvement
ideas
with
a
fast
triage
commitment
so
submissions
do
not
disappear
into
silence
.
BA SELINE
7
ideas
, 2
implemented
TA RG ET
→
24
ideas
,
≥
60%
implemented
BY
Quarterly
,
ongoing
FOC US
AC T IONS
Shorten
approval
and
decision
cycle
time
Attack
the
queue
time
that
sits
between
a
completed
request
and
an
approved
decision
—
usually
the
largest
single
delay
in
the
process
.
BA SELINE
9.4
days
average
TA RG ET
→
3.0
days
BY
Q
2 2026
FOC US
AC T IONS
7
Complete
a
cost
-
to
-
serve
model
with
labor
,
tooling
,
and
exception
handling
allocated
Shift
30%
of
eligible
volume
to
self
-
service
channels
with
a
measured
deflection
rate
Renegotiate
the
two
largest
vendor
contracts
against
usage
-
based
benchmarks
8
Run
a
monthly
kaizen
board
with
a
published
48-
hour
triage
service
level
Cap
idea
intake
paperwork
at
one
page
so
submitting
stays
effortless
Report
implemented
ideas
and
their
measured
impact
at
every
team
all
-
hands
9
Map
every
approval
path
and
count
the
number
of
steps
and
approvers
per
route
Raise
delegated
approval
thresholds
and
document
the
new
limits
publicly
Introduce
auto
-
approval
below
$
2,500
with
post
-
hoc
sampling
audit
6 / 7
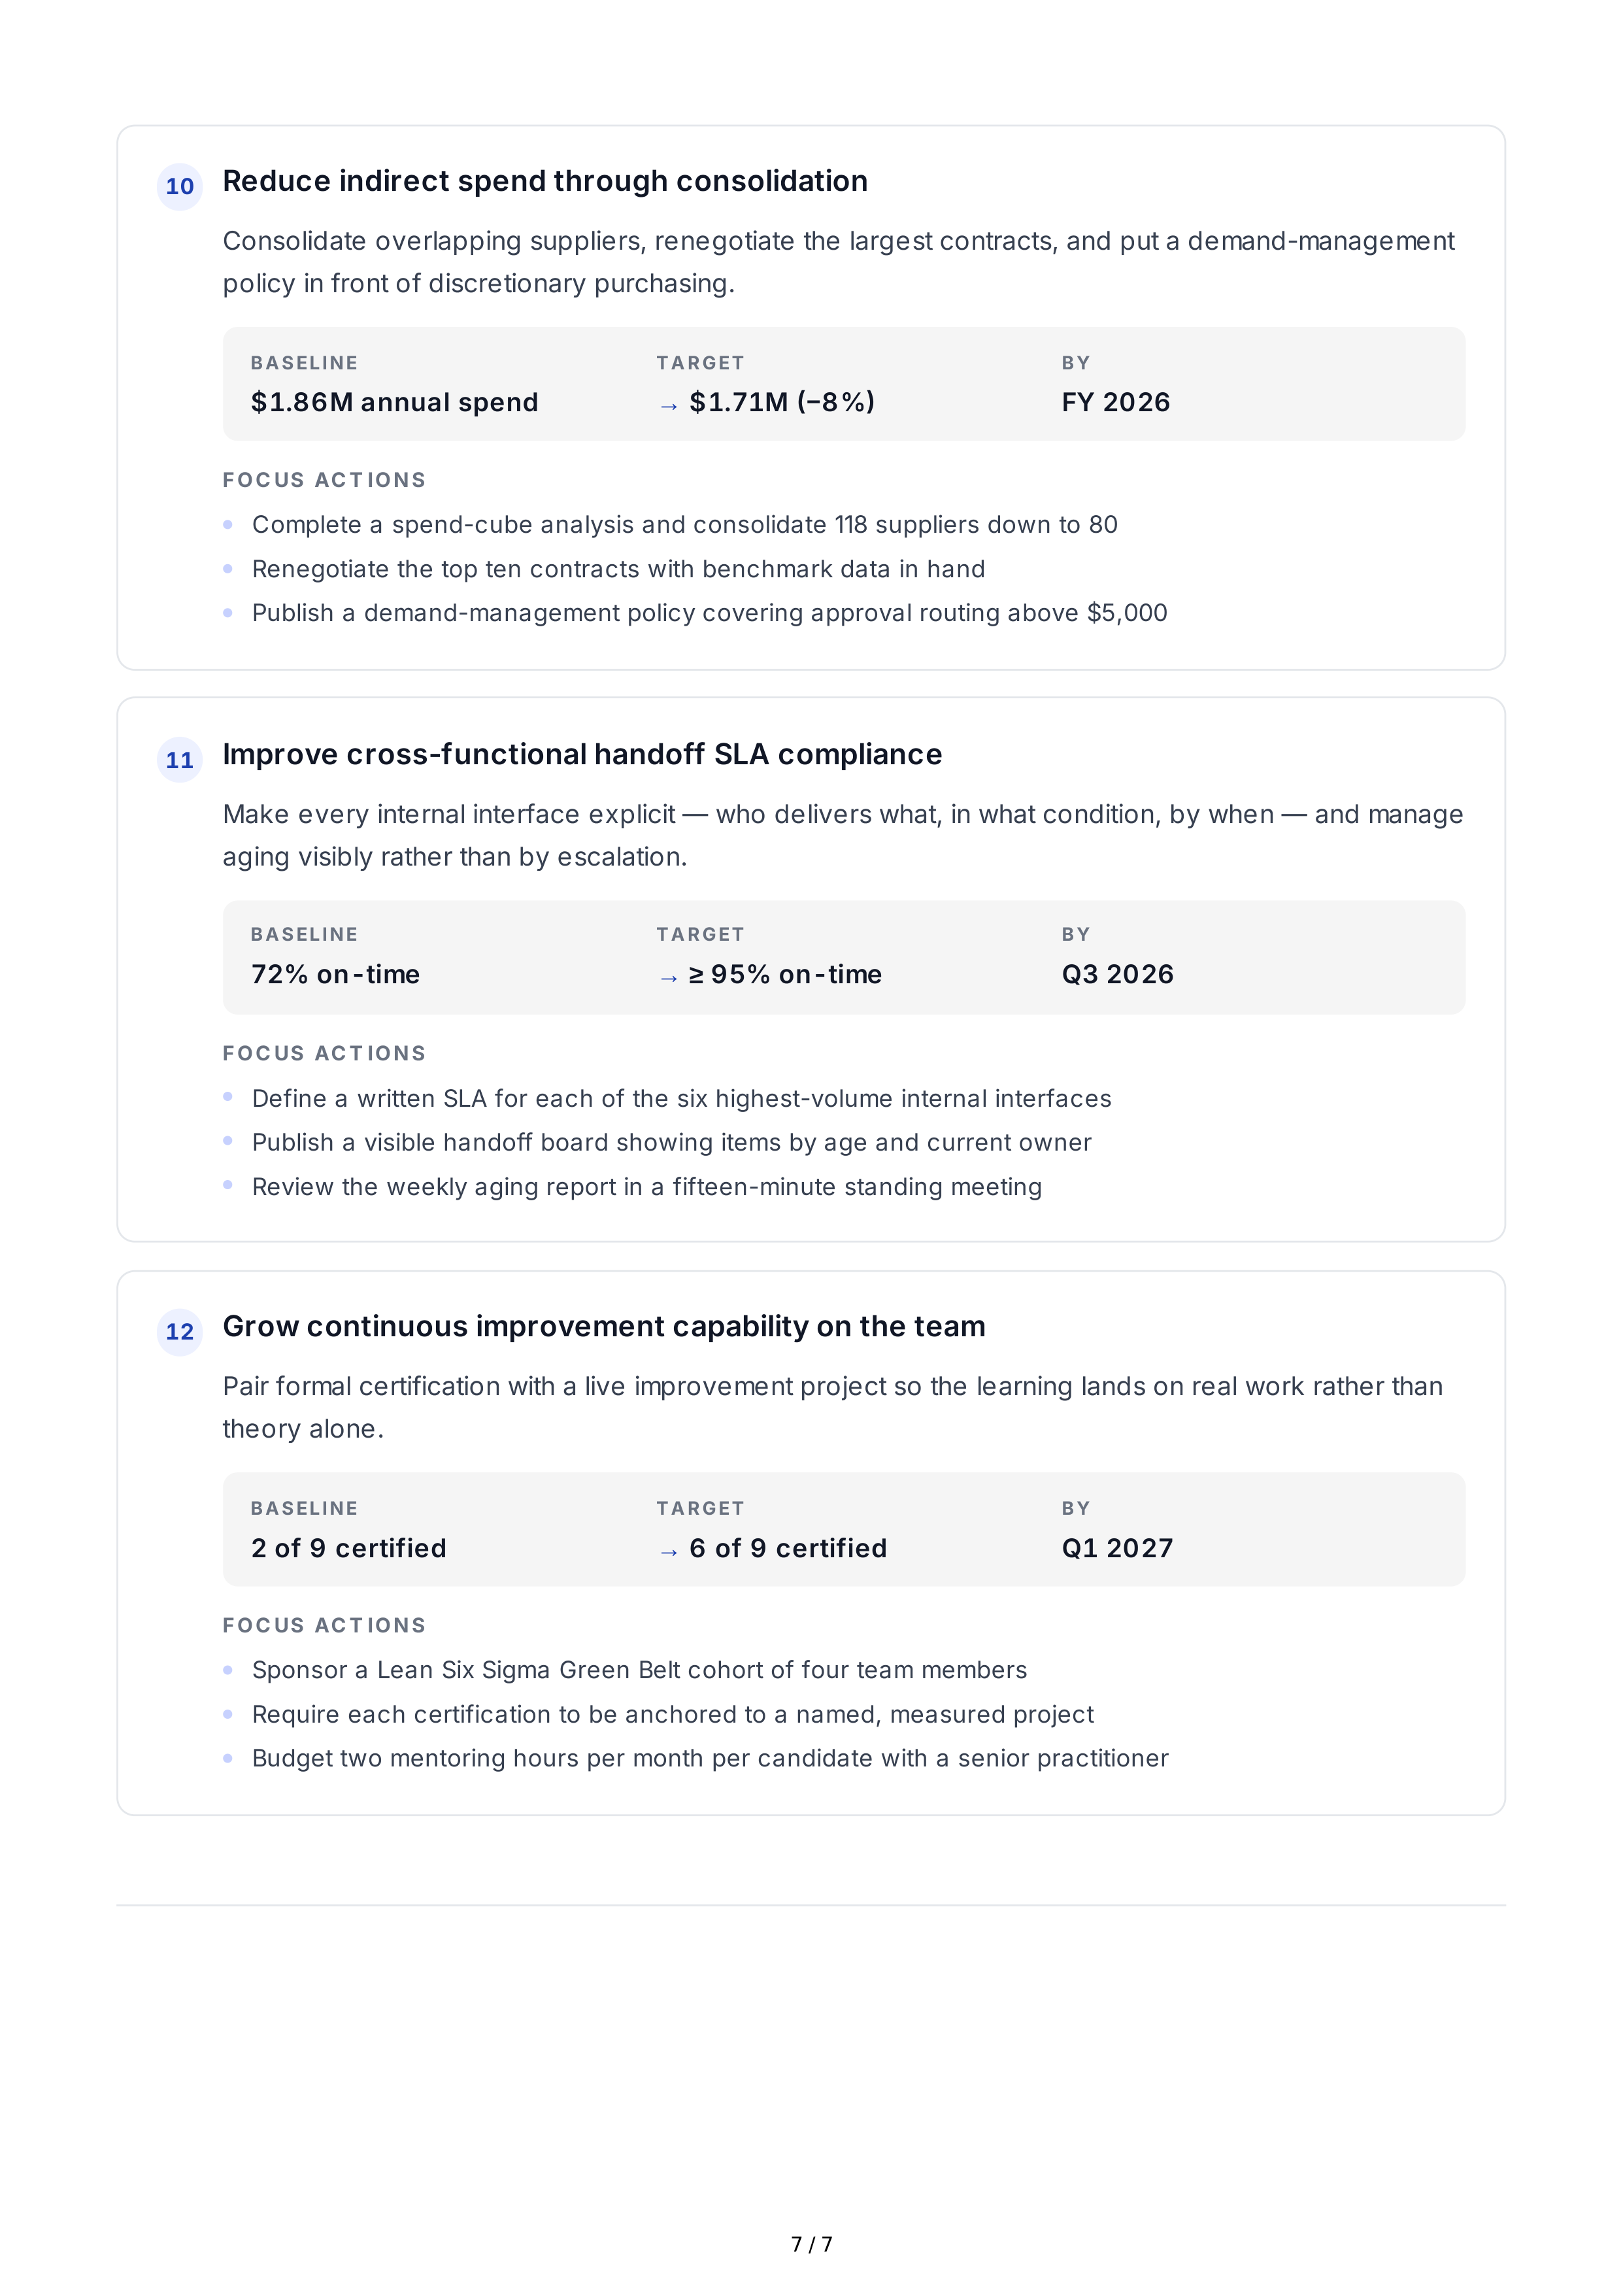
Reduce
indirect
spend
through
consolidation
Consolidate
overlapping
suppliers
,
renegotiate
the
largest
contracts
,
and
put
a
demand
-
management
policy
in
front
of
discretionary
purchasing
.
BA SELINE
$
1.86
M
annual
spend
TA RG ET
→
$
1.71
M
(−8%)
BY
FY
2026
FOC US
AC T IONS
Improve
cross
-
functional
handoff
SLA
compliance
Make
every
internal
interface
explicit
—
who
delivers
what
,
in
what
condition
,
by
when
—
and
manage
aging
visibly
rather
than
by
escalation
.
BA SELINE
72%
on
-
time
TA RG ET
→
≥
95%
on
-
time
BY
Q
3 2026
FOC US
AC T IONS
Grow
continuous
improvement
capability
on
the
team
Pair
formal
certification
with
a
live
improvement
project
so
the
learning
lands
on
real
work
rather
than
theory
alone
.
BA SELINE
2
of
9
certified
TA RG ET
→
6
of
9
certified
BY
Q
1 2027
FOC US
AC T IONS
10
Complete
a
spend
-
cube
analysis
and
consolidate
118
suppliers
down
to
80
Renegotiate
the
top
ten
contracts
with
benchmark
data
in
hand
Publish
a
demand
-
management
policy
covering
approval
routing
above
$
5,000
11
Define
a
written
SLA
for
each
of
the
six
highest
-
volume
internal
interfaces
Publish
a
visible
handoff
board
showing
items
by
age
and
current
owner
Review
the
weekly
aging
report
in
a
fifteen
-
minute
standing
meeting
12
Sponsor
a
Lean
Six
Sigma
Green
Belt
cohort
of
four
team
members
Require
each
certification
to
be
anchored
to
a
named
,
measured
project
Budget
two
mentoring
hours
per
month
per
candidate
with
a
senior
practitioner
7 / 7