Understanding data is crucial in today’s data-driven world, and a well-prepared statistics report can be the key to unlocking valuable insights. Whether you’re a student, a professional, or a curious individual, our comprehensive guide to creating detailed statistics reports will help you interpret and present data accurately and effectively. Dive into the essentials of statistical analysis and learn how to transform raw data into clear, actionable information with our straightforward tips and strategies.
What is Statistics Report?
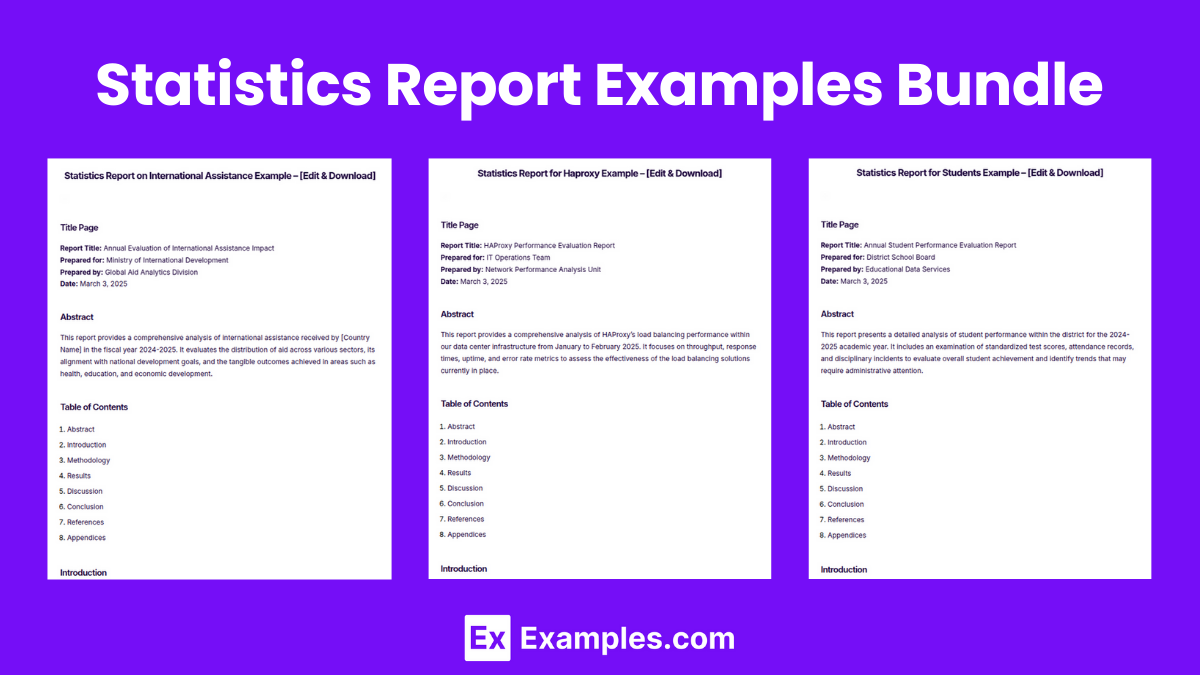
Statistics Report Examples Bundle
Statistics Report Format
Title Page
Report Title: Clear and descriptive title of the report.
Prepared for: Name of the organization or individual commissioning the report.
Prepared by: Your name or the name of the person who prepared the report.
Date: The date the report is submitted.
Abstract
A brief summary of the report, including the main objectives, methodology, and key findings.
Table of Contents
A list of the report’s sections and sub-sections, along with their page numbers.
Introduction
Background: Information about why the data was collected.
Objectives: What the report aims to achieve or find out.
Scope: The boundaries of the report—what it covers and what it doesn’t.
Methodology
Data Collection: How the data was collected, such as surveys or experiments.
Data Analysis: Methods used to analyze the data.
Results
Presentation of the data in an organized format like graphs, tables, and charts, accompanied by a textual description and analysis of the results.
Discussion
Interpretation of the results and comparison with previous studies or expected outcomes.
Conclusion
Summary of the findings and implications of the results, including potential for future research.
References
List of all sources cited in the report in the appropriate academic style.
Appendices
Additional material that is supplementary to the main text, such as raw data, detailed tables, or technical notes.
Statistics Report Example
Report Title: Customer Satisfaction Survey Report
Prepared for: Cafe Delight Management
Prepared by: Market Insights Team
Date: March 3, 2025
This report presents the findings from a customer satisfaction survey conducted by Cafe Delight in February 2025. The main goal was to assess the satisfaction levels among customers regarding service quality, menu variety, and overall ambiance.
Abstract
Introduction
Methodology
Results
Discussion
Conclusion
References
Appendices
Background: In response to declining sales, Cafe Delight initiated a customer satisfaction survey to gather feedback and implement necessary improvements.
Objectives: To determine key areas of customer satisfaction and dissatisfaction at Cafe Delight.
Scope: The survey focused on customers who visited the cafe during January and February 2025.
Data Collection: The survey was distributed online and completed by 150 customers.
Data Analysis: Responses were quantified on a scale of 1 to 5 and analyzed using statistical software to identify patterns and trends.
The survey results indicated that:
- 80% of the respondents rated the service quality as high (4 or 5).
- 60% were satisfied with the menu variety, although 25% desired more healthy options.
- 70% enjoyed the ambiance but suggested improvements in seating comfort.
Graphs and tables are included to illustrate these points more vividly.
The high ratings for service quality suggest that staff training programs are effective. The desire for more healthy menu options indicates a potential area for menu expansion. Comments on ambiance and seating comfort provide specific targets for physical improvements.
Overall, customers are satisfied with Cafe Delight’s service but indicate clear areas for improvement in menu diversity and seating comfort. Addressing these issues could enhance customer satisfaction and increase repeat business.
Customer Feedback Survey Tool User Guide
Recent Trends in Cafe Industry Customer Satisfaction Surveys
A1. Survey Questionnaire
A2. Data Analysis Scripts
A3. Detailed Response Data
Statistics Report Examples
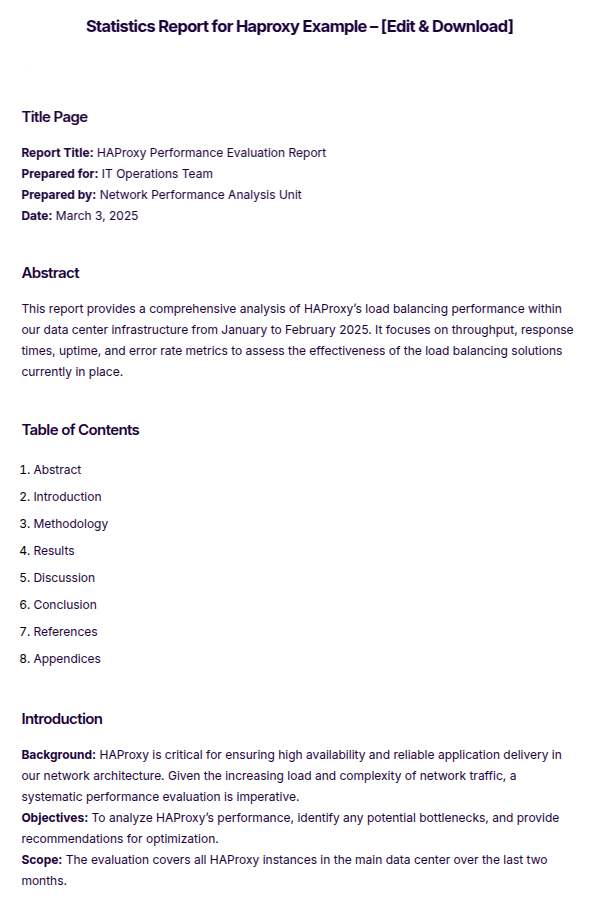
Statistics Report for Haproxy
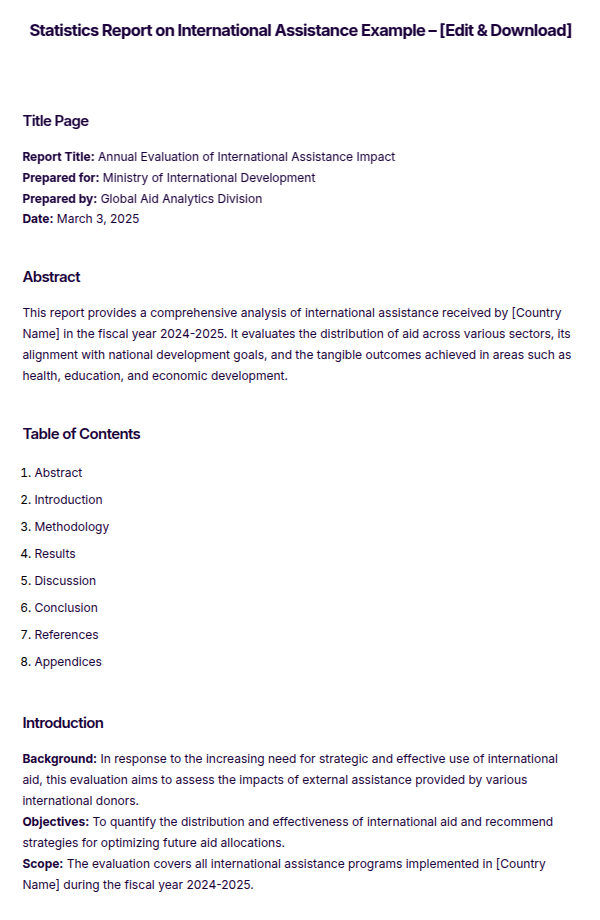
Statistics Report on International Assistance
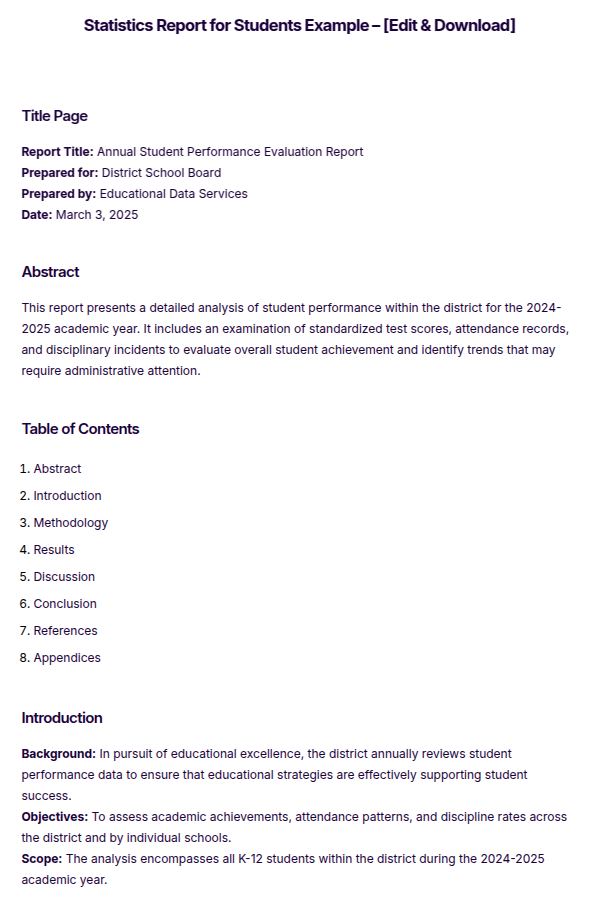
Statistics Report for Students
More Examples on Statistics Report
- Business Statistics Report
- Statistics Report on World Vitiviniculture
- Descriptive Statistics Report
- Inferential Statistics Report
- AP Statistics Report
- Natural Diabetes Statistics Report
- Monthly Statistics Report
- HSE Statistics Report
- Safety Statistics Report
Statistics Report Samples
Email Statistics Report
Population Statistics Report
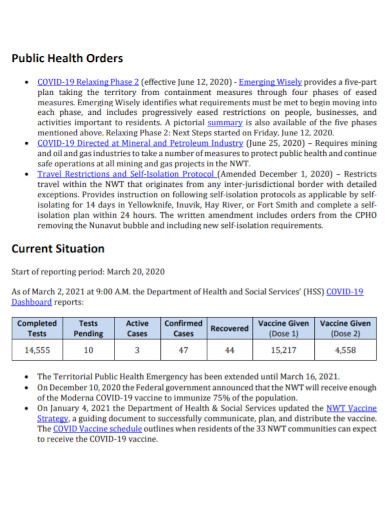
COVID Statistics Report
Statistics Report Template
Annual Statistics Report
How to Write a Statistics Report
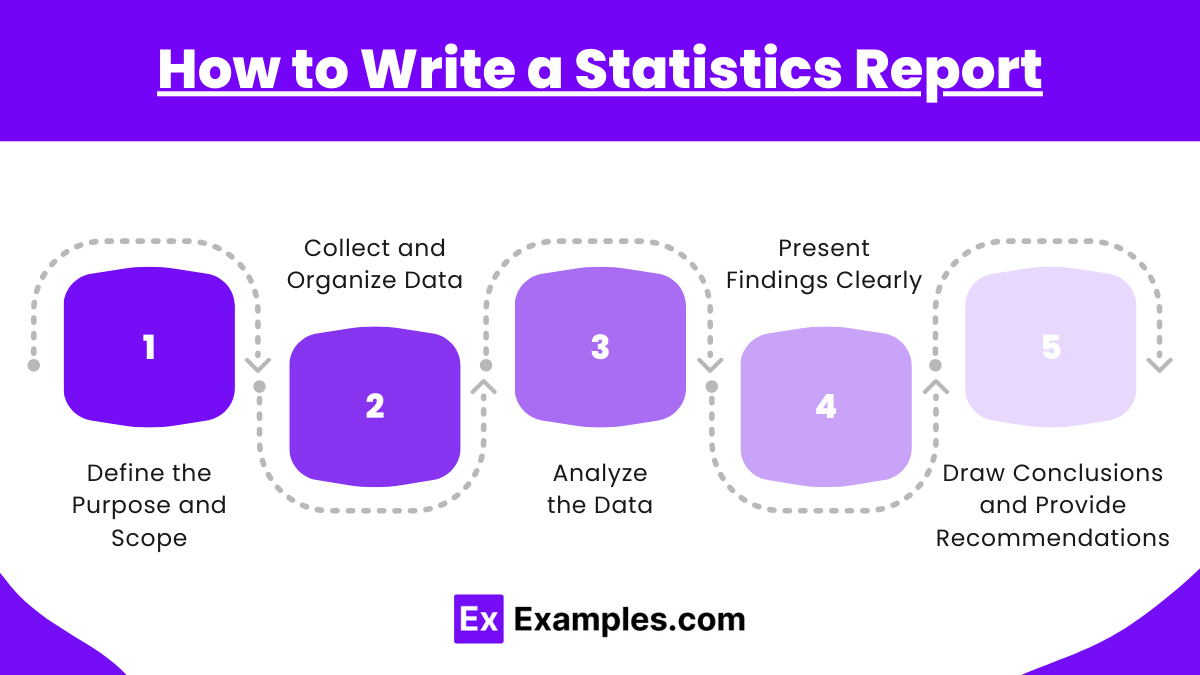
- Define the Purpose and Scope
Clearly state the objective of the report and specify what data will be analyzed. Outline the scope, including the time period and key variables.
- Collect and Organize Data
Gather relevant data from reliable sources. Structure the data in a clear format using tables, charts, and graphs for better undeCollect and Organize Datarstanding.
- Analyze the Data
Use descriptive and inferential statistics to interpret the data. Calculate key metrics such as mean, median, standard deviation, and correlations where applicable.
- Present Findings Clearly
Summarize key results using well-structured sections like introduction, methodology, results, and discussion. Visual aids like charts and tables enhance readability
- Draw Conclusions and Provide Recommendations
Based on the analysis, conclude the findings and suggest actionable steps or improvements. Ensure the report is clear, concise, and free from unnecessary complexity.
Tips for Writing Statistics Report
- Define a Clear Objective – Clearly state the purpose and focus of your statistics report before collecting and analyzing data.
- Use Reliable Data Sources – Ensure the data is accurate, up-to-date, and collected from credible sources for meaningful analysis.
- Organize Data Effectively – Present data in a structured format using tables, graphs, and charts to improve readability.
- Apply Statistical Methods – Use appropriate statistical techniques such as mean, median, correlation, and regression for data interpretation.
- Keep it Clear and Concise – Write in a simple and logical manner, avoiding unnecessary complexity in explanations.
- Provide Visual Representations – Use charts, graphs, and tables to make complex data easy to understand.
- Interpret Results Accurately – Explain the findings with proper context, highlighting trends and insights derived from the data.
- Include a Conclusion and Recommendations – Summarize key insights and suggest actionable steps based on the analysis.
- Ensure Proper Formatting – Follow a structured format with sections like introduction, methodology, results, discussion, and conclusion.
- Proofread and Revise – Check for errors, inconsistencies, and clarity before finalizing the report.
FAQs
The primary purpose of a statistics report is to inform the readers of the data that has been gathered based on a research study. This comes with an interpretation of the findings to make it easier to understand to the readers.
Summarizing statistical outcomes require visual graphic organizers like tables, charts, graphs and more. This is used to easily compare the results.
Statistics report often come with several pages depending on how long the content is.
They help in understanding data trends, making informed decisions, identifying patterns, and providing evidence-based insights for businesses, research, healthcare, and education.
Common tools include Excel, SPSS, R, Python, Tableau, and Google Sheets for data analysis, visualization, and statistical calculations.