
Are you about to give a business presentation? A monthly management report? Maybe it is either one of these choices. Or it can be both. Whatever it is, you need to learn about generating visual reports. One of the best ways to track the performances of businesses, nonprofit organizations, schools, employees, and marketing growth is through constructing and analyzing visual diagrams. That said, learn how to generate a data report by checking the templates and reading this article.
[bb_toc content=”][/bb_toc]
10+ Data Report Examples
1. Data Analysis Report Template
2. Business Data Analysis Report Template

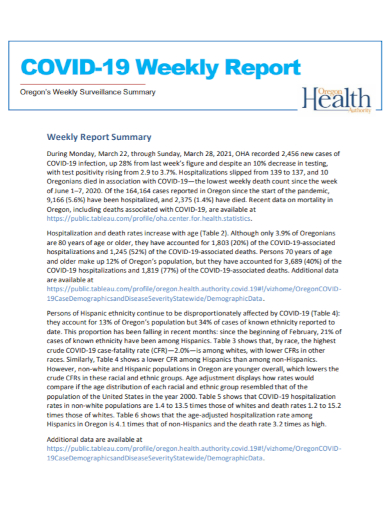
3. Covid 19 Weekly Data Report
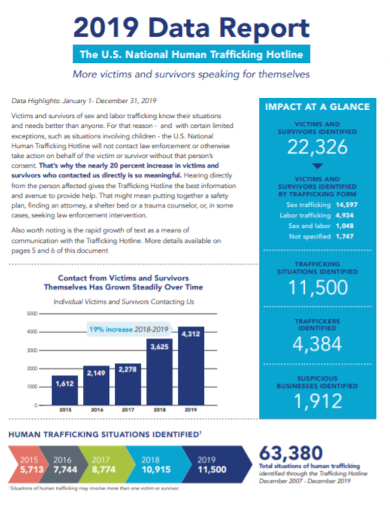
3. Data Project Report
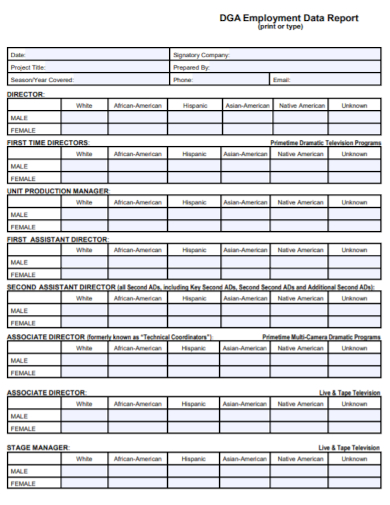
4. Employment Data Report
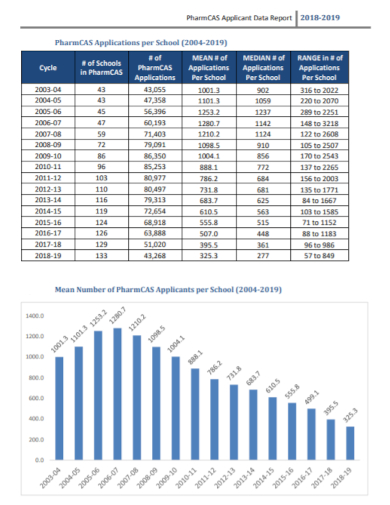
5. Pharma Applicant Data Report
6. Beneficiary Data Report

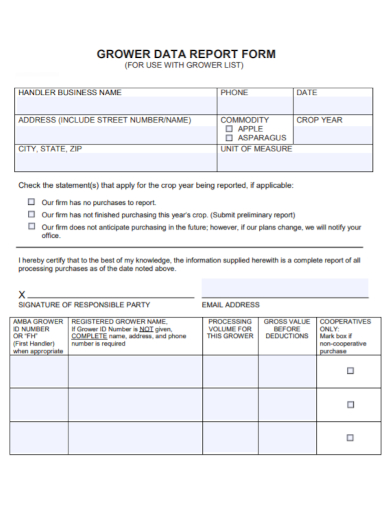
7. Data Report Form
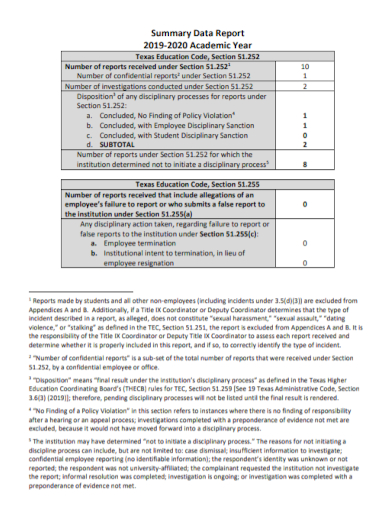
8. Summary Data Report
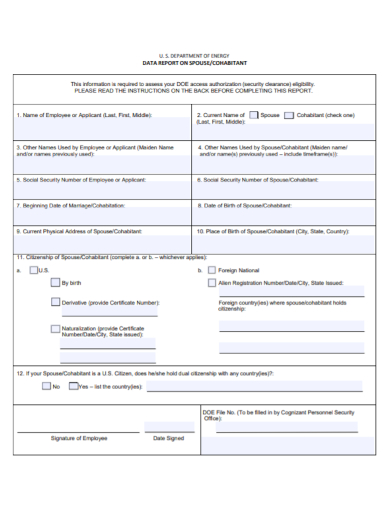
9. Spouse Data Report
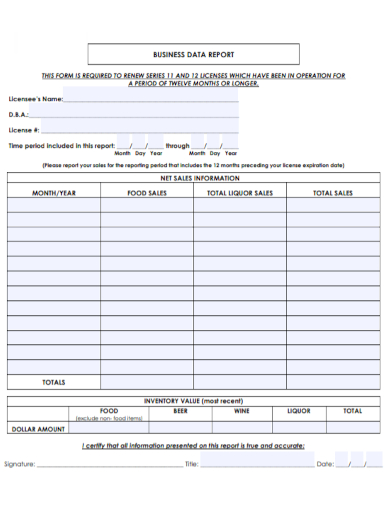
10. Business Data Report
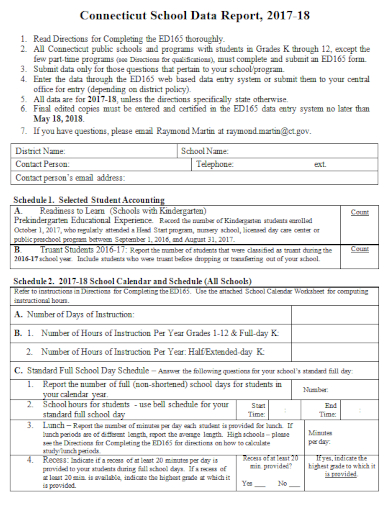
11. School Data Report Template
What Is a Data Report?
A data report is a visual chart or diagram that converts raw data more comprehensively and creatively. In presenting numerical data and figures, it uses tables, flowcharts, charts, and graphs. Various organizations and individuals make use of this graphic report in their project tracking and goal tracking. Most businesses and schools construct a data report to measure their growth.
How to Generate an Instructive Data Report
Data reports are necessary tools in creating data analysis plans and dashboard reports. A faulty data report can result in inaccurate evaluation and decisions. This error could ultimately result in things being out of order. It might seem far-fetched, but you can never underestimate a snowball effect. That said, in generating your reports, you should follow a careful process.
1. Determine Your Report Type
Before jumping right into generating your document, you should first step back and determine the report type you are aiming to produce. Each type of report follows various guidelines, rules, and formatting. Some report types need a more written document type of report, while others require you to create comparative charts and tables.
2. Run an Audience Analysis
The next step is to think about the people who will view your report. Gaining an idea about your audience will serve as a guideline on the approach you can take in presenting your data. That said, another step in the process is to conduct an audience analysis. After knowing your audience, you will also discover what fonts and colors to use.
3. Set Your Objectives
Setting your objectives beforehand is essential in presenting your data. Take into account the purpose of your activity. It could be for a situation analysis or growth tracking. No matter your objectives, you should align your data to the result of your SMART goal setting accordingly. The next thing to consider is what your audience demands to know about your report.
4. Choose a Format
After knowing the essential information from the previous steps, start thinking about the format to incorporate in your report. If you are making a memo report or a proposal report, presenting graphic data is inappropriate. This type of report is more of a written document. On the other hand, if you are constructing a data report for financial analysis and market analysis, creative infographics would come in handy.
FAQs
Why is producing data reports necessary?
Aside from being crucial for tracking growth and performance, data reports have another essential function. It influences the decision-making of an organization. It will help the figureheads determine the next business steps to take and dictate their marketing strategies and business plans. Revisions and adjustments heavily depend on the information of these reports.
What are the differences between analysis and reporting?
These two terms are relevant to each other. Despite that, there are differences between them. Reporting focuses on presenting figures and data on tables and charts. On the other hand, analysis takes place when you covert the reports into insights. Analyzing something also involves brainstorming and answering a series of questions based on the data.
What are the various types of reports?
There is a wide range of reports in various fields and industries. The kinds of data reports include analytical reports, informational reports, recommendation reports, feasibility reports, and periodic reports. Each category has its advantages and disadvantages. These different types have varying functions, and you can also tailor them specifically for your purpose.
As the world keeps turning, as the time keeps ticking, staying stagnant is a big no-no. That said, individuals and organizations alike need to outgrow their current statuses. One way to check your progress is through analyzing factors that can influence you. Reports keep people up to date and help them keep tabs on what is going on in a particular subject. That said, to communicate and convey essential information, you should construct detailed data reports.